How AI-powered log parsing is changing the way DevOps teams configure log monitoring
 When something breaks in production, your logs are the first place you look. But here's the problem most DevOps teams don't talk about: Before those logs can tell you anything useful, someone has to configure how they're parsed. And for every new service you add, this work starts from scratch.
If your team runs microservices, ships new services regularly, or monitors apps that don't follow a standard log format, you already know what this overhead feels like.
OpManager Nexus supports more than 100 log types out of the box. If you're running Internet Information Services (IIS), Apache, MySQL, Kubernetes, or any other widely used tool, the parsing pattern is already there. You add the log type, associate it with a profile, and you're done.
However, outside of these supported log types, such as with an application your team built, a microservice with a logging format your team defined, or any tool that isn't common enough to have a prebuilt pattern—is where custom log types come in and the real configuration work begins.
The part of log monitoring that nobody enjoys
Custom log sources don't come with instructions. Each one has its own structure—an authentication service looks nothing like a payment processor, and an internally built data pipeline logs differently from anything else in your stack. When bringing in a new source into OpManager Nexus, you'll need a parsing pattern that tells the system exactly how to read those logs—which part is the timestamp, the log level, and the message.
Writing that pattern manually means staring at raw log lines like this:
| Log type | Logs |
| Python | 2023-01-10 07:35:05,456 __main__ - ERROR:[Errno 2] No such file or directory: 'sample.txt<NewLine>Traceback (most recent call last):<NewLine>File "/App/config/loader.py" |
| Azure Active Directory | {"time": "2022-02-20T05:59:35.2187858Z","location": "IN","resourceId": "/tenants/a3","operationName": "Remove service principal credentials","operationVersion": "1.0","category": "AuditLogs","tenantId": "a3","resultSignature": "None","durationMs": 0,"callerIpAddress": "20.186.26.40","correlationId": "c766","identity": "Managed Service Identity","Level": 4,"properties": {"id": "Directory","category": "ApplicationManagement","correlationId": "c7668","result": "success","resultReason": "","activityDisplayName": "Remove service principal credentials","activityDateTime": "2022-02-20T05:59:35.2187858+00:00","loggedByService": "Core Directory","operationType": "Update","riskDetail": "","userAgent": null,"userPrincipalName": "admin","userDisplayName": "Admin","status": {"errorCode": "1234"},"location": {"city": "xxxxx","state": "yyyy","countryOrRegion": "IN","geoCoordinates": {"latitude": 12,"longitude": 80}},"initiatedBy": {"app": {"appId": null,"displayName": "Managed Service Identity","servicePrincipalId": "4d70","servicePrincipalName": null},"user": {"ipAddress": "0.1.10.3","userPrincipalName": "test"}},"targetResources": [{"id": "a86a","displayName": "mangevms","type": "ServicePrincipal","modifiedProperties": [{"key": "User-Agent","value": "Microsoft Azure Graph Client Library"},{"key": "AppId","value": "ea55"}]}} |
Followed by translating what you see into the correct pattern syntax. That means decoding the field order, accounting for date and time formats, figuring out whether the log level always appears first, and handling the variations that show up across different entries. Then you write the pattern, test it, find what breaks, fix it, and test again.
Some teams have started pasting log samples into general-purpose AI tools to speed this process up. It helps but also introduces a different kind of friction. The pattern you get back may be in regex, grok, or plain English—none of which being the syntax the tool uses. You still have to translate the output, go back into OpManager Nexus, paste it in, and test it manually. If something's off, you're now switching between two tools to debug one configuration. And nothing about that process is saved or repeatable the next time you add a new service.
Even with a straightforward log format, the manual or AI-assisted route still takes 30–60 minutes of pattern writing per source. Multiply that by five new services in a sprint and you're looking at half a day of configuration work before you've monitored anything at all. For teams managing a high-volume log ingestion pipeline across dozens of services, that overhead doesn't just slow setup down—it delays the monitoring that every other team depends on.
How OpManager Nexus solves this with Zia Assistant
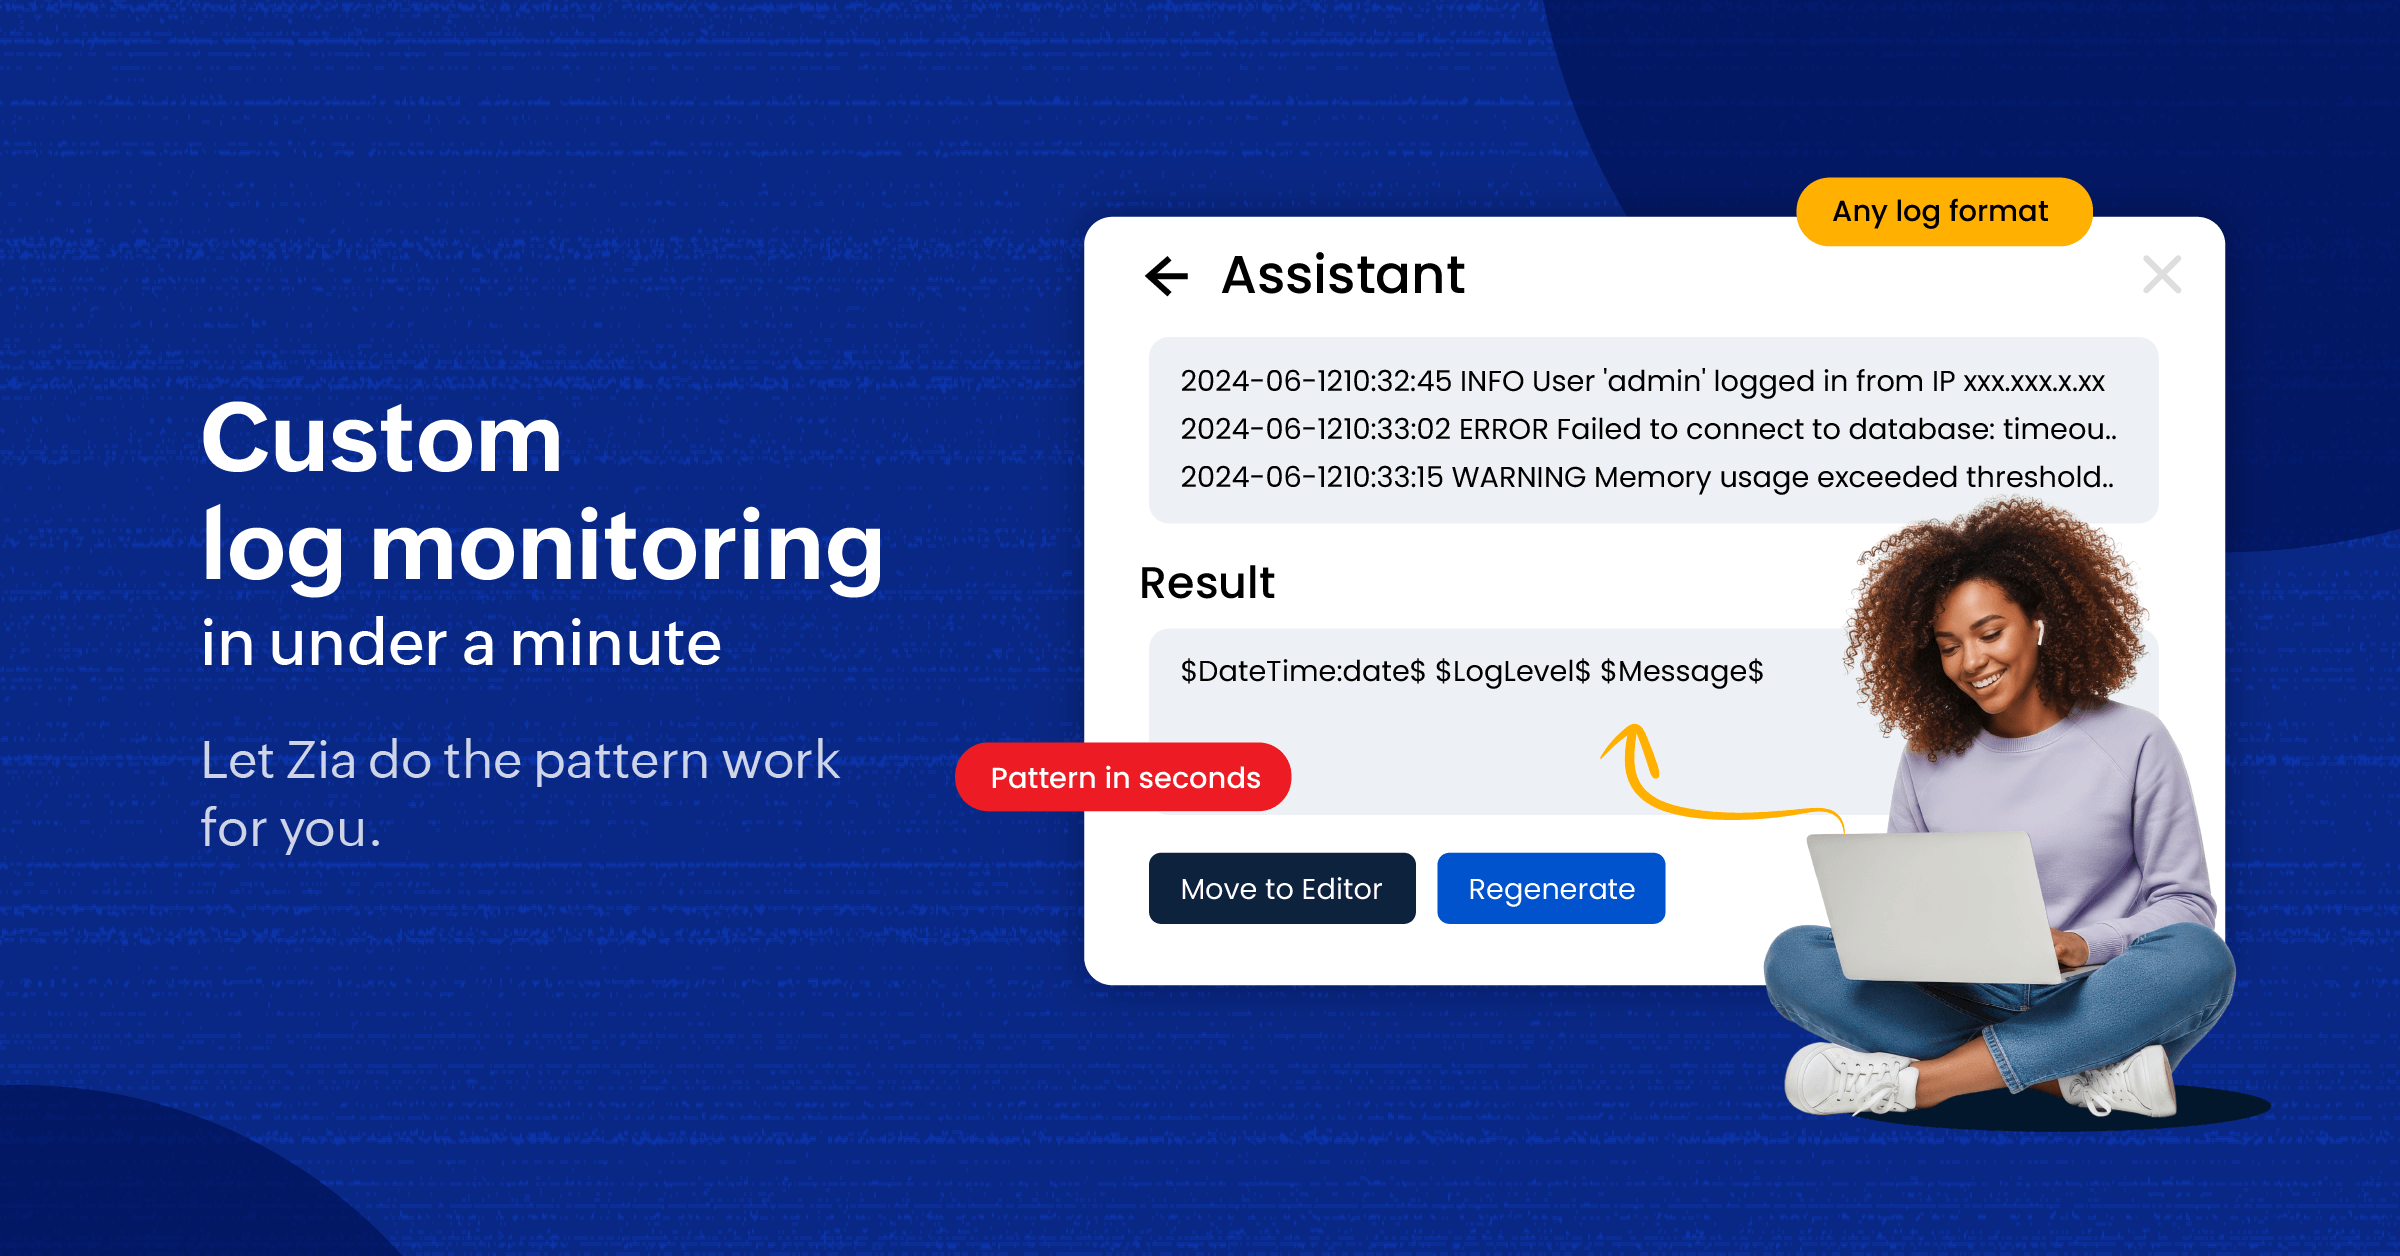
OpManager Nexus has a built-in AI assistant called Zia that takes care of this overhead in a matter of seconds. You paste in your log samples, Zia figures out the pattern, and you move on. The AI assistant for ManageEngine, Zia is natively integrated into the product, so there's no extra tool to open or output to copy across.
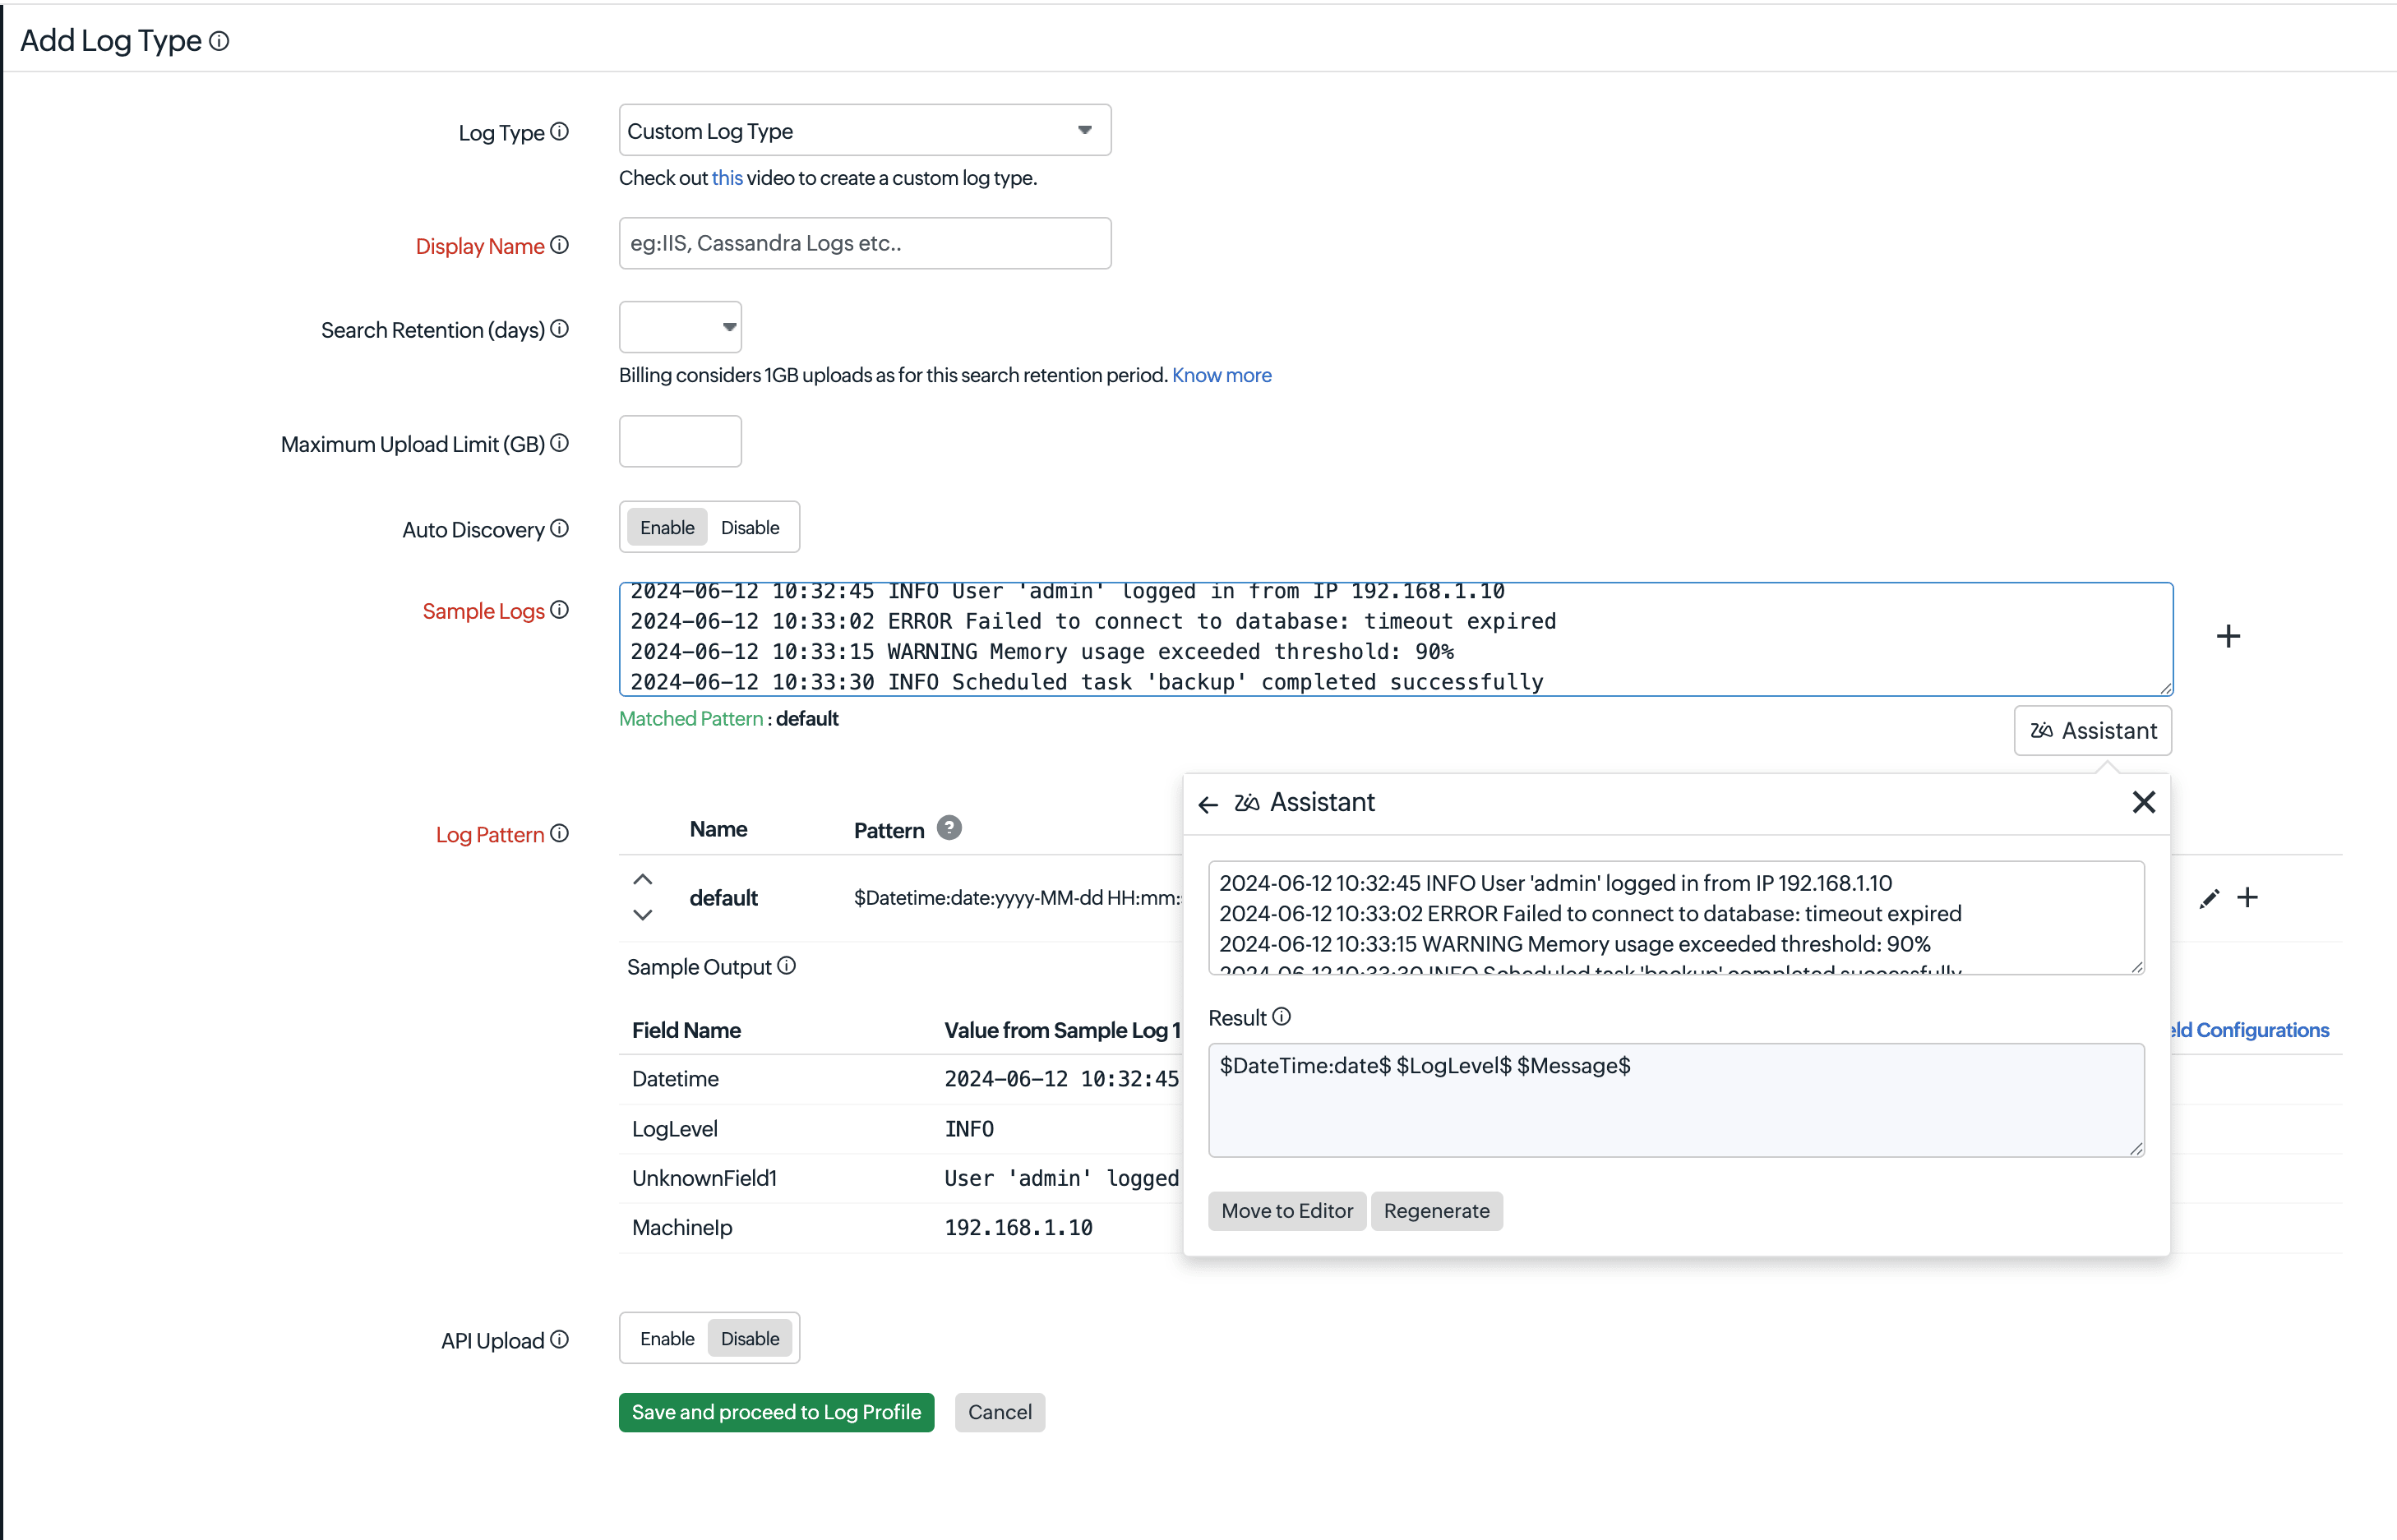
Paste a few representative log lines into the Sample Logs field and click Zia Assistant. Zia then performs structured log parsing behind the scenes—identifying field boundaries, inferring types, and handling log field extraction automatically—and returns a suggested, ready-to-use pattern.
Alongside the pattern, Zia shows you a live sample output with actual field values extracted from your logs—DateTime, LogLevel, MachineIp, and Message—so you can confirm it's correct before saving anything. If the result needs adjustment, click Regenerate to produce different sample lines. When you're satisfied, click Move to Editor and the pattern drops straight into the configuration.
No context switching, no syntax translation, and no separate testing round.
Bring every new service into monitoring from day one
For teams working toward full log observability across their stack, every hour spent on manual pattern configuration is an hour not spent on the searches, dashboards, and alerts that actually matter. OpManager Nexus with Zia Assistant removes that bottleneck so you can bring new sources online quickly and trust that the data is parsed correctly from day one.
If your team is still spending time manually writing parsing patterns for every new log source, Zia Assistant is worth a closer look.
Set up your first custom log type with Zia Assistant.
FAQs
What is log parsing?
Log parsing reads raw log data and breaks it into structured, queryable fields, such as timestamp, log level, IP address, and message. Without it, logs are unstructured strings that monitoring tools can't search or alert on.
What is a log parsing pattern?
A log parsing pattern is a set of rules that tells a log management system how to read each field in a log entry, such as field order, timestamp format, delimiters, and message boundaries. Different log sources need different patterns because there's no universal log format.
Why is custom log configuration challenging for DevOps teams?
Internally built services and non-standard tools produce logs in formats unique to that application, so no universal pattern exists. Writing one manually means learning the tool's syntax, decoding the log structure, and iterating through test-and-fix cycles—creating overhead that compounds fast across a microservices environment.
What is Zia Assistant in OpManager Nexus Log Management?
Zia Assistant is an AI assistant for ManageEngine that's built into OpManager Nexus Log Management. It reads sample log lines you paste in, identifies field boundaries and data types, and returns a ready-to-use parsing pattern in seconds using the product's exact syntax.
How long does it take to set up a custom log type using Zia Assistant?
For most log sources, the full process of pasting samples, reviewing output, and moving the pattern to the editor takes under a minute. Manual configuration for the same source typically takes 30–60 minutes.