Microsoft outage: 6 lessons for your IT team
Imagine this:
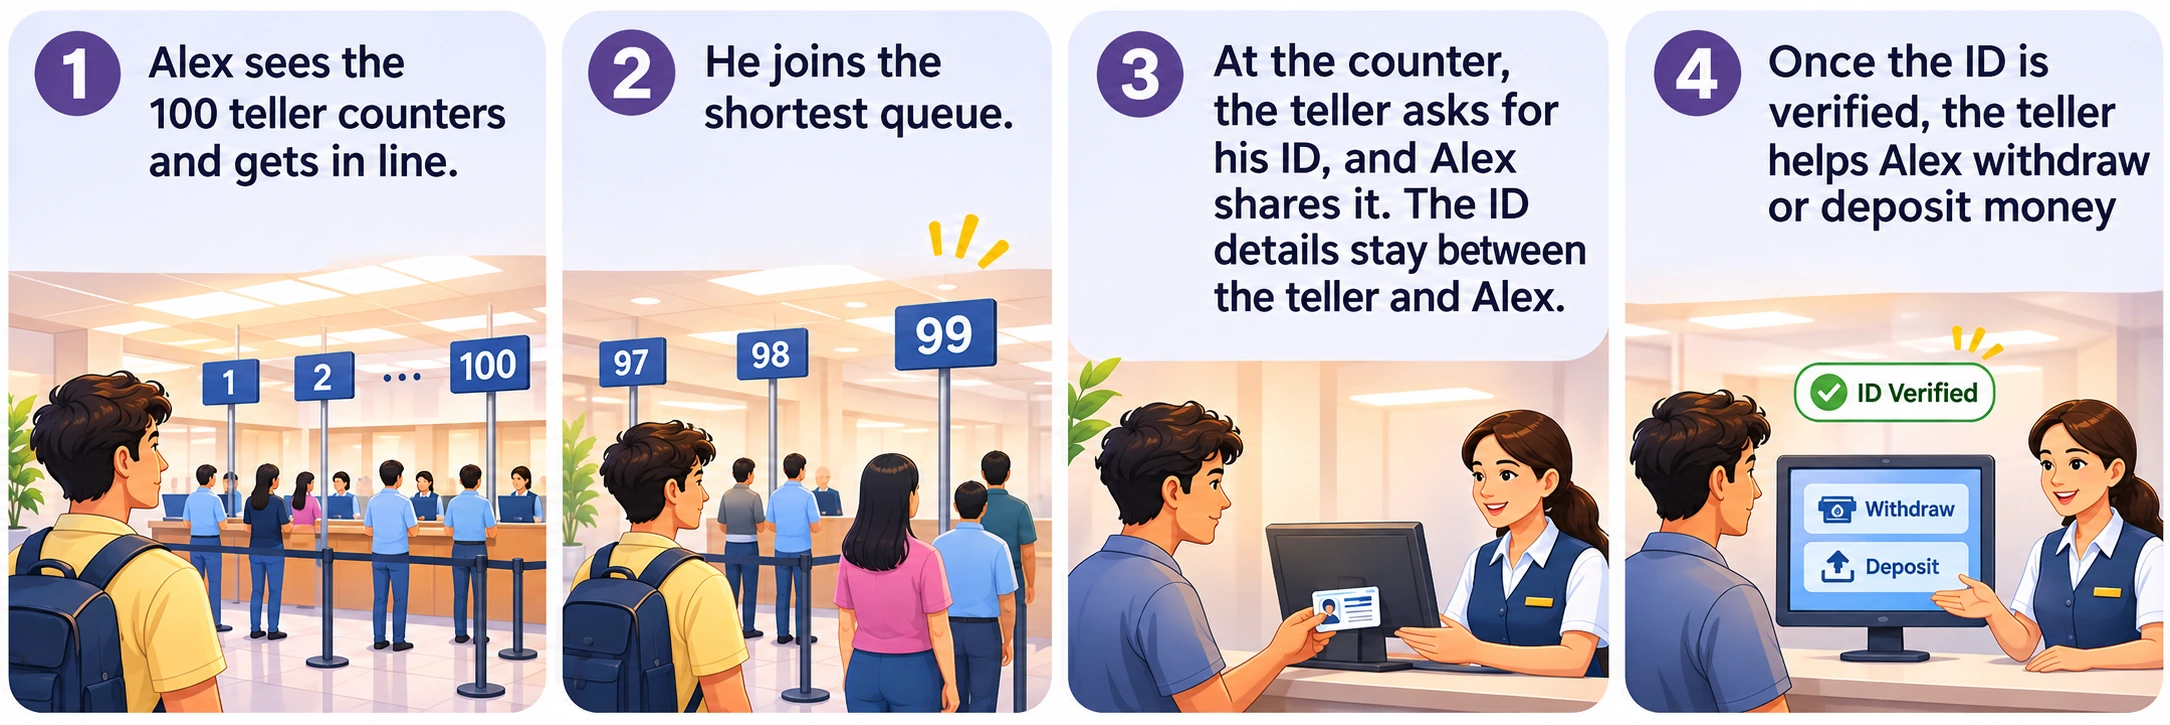
There is only one bank for an entire city. Everyone in the city visits the bank to handle their finances.
To handle such a large crowd, the bank has:
- 100 tellers who help people run their finances.
- 50 more tellers on standby, just in case the crowd is larger than normal, or if some tellers go on a break.
What this bank looks like inside Microsoft
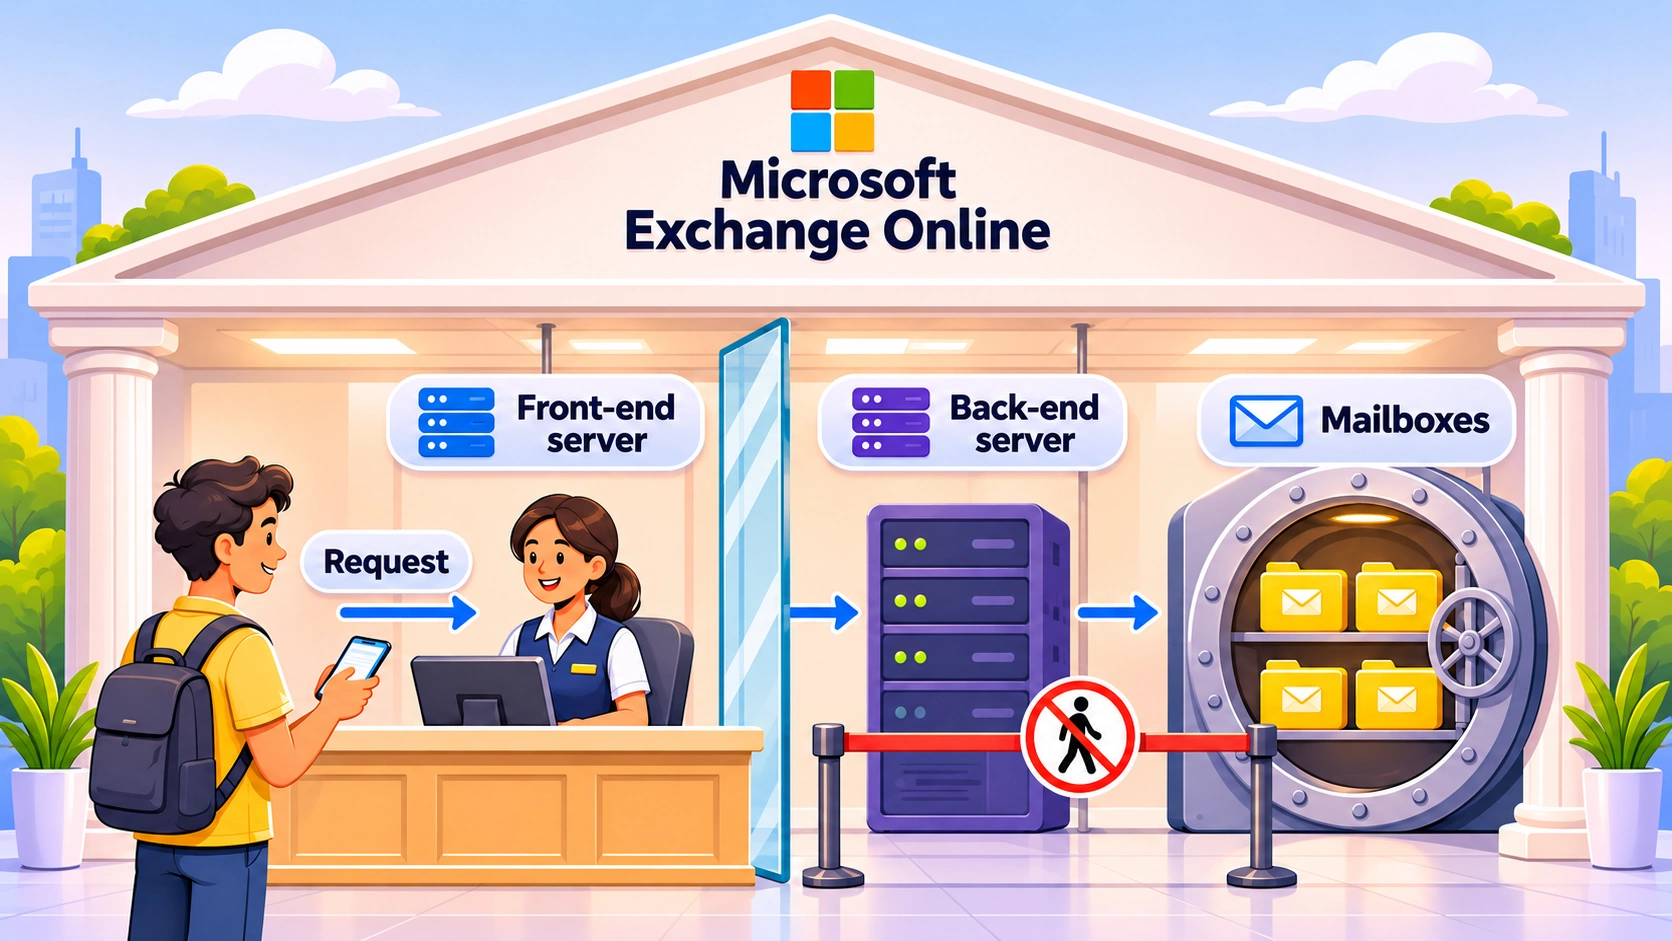
Microsoft Exchange Online is the cloud email and calendar system behind Outlook. Every connection to it first passes through a shared set of front-end servers that Microsoft calls the networking gateway. The same gateway sits in front of many other Microsoft 365 services.
- The networking gateway (front-end servers): The teller counters. Every request to open a mailbox arrives there first.
- Exchange Online’s back-end servers: Where the mailboxes live. The front end accepts the connection and passes the request to the back end.
- Mailboxes: Think of them as the vault. Without a teller, nobody reaches the vault, even though the money inside is safe.
- Standby tellers: The spare capacity Microsoft keeps, so that the gateway can lose some servers and still serve everyone.
How the teller ID check works in Microsoft’s servers
Before a teller helps Alex, the two of them go through an ID check. Something similar happens every time an app such as Outlook connects to Microsoft. The app and the server first negotiate a connection, and only then does any mail move.
This step matters because it is where the outage showed up. Microsoft says connection negotiation was the main area behind the access failures, with competing processes preventing connections from being handled. It has not published more technical detail than that yet.
Why did Microsoft apps become unreachable?
Going back to our bank story.
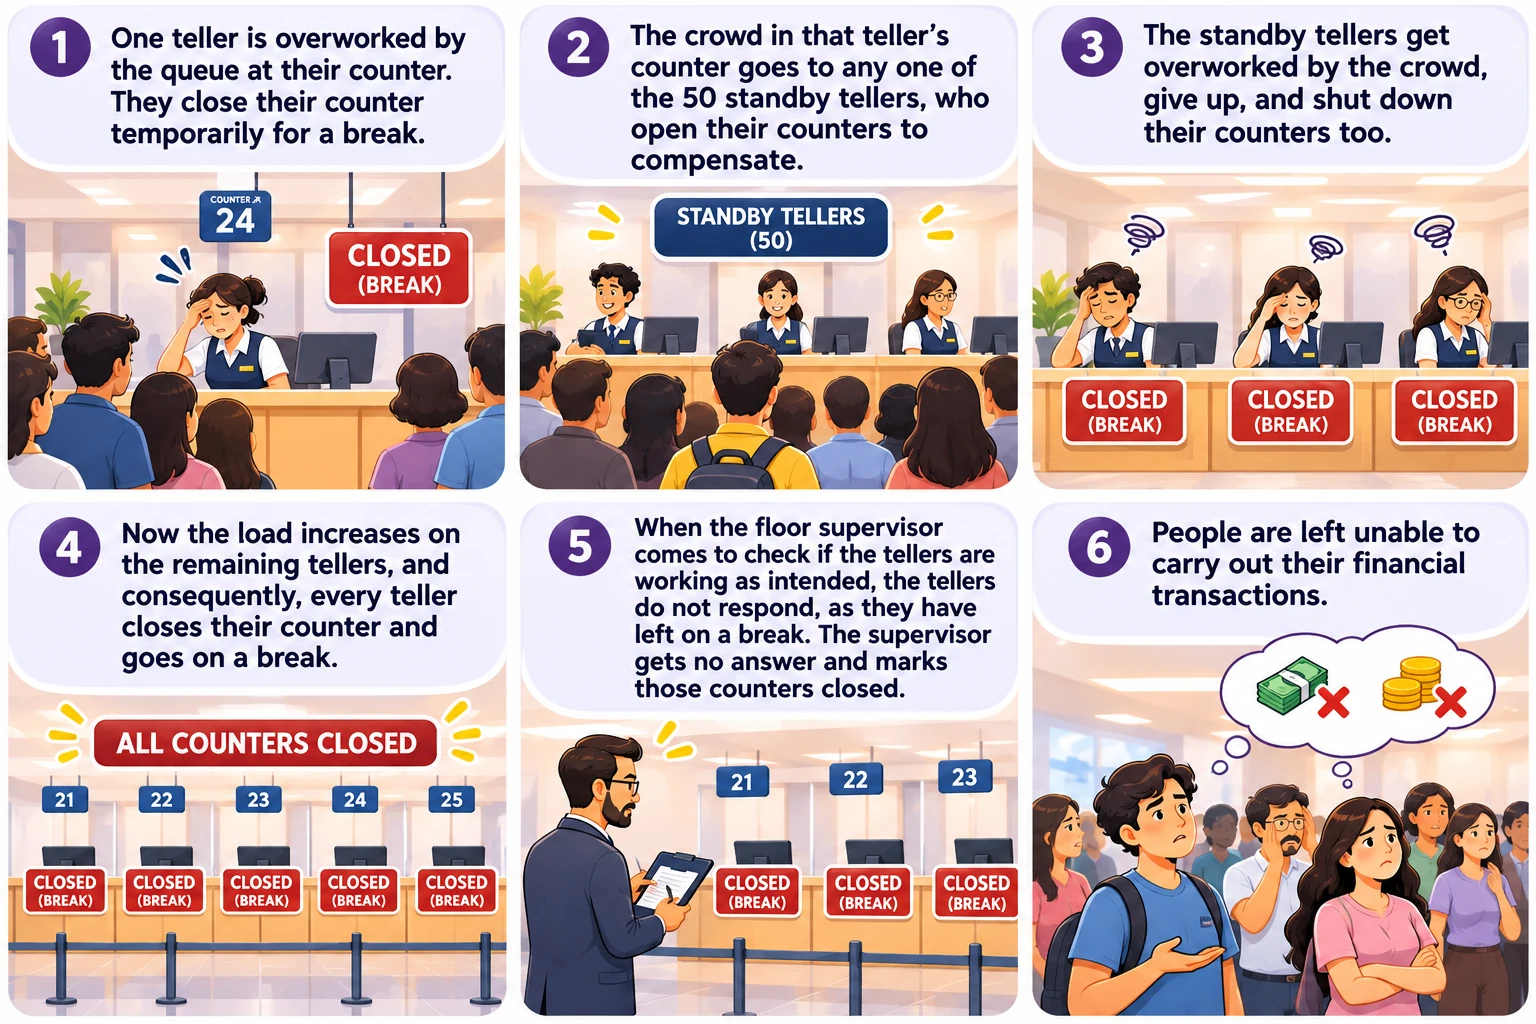
Microsoft’s preliminary post-incident report, published on November 15, explains why the first tellers got overworked. Three things lined up.
- A hidden bug: In July, Microsoft deployed a Windows fix built only for its gateway servers. It ran for more than three months without trouble. Under certain load, though, it caused lock contention (tasks stuck waiting on each other) inside an internal Windows process, and this exhausted the server’s CPU and memory. Lab load tests missed it because they ran on weaker hardware with fewer cores, and the bug is worse on newer, high-core machines.
- Extra load: About 15 hours before the outage, a routine, automated failover moved Teams traffic onto the same gateway that Exchange Online uses. In bank terms, the customers of another branch were sent to this one.
- Less capacity: Nearly 14% of the gateway’s servers were already out of service because of an unrelated issue from the previous day. Think of it as some of the tellers being off the floor before the rush began. On its own, this had no impact.
In Microsoft’s case, the supervisor is the automated health checks and traffic management: systems that probe each server and send users away from any server that fails to answer. This is what normally keeps the service running. This time, the redirected users overloaded the next server, and the one after that.
This is exactly what happened during the Microsoft outage
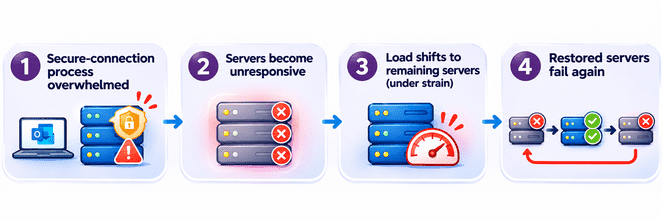
All times are in UTC, as given in Microsoft’s preliminary report.
- The early signs: On Thursday, November 12, at 1:07am UTC, the automated failover moved Teams traffic onto the gateway. Through the day, load rose gradually and isolated server failures began in some regions. Automated mitigation handled them.
- Servers stall: During peak business hours in the United States, requests built up on the gateway servers until they stopped responding. Microsoft logged incident EX1550543 at 4:20pm UTC.
- The cascade: Traffic management moved users from the stalled servers to healthy ones, and those stalled, too. Microsoft found that overall traffic had not grown. The same load was landing on fewer servers. In under two hours, more than 80% of the servers were unresponsive.
- The spread: The partitions that should keep a failure inside one region did not hold, because of a separate issue that Microsoft has not yet explained. This is how the impact went global.
- Restored servers fail again: Servers brought back online were overwhelmed by waiting traffic and became unresponsive again. Microsoft’s rollback tools and feature flags could not quickly revert a change that was months old. This is why recovery took so long.
- The fix: From 7:20am on Friday, November 13, Microsoft rolled out an update that returned Windows to its earlier, known good code path. It took groups of servers out of service, applied the update, restarted them, and returned them to service.
- The end: Microsoft declared the incident over at 4:10pm on Friday, about 24 hours after it began.
Exchange, Copilot, Teams, SharePoint, OneDrive, Defender, Purview, and other Microsoft 365 services were affected, mostly in the features that rely on Exchange Online.
How to keep an outage like this out of your own IT
Microsoft’s preliminary report names the cause: a hidden bug in a months-old Windows fix was triggered when a routine failover added load while part of the gateway’s capacity was already out of service.
Microsoft has promised a final report by November 20, with its longer-term repair items. Some details may change when it arrives.
Here is the chain of events, and what you should do at each link of the chain to minimize the impact of such an outage in your environment.
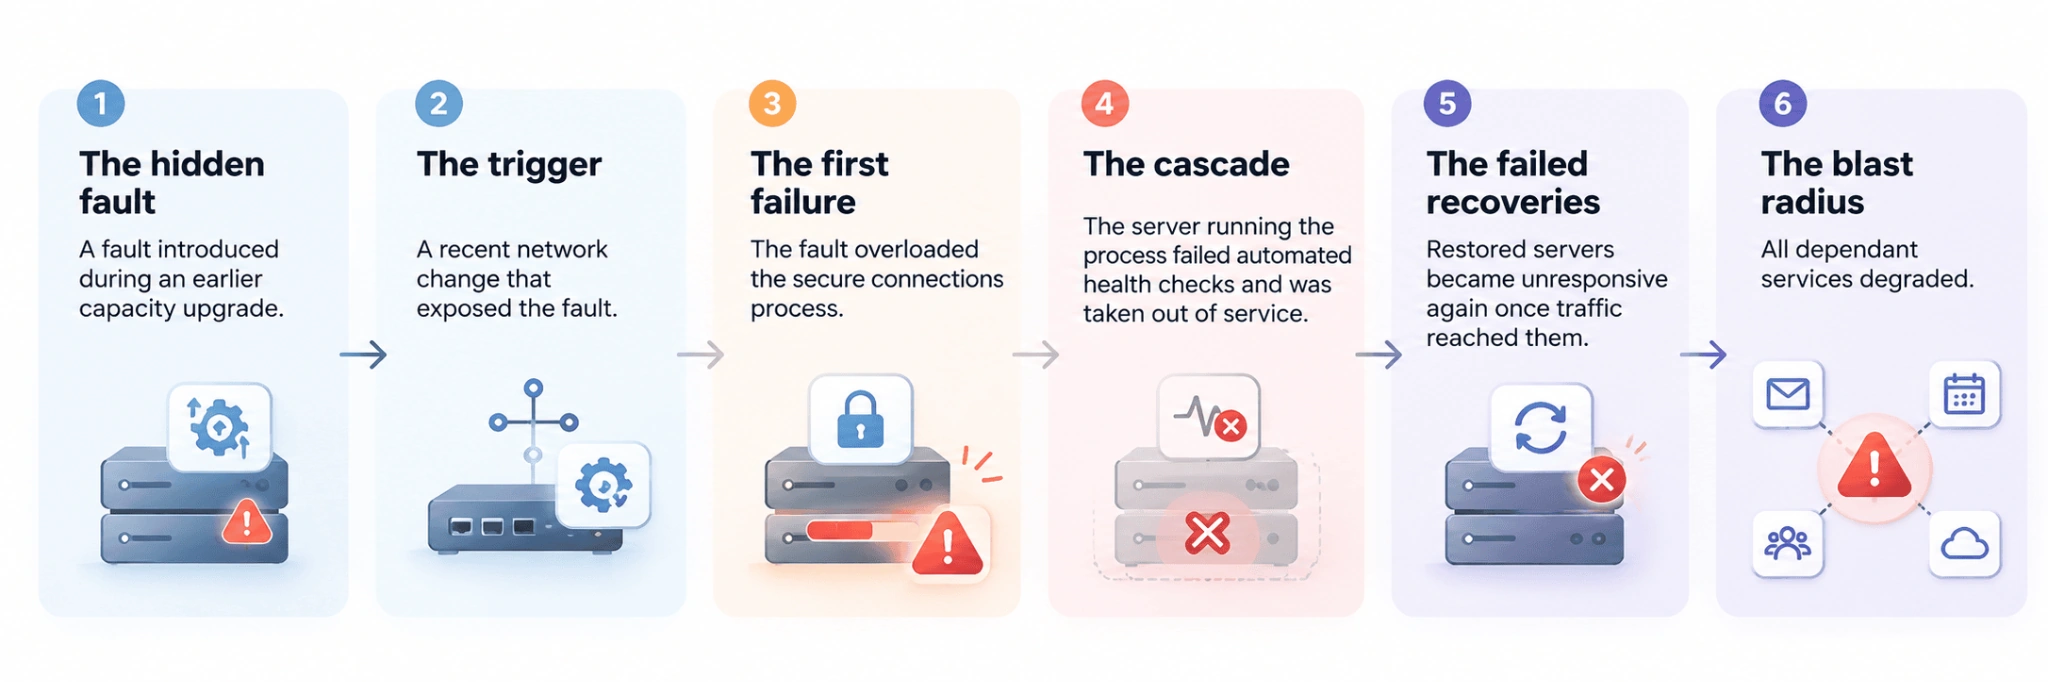
1. The hidden fault: Verify and validate your configuration changes
What happened: The bug came in with a Windows fix that Microsoft began deploying in July. The fix passed Microsoft’s staged deployment and ran worldwide for more than three months without impact. Lab load tests did not catch the bug, because they used a different traffic mix and weaker hardware than production.
- Back up the configuration before and after every change so that you always have a stable version to return to.
- Compare the new configuration against your baseline, line by line, so that you do not introduce unintended errors.
- Ensure that the running configuration matches the saved or baseline configuration. A mismatch could introduce bugs, faults, or errors at the next restart.
- Regularly audit configuration changes against your own standards for configuration mismatch, drifts, compliance issues, and vulnerabilities.
- Test changes on hardware and traffic that match production. A test that passes on a smaller machine tells you little about the larger one.
- Keep known-good baselines and change history well beyond the last release, so that you can still go back when a months-old change turns out to be the problem.
2. The trigger: Treat every routine change as a possible trigger
What happened: Nobody made a risky change on the day. A routine, automated Teams failover added load to the gateway and changed its traffic patterns, and that was enough to expose the bug. The fix was a change too: Microsoft reverted the defective Windows code path from 7:20am UTC on Friday.
- Put every network change through approval, and record who changed what and when.
- Log automated traffic shifts, such as failovers, as change events, and watch their impact.
- Roll a change out to a small part of the environment first; to limit the blast radius, and validate it before going wider.
- Have the rollback ready before the change starts and test that it works.
- Keep change records and performance data side by side, so that it takes only minutes to find what changed before this started.
3. The start of an outage cascade: Watch what happens inside a server
What happened: The bug exhausted CPU and memory on the gateway servers. The process that establishes connections became overwhelmed, and the servers stopped processing requests. A server in that state is still switched on, so a simple up-or-down ping tells you very little about the exact state of the server. The signs were also there early. By Microsoft’s own timeline, load had been rising and isolated servers had been failing for about 15 hours before the major alert.
- Monitor the critical processes and services running on each server.
- Track CPU and memory on every server, and alert on unusual behavior as well as on fixed limits.
- Let your monitoring learn what normal looks like, so a slow drift is caught before it becomes a failure.
- Correlate small failures that fix themselves into a trend. A handful of auto-mitigated failures across a day is a warning, even when each one looks harmless.
4. Tackling the cascade: Plan capacity for the day servers drop out
What happened: Servers that stalled were taken out of rotation. Their load moved to the servers that remained, which then came under strain too. Capacity fell even though the demand was the same. The gateway had also started the day with nearly 14% of its capacity out of service, which was harmless on its own. Hours into the incident, Microsoft disabled some of its automated traffic redirection.
- Size for failure. Ask whether the remaining servers can carry peak load if a share of them disappear.
- Plan for degradations that overlap. Less capacity, extra load, and a hidden fault were each survivable alone.
- Know your headroom on CPU, memory, and disk, and watch the trend along with the real-time numbers.
- Set a limit on how much capacity automation can pull out of production at once. A health check that pulls out every struggling server leaves no server to serve the users.
- Put guardrails and a kill switch on automated failover and remediation, so that you can stop automation that is making things worse.
- Map your dependencies so that one failure shows up as one problem and not as hundreds of alarms.
5. The failed recoveries: Bring services back online in stages
What happened: Restored servers were overwhelmed by waiting traffic and became unresponsive again. Microsoft’s automated recovery was not designed for so many servers being unresponsive at once, and its usual rollback tools could not quickly undo a months-old change. Recovery came from patching, restarting, and returning servers in large groups, often more than half of a region at a time. Regions entering business hours went first. Asia Pacific recovered first, and then Europe.
- Write the recovery steps before you need them, and rehearse them.
- Bring capacity back in stages, and confirm each stage is stable before adding more load.
- Make automated fixes conditional. Restarting a service does not help if the cause is still there, so test for the cause first.
- Check that your automated recovery still works when most of the environment is down, not only when one server is.
6. The blast radius: Know what depends on what
What happened: The failure was in the gateway in front of Exchange Online, but Microsoft lists Exchange, Copilot, Teams, SharePoint, OneDrive, Defender, Purview, Fabric, Intune, Planner, Power Apps, To Do, Power BI, and Universal Print as impacted. Teams chats and meetings kept working for most of the outage, because Teams could move off the faulty gateway. Exchange Online cannot, for scale reasons. The partitions meant to keep a failure inside one region did not hold either.
- Draw an organization-wide observability map that lets you map every application to its service, network, and infrastructure dependencies, down to connected end devices. This brings down mean time to respond (MTTR) significantly, especially in complex IT infrastructures.
- For every critical service, list what it depends on and what depends on it.
- Regularly test that your isolation boundaries actually contain a failure.
- Decide in advance how your teams will communicate if day-to-day communication channels such as email are unavailable.
- Monitor the cloud services you rely on next to the infrastructure you run, so you can tell quickly whether a problem is yours or your provider’s.
When your provider goes down
You cannot fix your provider’s servers. During this outage, Microsoft handled the cloud-side backlog itself, and extended the delivery window so that delayed messages were not returned as undeliverable. What you can do is look after your own side.
- Watch the mail queues on your hybrid and on-premises servers. Mail that cannot be delivered waits there, and it flushes at once when the provider recovers.
- After the provider recovers, check for delayed and failed mail, and confirm that important messages arrived.
- Monitor your provider’s service health from outside the provider, so that you are not relying on its status page alone.
- Keep a fallback communication channel ready for the day email is down.
Put these 6 lessons to work with OpManager Nexus
ManageEngine OpManager Nexus is a full-stack observability platform. This means it watches every layer on which your IT runs, and it tells you when one of them is heading for trouble. It monitors your network, servers, and storage. It tracks how your applications and websites perform for the people using them. It covers your cloud services, such as AWS, Azure, and Google Cloud. And its built-in AI, Zia, links related alerts, points to the root cause, and can trigger the fix.
Every lesson above comes down to seeing a problem early and acting on it before it spreads. Here is how OpManager Nexus helps at each link of the chain:
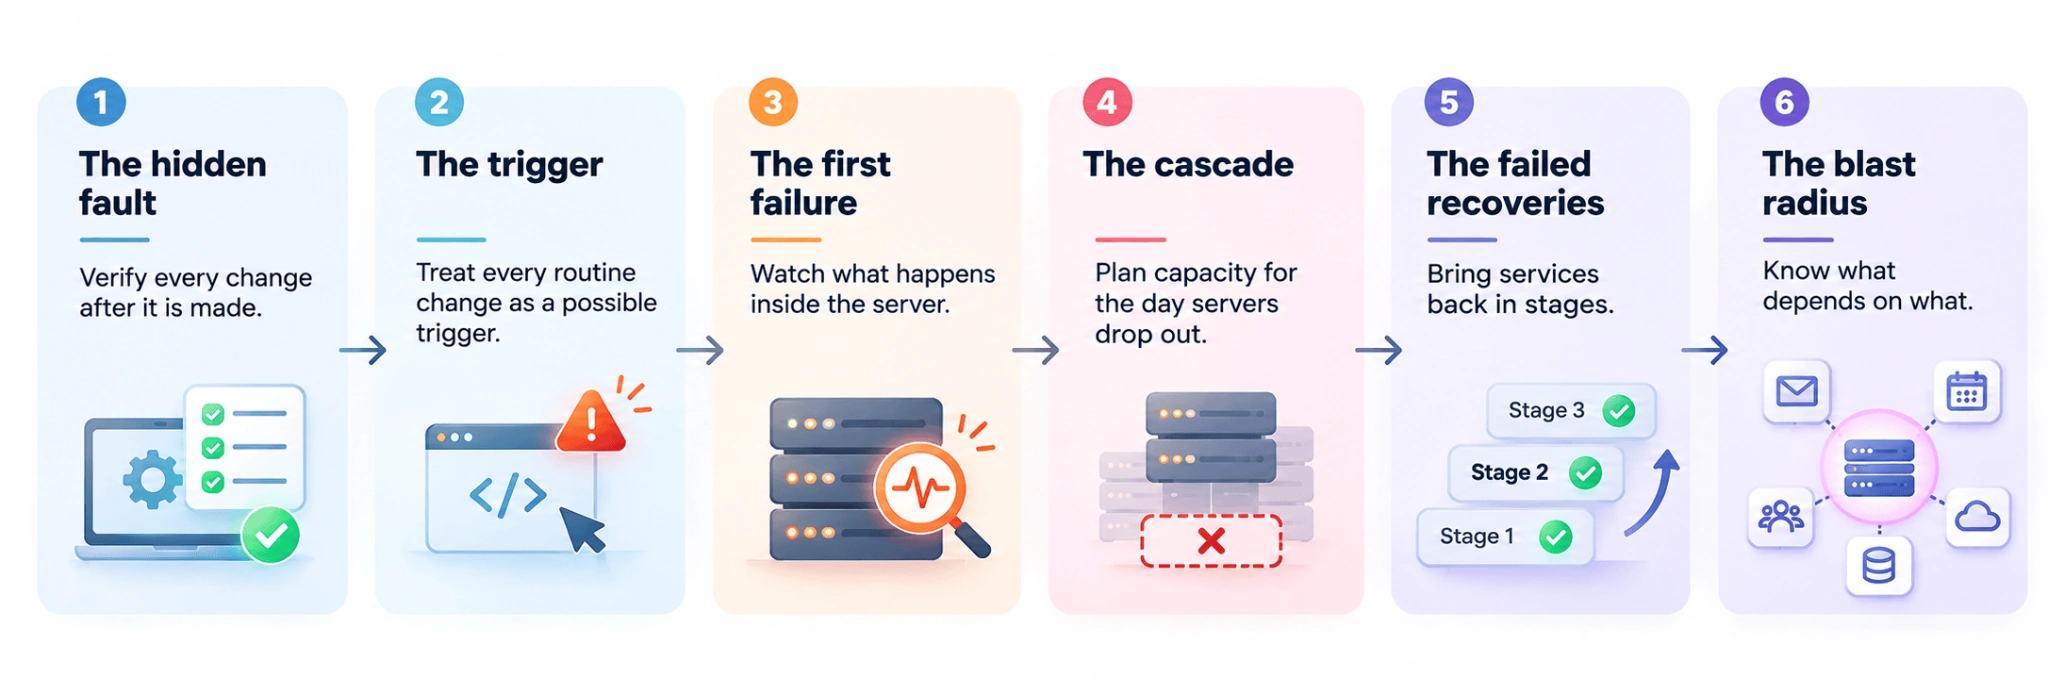
- Configuration management: Deploy, back up, and roll back configurations, review changes, and check policy compliance. Configuration changes across your network devices are detected automatically, so you can roll back to an earlier version when a change goes wrong.
- Adaptive thresholds: Thresholds adjust to the historical and real-time usage patterns of your infrastructure, and the anomalies they flag can be acted on through workflow automation.
- Capacity forecasting: Forecast reports track future capacity needs for CPU, memory, and disk.
- Root cause analysis: Alarm correlation and topology awareness help point to the root cause across your infrastructure stack.
- Workflow automation: The workflow builder is drag-and-drop and code-free. A workflow can test whether a Windows service is running, restart it, execute a Windows or Linux script, and log a ticket, with if-else checks between the steps. OpManager Nexus also integrates with solutions like Ansible.
- Organization Maps: Gain a unified, real-time view of every application, service, host, and network device, along with the dependencies connecting them.
- Exchange and Microsoft 365 monitoring: Exchange monitoring covers critical Exchange services and parameters, with thresholds pre-configured for the critical services. Microsoft 365 is tracked alongside the infrastructure you run yourself.
Try OpManager Nexus free for 30 days. Start your free trial.