A busy SOC generates more alerts in a day than any analyst can reasonably triage one by one. Many of those alerts look unrelated on the surface: a logon failure here, a process execution there, an audit log clearing event somewhere else. Read individually, each one is just another line in the queue. Read together, they may be stages of the same attack.
The work of spotting that connection, identifying the shared entities, lining up the timestamps, and asking whether the sequence resembles a known attack pattern, is slow and easy to miss when alert volume is high.
The Alert Correlation Agent helps with that step. It reviews alerts over a chosen time window, looks for entities that appear across multiple alerts, and uses those shared entities to suggest a possible sequence, with each step mapped to a MITRE ATT&CK stage where the evidence supports it.
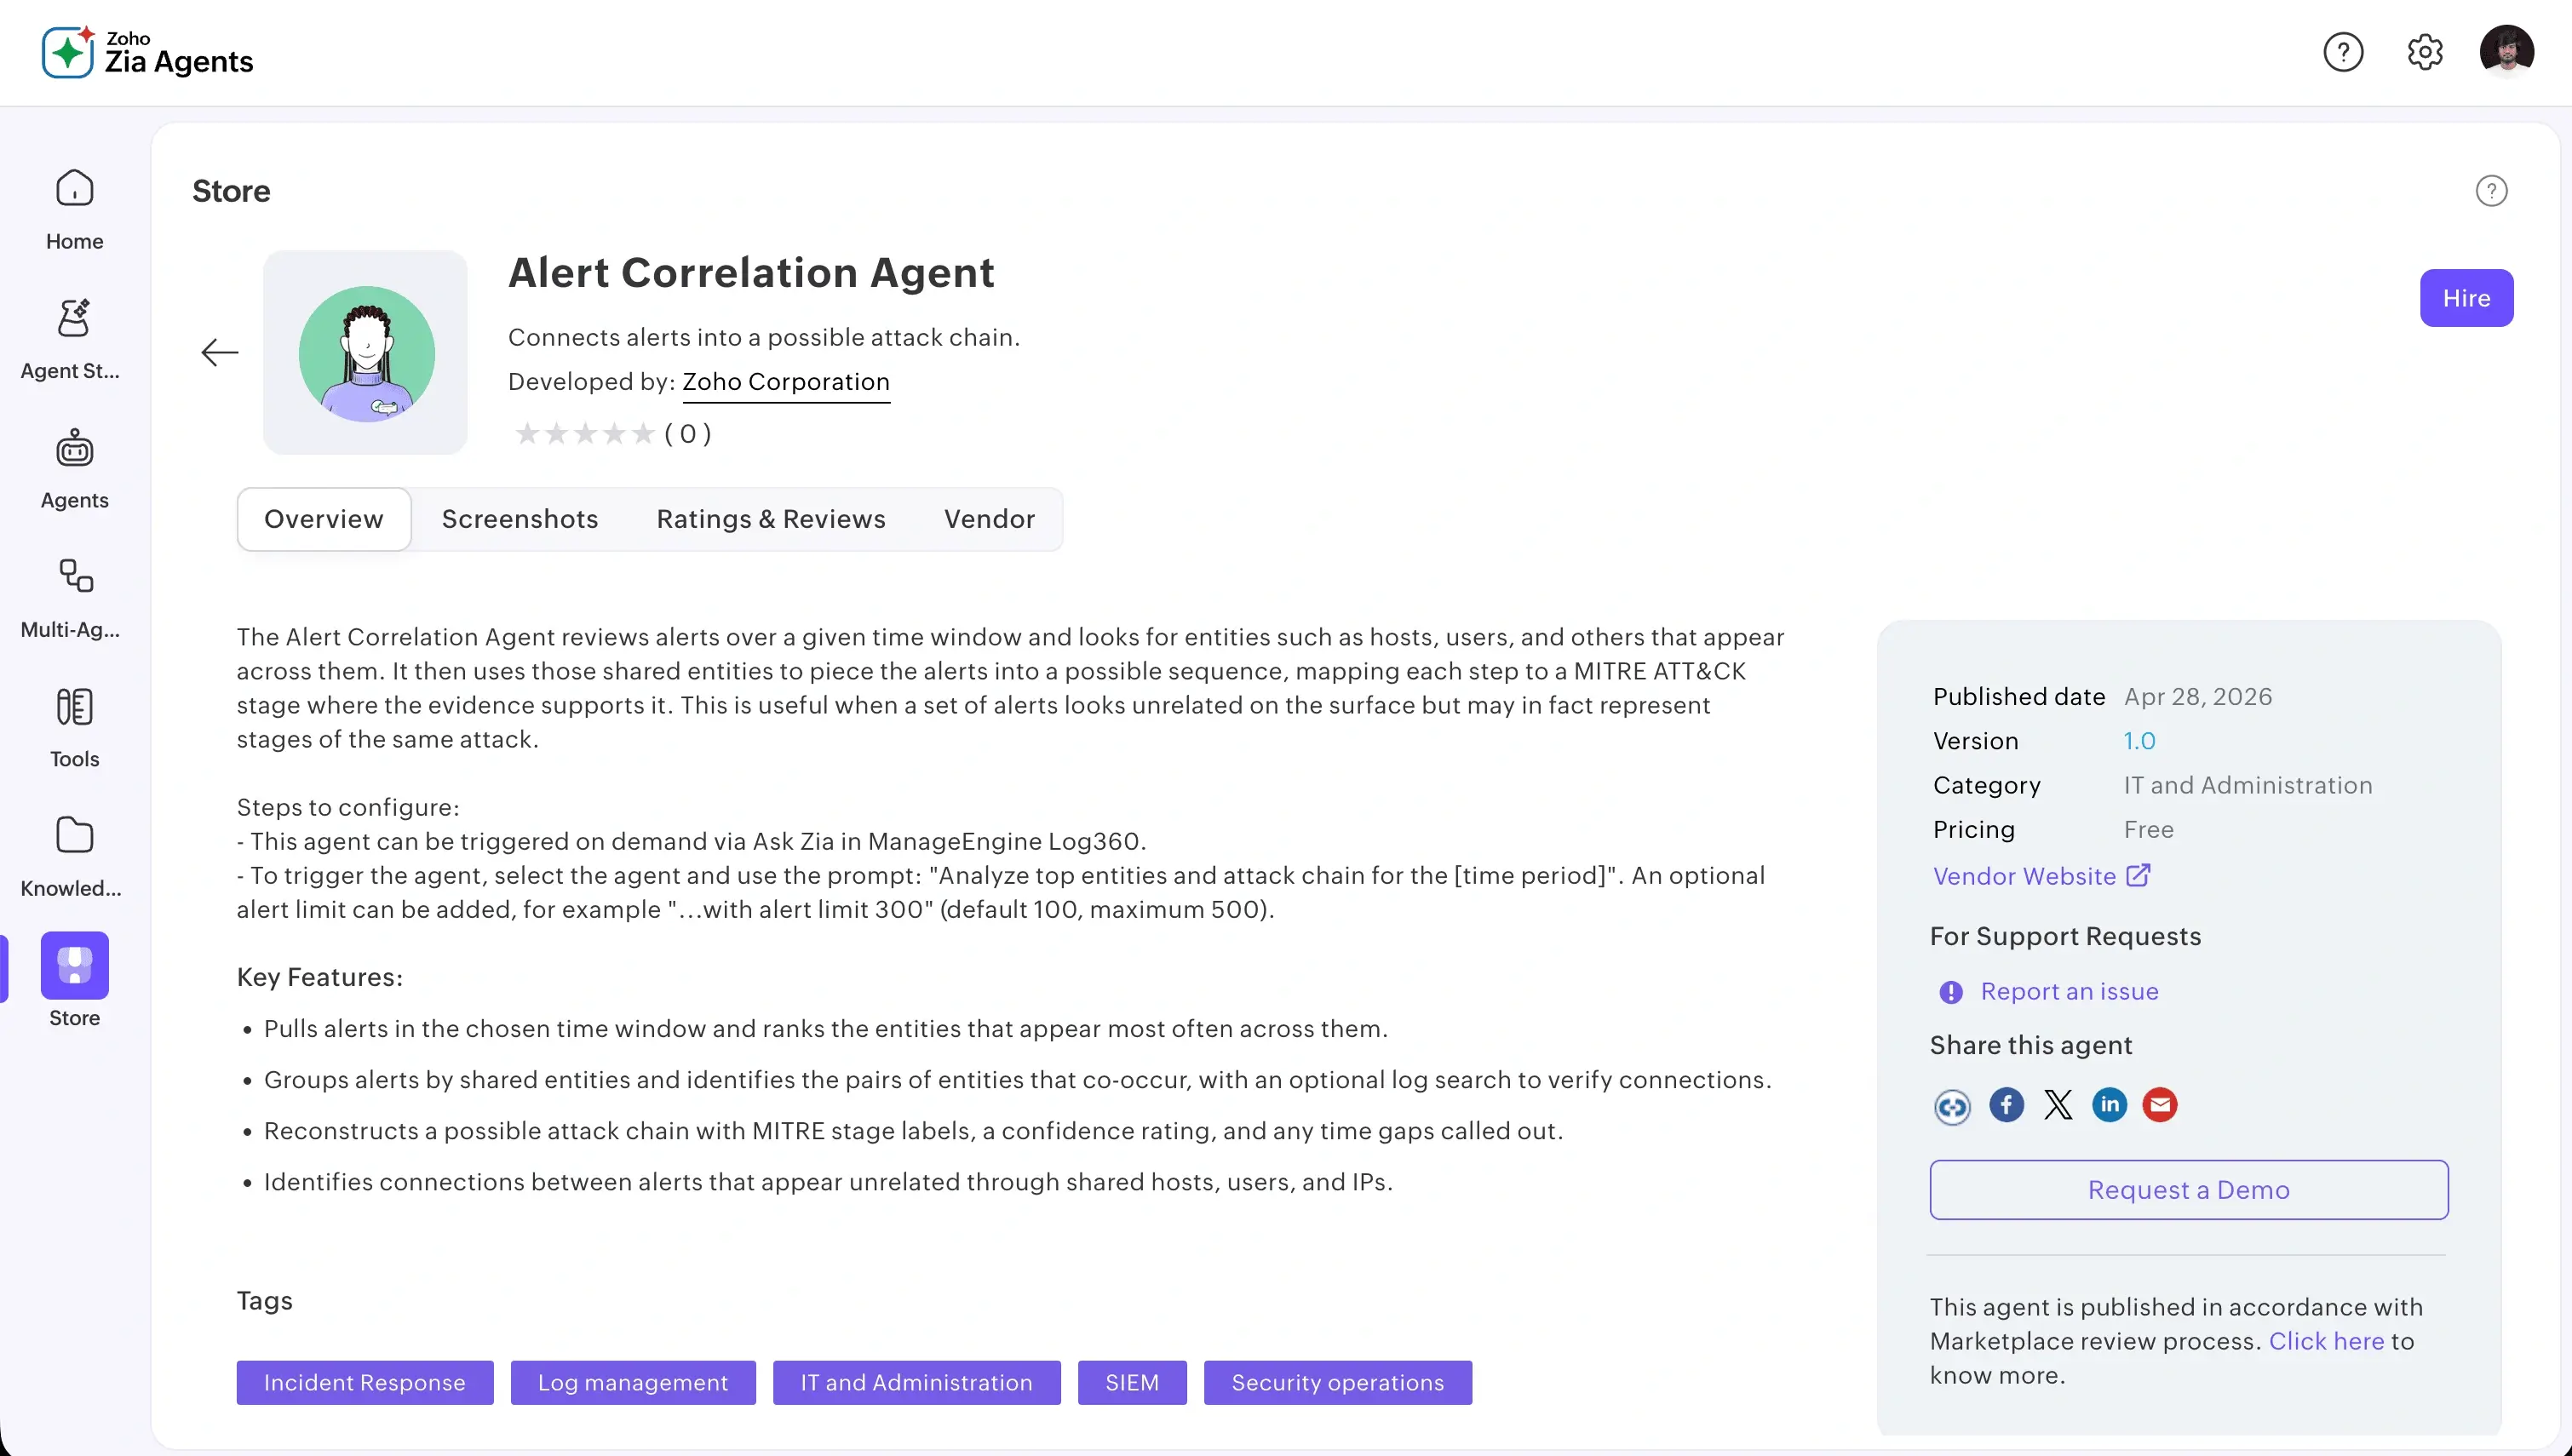
For a given time window, the Alert Correlation Agent:
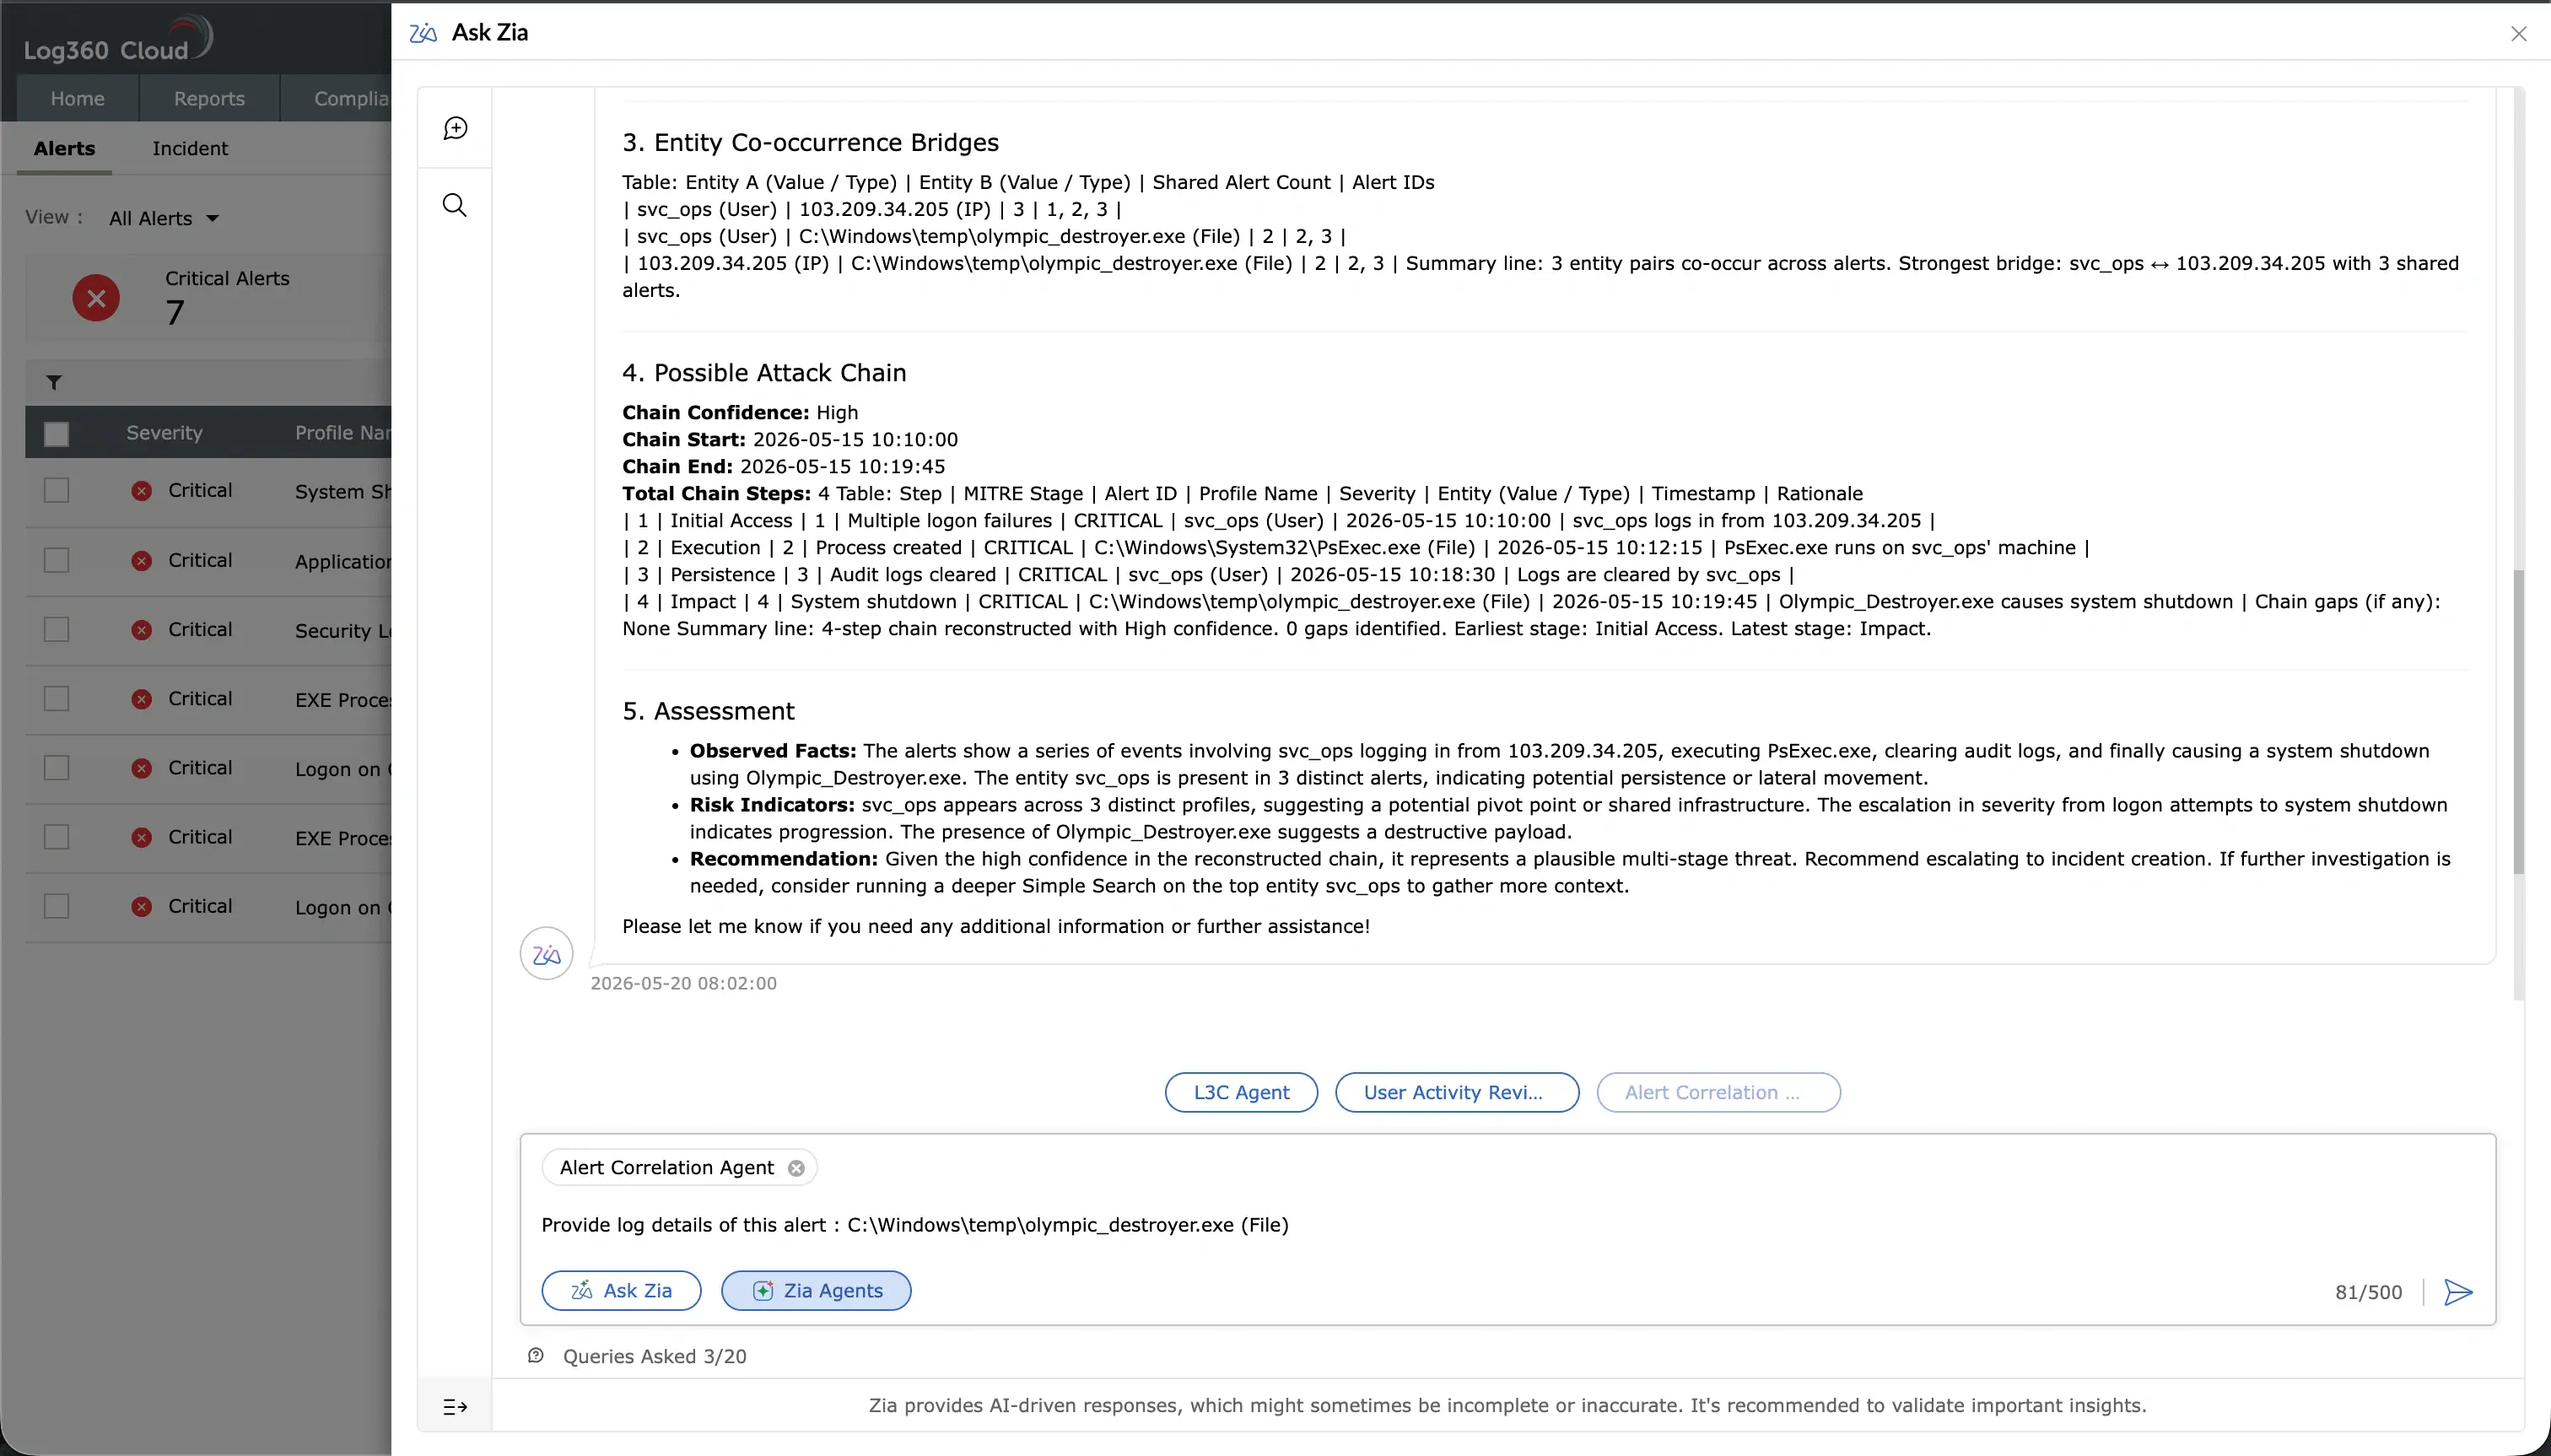
The output is a single view that brings related alerts together, rather than the analyst having to pivot between them manually.
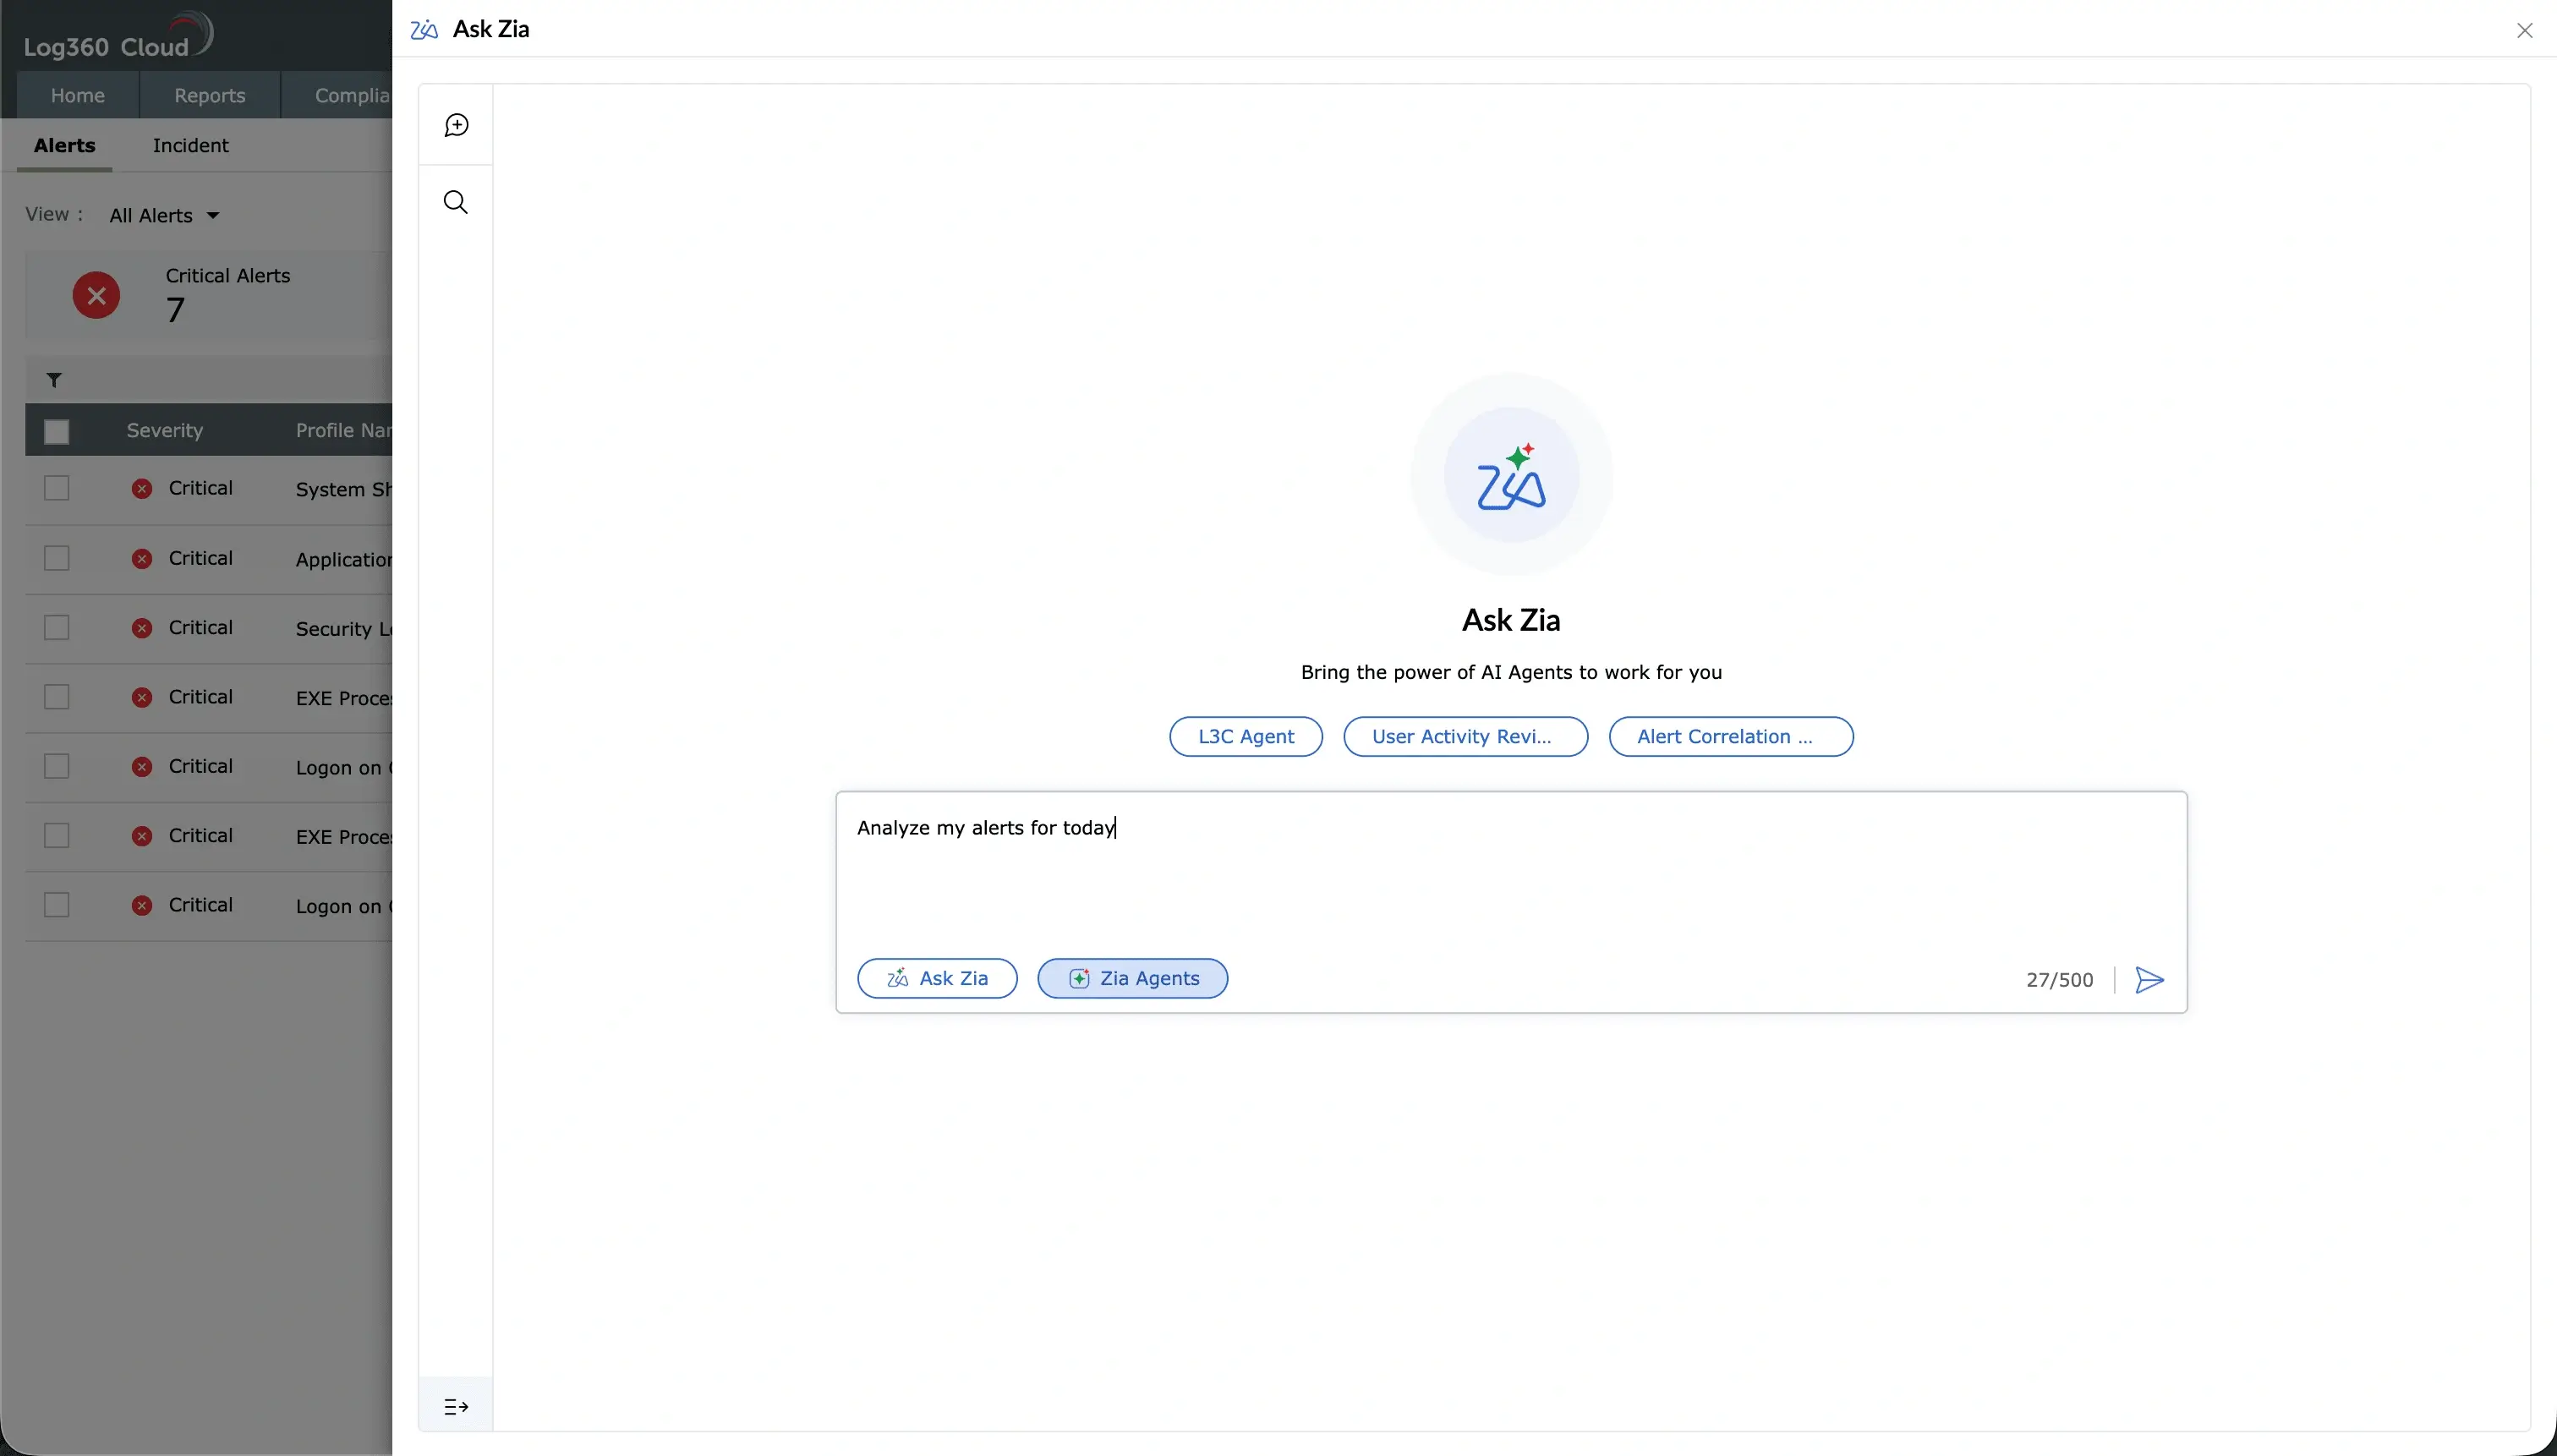
The agent runs on demand from Ask Zia. To trigger the agent, select it inside Ask Zia and prompt it in plain language:
"Analyze top entities and attack chain for the [time period]" or "Analyze my alerts for today"
An optional alert limit can be included in the prompt, for example "...with alert limit 300". The default is 100 and the maximum is 500. The agent runs the analysis and returns the result inline, ready for the analyst to review or follow up on individual alerts.
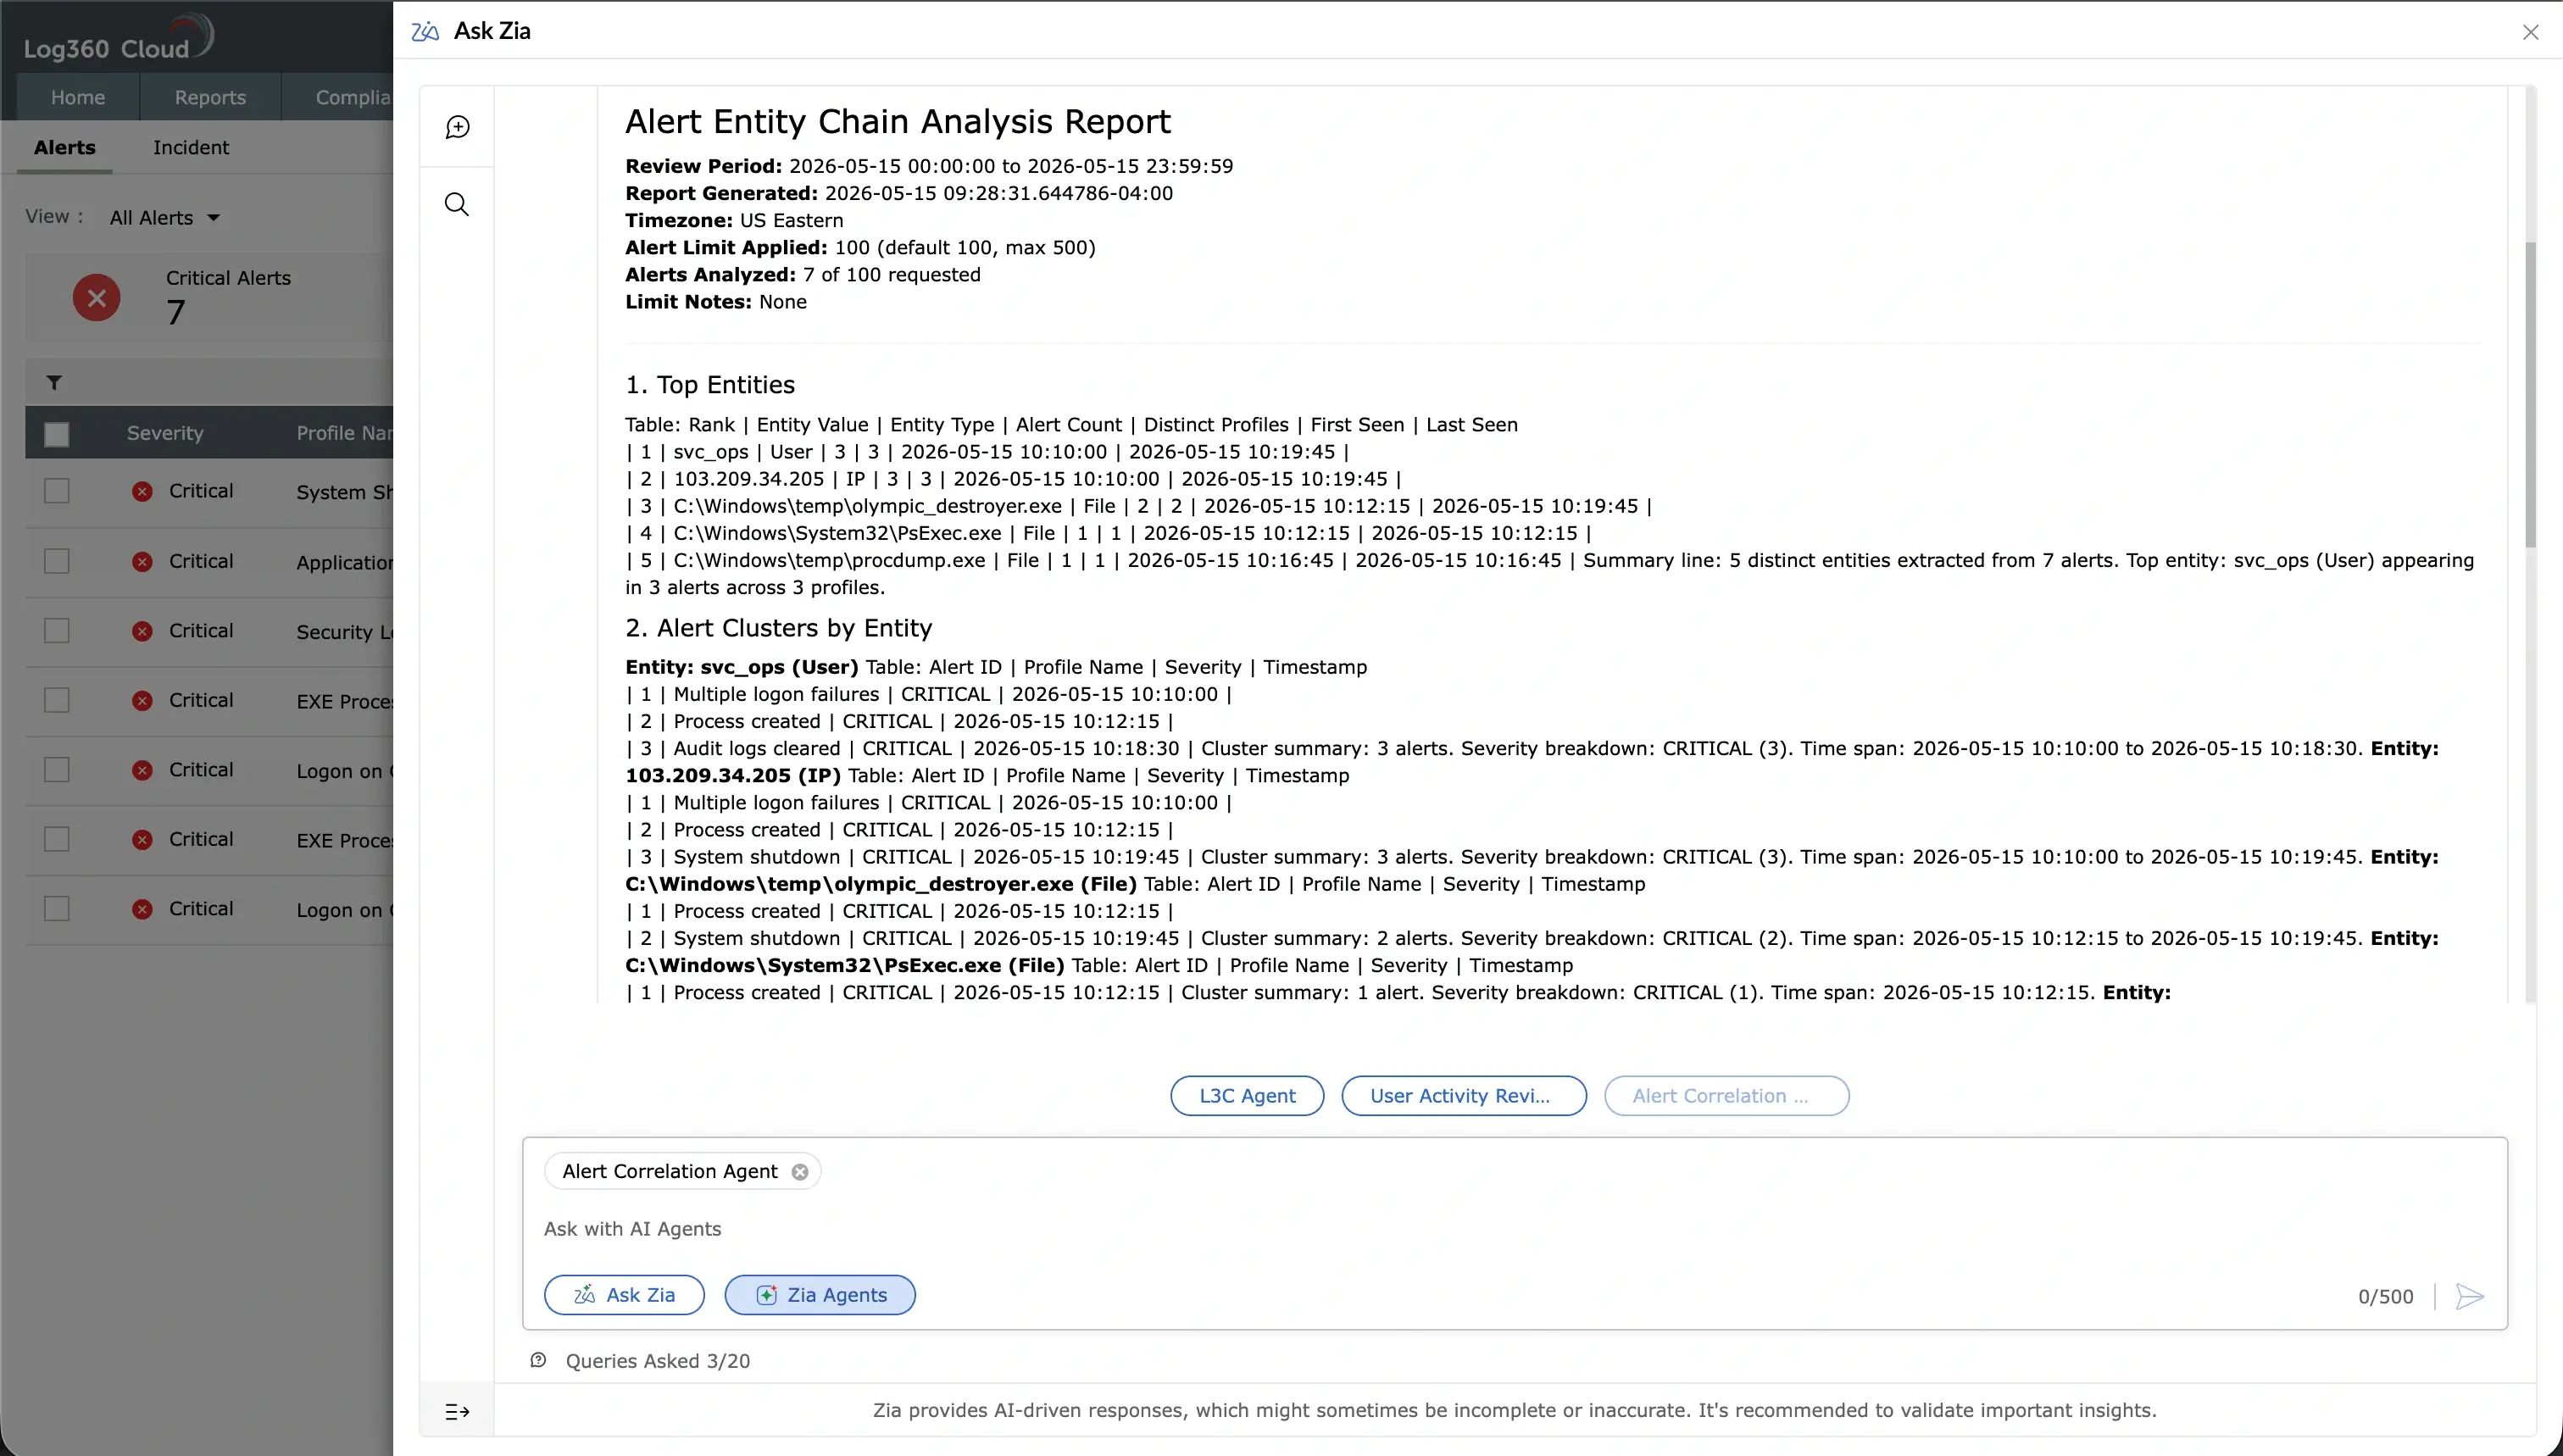
The agent returns a multi-section report:
1. Top Entities: A ranked list of the entities that appear most frequently across the alerts in the window, with entity type, alert count, distinct profiles, and first-seen and last-seen timestamps.
2. Alert Clusters by Entity: For each top entity, the profile name in which it appears, its severity, and timestamp. Each cluster includes a short summary noting the severity breakdown and time span.
3. Entity Co-occurrence Bridges: Pairs of entities that appear together in multiple alerts, with the shared alert count and the alert IDs involved. The strongest bridge is called out so the analyst can see which entity pair connects the most activity.
4. Possible Attack Chain: A reconstructed sequence of the related alerts, ordered by timestamp and labeled with the corresponding MITRE ATT&CK stage where the evidence supports it. The chain shows confidence, start and end times, total steps, and any time gaps between stages.
5. Assessment: A consolidated view that summarizes the analysis:
The report and the assessment together give the analyst a starting point for further review, an incident, or an audit response, without having to assemble the picture from scratch.