Milestone Marker: Annotating your application performance
When you deploy a new version of your application or refine a build with enhancements, one question always follows: Did this change help or hurt performance?
Metrics alone don’t tell you what changed or when; you need context along with performance data.
The Milestone Marker feature in ManageEngine Applications Manager’s APM Insight module solves this visibility gap by giving you performance checkpoints tied to specific operational events.
What is a milestone marker?
A milestone marker is essentially a timestamped marker you place before or after a deployment, upgrade, or system adjustment. Instead of sifting through historical graphs or manually correlating timestamps, you capture a reference point and instantly compare performance before and after the event. This makes it easier to validate deployments, isolate regressions, and back your decisions with evidence rather than assumption.
How does it help DevOps teams?
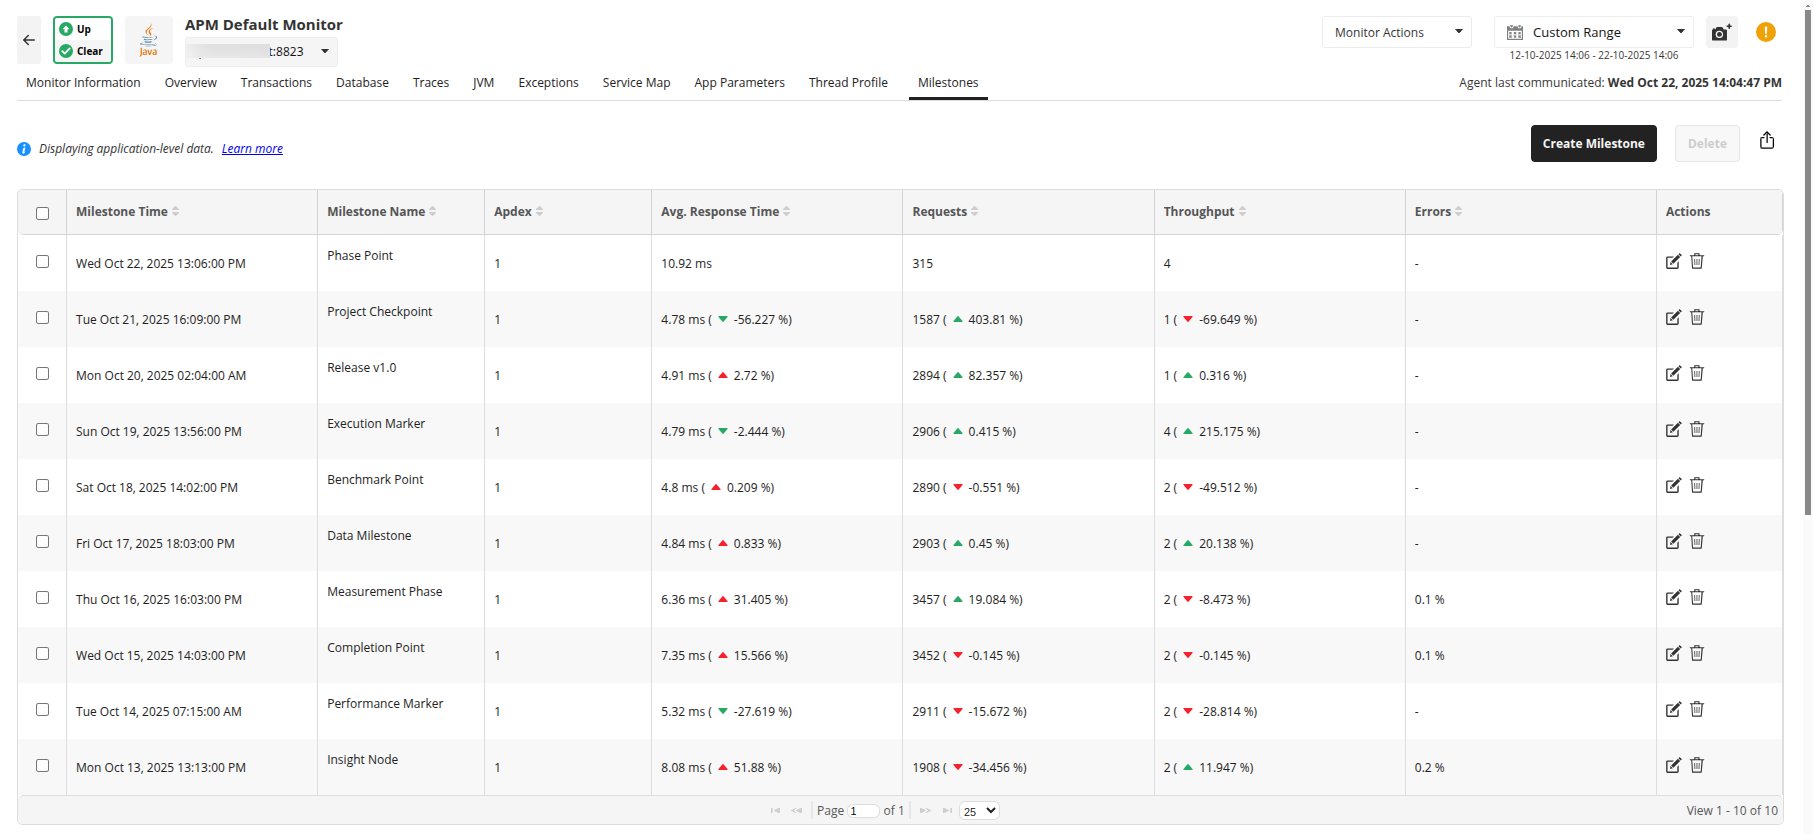
A milestone marker calculates deviation percentages for important metrics, showing whether performance improved or declined after an event. You don’t need extra dashboards or manual analysis—the performance deviations are highlighted directly within the interface. The latest milestone compares performance against the current period, while older milestones compare against the next chronological one, creating a clean, sequential performance narrative.
This level of clarity helps teams quickly confirm whether a change introduced latency, improved stability, or triggered unexpected issues. Instead of vague observations like “the app feels slow since last week,” teams can point to concrete data: “Average response time increased by 18% after the deployment.” This speeds up root cause and strengthens co-ordination between DevOps, QA, development, and management teams.

Here are 6 consolidated capabilities of the Milestone Marker feature:
Mark performance checkpoints before or after deployments, configuration changes, or infrastructure updates for precise impact tracking.
Automatically capture essential metrics like Apdex, response time, throughput, request volume, and errors.
Compare performance deviations between milestones to identify improvements or regressions instantly.
Store up to 50 milestones per application for detailed, long-term performance history.
Link performance behavior to operational events to simplify analysis, troubleshooting, and stakeholder reporting.
Enable data-driven decisions by revealing clear performance trends tied to specific changes
Setting up Milestone Marker
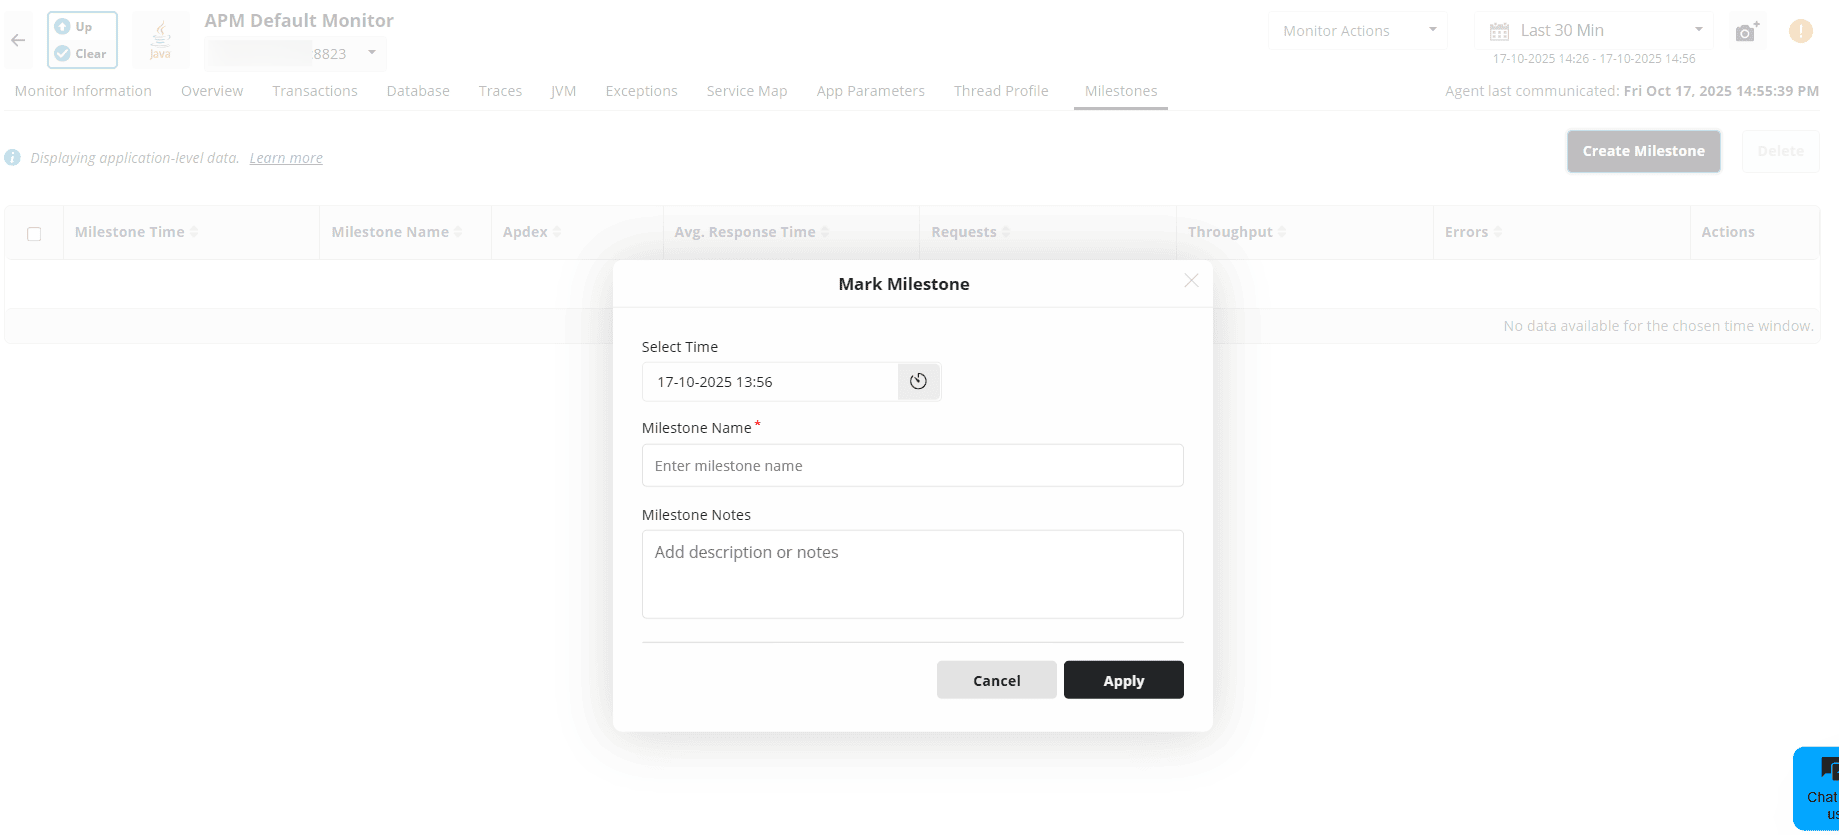
The setup is straightforward. Inside the APM Insight tab, select an application, open the Milestone view, and create a new checkpoint. You can name it based on the event and Applications Manager automatically uses the timestamp to begin tracking performance changes.

In short, Milestone Marker eliminates the guesswork around performance impact. It even contributes to long-term observability by helping you identify patterns and differentiate the types of updates that cause regressions from the ones that contribute to measurable improvements. This historical context supports better release planning, more accurate risk assessments, and stronger performance monitoring. It gives you a structured, evidence-based way to evaluate changes, validate releases, and maintain control over application health. Each milestone becomes a reliable anchor point in your performance story; clear, contextual, and actionable.
If you're new to Applications Manager, we invite you to download a 30-day, free trial and try the Milestone Marker feature for yourself. If you already use Applications Manager, you can simply upgrade to the latest version and gain access.
Upgrade to the latest version | Download a 30-day, free trial