Kubernetes Performance Monitoring
Kubernetes - An Overview
Kubernetes (or k8s) is an open-source container orchestration system for automating deployment, scaling and management of application containers across clusters of hosts. Kubernetes clusters can span hosts across public, private, or hybrid clouds. K8s orchestration allows users to build application services across multiple containers, schedule those containers across a cluster, scale those containers, and manage the health of those containers over time.
Monitor all your Kubernetes performance workloads using a single tool
Applications Manager's Kubernetes monitoring tool lets administrators adapt monitoring strategies to account for the new infrastructure layers introduced (when adopting containers and the container orchestration) with a distributed Kubernetes environment.
- Auto-discover the parts and map relationships between objects in the cluster - Kubernetes nodes, namespaces, deployments, replica sets, pods, and containers.
- Track the capacity and resource utilization of your cluster and be able to drill into specific parts of the cluster.
- Identify if you have enough nodes in your cluster and resource allocations to existing nodes is sufficient for deployed applications.
- Ensure all nodes on the cluster are healthy - monitor the CPU and memory for Kubernetes nodes (workers and masters).
- Ensure all desired pods in a deployment are running and not in a restart loop.
- Set up alerts for Container restarts to identify issues with either a container or its host that affect performance of their applications.
- Monitor the performance outliers of the Kubernetes-hosted applications running inside your cluster and track down any individual errors.
- View the status of Kubernetes Master and Node components — API Server, the Etcd key/value store, Scheduler and Controller.
- Monitor crucial Kubernetes performance metrics to predict future resource requirements and ensure that your cluster has sufficient capacity to handle potential workload spikes.
Note: In the Kubernetes cluster architecture, it is sufficient to add the primary master node alone to the Applications Manager. Applications Manager will automatically discover all the other master and worker nodes within the cluster and monitor them closely. There is no need to individually add each node as a Kubernetes performance monitor as this will lead to a performance issue.
Discover more with a Kubernetes performance monitor
Prerequisites for setting up Kubernetes performance monitor: kubectl should be installed on the machine where Kubernetes is installed.
Using the REST API to add a new Kubernetes performance monitor:Click here
Follow the steps given below to create a new Kubernetes monitor:
- Click on New Monitor link.
- Select Kubernetes under Virtualization category.
- Specify the Display Name of the Kubernetes Server.
- Enter the Cluster hostname/ IP address of the server where Kubernetes is running.
- Enter the credential details like user name and password for authentication, or select the required credentials from the Credential Manager list after enabling the Select from Credential list option.
- Check the box to enable Public Key Authentication (Supported for SSH2 only), the SSH Key for SSH authentication.
- Specify the command prompt value, which is the last character in your command prompt. Default value is $ and possible values are >, #, etc.
- Enter the SSH port. Default SSH port used is 22.
- Enable the Monitor Specific Namespace(s)option if you wish to monitor only specific namespace(s) in the Kubernetes environment. After enabling, specify the following details:
- Filter Condition: Select the filtering condition to include or exclude monitoring of specific namespace(s) in the Kubernetes environment.
- Namespace Name(s): Specify the name of the namespace(s) to be included/excluded while monitoring. You can enter multiple namespaces as comma-separated values.
- Check the Enable Event Log Monitoring box to enable the option to monitor Event Log details.
- Specify the Polling Interval in minutes.
- Choose the Monitor Group with which you want to associate the Kubernetes to, from the combo box (optional). You can choose multiple groups to associate your monitor.
- Click Add Monitor(s). This discovers the Kubernetes from the network and starts monitoring it.
Monitored Parameters
Go to the Monitors Category View by clicking the Monitors tab. Click on Kubernetes under the Virtualization table. Displayed is the Kubernetes bulk configuration view distributed into three tabs:
- Availability tab gives the Availability history for the past 24 hours or 30 days.
- Performance tab gives the Health Status and events for the past 24 hours or 30 days.
- List view enables you to perform bulk admin configurations.
On clicking a monitor from the list, you'll be taken to the Kubernetes performance monitor dashboard. It has thirteen tabs -
Overview
| Parameter | Description | Supported in SSH mode | Supported in Prometheus |
|---|
| CLUSTER USAGE DETAILS |
| Average Cluster CPU Usage | Average CPU used by the cluster |  |  |
| Average Cluster Memory Usage | Average Memory used by the cluster | | |
| CLUSTER DETAILS |
| Control Plane | Control Plane URL. | | |
| Git Version | Git version used in Kubernetes. | | |
| Build Date | Build Date | | |
| Compiler | Name of the compiler. | | |
| Platform | Version of the Platform. | | |
| CLUSTER SUMMARY |
| Namespace Count | Total number of Namespace. | | |
| Service Count | Total number of Services. | | |
| Deployment Count | Total number of Deployment. | | |
| Daemonset Count | Total number of Daemonsets. | | |
| Statefulset Count | Total number of Statefulsets. | | |
| Total Jobs Count | Total number of Jobs. | | |
| Replication Controller Count | Total number of Replication Controllers. | | |
| Replica Set Count | Total number of Replica Sets. | | |
| Ingress Count | Total number of Ingress. | | |
| COMPONENT DETAILS |
| Component Name | Name of the component. | | |
| Status | Status of the component. | | |
| Component Message | Root Cause message of the Component. | | |
Namespace
| Parameter | Description | Supported in SSH mode | Supported in Prometheus |
|---|
| NAMESPACE DETAILS |
| Namespace Name | Name of the Namespace. | | |
| Resource Version | The version number of the Namespace. | | |
| Namespace CPU Usage (%) | Percentage of CPU resources consumed by all pods running within the Namespace. | | |
| Namespace Memory Usage (%) | Percentage of memory resources utilized by all pods running within the Namespace. | | |
| Namespace Availability | Availability of Namespace. | | |
| Namespace Created Time | Time at which the Namespace was created. | | |
| NAMESPACE PODS USAGE DETAILS |
| Namespace Name | Name of Namespace. | | |
| Total Pods Count | Total number of Pods present in the Namespaces. | | |
| Running Pods Count | Total number of Running Pods present in the Namespaces. | | |
| Succeeded Pods Count | Total number of Succeeded Pods present in the Namespaces. | | |
| Pending Pods Count | Total number of Pending Pods present in the Namespaces. | | |
| Failed Pods Count | Total number of Failed Pods present in the Namespaces. | | |
| Unknown Pods Count | Total number of Unknown Pods present in the Namespaces. | | |
| NAMESPACE MEMORY & CPU DETAILS |
| Namespace Name | Name of the Namespace. | | |
| Namespace CPU Limit | Total CPU limit allocated to all workloads within the Namespace. | | |
| Namespace CPU Request | Total CPU requested by all pods running within the Namespace. | | |
| Namespace Memory Limit (Gi) | Total memory limit allocated to all workloads within the Namespace, measured in GiB. | | |
| Namespace Memory Request (Gi) | Total memory requested by all pods running within the Namespace, measured in GiB. | | |
| Namespace Network Received (Gi) | Total amount of network data received by all pods within the Namespace, measured in GiB. | | |
| Namespace Network Transmitted (Gi) | Total amount of network data transmitted by all pods within the Namespace, measured in GiB. | | |
Node
| Parameter | Description | Supported in SSH mode | Supported in Prometheus |
|---|
| TOP 5 NODES BY MEMORY DETAILS |
| Memory Limit | Maximum limit of Node memory in GiB. | | |
| Memory Requests | Total number of memory requests. | | |
| TOP 5 NODES BY CPU DETAILS |
| CPU Limit | Maximum limit of CPU. | | |
| CPU Request | Total number of CPU requests. | | |
| NODE MEMORY AND CPU DETAILS |
| Name | Name of the node. | | |
| Allocatable Memory (Gi) | The memory resources of a node that are available for scheduling, measured in Gi. | | |
| Memory Limit (%) | The maximum limit of memory resource which can be used. | | |
| Memory Request (%) | Total memory requests in percentage. | | |
| Allocatable CPU Processor Count | Total number of CPU processors that are available for scheduling. | | |
| CPU Limit (%) | The maximum limit of CPU resource which can be used. | | |
| CPU Request (%) | Total CPU requests in percentage. | | |
| Node Disk Usage (%) | Percentage of disk space currently used on the node. | | |
| Allocatable Ephemeral Storage (Gi) | The amount of ephemeral storage available on the node for pod scheduling, measured in Gi. | | |
| NODE POD DETAILS |
| Name | Name of the pod. | | |
| Pod Usage Details | Total number of pods available with used and free pods split-up. | | |
| Kube-system Pod Count | Total number of Kube state pods. | | |
| Non-Kube-system Pod Count | Total number of non-Kube state pods. | | |
| Image Count | Total number of images in the node. | | |
| Used Pod Count | Total number of pods present in Kubernetes. | | |
| Allocatable Pod Count | Total number of pods that are available. | | |
| Pod Utilization (%) | Percentage of allocatable pods that are currently in use. | | |
| NODE DETAILS |
| Name | Name of the node. | | |
| Hostname | The hostname of the node. | | |
| Internal IP | The Internal IP address of the node. | | |
| OSImage | Name of the OSImage. | | |
| OS | Name of the OS in which the container is deployed. | | |
| Architecture | Architecture details. | | |
| Type | Type of node. | | |
| Kubelet Version | The version of Kubelet used. | | |
| Allocatable Ephemeral Storage(Gi) | Size of temporary memory available in Gi. | | |
| Created Time | Time at which the node was created. | | |
Pods
| Parameter | Description | Supported in SSH mode | Supported in Prometheus |
|---|
| POD DETAILS |
| Pod Name | Name of the pod. | | |
| Project Name | Name of the project in which the pod is created. | | |
| Pod Namespace | Namespace in which the pod resides. | | |
| Pod Node Name | Name of the node in which the pod resides. | | |
| Number of Containers | Total number of containers running in the pod. | | |
| Pod Type | Type of the pod. | | |
| Pod IP | IP address of the pod. | | |
| Pod Status | Status of the pod. | | |
| Pod Start Time | Time at which the pod was started. | | |
| Pod Created Time | Time at which the pod was created. | | |
| Pod Persistent Volume Claims | Number of Persistent Volume Claims associated with the pod. | | |
| TOP PODS BY CPU DETAILS |
| Top Pods by CPU Usage | Graph showing pods with highest CPU usage. | | |
| Top Pods by CPU Throttled | Graph showing pods experiencing CPU throttling. | | |
| POD MEMORY DETAILS |
| Pods Memory Request | Total memory requested by the pod. | | |
| POD MEMORY AND CPU DETAILS |
| Pod CPU Limit | CPU limit configured for the pod. | | |
| Pod CPU Request | CPU requested by the pod. | | |
| CPU Usage | Actual CPU consumed by the pod. | | |
| CPU Throttled | CPU throttling experienced due to limit enforcement. | | |
| Memory Limit | Memory limit configured for the pod. | | |
| Memory Request | Memory requested by the pod. | | |
| Memory Used | Actual memory consumed by the pod. | | |
| Disk Used | Disk space used by the pod. | | |
| Network Rx | Data received by the pod. | | |
| Network Tx | Data transmitted by the pod. | | |
Containers
| Parameter | Description | Supported in SSH mode | Supported in Prometheus |
|---|
| TOP 5 CONTAINERS BY RESTART COUNT |
| Container Restart Count | Total number of times the container has been restarted. | | |
| CONTAINER DETAILS |
| Container Name | Name of the container. | | |
| Container Image | Image of the container. | | |
| Pod Name | Name of the pod which hosts the container. | | |
| Container Status | Status of the container. | | |
| Container Restart Count | Number of times the container was restarted. | | |
| Container Start Time | Time at which the container was started. | | |
| TOP CONTAINERS BY CPU DETAILS |
| Top Containers by CPU Usage | Graph of top containers by CPU usage. | | |
| Top Containers by CPU Throttled | Graph of top containers by CPU throttling. | | |
| CONTAINER CPU DETAILS |
| CPU Limit | CPU limit configured for the container. | | |
| CPU Request | CPU requested by the container. | | |
| CPU Usage | Actual CPU consumed by the container. | | |
| CPU Throttled | CPU throttling experienced by the container. | | |
| CONTAINER MEMORY DETAILS |
| Container Memory Limit (Gi) | Memory limit configured for the container. | | |
| Container Memory Request (Gi) | Memory requested by the container. | | |
| Container Memory Usage (%) | Actual memory consumed by the container. | | |
| CONTAINER DISK & NETWORK DETAILS |
| Disk Used | Disk space used by the container. | | |
| Container Network Received (Gi) | Data received by the container. | | |
| Container Network Transmitted (Gi) | Data transmitted by the container. | | |
| Top Containers by Network Received | Graph of top containers by data received. | | |
| Top Containers by Network Transmitted | Graph of top containers by data transmitted. | | |
Services
| Parameter | Description | Supported in SSH mode | Supported in Prometheus |
|---|
| SERVICE DETAILS |
| Services Name | Name of the service. | | |
| Services Namespace | Name of the Namespace in which the service resides. | | |
| Services Application | Name of the Service application. | | |
| Service Type | Type of the service. | | |
| Cluster IP | Cluster IP Address. | | |
| Service Ports | Name of the port that connects with the service. | | |
| Service Created Time | Creation time of the service. | | |
| DEPLOYMENT DETAILS |
| Deployment Name | Name of the deployment. | | |
| Deployment Namespace | Namespace where the deployment exists. | | |
| Deployment Replica Count | Total number of replicas in a deployment. | | |
| Running Replica | Total number of Running Pods in a deployment. | | |
| Deployment Available Replica Count | Total number of available replicas in a deployment. | | |
| Deployment Availability | Availability of the deployment. | | |
Daemonset
| Parameter | Description | Supported in SSH mode | Supported in Prometheus |
|---|
| DAEMONSET DETAILS |
| Name | Name of the Daemonset. | | |
| Namespace Name | Name of the Namespace where the Daemonset is present. | | |
| Desired Replica | Total number of desired Pods. Default value is 1. | | |
| Current Replica | Total number of Current Pods. | | |
| Running Replica | Total number of Running Pods. | | |
| Available Replica | Total number of Available Pods. | | |
| Misscheduled Replica | Total number of Misscheduled Pods. | | |
Statefulset
| Parameter | Description | Supported in SSH mode | Supported in Prometheus |
|---|
| STATEFULSET DETAILS |
| Name | Name of the Statefulset. | | |
| Namespace Name | Name of the Namespace where the Statefulset is present. | | |
| Desired Replica | Total number of desired Pods. Default value is 1. | | |
| Running Replica | Total number of Running Pods. | | |
| Available Replica | Total number of Available Pods. | | |
Replica
| Parameter | Description | Supported in SSH mode | Supported in Prometheus |
|---|
| REPLICATION CONTROLLER DETAILS |
| Name | Name of the Replication Controller. | | |
| Namespace Name | Name of the Namespace where the Replication Controller is present. | | |
| Desired Replica | Total number of desired Pods. Default value is 1. | | |
| Running Replica | Total number of Running Pods. | | |
| Available Replica | Total number of Available Pods. | | |
| REPLICA SET DETAILS |
| Name | Name of the ReplicaSet. | | |
| Namespace Name | Name of the Namespace where the ReplicaSet is present. | | |
| Desired Replica | Total number of desired pods. Default value is 1. | | |
| Running Replica | Total number of Running Pods. | | |
| Available Replica | Total number of Available Pods. | | |
Jobs
| Parameter | Description | Supported in SSH mode | Supported in Prometheus |
|---|
| CLUSTER JOBS SUMMARY |
| Total Jobs Count | Total number of Jobs. | | |
| Running Jobs Count | Total number of Running Jobs. | | |
| Completed Jobs Count | Total number of Completed Jobs. | | |
| JOBS DETAILS |
| Name | Name of the Job. | | |
| Namespace Name | Name of the Namespace where the Jobs are present. | | |
| Parallelism Replica | Total number of Pod replicas, a job should run in parallel. | | |
| Desired Replica | Total number of desired Pods. | | |
| Successful Replica | Total number of Pods in successful state. | | |
| Job Start Time | The start time of the Job. | | |
| Job Completion(Min) | Time taken for job completion (in minutes). | | |
Persistent Volumes
| Parameter | Description | Supported in SSH mode | Supported in Prometheus |
|---|
| PERSISTENT VOLUMES DETAILS |
| PV Name | Name of the Persistent Volume. | | |
| PV Status | Status of the Persistent Volume. | | |
| PV Claim | Name of the Persistent Volume Claim. | | |
| PV Access Mode | The mode through which you can access the Persistent Volume. | | |
| PV Storage Class | Name of the Persistent Volume storage class. | | |
| PV Capacity(GiB) | The capacity of the Persistent Volume in GiB. | | |
| PV Created Time | Creation time of the Persistent Volume. | | |
| PERSISTENT VOLUMES CLAIM DETAILS |
| PVC Name | Name of the Persistent Volume Claim. | | |
| PVC Namespace | Name of the Namespace in which the Claim exists. | | |
| PVC Status | Status of the Persistent Volume Claim. | | |
| PV Name | Name of the Persistent Volume associated with this Claim. | | |
| PVC Access Mode | The mode through which you can access the Persistent Volume. | | |
| PVC Storage Class | Name of the Persistent Volume storage class. | | |
| PVC Requests(GiB) | Total number of Persistent Volume Claim requests in GiB. | | |
| PVC Created Time | Creation time of Persistent Volume Claim. | | |
| PVC Usage | Storage space currently used by the Persistent Volume Claim. | | |
| PVC Free Space | Available free storage in the Persistent Volume Claim. | | |
| PVC Usage (%) | Percentage of storage utilized in the Persistent Volume Claim. | | |
Events
| Parameter | Description | Supported in SSH mode | Supported in Prometheus |
|---|
| CLUSTER EVENT SUMMARY |
| Total Event Count | Total number of Events. | | |
| Failed Event Count | Total number of Failed Events. | | |
| Normal Event Count | Total number of Normal Events. | | |
| Warning Event Count | Total number of Warning Events. | | |
| EVENT DETAILS |
| Event Name | Name of the Event. | | |
| Event Created Time | The time at which the Event was created. | | |
| Event Namespace | Name of the Namespace where the Event is associated. | | |
| Event Type | Type of the Event. Possible values: Warning/Normal/Failed | | |
| Event Kind | Module of the Event. Possible values: Pod/Node | | |
| Involved Object | The module object involved. | | |
| Reason | Reason of the Event. | | |
| Message | Message of the Event. | | |
| Last Updated Time | The latest updated time of the Event. | | |
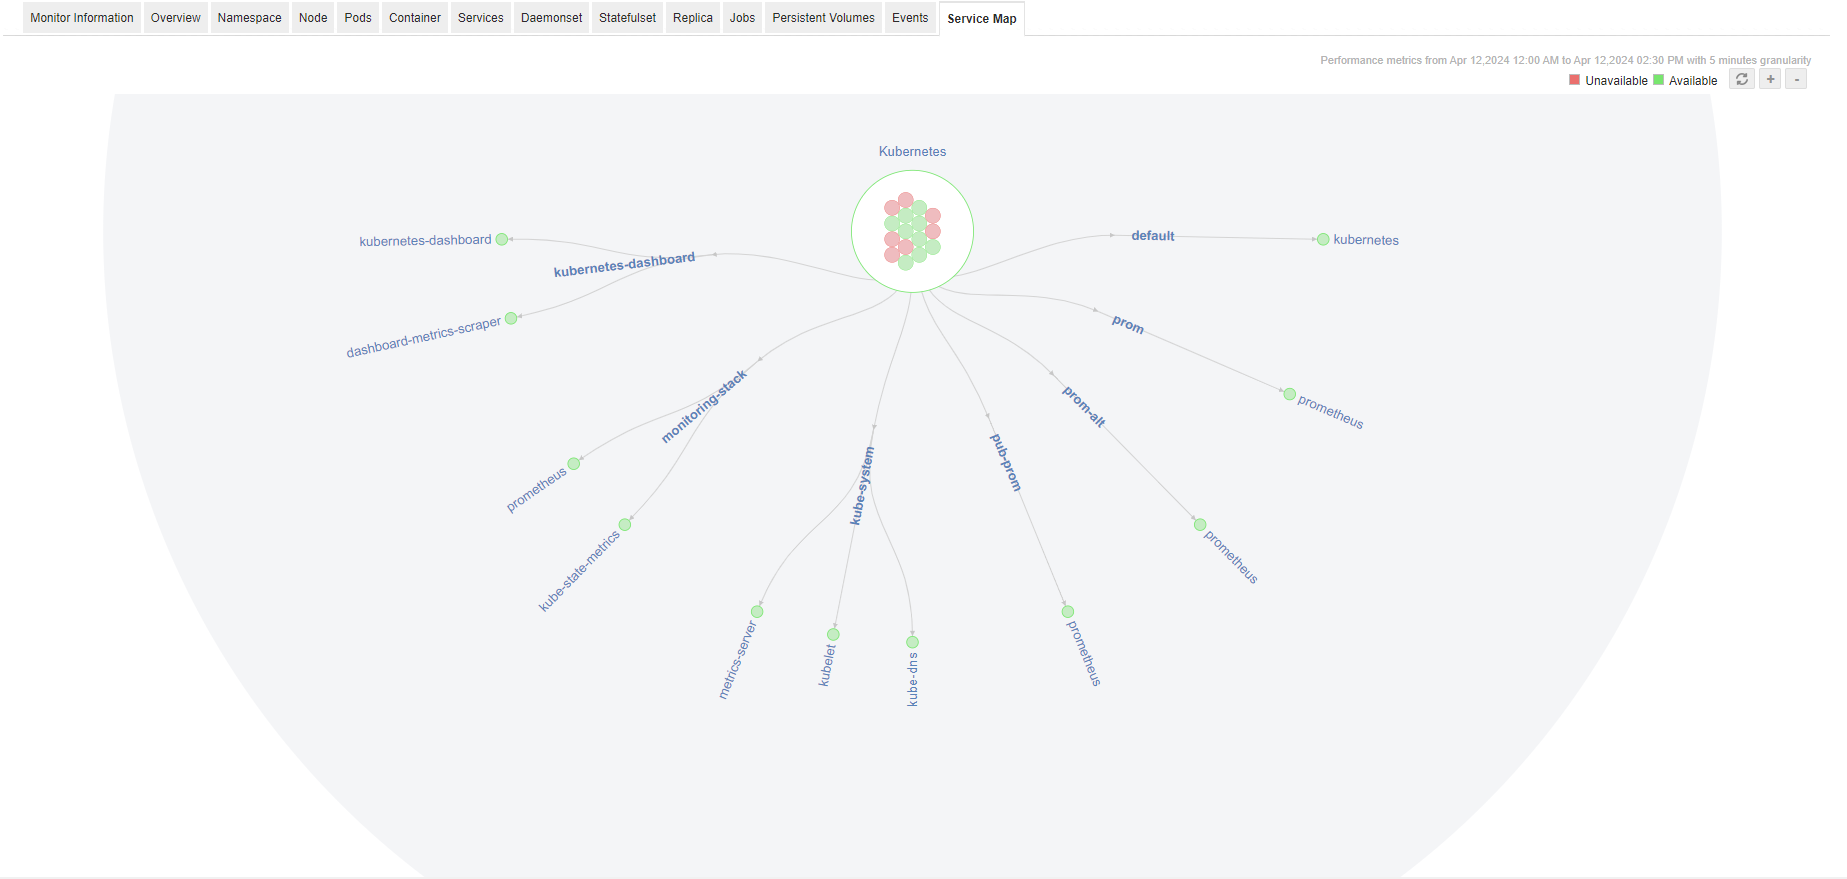
Service Map
- Displays a graphical map view containing namespace and service details.
- All the namespace with its status and pods count for each phase will be seen inside cluster circle.
- Green color indicates that the namespace is UP and red color indicates it is DOWN.
- The cluster services under a namespace can be seen branching as a tree.
- Each service contains its host IP address and port details.