
Performance Guide
Your help desk application may have the facility to store large amount of data but this can also hinder the performance of your help desk tool. This guide provides certain queries to improve the performance of ManageEngine ServiceDesk Plus MSP.
NOTE: Please restart ServiceDesk Plus MSP after executing the query for the changes to get applied.
The list of performance tips discussed in this guide is,
We recommend at least 2GB of RAM on the server machine if it's dedicated to ServiceDesk Plus MSP. In cases where you have enough RAM but still have performance issues, then follow the instructions given below,
-
Go to ManageEngine\ServiceDesk\conf folder
-
Edit the wrapper.conf file on a wordpad and change the parameters according to the RAM size on the server machine:
By default, the maximum java heap size is 512 MB.
If you have 3GB of RAM, then change 512 to 768,
# Maximum Java Heap Size (in MB)
wrapper.java.maxmemory=512
to
# Maximum Java Heap Size (in MB)
wrapper.java.maxmemory=768
If you have 4 GB of RAM, then change 512 to 1024
If the RAM is 3GB or 4GB, then along with the maximum memory configuration, you could also change the following,
wrapper.java.additional.19=-XX:PermSize=64m
can be changed to,
wrapper.java.additional.19=-XX:PermSize=128m
And,
wrapper.java.additional.20=-XX:MaxPermSize=128m
can be changed to,
wrapper.java.additional.20=-XX:MaxPermSize=256m
Enabling MS SQL Snapshot Mode
We can enable the Read committed Snapshot in the MSSQL environment to increase the performance of the application. It creates a snapshot or read-only database of your current results that is separate from your live database. So when you run a SELECT statement, to read your data, you are reading from a read-only copy of your database. When you change your database, it happens on the live database, and then a new copy or snapshot is created for reading against.
How to enable read committed snapshot isolation (RCSI)
All MSSQL databases usually have lock issues, which may affect an application’s optimal performance. To avoid such performance issues in ServiceDesk Plus MSP, enable the read committed snapshot isolation (RCSI) by following these steps:
- Stop ServiceDesk Plus MSP application.
- Log in to SQL Management studio.
- Take the ServiceDesk Plus MSP database offline by executing
USE master;
GO
ALTER DATABASE <db_name> SET OFFLINE WITH ROLLBACK IMMEDIATE
GO - Enable the read committed snapshot by running
ALTER DATABASE <db_name> SET READ_COMMITTED_SNAPSHOT ON WITH ROLLBACK IMMEDIATE
GO
- Bring the database online using
USE master;
GO
ALTER DATABASE <db_name> SET ONLINE
GO -
Check if you have enabled RCSI successfully by running the following query
SELECT is_read_committed_snapshot_on FROM sys.databases WHERE [name] = '<db_name>'
You can now start the application. For more information on MSSQL databases and RSCI, go here.
Benefits of enabling the MS SQL Snapshot Mode
Simultaneous user querying of database will be possible without any delay or disruption (although load on application might exceed the usual limits).
User querying records will be maintained in a separate tempdb, which will not be affected by other user queries occurring in parallel or subsequently.
Database tables will be uploaded only after a transaction reaches completion.
You can schedule data archiving of closed and resolved requests at regular intervals to improve the performance of ServiceDesk Plus. Refer Data Archiving to learn more on archiving requests.
If you have many nodes say, more than 1000, then scanning these nodes at regular intervals would hinder the performance of ServiceDesk Plus. To reduce the load on the server, you could scan these nodes using Distributed Asset Scan. All you need to do is install remote ServiceDesk Plus MSP servers across departments. These remote servers scan the nodes at regular intervals and export the data to the central ServiceDesk Plus server.
The Request Count displays the total number of requests in the request list view page. Larger the request count value, the longer it takes to display the requests in the list view page.
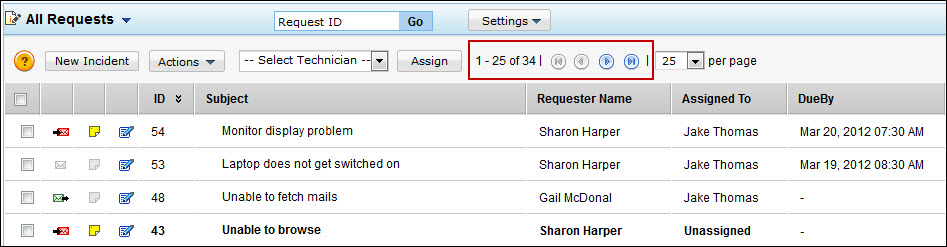
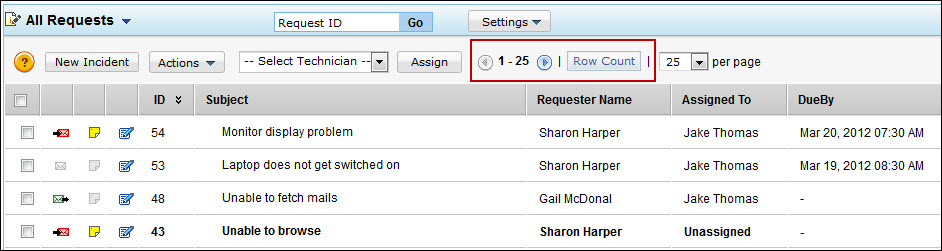
The request count value cannot be removed. Instead you can choose to view the request count, by clicking a Row Count button in the request list view page.
To show the Row Count button, use the query,
update GlobalConfig set PARAMVALUE='FALSE' where CATEGORY='PERFORMANCE' and PARAMETER='SHOW_REQUEST_COUNT';
The Refresh Timer refreshes the request list view page at regular intervals. But this can slow down the performance of ServiceDesk Plus.
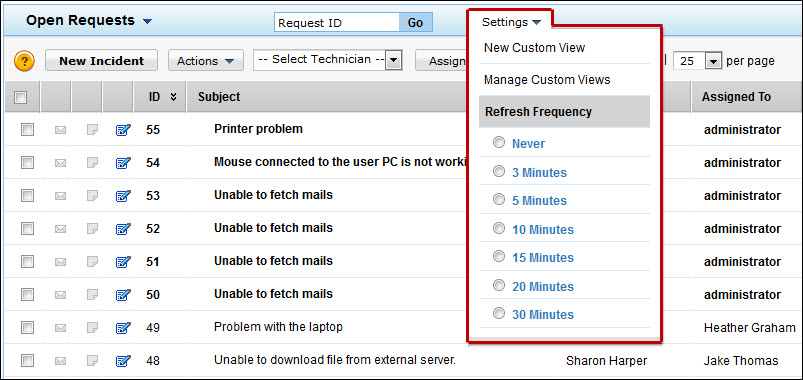
You can disable the Refresh Timer option by using the query,
update GlobalConfig set PARAMVALUE='FALSE' where CATEGORY='PERFORMANCE' and PARAMETER='SHOW_WO_REFRESH_TIME';
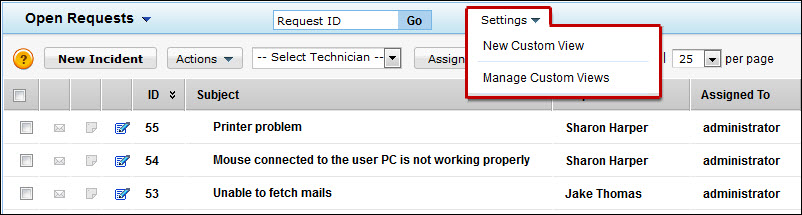
The 'All Requests' filter in the request list view displays all the requests that have been created so far, irrespective of the status. But as the number of requests increases, the performance of ServiceDesk Plus gradually slows down.
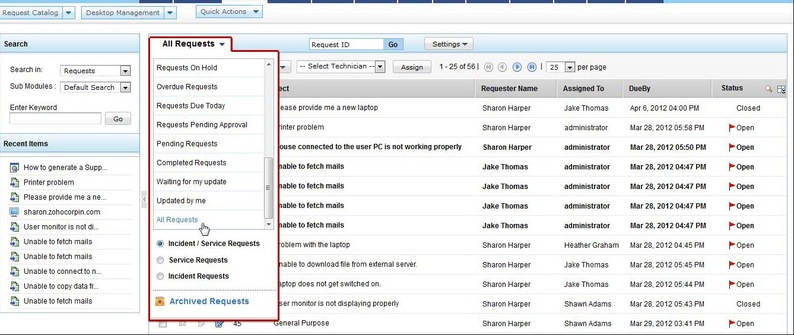
In this case, you can remove the 'All Requests' option from the filter drop-down using the query,
update GlobalConfig set PARAMVALUE='FALSE' where CATEGORY='PERFORMANCE' and PARAMETER='SHOW_ALL_REQUEST_VIEW';
Decrease the number of requests in List View
In the Request List View page, you would find a drop-down menu to select the number of requests to view per page. Limiting this number to 25 or 50 would eliminate loading of requests and improve the performance of ServiceDesk Plus.
Disable Short Description Search
Short Description refers to the description which appears when you hover over the subject link of the request in the request list view. By default, while performing a search operation, the short description of a request would be searched. But when you have large amount of data, the performance of ServiceDesk Plus eventually decreases.
You can disable this feature by using the query,
update GlobalConfig set PARAMVALUE='false' where CATEGORY='SearchShortDescription' and PARAMETER='Status';
By default, the recent items list is deleted once in every 15 days. But you can improve ServiceDesk Plus's performance by increasing the cleanup frequency.
Example: If you want to cleanup the Recent Item list every 5 days, then use the query,
update GlobalConfig set PARAMVALUE=5 where CATEGORY='CLEANUP_TASK' and PARAMETER='CLEANUP_RI_LIMIT';
The maximum limit for cleaning up recent item list is 90. If you want to disable the cleanup, then set the parameter value as -1.
By default, the error log list is deleted once in every 180 days. But you can increase the cleanup frequency to accelerate the backup process.
Example: If you want to cleanup the Error Log list every 30 days, then use the query,
update GlobalConfig set PARAMVALUE=30 where CATEGORY='CLEANUP_TASK' and PARAMETER='CLEANUP_ERROR_LOG_LIMIT';
The maximum limit for cleaning up error log list is 365. If you want to disable the cleanup, then set the parameter value to -1.
It is a table containing the session details i.e., the logged in and logged out information. These entries are not used by the application and can be removed periodically for better database performance. By default, the session details are deleted once in every 90 days but for better performance, you can increase the cleanup frequency.
Example: If you want to cleanup the ACC Session every 30 days then use the query,
update GlobalConfig set PARAMVALUE=30 where CATEGORY='CLEANUP_TASK' and PARAMETER='CLEANUP_ACC_SESSION_LIMIT';
The maximum limit for cleaning up the ACC session details is 365. If you want to disable the cleanup, then set the parameter as -1.
Delete System Generated Notifications
System Generated Notifications are notifications generated and sent by the system. You can either delete all the system notifications or manually check the notifications to delete.
If you want to delete all the system notifications then execute the query,
delete from notification where senderid=1;
To get the list of notification titles to delete unwanted notifications, execute the query,
select notificationtitle from notification limit 100;
Example: If the notificationtitle is 'has been added to the group', then use the query to delete notifications under this title,
delete from notification where notificationtitle like '%has been added to the group%';
By default, the number of user data objects that would be cached is 500. But in case of high-end machines with better RAM configurations, this value can be increased to cache more data for quick response.
Example: If you want to increase the cache count to 1000, then use the query,
update GlobalConfig set PARAMVALUE='1000' where PARAMETER='USER_CACHECOUNT';
Increase Technician Cache Count
By default, the number of technician data objects that would be cached is 300. But in case of high-end machines with better RAM configurations, this value can be increased to cache more data for quick response.
Example: If you want to increase the cache to 1000, then use the query,
update GlobalConfig set PARAMVALUE='1000' where PARAMETER='TECHNICIAN_CACHECOUNT';
Increase Message IDs Cache Count
By default, the number of Message IDs that would be cached is 1000. But in case of high-end machines with better RAM configurations, this value can be increased to cache more data for quick response.
Example: If you want to increase the cache count to 2000, then use the query,
update GlobalConfig set PARAMVALUE='2000' where PARAMETER='MESSAGEID_CACHECOUNT';
Increase E-mail IDs / User IDs Cache Count
By default, the number of E-mail IDs / User IDs that would be cached is 1000. But in case of high-end machines with better RAM configurations, this value can be increased to cache more data for quick response.
Example: If you want to increase the cache count to 2000, then use the query,
update GlobalConfig set PARAMVALUE='2000' where PARAMETER='EMAIL_USERID_CACHECOUNT';
Log File Size Threshold Violation (MSSQL): Best Practices
The recovery model of a database defines how transactions are logged and retained.
There are 3 recovery models in use: Simple, Full, and Bulk Logged. Here, we will discuss only Simple and Full models.
In SQL Server, transaction log files, when not backed up regularly, can grow and cause a database failure because the recovery model, by default, is Full.
To prevent this scenario, DBAdmins can perform:
a) Full recovery model with regular transaction log backups
or
b) Set the database recovery model to Simple.
Full Recovery Model with transaction log backup
In the Simple recovery model, point in time recovery is not possible, whereas it is possible in the Full recovery model.
Therefore, in a production environment, configure your database with the Full recovery model, so that a point in time recovery option is easily available.
Follow these steps to create a backup log file:
In SQL SERVER Management Studio, execute the following query:
BACKUP LOG [<db-name>]
TO DISK = N'<location>\sdp-backup.trn'
WITH NOFORMAT, NOINIT,
NAME = N'<db-name>-Full Log Backup'
Output:

In SQL SERVER Management Studio
Right-click the database that you want to back up, click Tasks > Back Up

In the Back Up Database dialog box, select the Backup type as Transaction Log, under Name, type the name of the backup set, and then click Add.
In the Back Up Database dialog box, under Destination, select Disk, choose the path by clicking Add, and click Ok.

In the Script list, click Script Action to Job.

Provide a name.

From the left panel, click Schedules, and then click New.

In the Job Schedule Properties dialog box, type the job name in the Name box and provide the following values:
Under Frequency, select Occurs daily and Recurs 1 day.
Under Daily frequency, select Occurs every 10 minutes and Starting at 12:00AM and Ending at 11:59PM.
Under Duration select start date as the current date and choose no end date.

Simple Recovery Model
In SQL SERVER Management Studio, execute the following query:
USE [master]
GO
ALTER DATABASE <db-name> SET RECOVERY SIMPLE WITH NO_WAIT
GO
Output


In SQL SERVER Management Studio
Step 1: Right-click Database > Properties


Step 2: Choose Options in select page and change the recovery model.

Note that in the simple recovery model, point in time recovery is not possible.
In the SQL Server Management Studio
Right click your database, go to Tasks > Shrink > Files.

2. In the Shrink File dialog box
i) Under Database files and filegroups choose File type as Log.
ii) Under Shrink action choose Release unused space.

3. Click OK to start shrinking the log file.