Chapter 6:
Measure ROI with hard data
Security professionals gravitate toward technical metrics because they're easier to measure and understand. Counting the number of vulnerabilities patched, security events investigated, or policies updated are great but don't answer the fundamental question: Is the organization actually more secure and better able to support business objectives?
Similarly, security programs become focused on achieving compliance check marks instead of prioritizing genuine risk reduction. Although regulatory compliance is essential, organizations that optimize for compliance scores often develop blind spots in areas not covered by specific regulatory requirements.
Effective metrics measurement requires a balanced approach that connects security capabilities to business outcomes while providing operational insights needed for continuous improvement. Let's break it down into three main categories: business impact, risk reduction, and operational excellence.
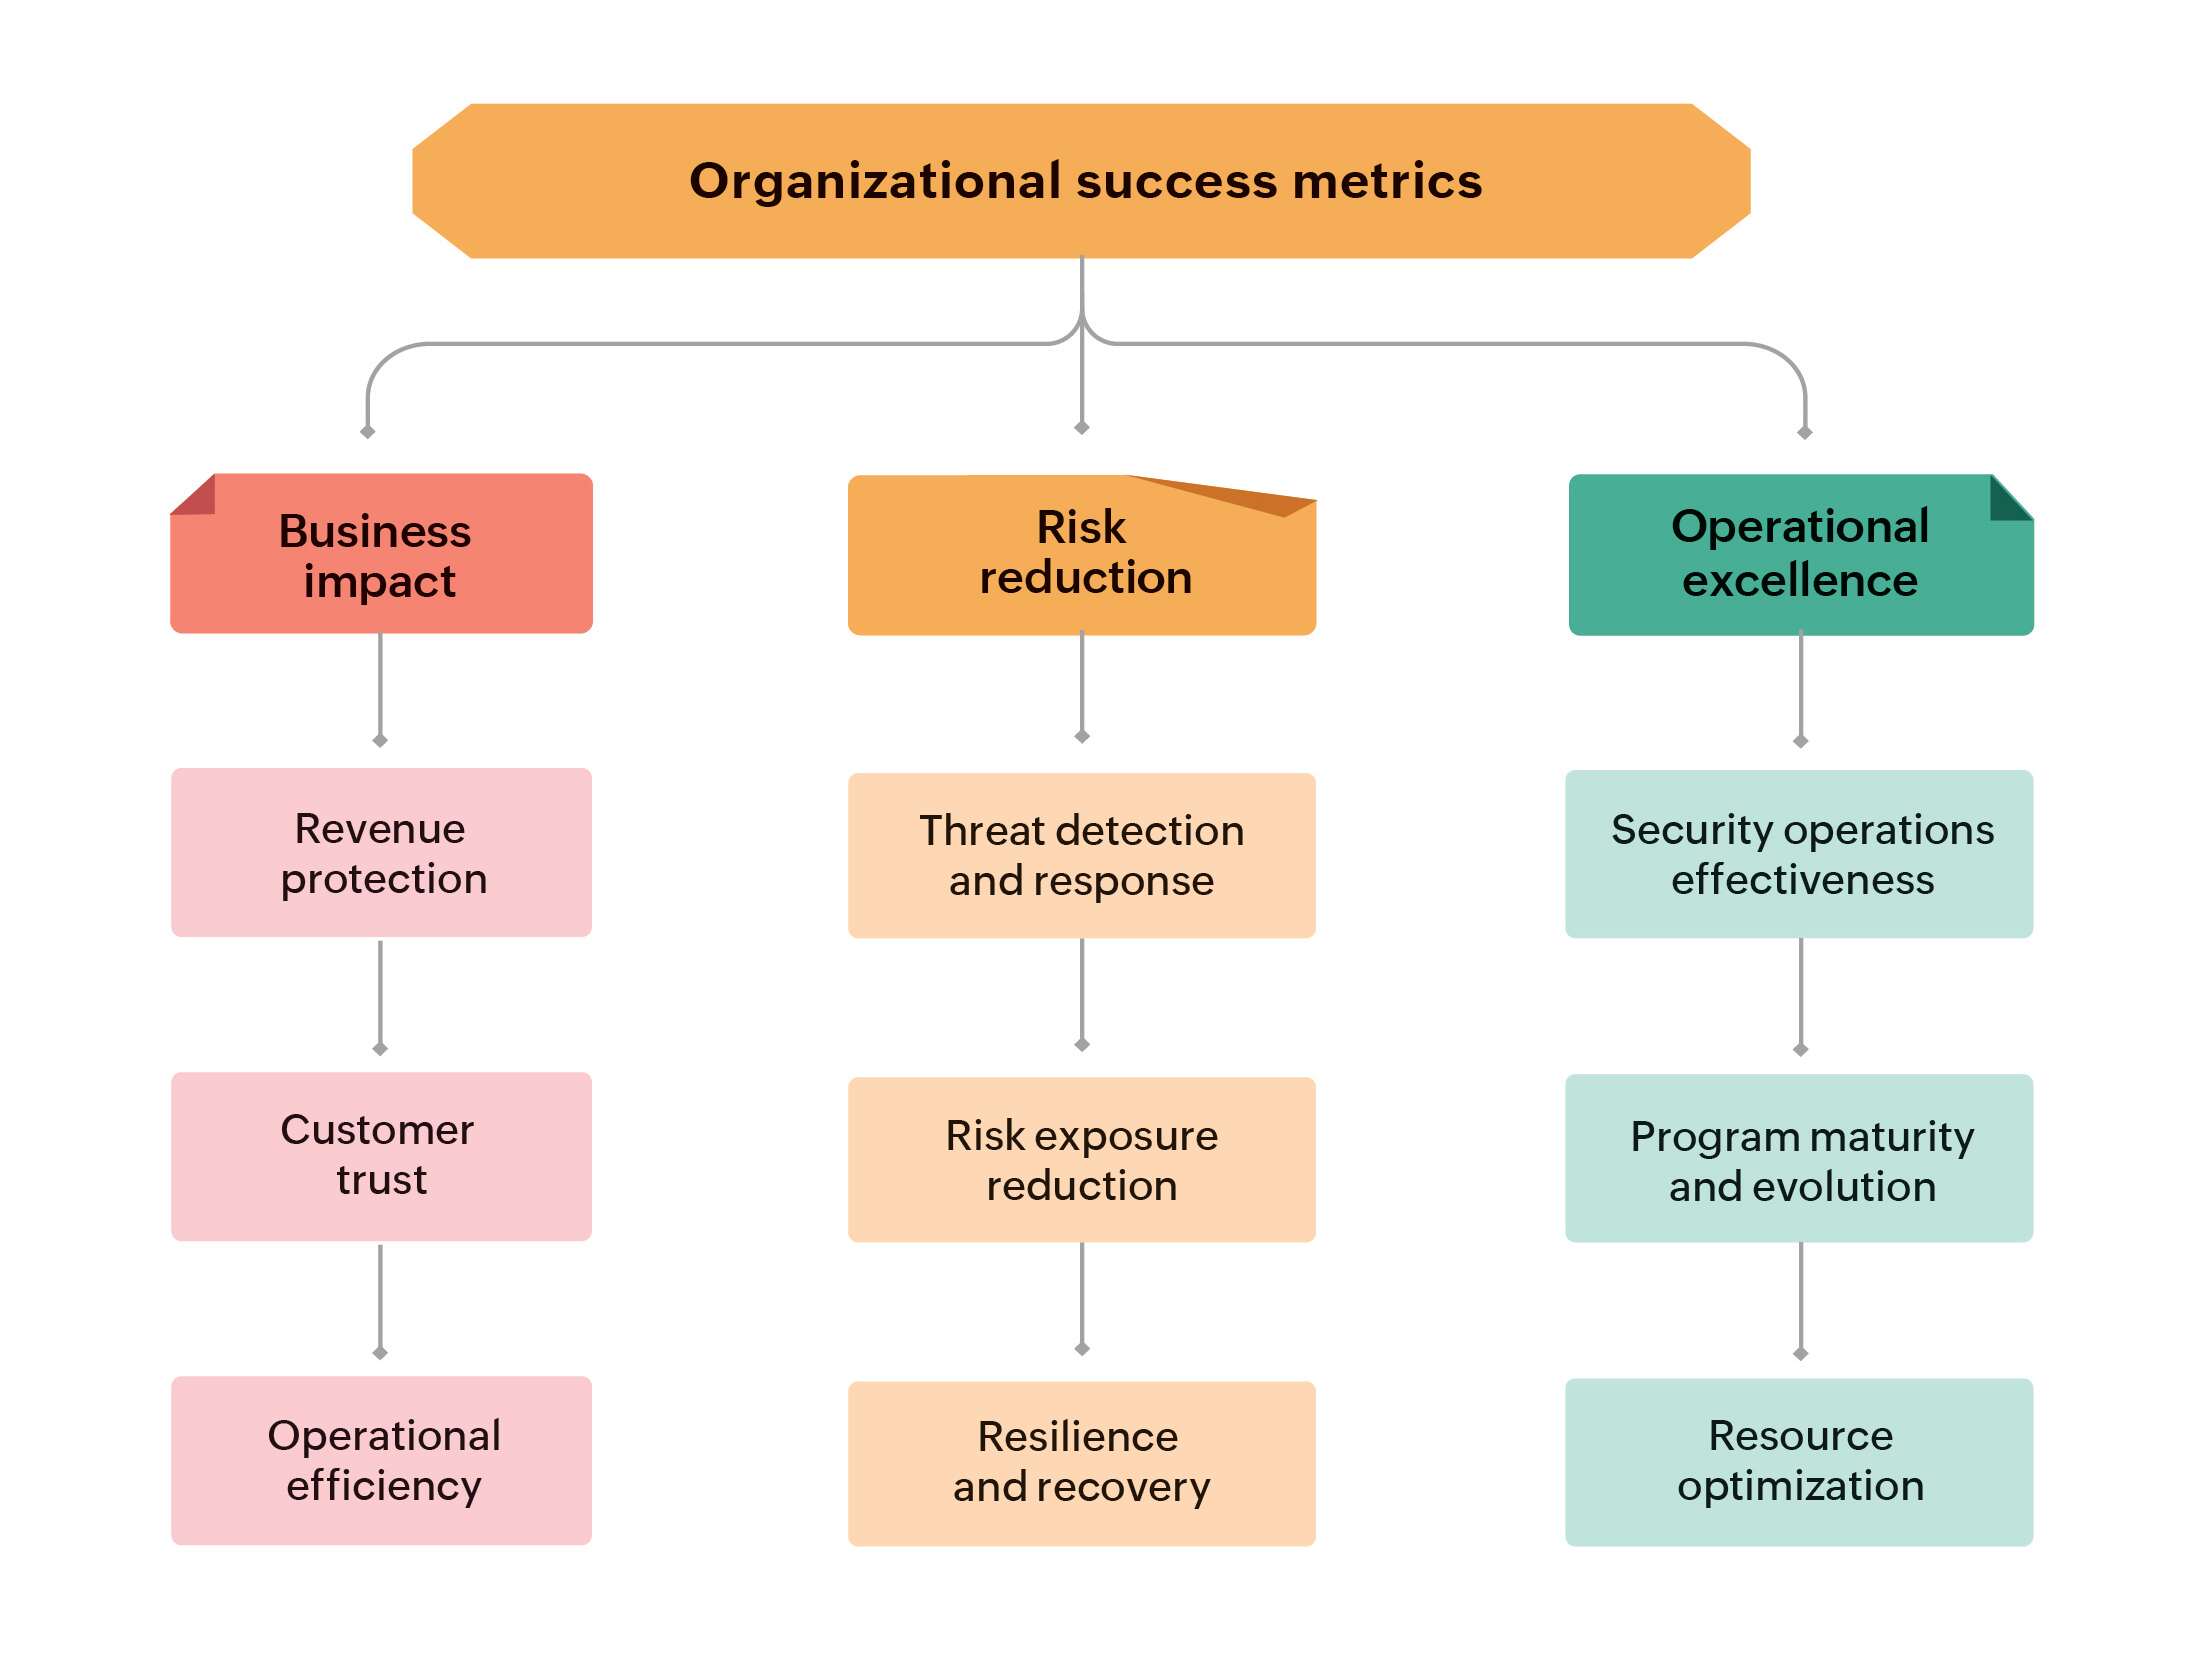
Business impact
A. Revenue protection
| Metric | Sample benchmark | Measurement frequency | Value |
|---|---|---|---|
| Business continuity uptime during security incidents | >99.5% | Quarterly | Direct revenue protection |
| Customer acquisitions enabled by security certifications | Count new deals/markets | Annually | Competitive advantage |
| Incident cost avoidance | $1 million saved | Annually | Quantifiable ROI |
B. Customer trust
| Metric | Sample benchmark | Measurement frequency | Value |
|---|---|---|---|
| Net Promoter Score (NPS) improvement | +5 points YoY | Annually | Customer loyalty |
| Customer audit pass rates | >95% | Annually | User confidence |
| Third-party security assessment scores | Above industry average | Annually | Market credibility |
| Customer churn rate due to security reasons | <2% | Annually | Trust preservation |
C. Operational efficiency
| Metric | Sample benchmark | Measurement frequency | Value |
|---|---|---|---|
| IT help desk ticket reduction | 20% decrease | Quarterly | Resource optimization |
| Employee productivity hours with security automation | +500 hours saved | Quarterly | Efficiency gains |
| Remote work enabled by secure access | 100% workforce coverage | Annually | Business continuity support |
Risk reduction
A. Threat detection and response
| Metric | Sample benchmark | Measurement frequency | Value |
|---|---|---|---|
| Mean time to detect (MTTD) | <24 hours | Monthly | Early threat identification |
| Mean time to contain (MTTC) | <6 hours | Monthly | Damage limitation |
| Mean time to recovery (MTTR) | <48 hours | Monthly | Business continuity |
| Threat detection accuracy rate (true positives) | >85% | Quarterly | Fewer false alarms |
| Alert-to-investigation ratio | 30% | Quarterly | Improved analyst focus |
| Case closure rate | 90% | Quarterly | Strong incident resolution |
B. Risk exposure reduction
| Metric | Sample benchmark | Measurement frequency | Value |
|---|---|---|---|
| Mean time to patch critical vulnerabilities | <4 days | Monthly | Risk mitigation speed |
| Patch success rate | 95% | Quarterly | System resilience |
| Exception processing time | <48 hours | Monthly | Decision-making speed |
| Asset discovery accuracy | 98% | Quarterly | Complete visibility |
| Data classification coverage for sensitive information | >90% coverage | Annually | Data protection |
C. Resilience and recovery
| Metric | Sample benchmark | Measurement frequency | Value |
|---|---|---|---|
| Business continuity plan test success rate | >90% | Quarterly | Preparedness validation |
| Incident response plan execution effectiveness | >85% score | Per major incident | Response coordination |
| Backup integrity test success rate | >95% | Monthly | Data recoverability |
Operational excellence
A. Security operations center (SOC) effectiveness
| Metric | Sample benchmark | Measurement frequency | Value |
|---|---|---|---|
| Automated response coverage | >60% of incidents | Quarterly | Operational scaling |
| Incidents handled per day | Baseline + 10% annually | Annual | Improved SOC capacity |
| Security tool consolidation | 10% tool reduction | Annually | Complexity reduction |
| Knowledge base utilization | >70% for common issues | Quarterly | Knowledge management |
| Security training completion | >90% | Annually | Employee awareness |
B. Program maturity and evolution
| Metric | Sample benchmark | Measurement frequency | Value |
|---|---|---|---|
| Compliance audit findings reduction | 20% fewer findings YoY | Annually | Continuous improvement |
| Security policy exception rate | <10% of requests | Quarterly | Policy adherence |
| Proactive vs. reactive security initiatives ratio | 70% proactive | Quarterly | Strategic focus |
C. Resource optimization
| Metric | Sample benchmark | Measurement frequency | Value |
|---|---|---|---|
| Security ROI: business value per dollar invested | >3:1 ratio | Annual | Investment efficiency |
| Security team retention rate | >85% annually | Annually | Talent stability |
| Time-to-productivity for new security hires | <90 days | Per hire | Onboarding effectiveness |
| Security program cost per employee | <$500 per employee | Annually | Efficient program spending |
Additional KPIs
-
Cybersecurity culture index:
A qualitative KPI that assesses the overall awareness and attitudes towards cybersecurity across an organization. Security leads can also measure phishing simulation click rates and security incident reporting rates to determine this value.
-
Leadership security advocacy:
How actively executives across the organization champion security initiatives and model security-conscious behaviors. Security efforts shouldn't be viewed as solely the CISO's responsibility.
-
Regulatory relationship health:
The quality of interactions with regulators and auditors — cooperative partnerships where regulators view the organization as proactive and transparent, versus adversarial relationships marked by enforcement actions and compliance struggles.
-
Industry peer standing:
The CISO's and organization's reputation within the cybersecurity community through thought leadership, speaking engagements, and recognition as a security innovator.
Not every metric applies to every organization, but tracking the right combination provides visibility into security operations efficiency and opportunities for improvement. The key lies in selecting metrics that align with the organization's risk tolerance, business objectives, and maturity level.