MongoDB is a NoSQL, document-oriented database that stores data in flexible, JSON-like BSON format, enabling high scalability and performance. It supports powerful querying, indexing, and real-time analytics, making it ideal for modern applications. With features like replication, sharing, and built-in security, MongoDB is widely used for cloud-based and big data applications.
The MongoDB extension for Log360Cloud enables integration of MongoDB logs into the Log360 Cloud ecosystem. This extension provides features such as log collection, parsing, reporting, alerting, correlation, and advanced log search capabilities.
Navigate to the bin folder of MongoDB and open the mongod.cfg configuration file using a text editor.
To enable auditing in Mongodb:
auditLog:
  destination: file
  format: JSON
  path: /var/log/mongodb/auditLog.json
  filter: '{ "param.command": { $nin: ["hello","isMaster","dbStats" ] } }'
To generate DML audit logs, MongoDB must capture successful authorization events. By default, MongoDB only audits authorization failures. To enable auditing for successful authorization events, add:
setParameter:
  auditAuthorizationSuccess: true
After making the configuration changes, restart the MongoDB service for them to take effect. You can do this by opening the Services console and restarting the active MongoDB service. Alternatively, open command prompt as an administrator and execute the following commands:
For Windows:
For Linux:
After installing the MongoDB extension in Log360 Cloud, configure the scheduled import for the auditLog file from the MongoDB server file path.
Navigate to Settings → Configuration → Log Source Configuration → Import Logs → From Device
Sample pattern: auditLog.json.${yyyy}-${MM}-${dd}T${HH}-${mm}-${ss}
Here are the types of audited events captured from MongoDB in Log360 Cloud:
| Category | Events |
|---|---|
| DDL auditing | Database created, Database dropped, Collection created, Collection dropped, Collection renamed, Index created, Index dropped, DDL summary |
| DML auditing | Select queries, Insert queries, Update queries, Delete queries, Aggregation queries, Meta data queries, DML summary |
| Execution analysis | Failed queries |
| Auditing account management | Role created, Role dropped, Role updated, Grant operations, Revoke operations, Password changed, User created, User dropped, User updated, Failed account management queries |
| Logon events | User logon, Failed user logon, User logoff, Logon/logoff trends |
| Server events | Startup, Shutdown |
To view MongoDB reports, navigate to the Reports tab and select MongoDB from the Custom Reports sub-tab.

To view the correlation rules, navigate to the Correlation tab -> Manage Rules.
In the Manage Rules page, select MongoDB as the Rule Category to filter out the related correlation rules. You can enable them manually by selecting the rule and clicking on Activate in the Rule Status column.

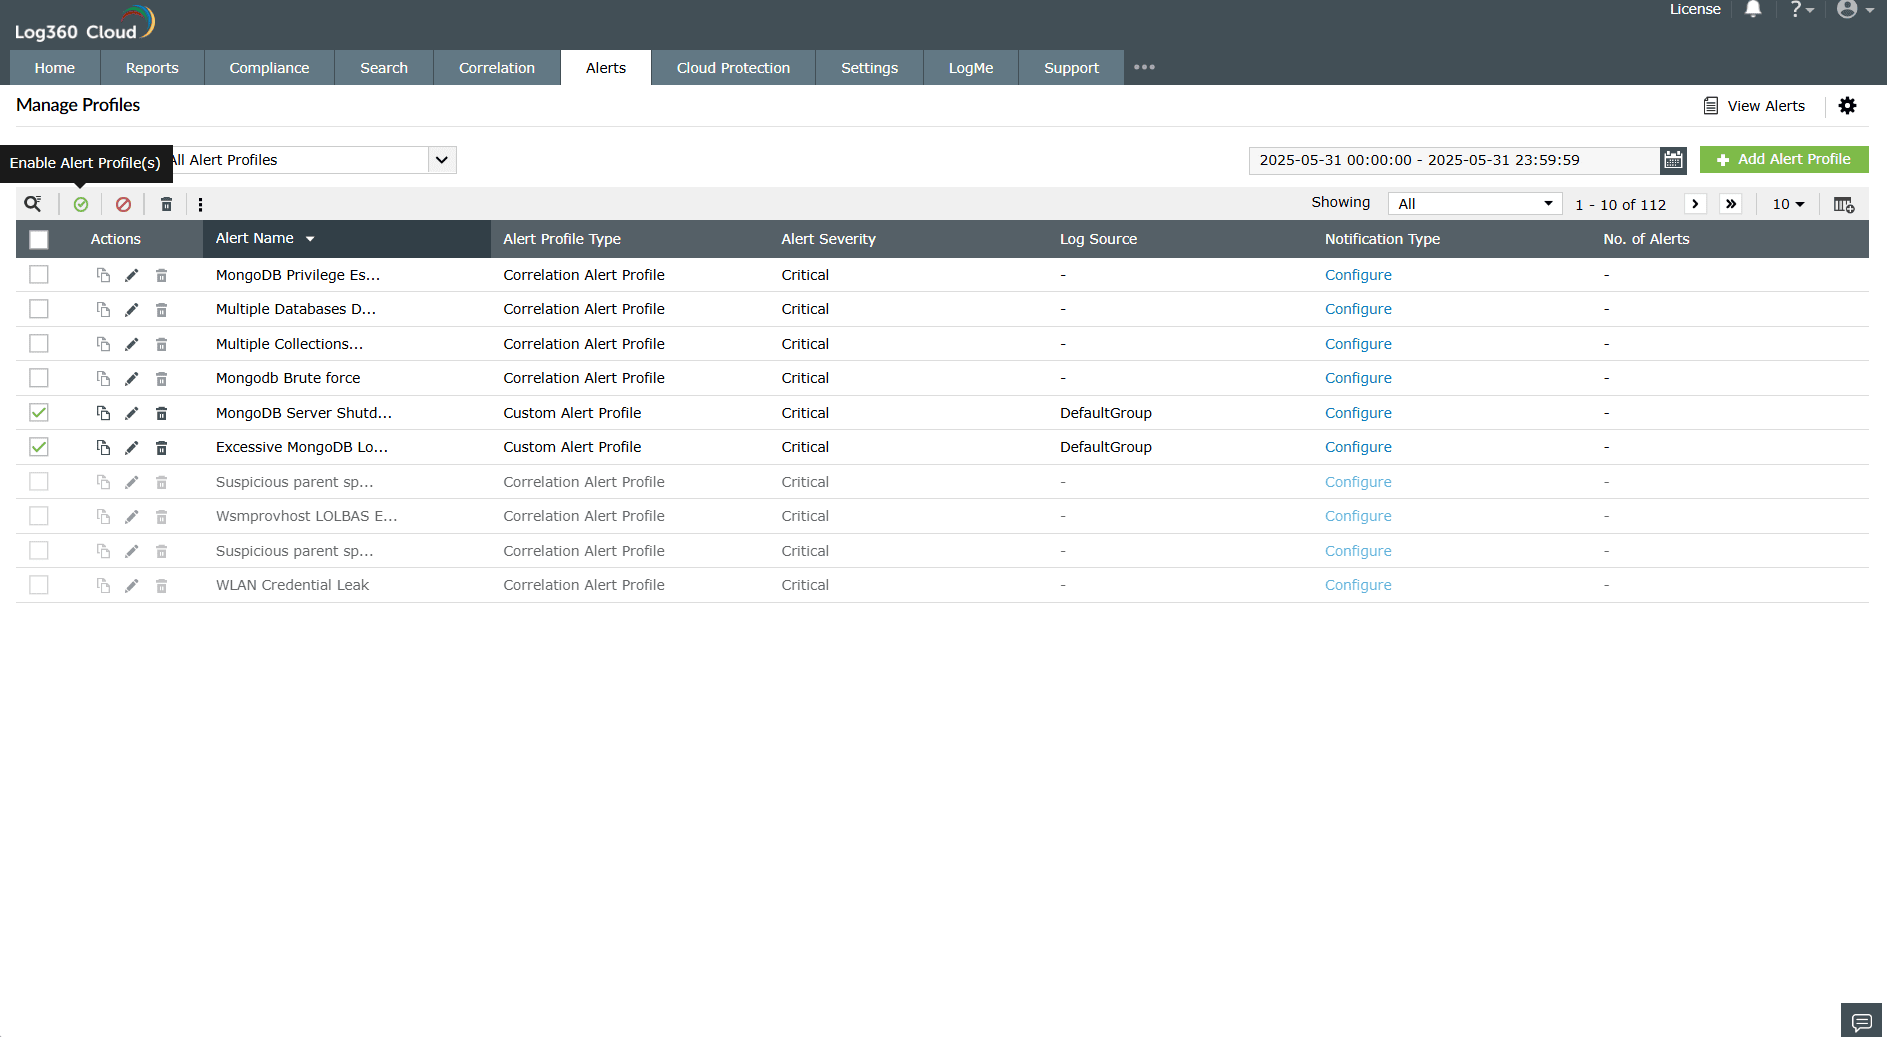
To view the Alerts, navigate to the Alerts tab -> Manage Alert Profiles.