Storage monitoring software
OpManager helps you proactively manage the health, performance, and capacity of your disk arrays, SAN and NAS devices, storage volumes, and everything in between
- 30+ storage vendors supported out of the box
- Gain visibility into pools, LUNs, disks, & volumes
- Monitor RAID, tape libraries, & FC switches
- Predict storage trends with AI-based forecasting
What is storage monitoring?
Storage monitoring is the process of tracking the capacity, performance, and uptime of digital storage systems. Storage monitoring software allows IT teams to track capacity utilization, IOPs, latency, and throughput of storage devices, helping them ensure business continuity. Storage monitoring software like ManageEngine OpManager goes one-step further with in-built AI: analyzing and predicting storage usage trends to optimize capacity planning.
OpManager's storage monitoring capabilities
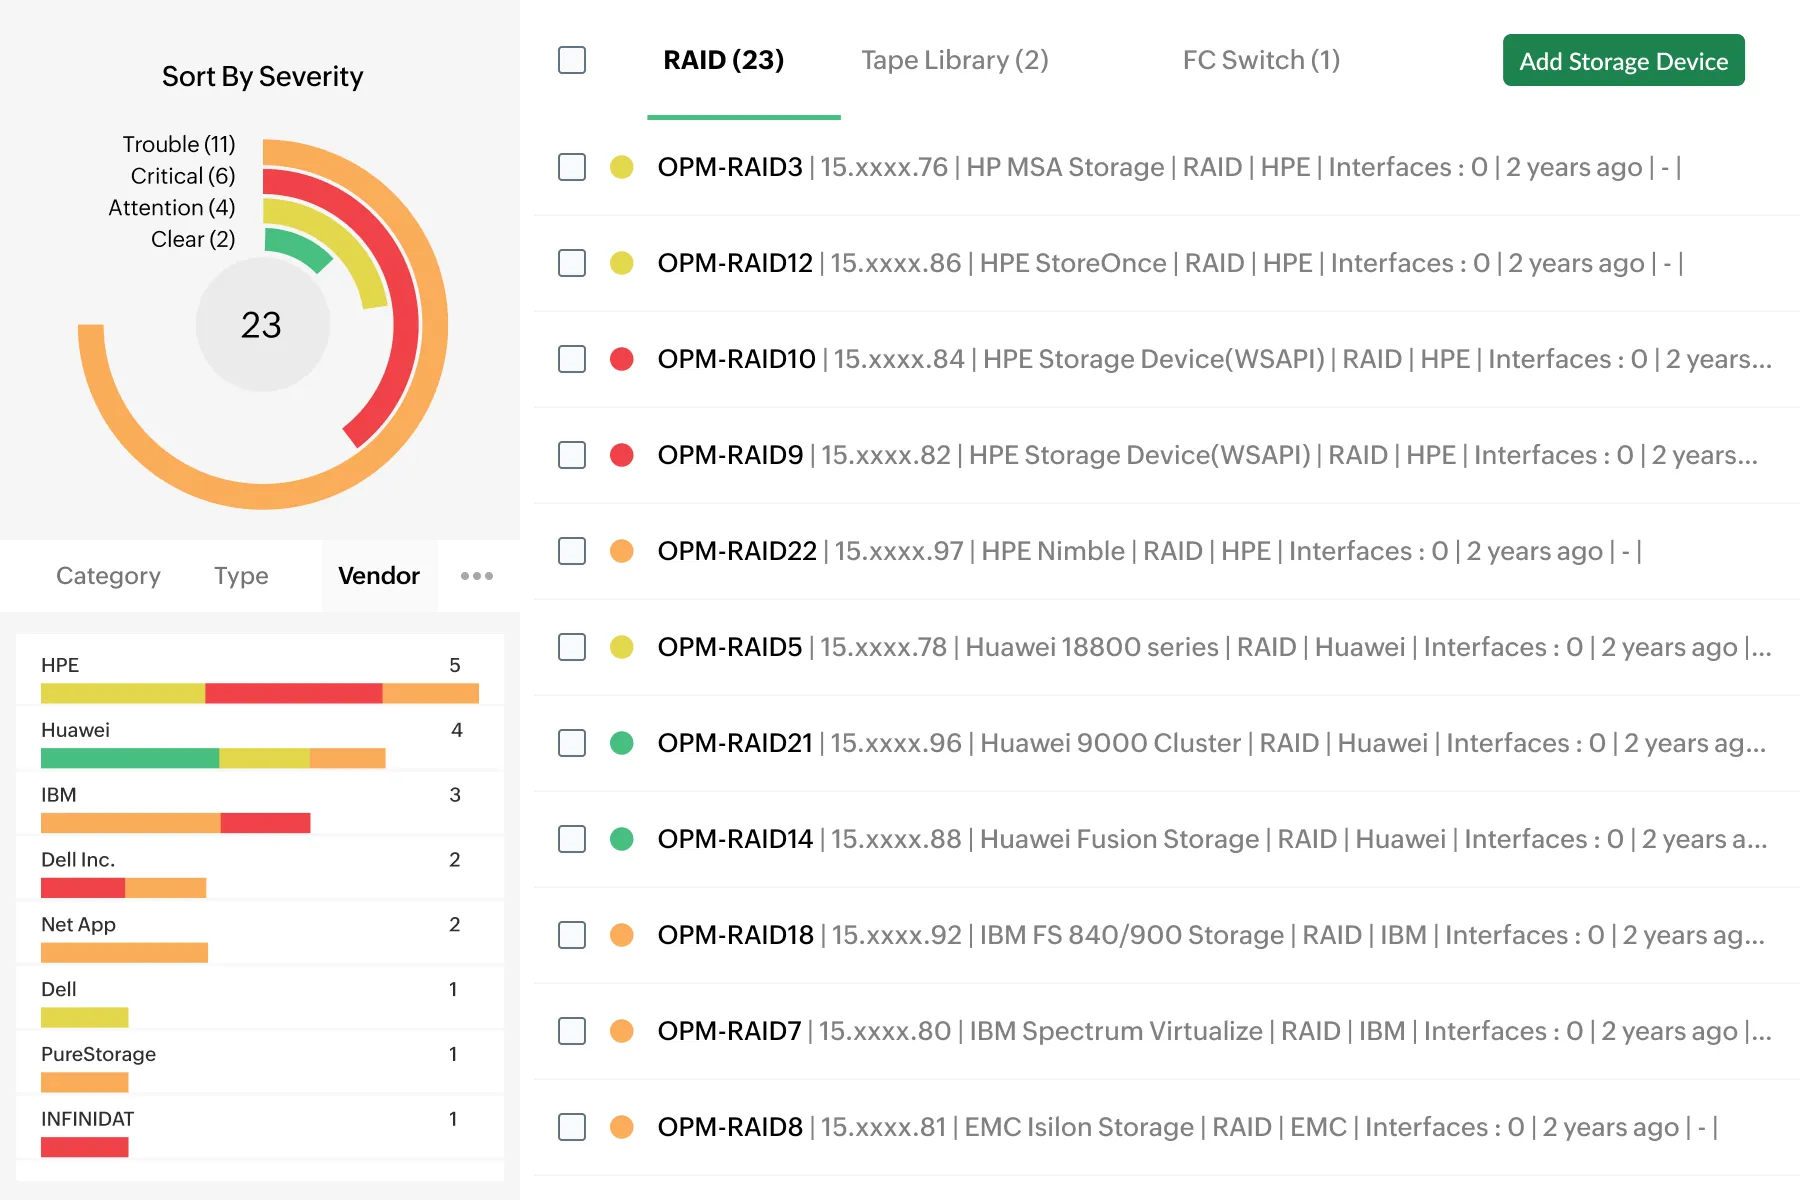
Gain visibility into network-attached storage devices
- OpManager uses protocols like the storage management initiative specification (SMI-S) as well as vendor APIs to automatically discover and classify network attached storage (NAS) devices in your network.
- Devices are neatly classified based on technology, vendor, model, and hierarchy on OpManager's storage inventory.
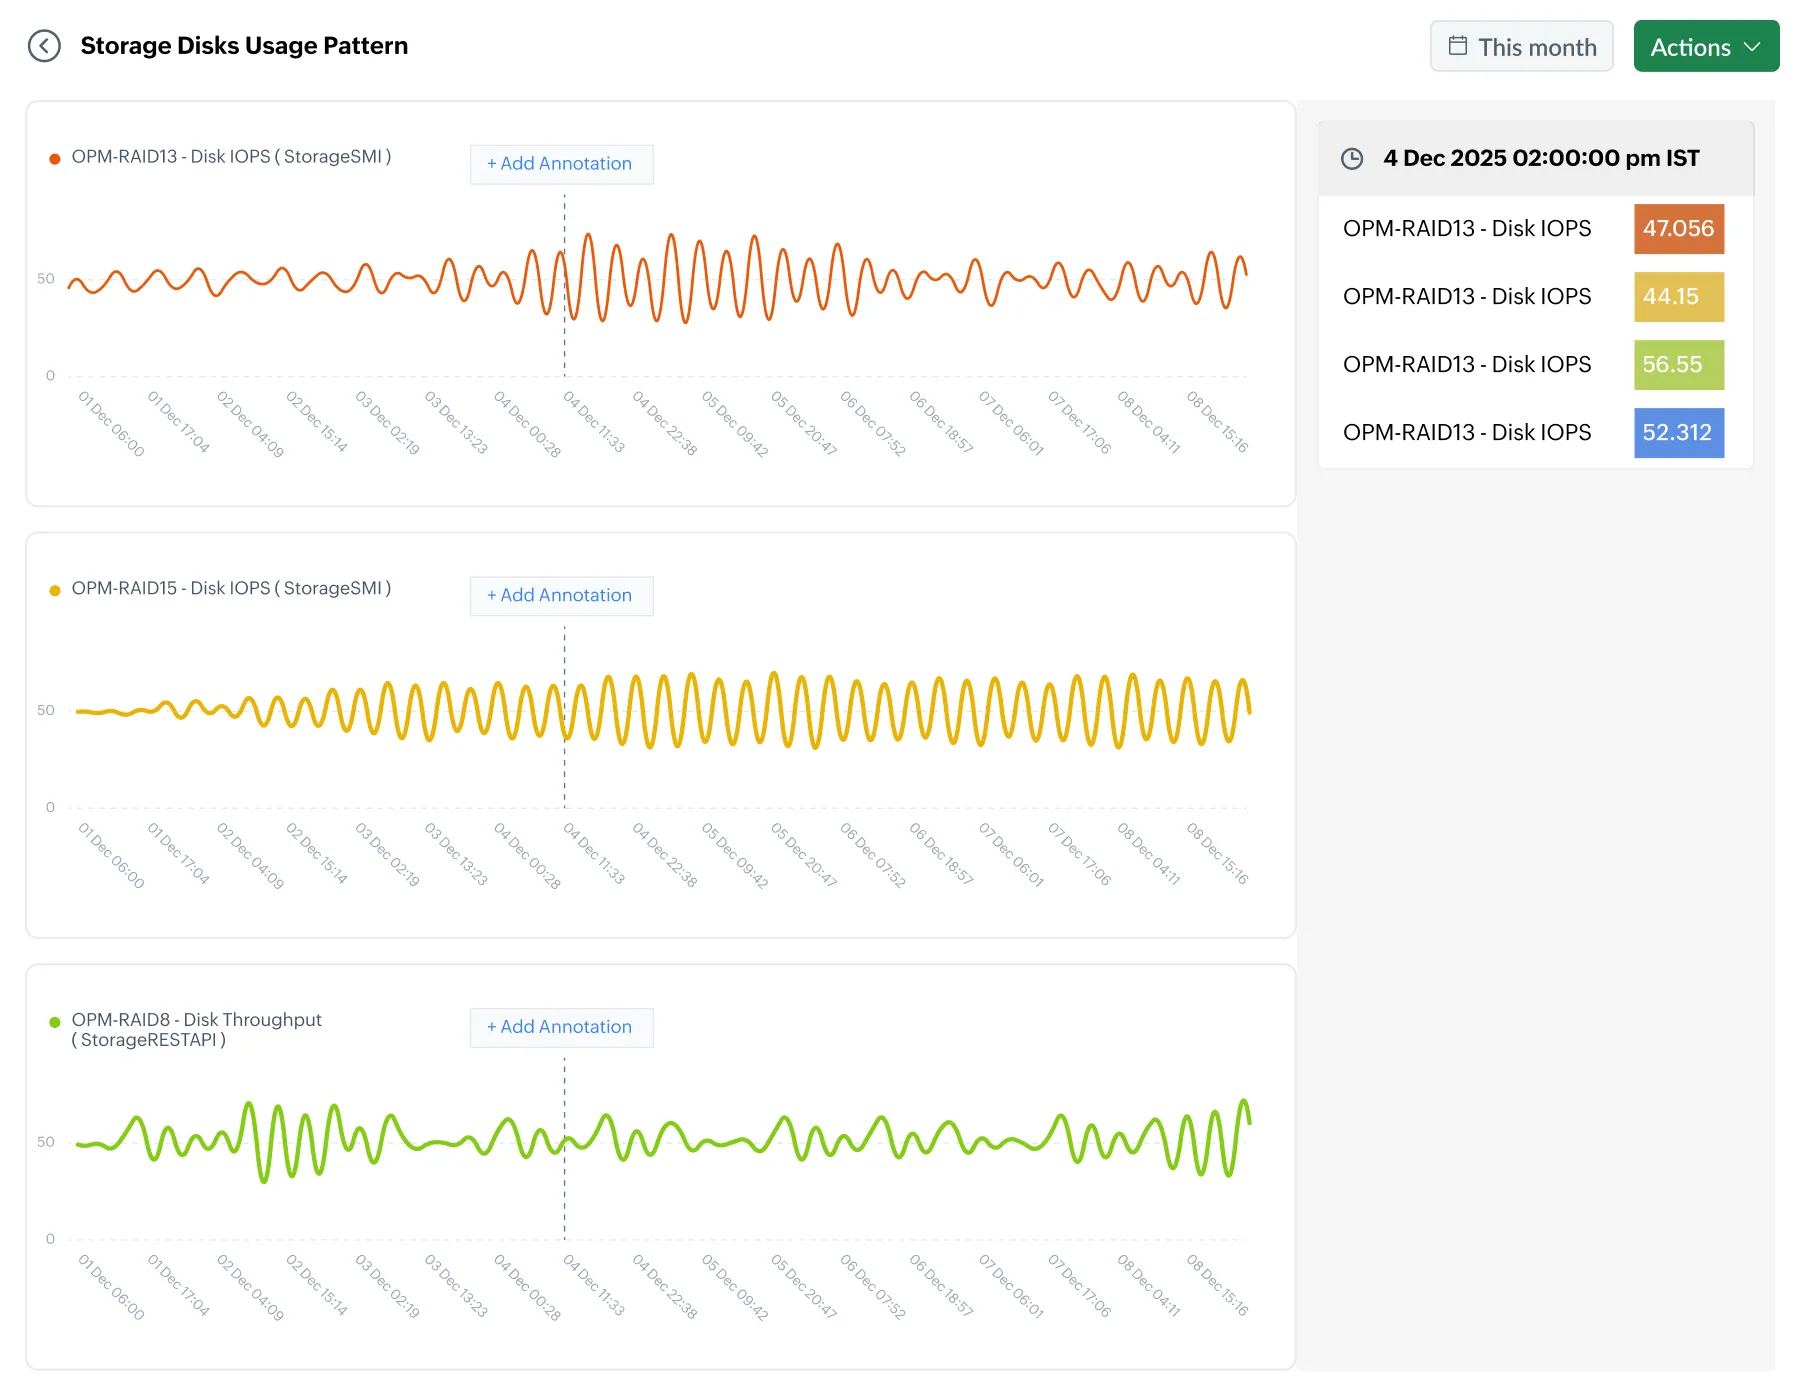
- Go in-depth into RAID arrays, tape libraries, and FC-switches with dedicated performance monitors and pre-built reports.
Prevent capacity crunches with proactive monitoring
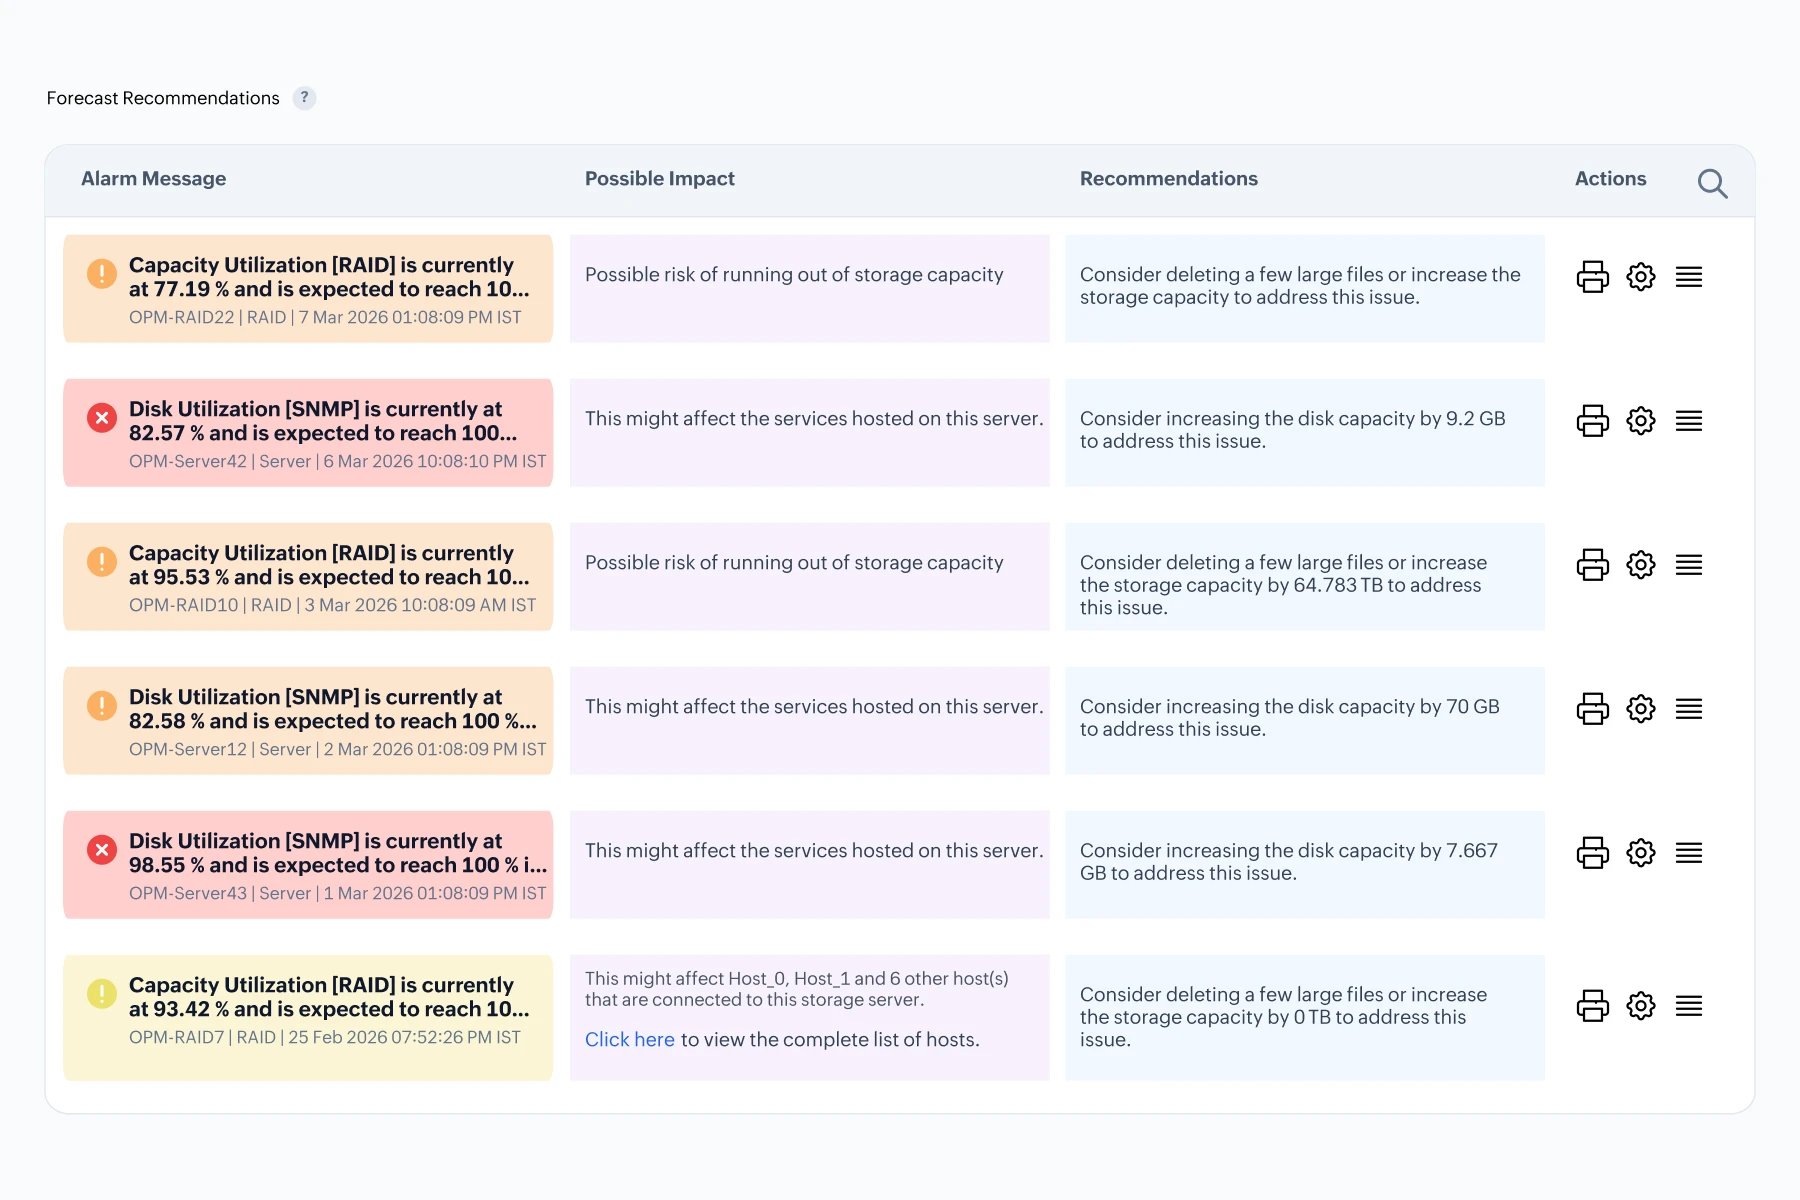
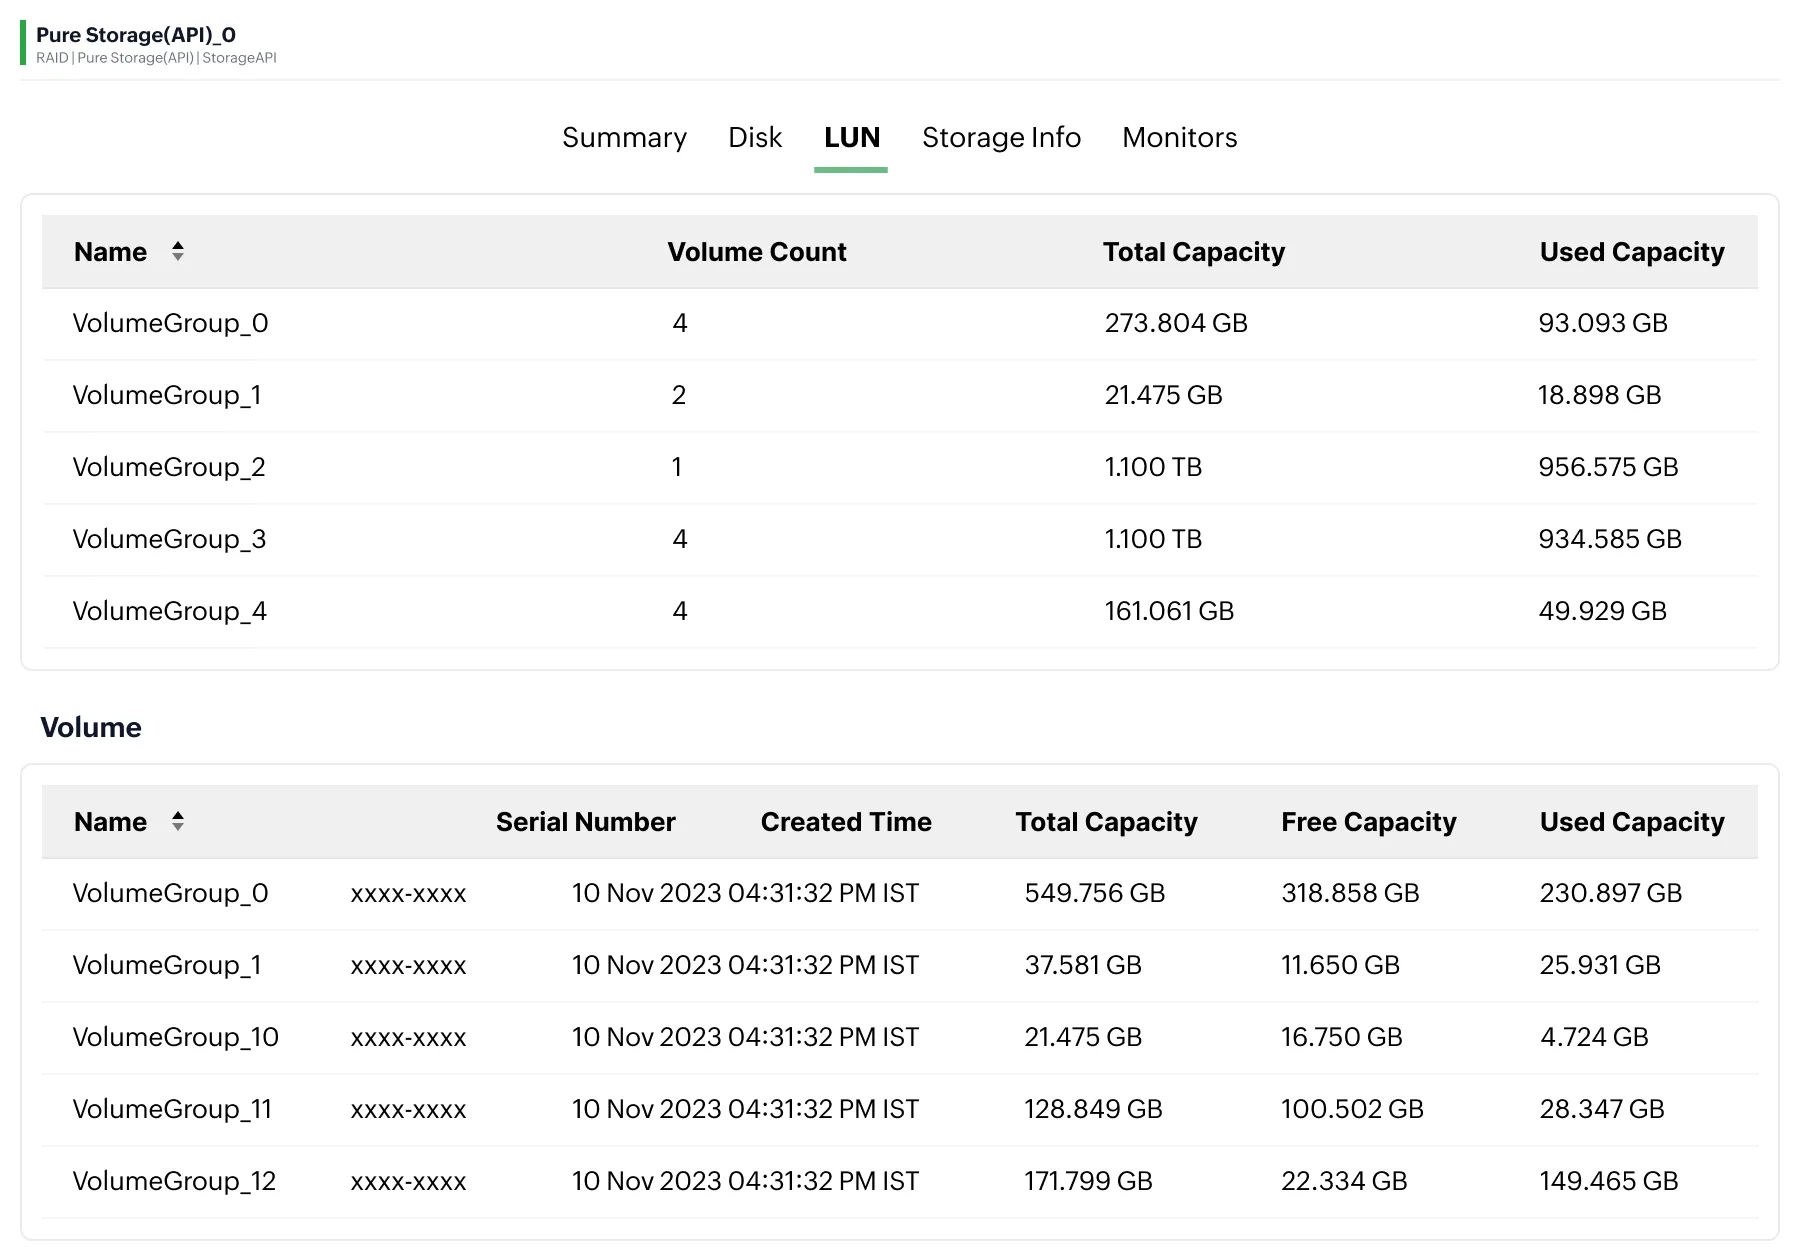
- OpManager provides visibility into the capacity used by your NAS and SAN devices at every level of storage: whether they are physical or virtual disks, storage pools, volumes, or tapes.
- You can configure alerts to trigger days or weeks before your storage capacity reaches critical levels with AI-driven forecast alarms.
- You can also set up notifications via email, SMS, mobile notifications, and third party chat apps to ensure that you never miss an alert.
Monitor latency to enhance storage performance
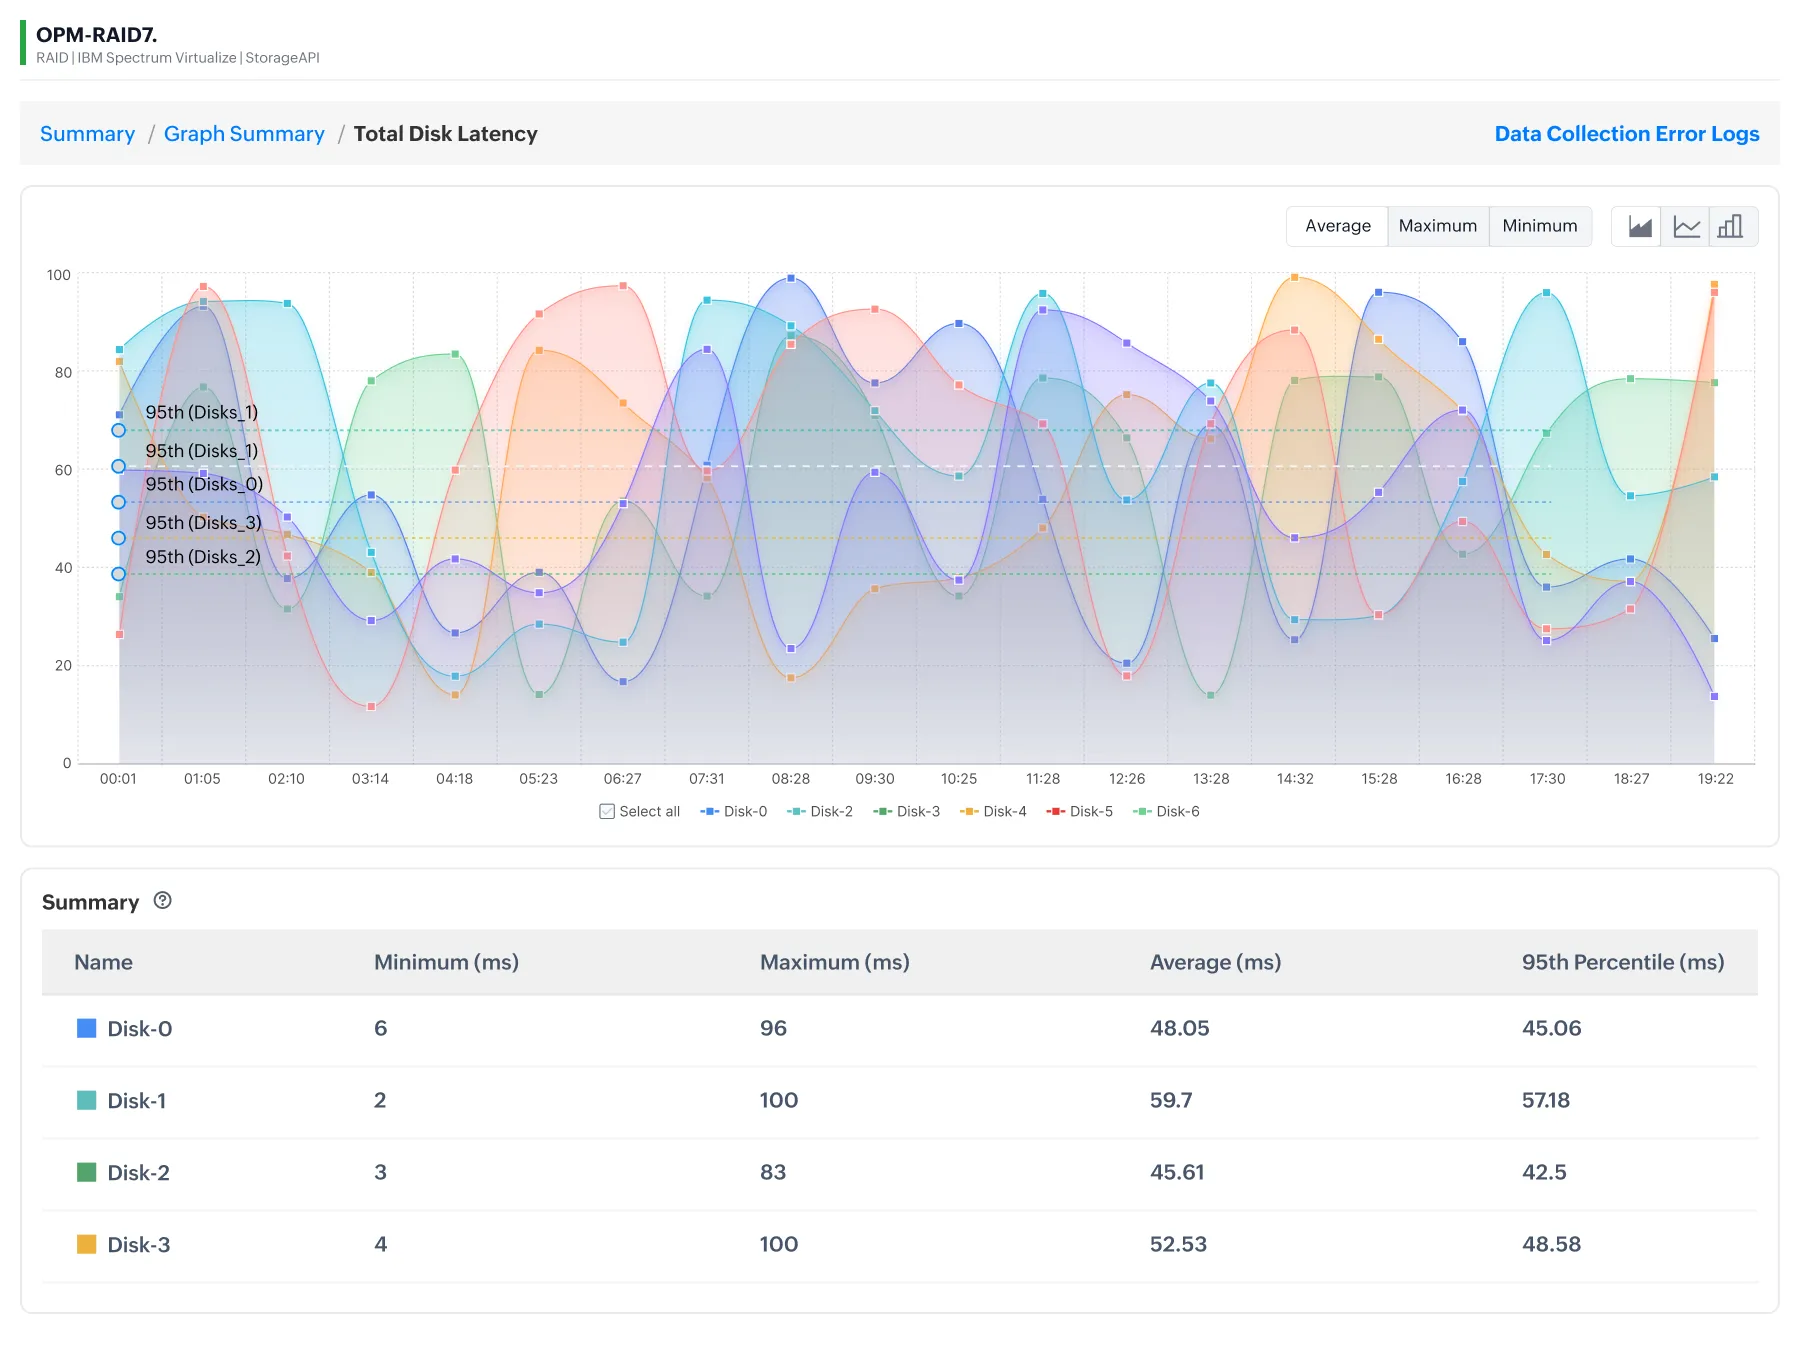
- OpManager helps you detect latency by monitoring input/output operations per second (IOPS), read/write latency, and read/write throughput at the disk, LUN, RAID, and NAS level.
- You can enable AI-driven monitoring set automatically set multi-level alarm thresholds for key storage performance metrics across thousands of devices.
- You can also assess storage performance with colour-coded graphs and forecast key performance metrics for the next hours, days, weeks, and months.
Monitor hardware health to prevent unplanned outages
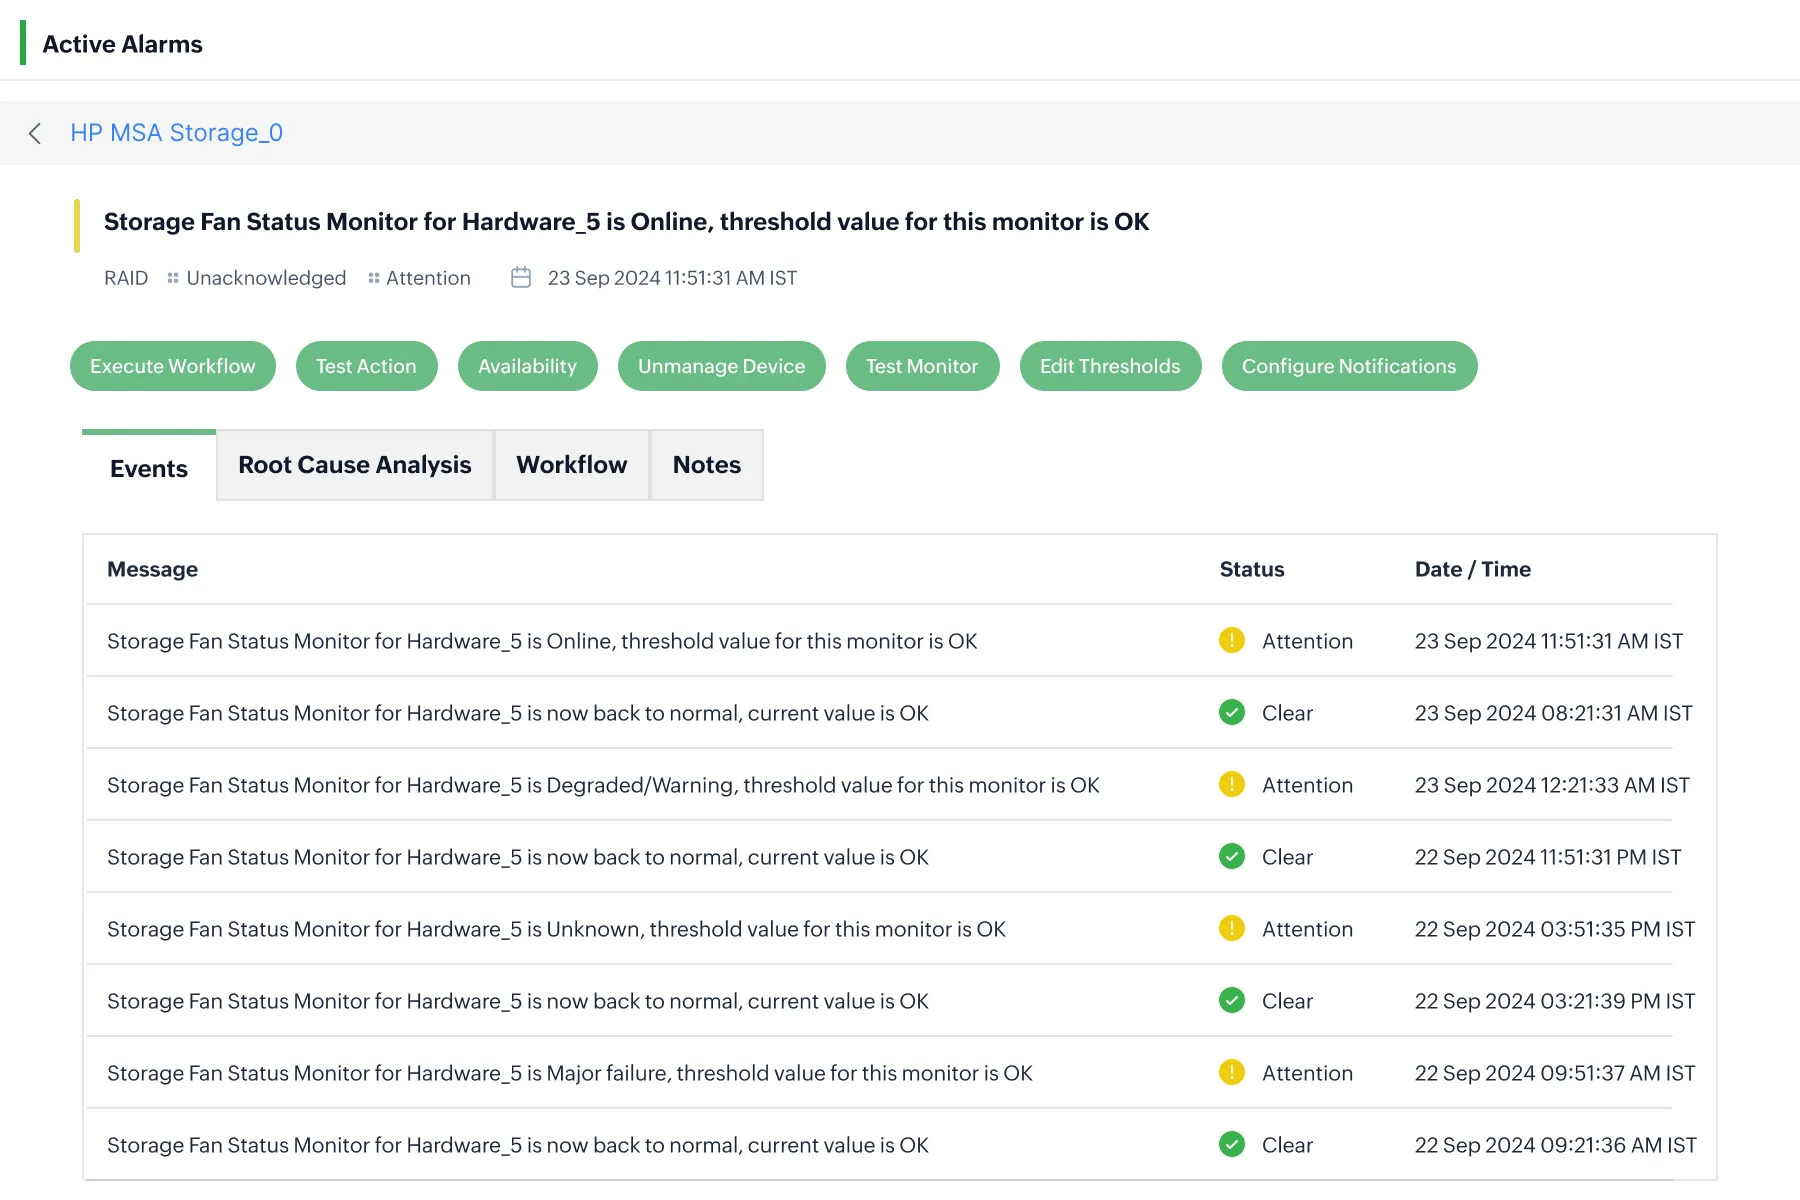
- Prevent hardware degradation by monitoring Ethernet ports, FC ports, SAS ports, nodes, chassis, power supply units, and batteries at regular intervals.
- Track the temperature and cooling fan speed of your storage systems to find and fix overheating components.
- Leverage built-in hardware health reports to review the health of storage systems and to identify failing components.
Optimize storage area networks with in-depth monitoring
- Gain in-depth visibility into LUNs, volumes, and storage pools used in your SAN infrastructure.
- Monitor FC switches used to route SAN connections, keep tabs on port status, port traffic speed, and port interconnects.
- Monitor high-speed networks like Fibre Channel (FC) or iSCSI to track SAN traffic.
Storage device vendors supported in OpManager
RAID arrays
- Dell
- Fujitsu
- Hitachi
- HPE
- Huawei
- IBM
- Oracle
- Everpure (Pure Storage)
Tape libraries
- IBM
- HPE
- ADIC (Quantum)
- ATL (Quantum)
- OverLand
- Qualstar
- Spectra Logic
- StorageTek (Oracle)
FC switches
- Cisco
- SNIA
Why choose OpManager as your storage monitoring software?
Multi-vendor compatibility
OpManager comes with exclusive templates for 30+ vendors along with custom storage monitoring templates.
Enterprise storage scalability
OpManager can monitor enterprise-scale storage arrays, from a few hundred devices to 50,000 devices from a single console.
AI-driven monitoring
ManageEngine's in-house AI, Zia is built into OpManager as an AIOps assistant to process real-time IT data securely.
Full-stack observability
By enabling the Applications Manager plugin, you can monitor applications, databases, and cloud storage provided by popular vendors.
FAQs about storage monitoring software
- Track performance metrics: Watch key indicators like IOPS, throughput, and latency to spot slowdowns.
- Manage capacity: Track usage trends over time so you can plan for future storage needs.
- Manage faults: Find and fix problems fast, such as failed disks or degraded RAID arrays.
- Protect data integrity: Run regular backups so you never lose critical data.
- Optimize resource allocation: Keep an eye on storage capacity and plan resources based on real usage.
- Monitor protocols: Check the performance of iSCSI, NFS, and SMB connections.
- Ensure security and compliance: Block unauthorized access and stay aligned with industry standards.
- Better performance: Spot bottlenecks before they cause problems, and put resources where they're needed most.
- Lower costs: Use usage trends to plan upgrades at the right time. This helps you avoid buying too much or too little storage.
- Less downtime: Catch and fix issues quickly, so your systems stay up and running.
- Stronger data security: Ongoing monitoring lowers the risk of breaches and keeps you compliant with data protection rules.
- Faster troubleshooting: A single view of storage health and performance helps your team find root causes during an incident.
- Better planning for the future: Monitoring data helps you predict what your storage needs will look like down the road.
Step 1: Discover your devices
- Go to the Discovery section in OpManager.
- Use the storage discovery feature to find devices automatically. Just enter your IP ranges or specific IP addresses.
- Assign the right device templates during discovery. This ensures OpManager maps the correct monitoring parameters to each device.
- Open the Performance Monitors module.
- Choose which metrics to track for each storage device, such as IOPS, latency, and capacity.
- Set up threshold-based alerts for critical metrics. This way, you'll get notified the moment something needs attention.
- Customize your dashboards for a live view of storage health and performance.
- Schedule reports on usage trends, faults, and protocol performance to stay on top of things without manual checks.
Want more detail? Check out our documentation on how to set up storage monitoring.
- IOPS (input/output operations per second): Shows how many read and write operations your storage can handle.
- Latency: Measures how long it takes to complete a request. High latency often signals a bottleneck.
- Throughput: Tracks how much data moves through your storage system over time.
- Capacity utilization: Shows how much storage space is used versus available, so you can plan ahead.
- Disk health: Flags early signs of hardware failure, like bad sectors or rising error rates.
- Real-time alerts: Set these up for critical issues like failed disks or capacity thresholds. You want to know the moment they happen, not hours later.
- Daily checks: Review dashboards for anomalies in performance metrics like latency and IOPS.
- Weekly reviews: Look at usage trends and protocol performance to catch slow-building issues.
- Scheduled reports: Use these for capacity planning and budget decisions. They help you spot long-term patterns that daily checks might miss.
Dig deeper into storage monitoring
How to perform capacity planning with ML-driven insights
Different types of forecasting, how they work, and best practices: all rolled into one definitive guide.
Learn more →Unlock more value with add-ons
Extend easily with complementary products — add deeper traffic visibility, configuration management, and more.
Bandwidth monitoring
Layer NetFlow-based traffic analysis to see who and what is driving every byte across the network.
Try free trial →Firewall management
Audit firewall rule changes, spot shadow rules, and tie every config change back to the network event.
Try free trial →Network configuration
Back up configs, detect drift, and push standardized changes across thousands of devices.
Try free trial →