Server virtualization has been a rising trend in the IT industry over the past decade and for good reason. Virtual devices are generally more efficient than their physical counterparts. While they might experience occasional performance issues, their advantages outweigh their problems. Consequently, virtual servers are integral components of data centers and server arrays all over the world.
Virtual servers aren't different from physical servers from the perspective of the users. A virtual server acts like an independent physical device, its hypervisor pulls systems resources from the host devices and allocates them to the virtual devices based on their needs. When users request IT services like websites or open web-based applications, the virtual server provides the necessary information or hosts applications. For the most part, the customers can't differentiate between physical and virtual servers.
For the IT organization, virtual servers offer innumerable advantages. Virtual servers are used as redundancies along with physical servers to ensure that services remain operational in case of an emergency.
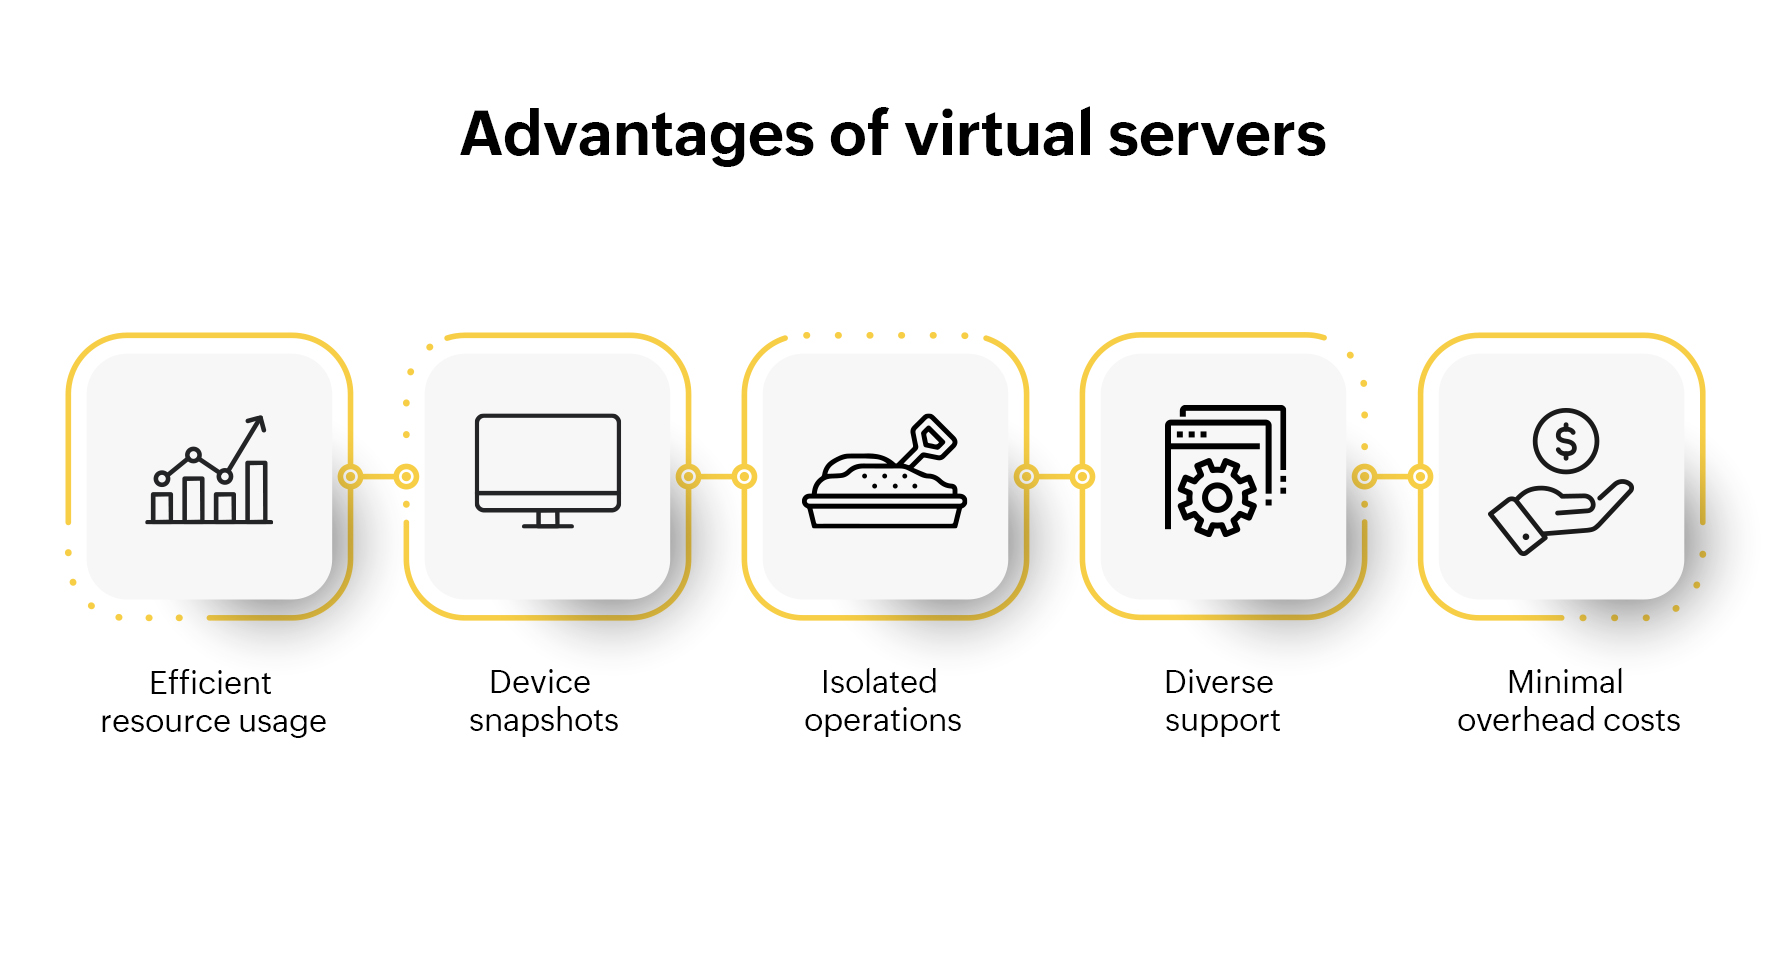
Issues with virtual servers can easily frustrate your customers. This is particularly true for VMs handling websites and applications. If left unmonitored, the reputation and revenue of your company are left to chance, which is not recommended. Creating virtual machines is known as "spinning up a VM" and it's a relatively easy task. Deleting them is also easy. Network admins can create snapshots of VMs and tinker with them because the previous version can be restored anytime. But this convenience might cause more harm than good. Let's see some of the problems caused by an overabundance of VMs.
VM sprawl: This is a commonly encountered problem with virtual servers. The number of useless VMs in a host is too high and they compete for host resources which often results in a drop in performance for the useful virtual servers and the host device. It's difficult to track redundant VMs and they can run for years undetected utilizing valuable disk space, memory, and CPU, leading to VM sprawl.
Single point of failure: Multiple virtual servers are hosted on a single physical host device in virtualised server clusters. This represents a single point of failure. If the host device goes down, the entire virtual installation is affected, disrupting all critical operations at once.
You can guarantee optimal performance from your virtual servers by tracking every VM in your network and monitoring its performance. This is what network monitoring tools accomplish.
Virtual server monitoring is an integral part of network monitoring and management. In many organizations, virtual servers run critical services and host websites, and applications. When virtual servers run into problems, the potential risks are threefold. They can affect your customer satisfaction. They can overtax other network components and indirectly affect their performance. Finally, they represent a single point of failure that can take down multiple services at once.
A comprehensive network monitor like ManageEngine OpManager goes a long way to safeguard virtual server performance. OpManager can monitor key network components like switches, routers, servers, and wireless devices along with virtual servers. With this solution, you only need one tool to monitor your whole network. OpManager can also scale up to monitor thousands of devices effortlessly, basically ensuring constant and continuous monitoring of your network infrastructure. Here are some of the reasons why OpManager is ideal for monitoring your virtual servers:
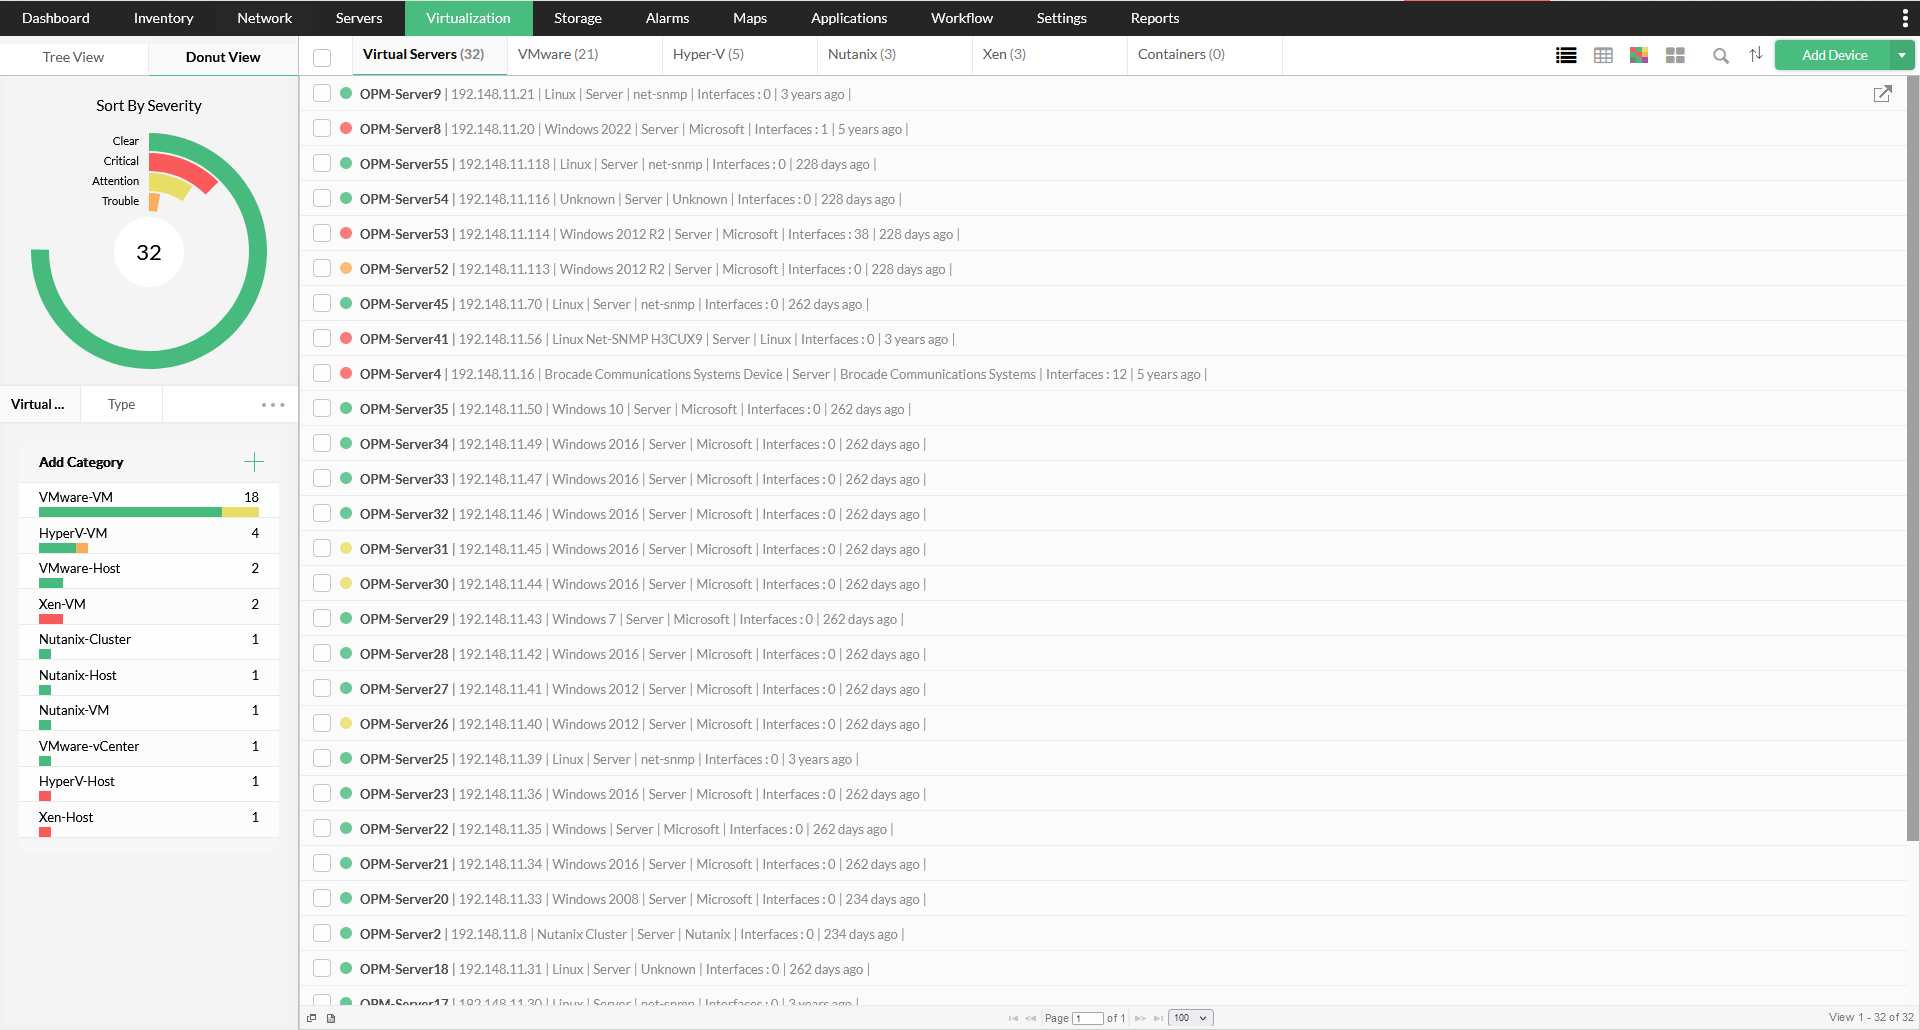
OpManager lists the virtual hosts and guest devices in your network in a virtual device inventory so you can see the number of devices occupying your network. The devices are categorized based on their software: Like VMware, Nutanix, Hyper-V, and Citrix Xen. The guest servers and the software running in them are also listed along with the alarms generated by them. This helps you monitor VMs separately and deal with their issues.
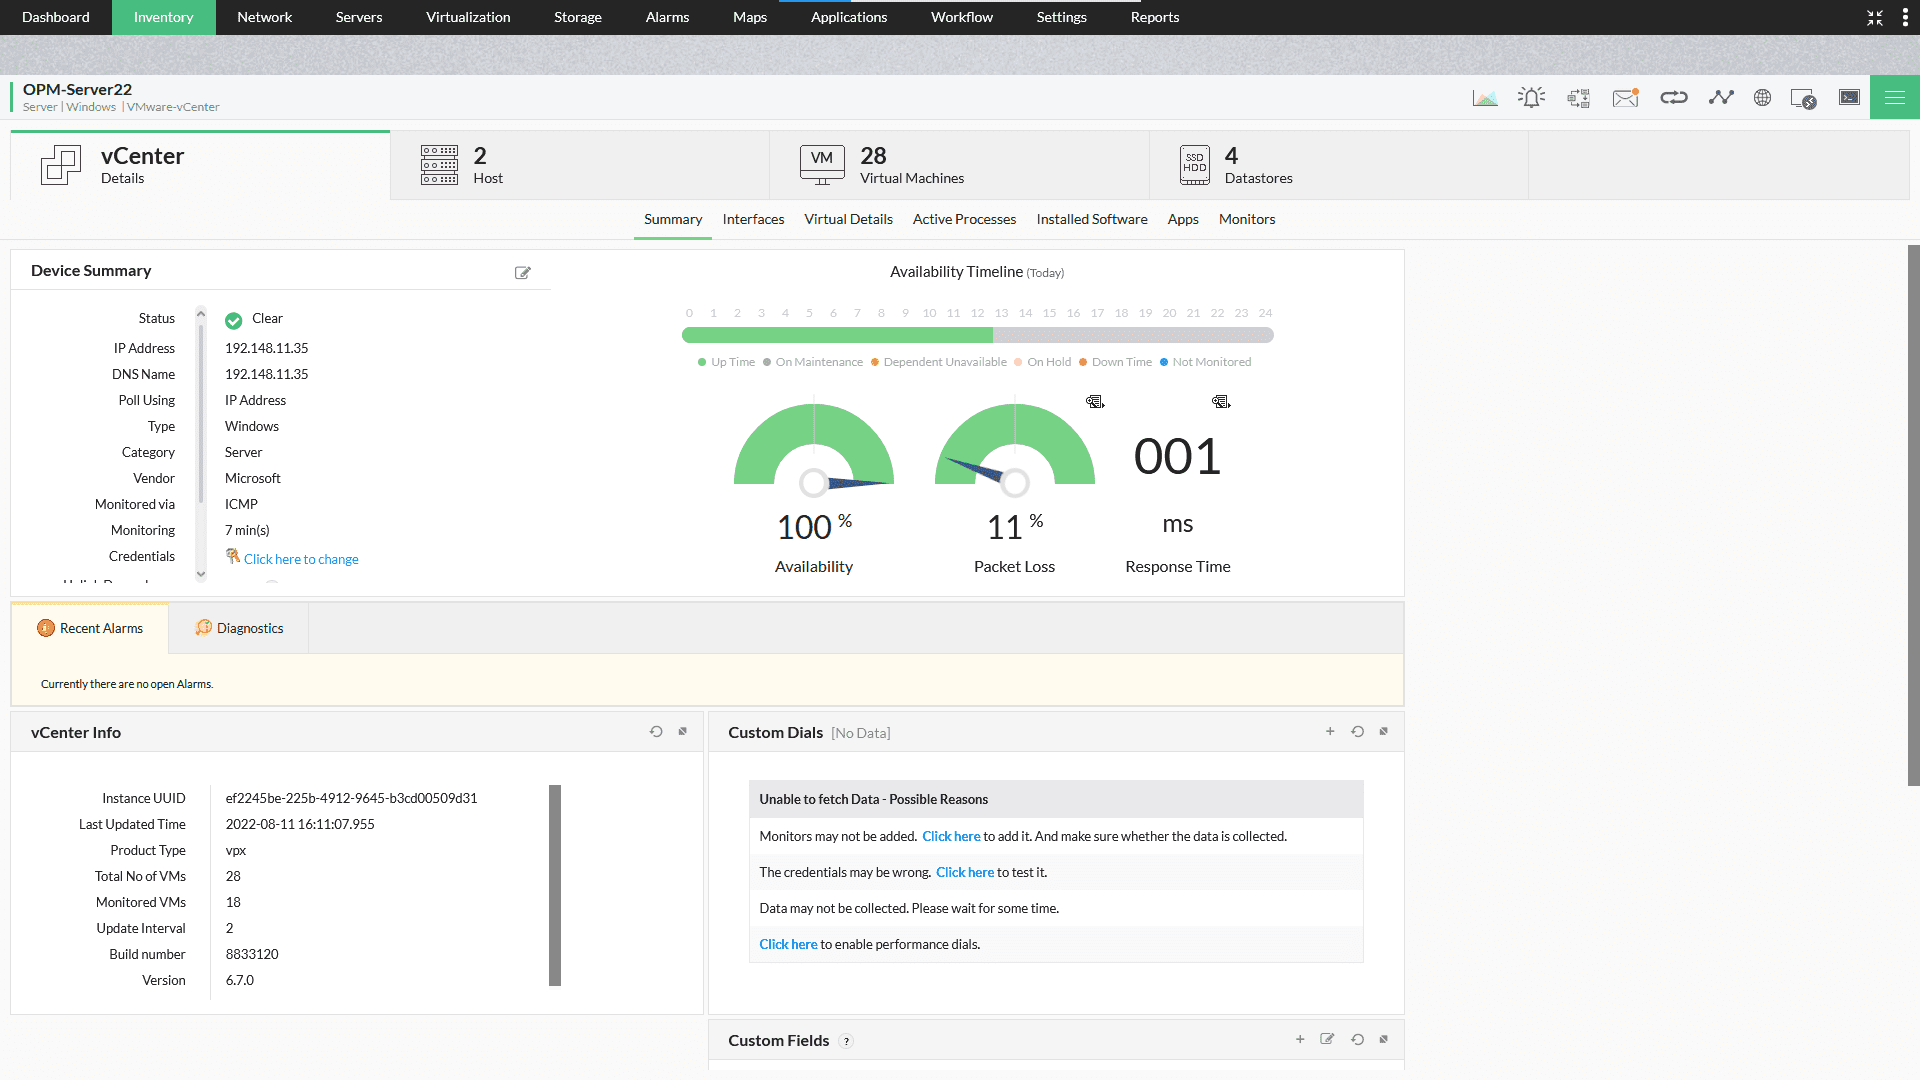
OpManager enables you to access relevant information about virtual devices inhabiting a host from the same place. Each of the guests and the hosts have separate device snapshot pages where vital information about them is listed. You can access the guest devices from the host, and start or pause monitoring from there. OpManager also lists disks and data stores used by the VMs.
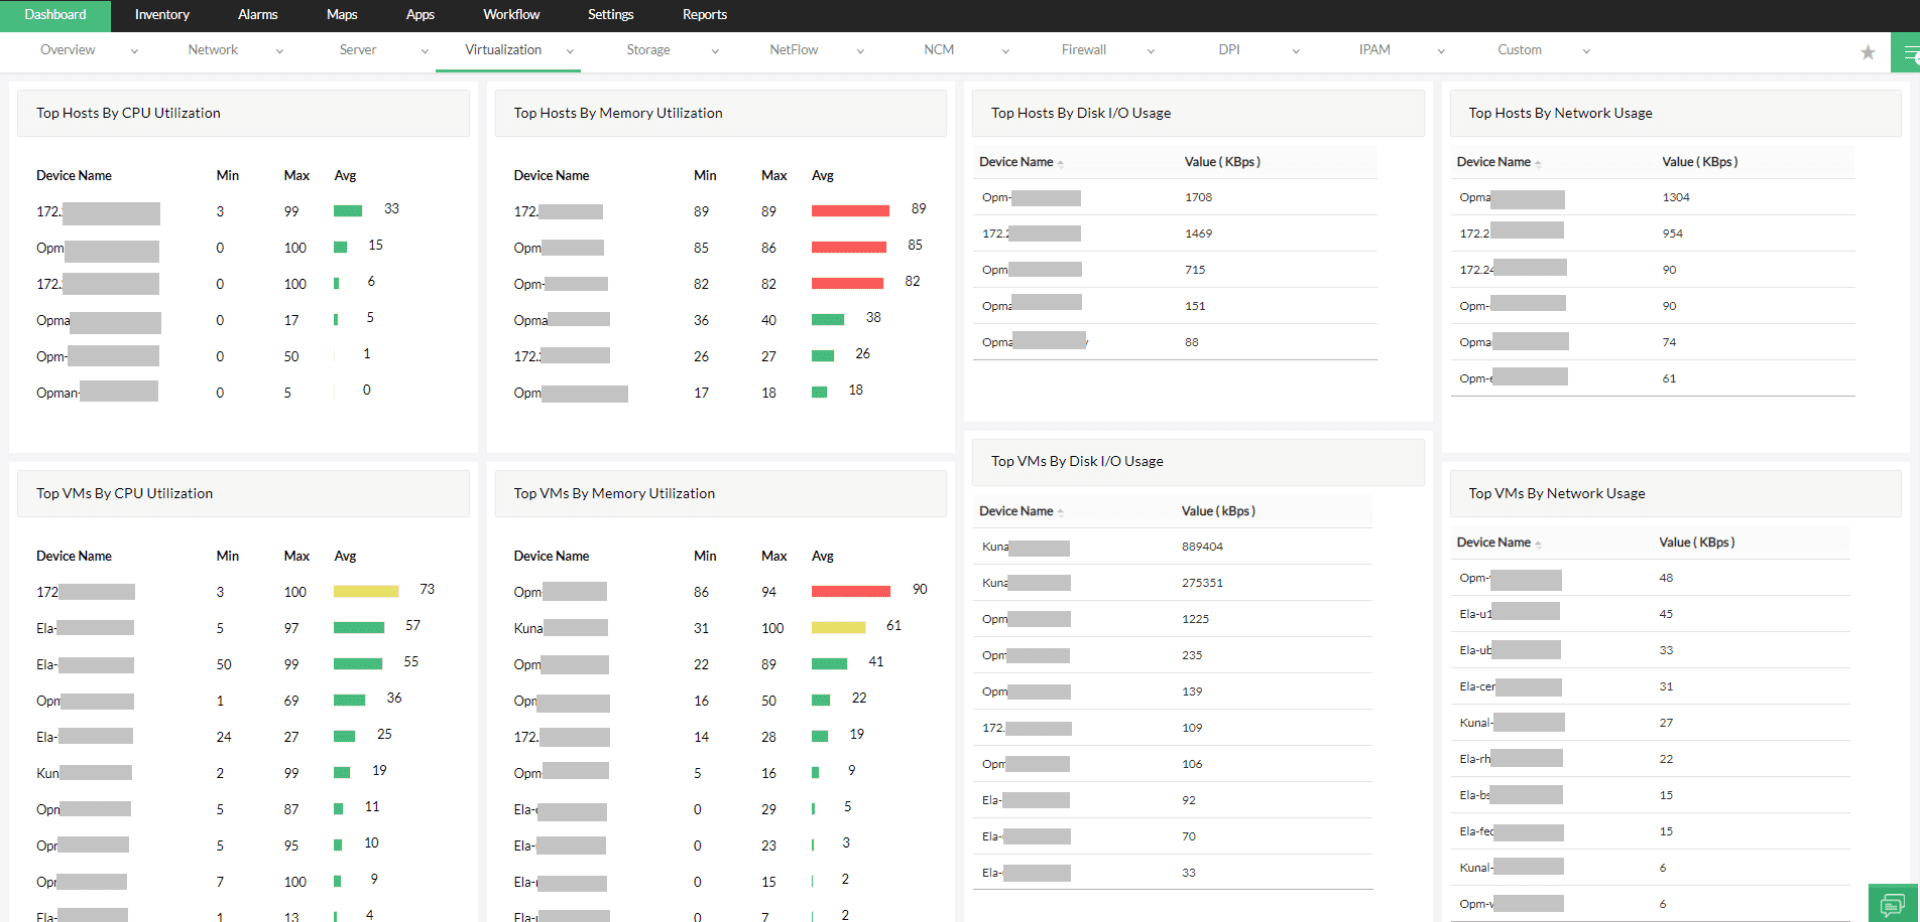
Reports enable you to analyze previous data and gain useful insights from them. This is vital to plan for future actions. OpManager has a dedicated virtual server tab that includes reports for idle VMs, VMs by CPU utilization, VMs by memory utilization, and more. OpManager also has general reports for device availability, health, and performance. If your requirements are different, you can create custom reports.
OpManager alerts you when a particular virtual server isn't responsive or down. These alerts help you minimize downtime for your services and bring the servers back up in case they do go down. The percentage availability of the virtual server is displayed along with an availability timeline that provides deeper insight into when the server was down.
Server performance monitors are based on CPU, memory, disk space, and traffic metrics. They provide you with a complete picture of the hardware health of a virtual server. Virtual servers might not have hardware strictly speaking, but they can simulate hardware performance, and operate on top of the host hardware. You can associate performance metrics to both host and guest devices to track performance.
You can monitor the services like HTTP, LDAP, and SMTP and be notified when they go down. For Windows servers, MySQL, FTP, and IIS monitoring is included along with syslog and event log monitoring. OpManager can also monitor processes running inside your virtual server. You can view top processes by CPU utilization, and memory, and remotely kill faulty processes.
If you want to check the availability of a particular website from your virtual servers, you can add a URL monitor to the server. The monitor accesses the website and searches for specific content set by you. In case the websites aren't reachable, you are alerted. Similarly, you can also run custom scripts.
The last thing you need during a crisis is a barrage of alerts generated due to poorly optimized thresholds and duplicate alarms. The adaptive thresholds feature in OpManager learns your network performance and automatically sets thresholds on an hourly basis to reflect actual network activity. This ensures that the alerts you receive are actual events that need your attention rather than false positives.
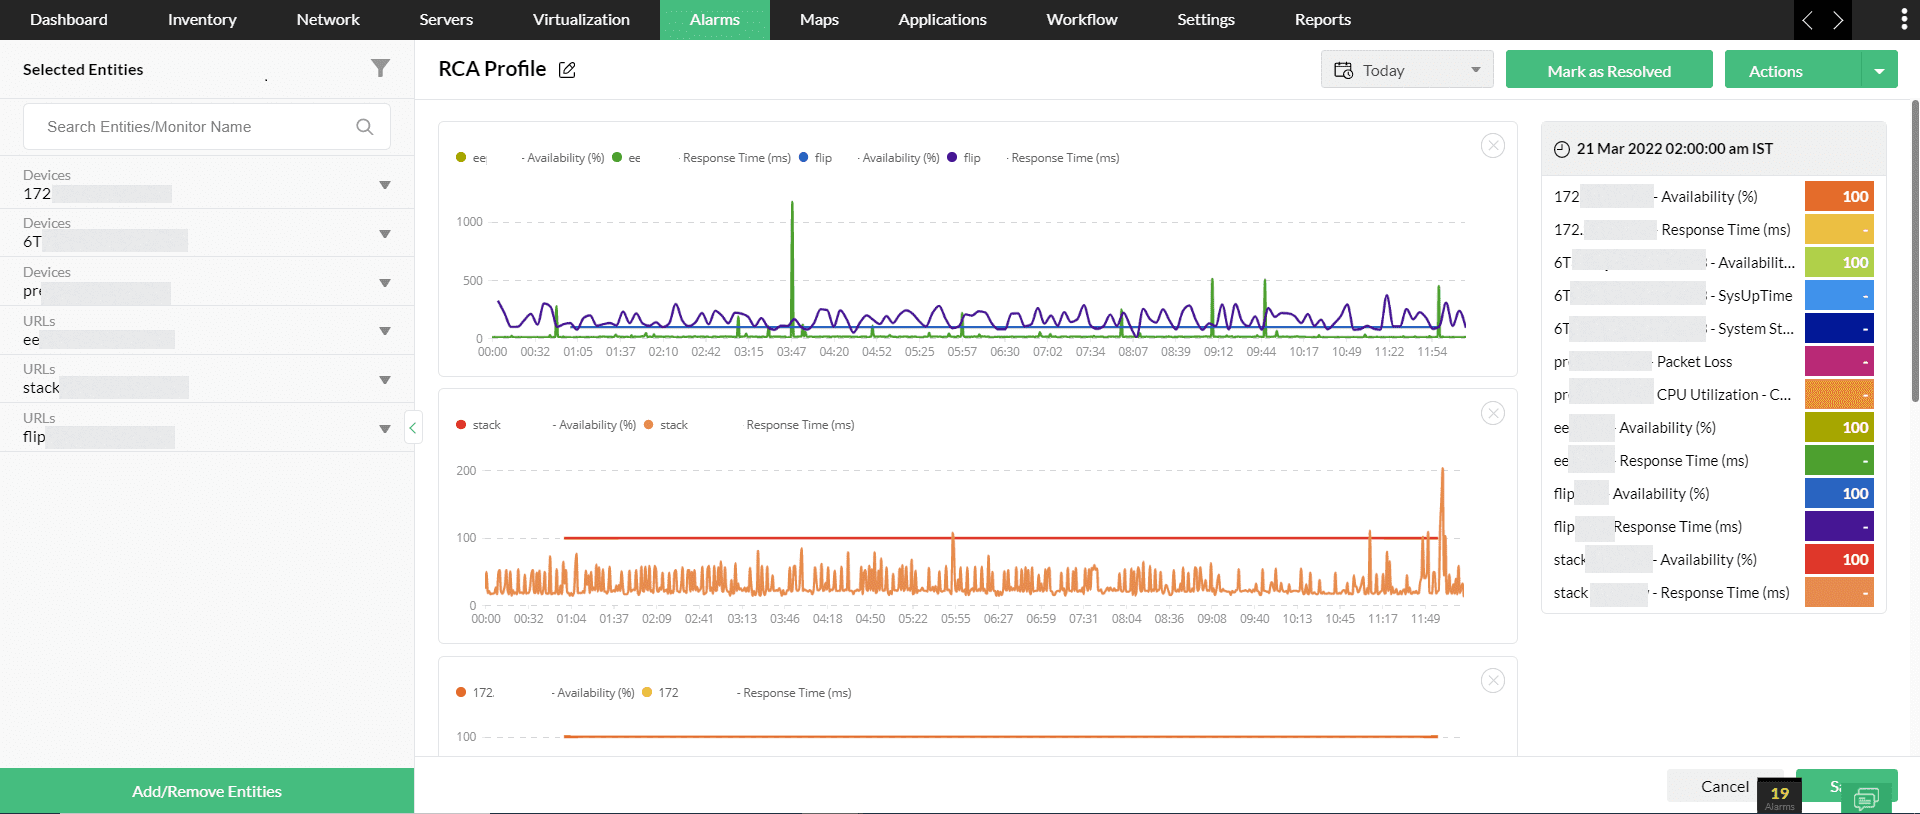
It's necessary to correlate the data obtained from multiple sources to track down the actual cause of an outage. When an outage occurs, you don't want to waste valuable time checking the data from each device you suspect of developing the issue. Root cause analysis profiles speed up this process by listing data from up to 20 entities in a window. You can correlate them side by side to efficiently track down the root cause.
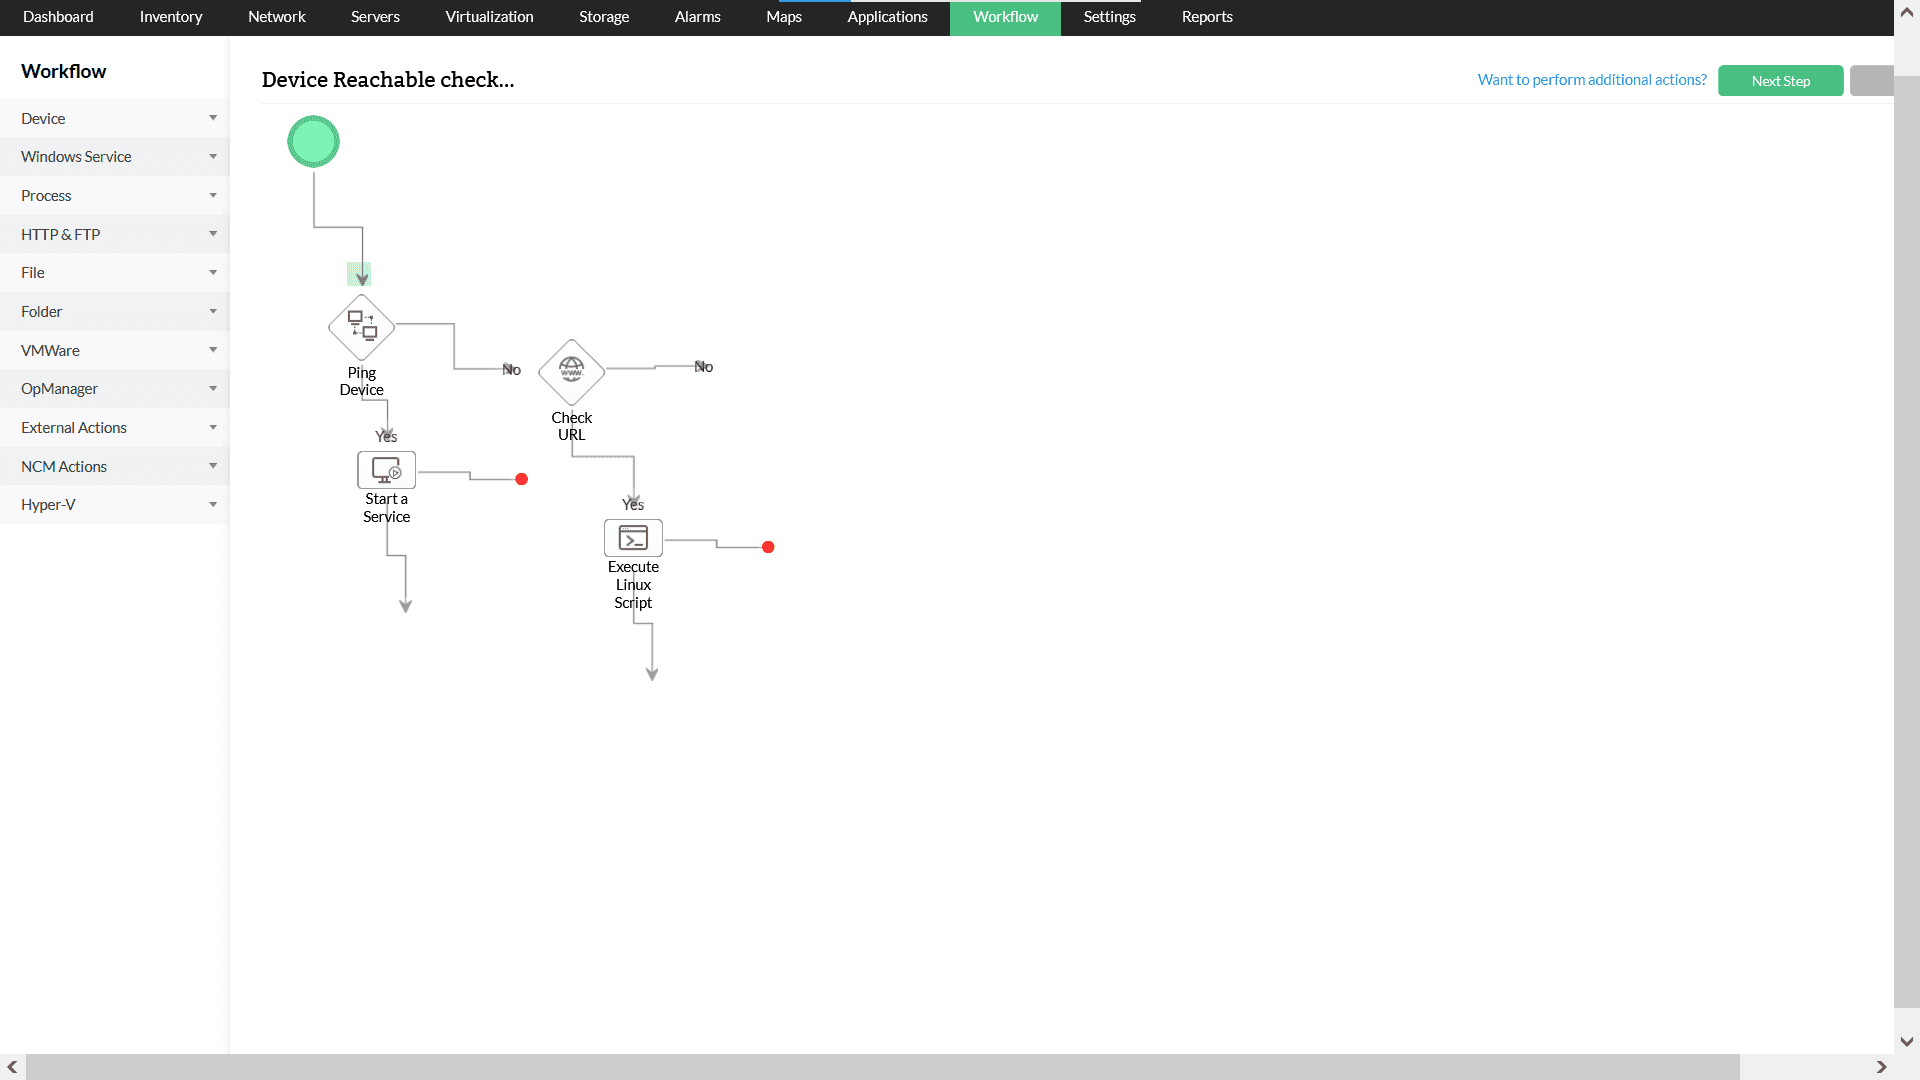
Fault resolution is quicker and more efficient when you can automate routine and repeatable tasks. This helps you in two ways: It reduces the mean time to repair and frees you up to perform more pressing tasks. OpManager's automated Workflows accomplish exactly this. Workflows can be created to automate tasks like restarting unresponsive services, clearing alerts, and running custom scripts.
You must be aware of the alerts generated by your network monitoring tool. Alerts left unchecked serve no purpose. OpManager can push alerts as notifications to you wherever you are, this brings you into the loop and speeds up fault resolution. Notifications can be sent via emails, SMS, Slack, webhooks, etc. Moreover, OpManager has an alarm escalation feature that pushes unacknowledged alarms up the chain of command.
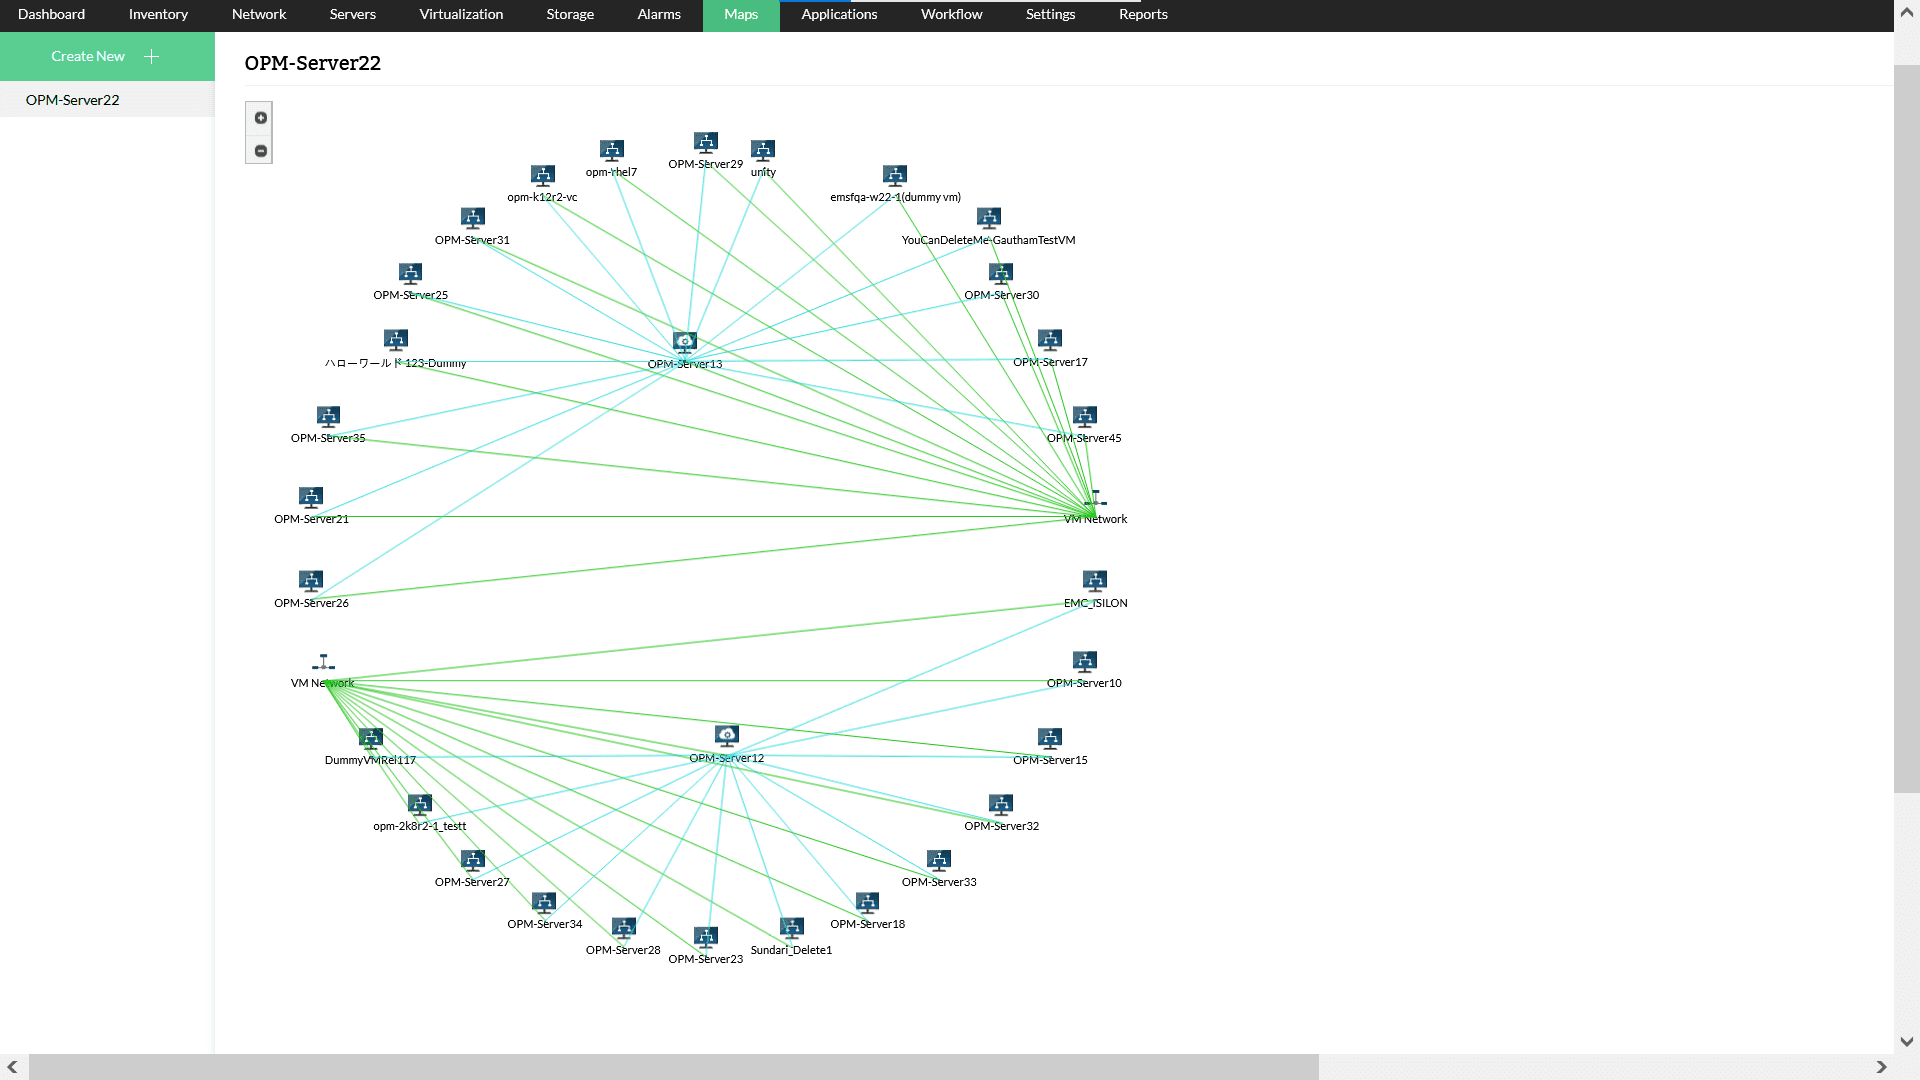
Virtual topology maps in OpManager are useful tools as they enable you to visualize an otherwise unseen network. Virtual topology maps are plotted with the relationships between the virtual devices and the information flow in mind. You can understand which servers share a host, how many services are dependent on a device, and more.
Any issues with virtual servers often can go unnoticed and can impact your entire network. You must use an effective monitoring tool to monitor and manage them. OpManager is one of the best solutions available, as evidenced by over one million IT admins who use it to keep their networks safe.