Azure Compute Services Monitoring
Azure Compute Services is a collection of cloud-based services in Microsoft Azure that enables organizations to deploy, manage, and scale applications and workloads across various environments. With Applications Manager, you can ensure that your Azure compute resources — from web application hosting and serverless functions to virtual machines and batch processing workloads — run efficiently, resources are optimized, and potential issues are identified and resolved promptly.
Applications Manager supports monitoring for the following Azure Compute services:
- Azure App Service Plan
- Azure App Service
- Azure App Service Slot
- Azure Autoscale Settings
- Azure Batch Account
- Azure Function
- Azure Virtual Machines
- Azure VM Scale Sets
Azure App Service Slot monitoring
Azure App Service Slot is a deployment feature within Azure App Service that allows teams to deploy applications to a separate live environment with its own hostname before swapping to production. Slots support independent configurations, enabling staged deployment workflows, A/B testing, and zero-downtime releases. Applications Manager's Azure App Service Slot monitoring provides visibility into the performance and health of each deployment slot.
With Applications Manager, you can:
- Track deployment slot health by monitoring Deployment Slot State, CPU Time, and Response Time to quickly identify performance issues affecting your applications.
- Monitor memory and storage consumption by tracking Memory Working Set (average and maximum) and File System Usage to prevent resource exhaustion across your deployment slots.
- Gain deep visibility into HTTP traffic by monitoring Request Rate, Total Requests, and HTTP status codes (2xx, 3xx, 4xx, and 5xx) to identify error trends and ensure availability.
- Detect network and I/O bottlenecks by tracking incoming and outgoing traffic rates, I/O read/write operations rate, and I/O read/write throughput metrics.
- Monitor OS-level health by tracking connection counts, thread counts, private bytes, and garbage collection activity (Gen 0, Gen 1, and Gen 2 GCs) to maintain optimal runtime performance.
- Review slot configuration details including Resource Group Name, Location, enabled status, HTTPS enforcement, and Default Host Name.


Azure Autoscale Settings monitoring
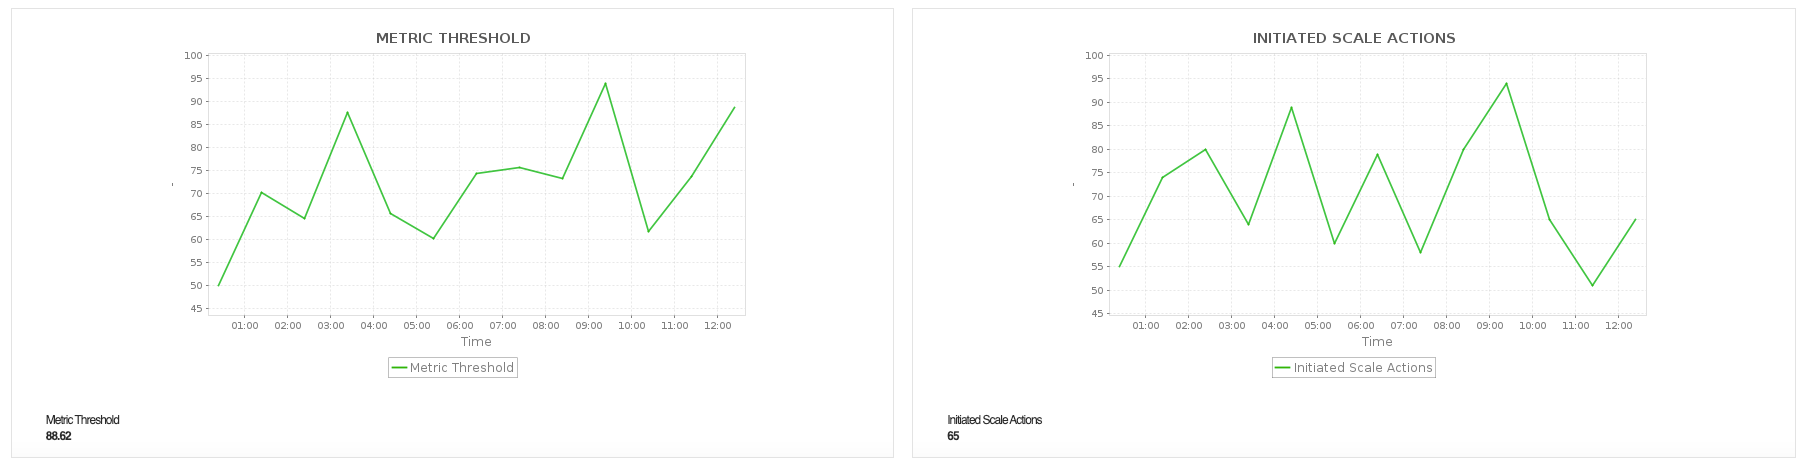
Azure Autoscale Setting is a feature of Microsoft Azure that automatically adjusts the number of compute resource instances based on predefined rules and schedules. It helps maintain optimal performance during demand spikes while reducing costs during low-usage periods by dynamically scaling resources up or down. Applications Manager's Azure Autoscale Settings monitoring provides key metrics to track the scaling behavior of your Azure resources.
With Applications Manager, you can:
- Track scaling capacity by monitoring Observed Capacity to understand how your resources are responding to demand changes in real time.
- Validate scaling rule accuracy by comparing the Observed Metric Value against the configured Metric Threshold to verify that scale-out and scale-in rules trigger as expected.
- Monitor scaling activity by tracking Initiated Scale Actions to confirm your autoscale configuration is responding to workload changes as expected.
- Review autoscale configuration details including minimum, maximum, and default capacity settings, autoscale status, predictive autoscale mode, and the target resource URI.


Azure Batch Account monitoring
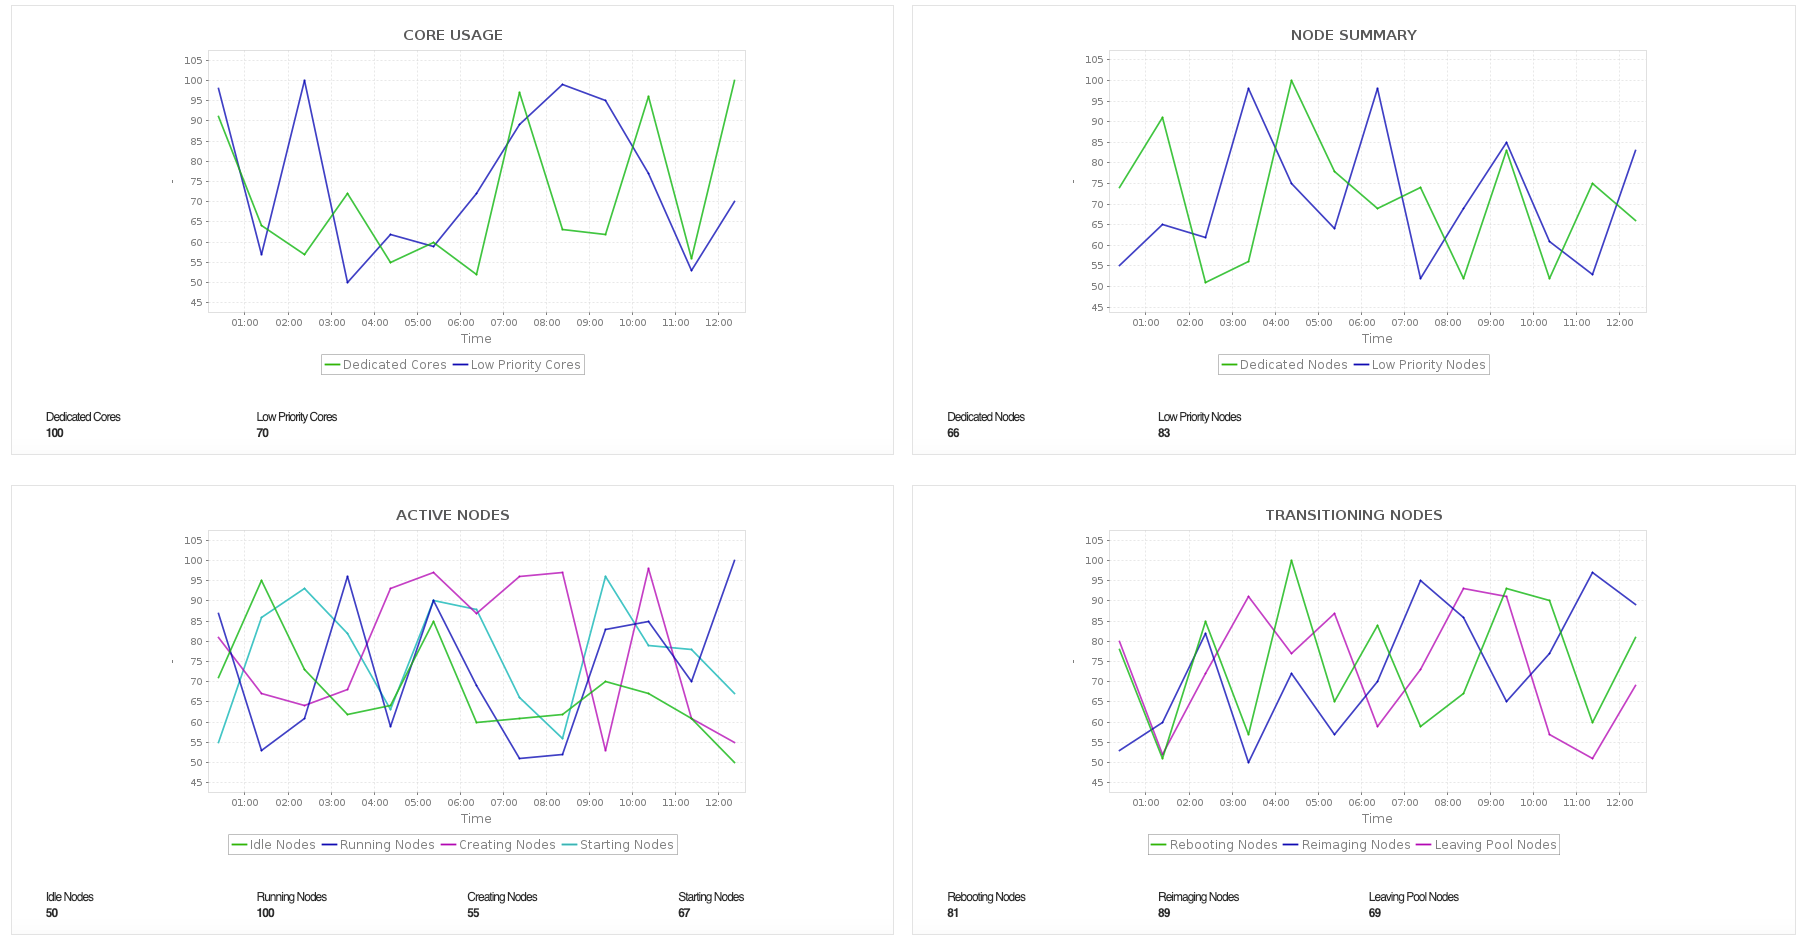
Azure Batch Account is a cloud-scale job scheduling service in Microsoft Azure that enables you to run large-scale parallel and high-performance computing (HPC) applications efficiently. It manages the provisioning and scaling of compute nodes, distributes workloads across pools of virtual machines, and tracks task execution, enabling automated batch processing without manual infrastructure management. Applications Manager's Azure Batch Account monitoring provides visibility into resource utilization, node health, job activity, pool operations, and task execution.
With Applications Manager, you can:
- Monitor core and node utilization by tracking dedicated and low-priority cores and nodes to understand resource consumption across your batch account.
- Track compute node lifecycle states - including idle, running, creating, starting, rebooting, and reimaging nodes - to maintain visibility into your node fleet's health.
- Identify infrastructure issues by monitoring unavailable nodes (offline, preempted, unusable, and nodes with start task failures) to quickly resolve problems that could delay batch processing.
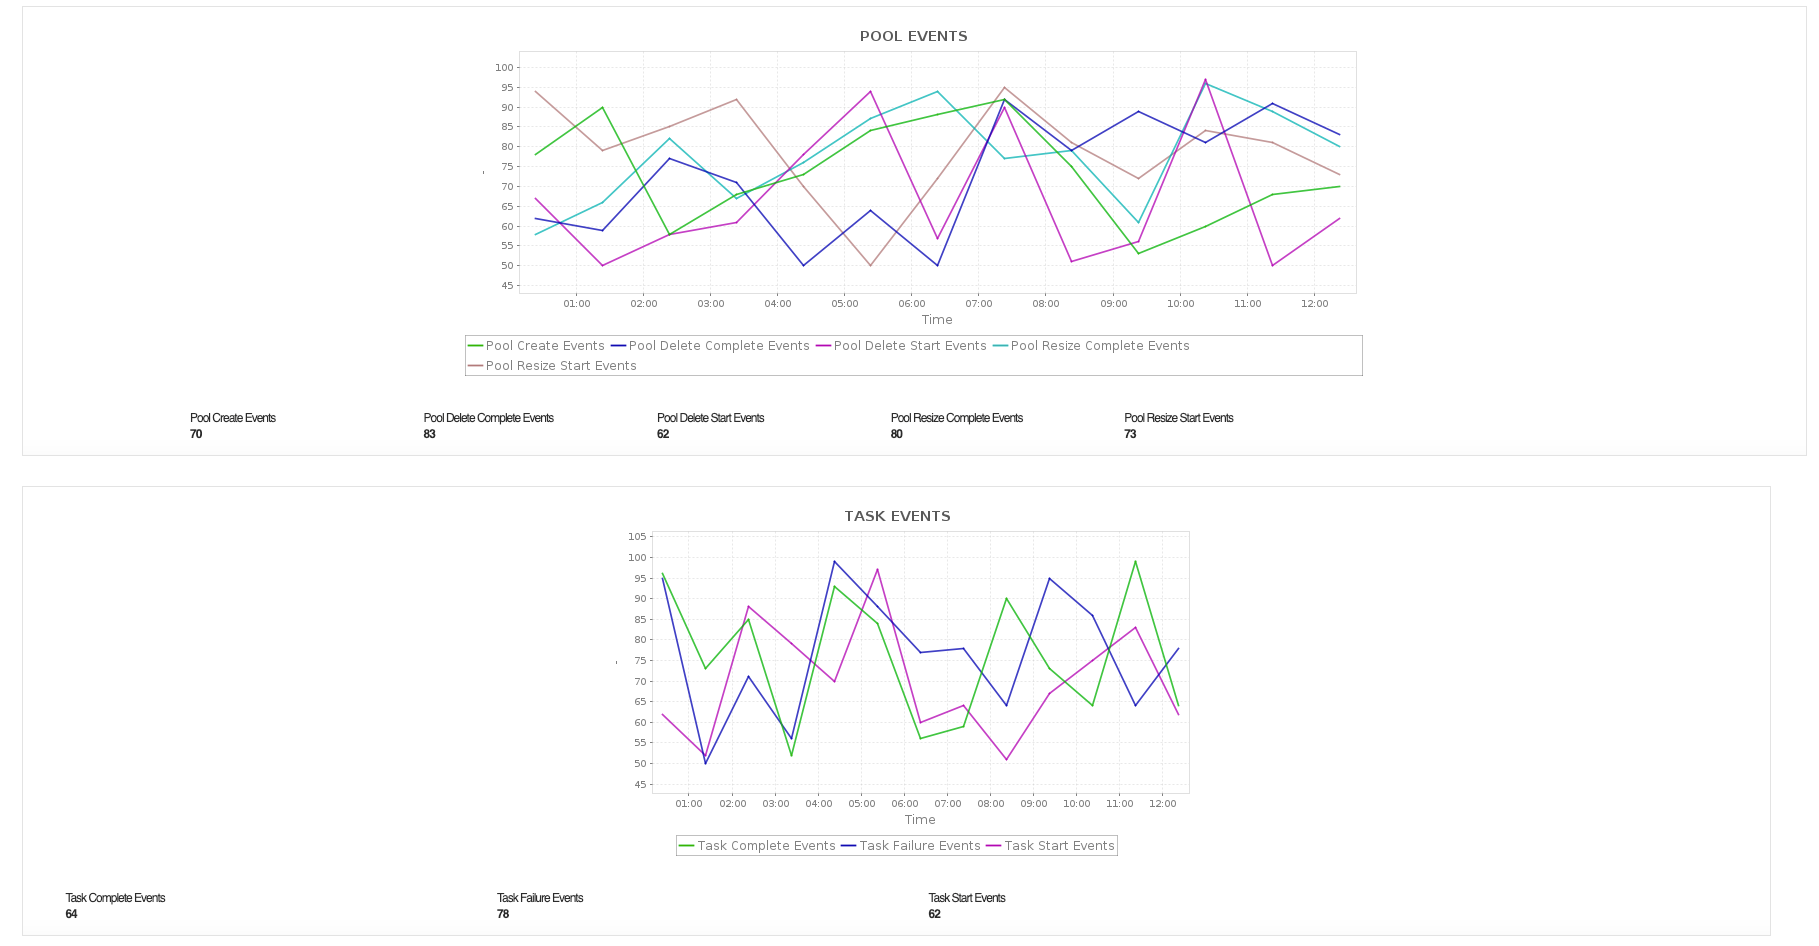
- Gain end-to-end workflow visibility by monitoring job events (starts, deletions, disablements, and terminations) and pool events (creation, deletion, and resize operations).
- Ensure workload reliability by tracking task start events, completion events, and failure events to confirm batch tasks are executing successfully.
- Review batch account configuration details including Pool Allocation Mode, Provisioning State, and Public Network Access settings.

Looking to monitor your Azure Compute Services?
Applications Manager is an all-in-one monitoring tool that effectively monitors a wide range of Azure services. Start monitoring your Azure compute resources in minutes with Applications Manager's comprehensive Azure monitoring solution. Download a 30-day free trial today!
Do more with Applications Manager's Azure monitoring with:

