Mobile APM: Keep mobile app experiences seamless with Applications Manager
For a growing number of businesses, their mobile app isn't a companion to their actual product—it is the product. In banking, food delivery, ride-hailing, and retail, customers now expect to do everything from their phones, often without even accessing a website.
That convenience comes with a much smaller margin for error. A slow screen during checkout, a crash right after login, a payment call that quietly fails in the background; most users don't file a bug report when these issues happen; they simply close the app, leave a one-star review, and take their business elsewhere.
The tricky part is that mobile apps can be challenging to monitor effectively. Unlike a server or a database present in your own infrastructure, a mobile app runs on a device you don't control, across networks and connectivity conditions you don't control, and on an OS version you may not have tested against. Teams often find out something's wrong only when app ratings start dropping.
To counter this, ManageEngine Applications Manager supports mobile app monitoring for Android and iOS, giving IT and app teams real-time visibility into how their mobile apps perform for real users—alongside the rest of the application stack they already monitor.
What is mobile app monitoring?
Mobile app monitoring is the process of tracking the performance, availability, stability, and user experience of Android and iOS applications across real-world devices, OSs, networks, and app versions. It helps teams identify issues such as slow screens, crashes, failed API calls, and poor user experiences before they affect a larger number of users.
How this works in Applications Manager
The idea behind mobile app monitoring is straightforward:
Instrument the app.
Collect performance data from real users.
Bring that data into Applications Manager.
To get started, you create a Mobile App Monitor in Applications Manager and integrate the Mobile APM SDK into your Android or iOS app. The SDK captures performance data as users interact with the app, from app launches and screen loads to network calls, transactions, and crashes. The data is collected through the DEM Collector and made available in Applications Manager for analysis.
Because this data lives in Applications Manager, mobile performance doesn't have to be monitored separately. Teams can view it alongside the applications, databases, servers, and cloud services they already monitor, making it easier to connect a problem users are experiencing with what's happening behind the scenes.
In simple terms:
Integrate the SDK > collect real-user performance data > send it through the DEM Collector > analyze it in Applications Manager.
From vague complaint to root cause
Picture a retail app running a flash sale:
Traffic spikes, and within minutes, support tickets start trickling in about the app being slow.
Without real user visibility, this usually means more guesswork for IT teams—checking server load, hoping it's not the payment gateway, and reviewing the complaints to narrow things down.
With mobile app monitoring, the picture becomes much clearer. The dashboard shows response times climbing specifically around the checkout screen. Drilling into HTTP calls shows a spike in 5xx errors on the payment API as the likely bottleneck. Simultaneously, the Crash Analytics tab shows a rise in crashes concentrated on a specific Android OS version, pointing the team toward a potential compatibility issue.
Instead of a vague ticket describing the app feeling slow, the team knows which screen, back-end call, OS version, and users are affected, giving them a chance to fix the issue before it spreads and starts affecting more customers.
What you get visibility into
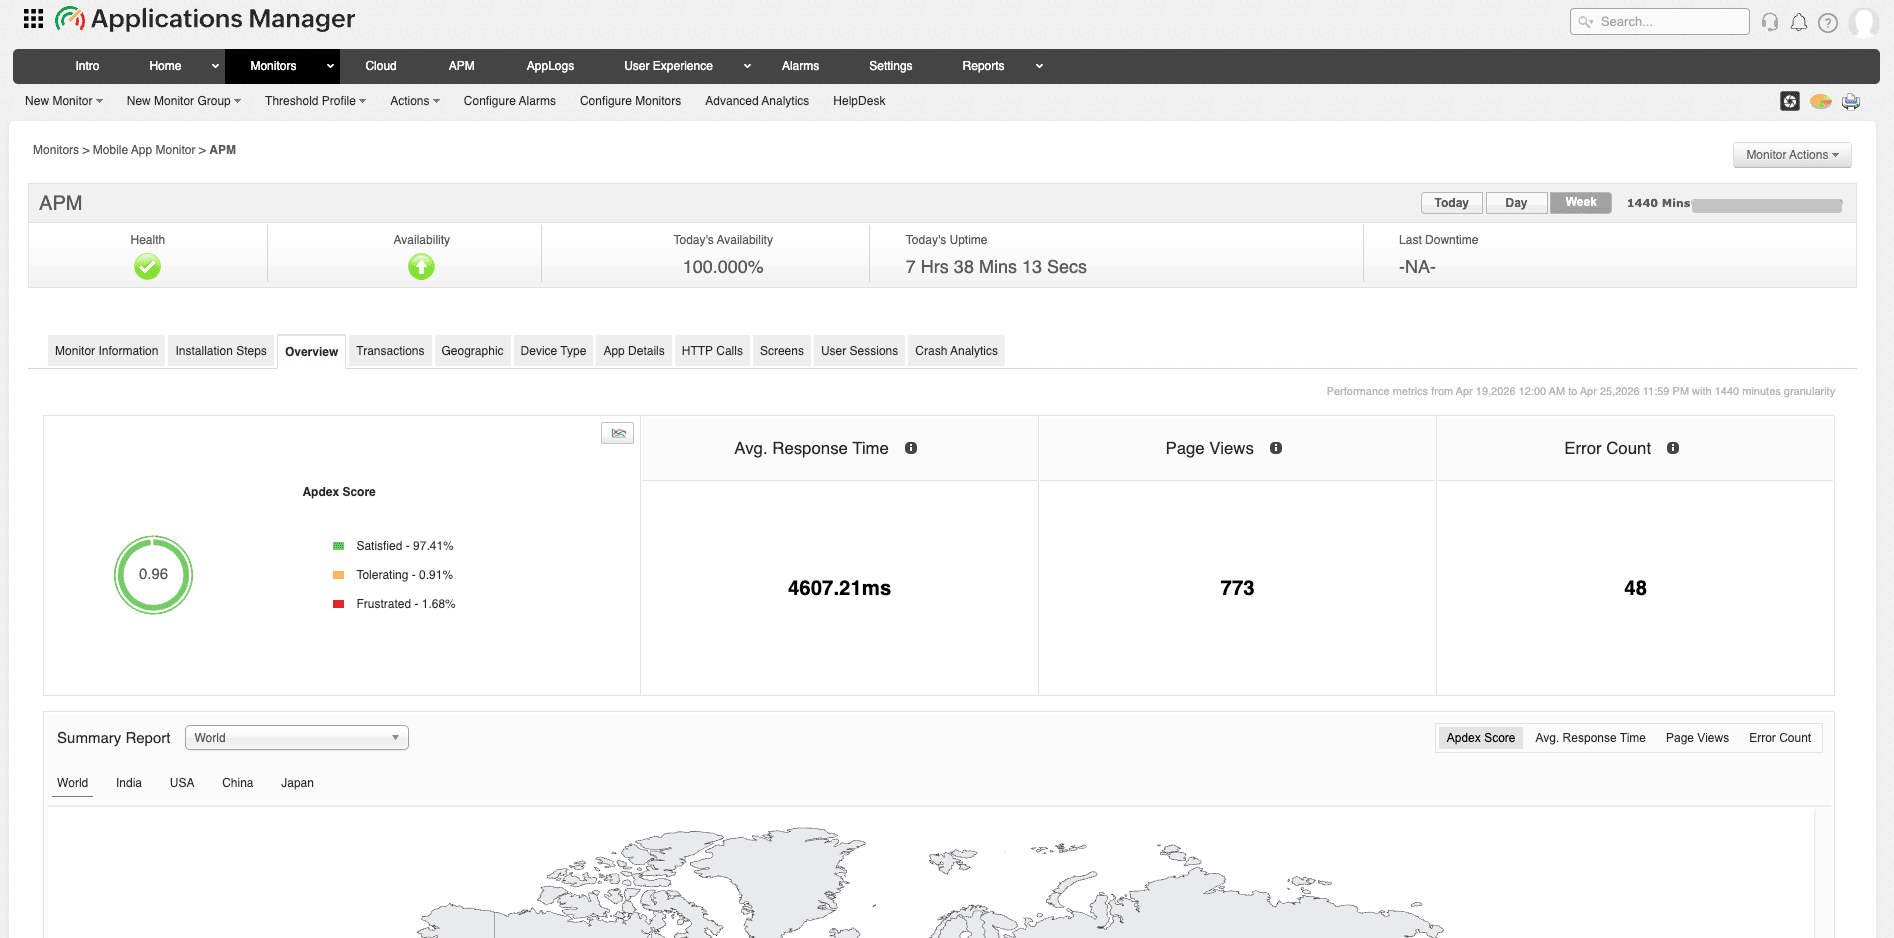
The Mobile App Monitor builds this picture through a set of purpose-built dashboards:
Real user performance, at a glance: The Overview dashboard surfaces Apdex score, average response time, throughput, and warm versus cold app start times, alongside a real-time geographic summary of where the app is being used—so you know at a glance whether today looks normal or not.
Back-end correlation, not guesswork: The Transactions and HTTP Calls views break down response times, throughput, and errors across transactions and API calls, making it straightforward to tell whether a slowdown originates in the app or in a dependent service.
Where and how users are affected: The Geographic view shows performance by country and carrier type, while Device Type and App Details break performance down by device model, platform, and app version. This way, a problem affecting 10% of users can be narrowed down to a specific region, carrier, device, and OS version.
What broke, and for whom: Crash Analytics helps teams investigate crashes by connecting errors to affected screens, devices, OS versions, app versions, and users, reducing the time spent on root cause analysis by closing in on the issue much faster.
How people actually use the app: User Sessions tracking helps teams understand how people navigate the app, identify sessions affected by crashes or latency, and drill down into slow-performing interactions and Screens. This helps spot where real users lose patience or hit friction, not just where the app technically errors out.
From the screen to the server, in one view
The real risk with mobile isn't just that something breaks. It's that users may experience the problem before your team knows where it's coming from. A slow checkout screen or failing payment call can eventually show up as lower conversions, poorer app ratings, or users quietly dropping off. By then, the underlying issue may already be affecting your business.
That's what makes visibility itself the real value here: catching the screen, the call, or the crash while it's still just an issue, before it becomes a churn statistic.
And that visibility can't stop at the app. A mobile app is never really a stand-alone. It depends on the APIs, databases, and cloud services doing the work behind the scenes, so monitoring the app in isolation only gives half the story.
Because mobile app monitoring is part of Applications Manager, teams can correlate the mobile experience with the APIs, databases, servers, containers, and cloud services behind it, all from the same console.
Ready to see what your mobile users are experiencing? Explore mobile app monitoring with a free, 30-day trial of ManageEngine Applications Manager.