Alarms
NetFlow Analyzer generates and displays alerts once the configured threshold is violated, you can create Alert profiles based on you requirement from Settings -> NetFlow -> Aggregated/Real-Time Alert Profiles. Alerts are generated based on the RAW data collected in the database.
NetFlow Analyzer gives you the option to create two types of alert profiles:
Real-Time Alert Profile - In a Real-Time Alert Profile the event is generated when the data usage threshold per minute is violated more than the permitted number of times.
Aggregated Alert Profile - In an Aggregated Alert Profile the event is generated when the total volume/packets over the given period of time crosses the set threshold.

You can see the alerts and its events based on the severity configured in Alert Profile like Critical, Trouble, Attention and Service down. You can click on the severity to get the list of Alarms generated for that severity.
Alerts List
The Alerts List is displayed when you click on any color against an alert profile in the Alarms page. The list shows the alerts that were generated with the respective severity, along with the device that generated the alert, the time the alert was generated, and an option to view more details about the alert.
Clicking on the alert gives you detailed information about the alert. The pop-up that opens up, shows the traffic graph outlining traffic values ten minutes before and after the alert was generated, along with details on top applications, sources, destinations, and conversations recorded during that time interval.
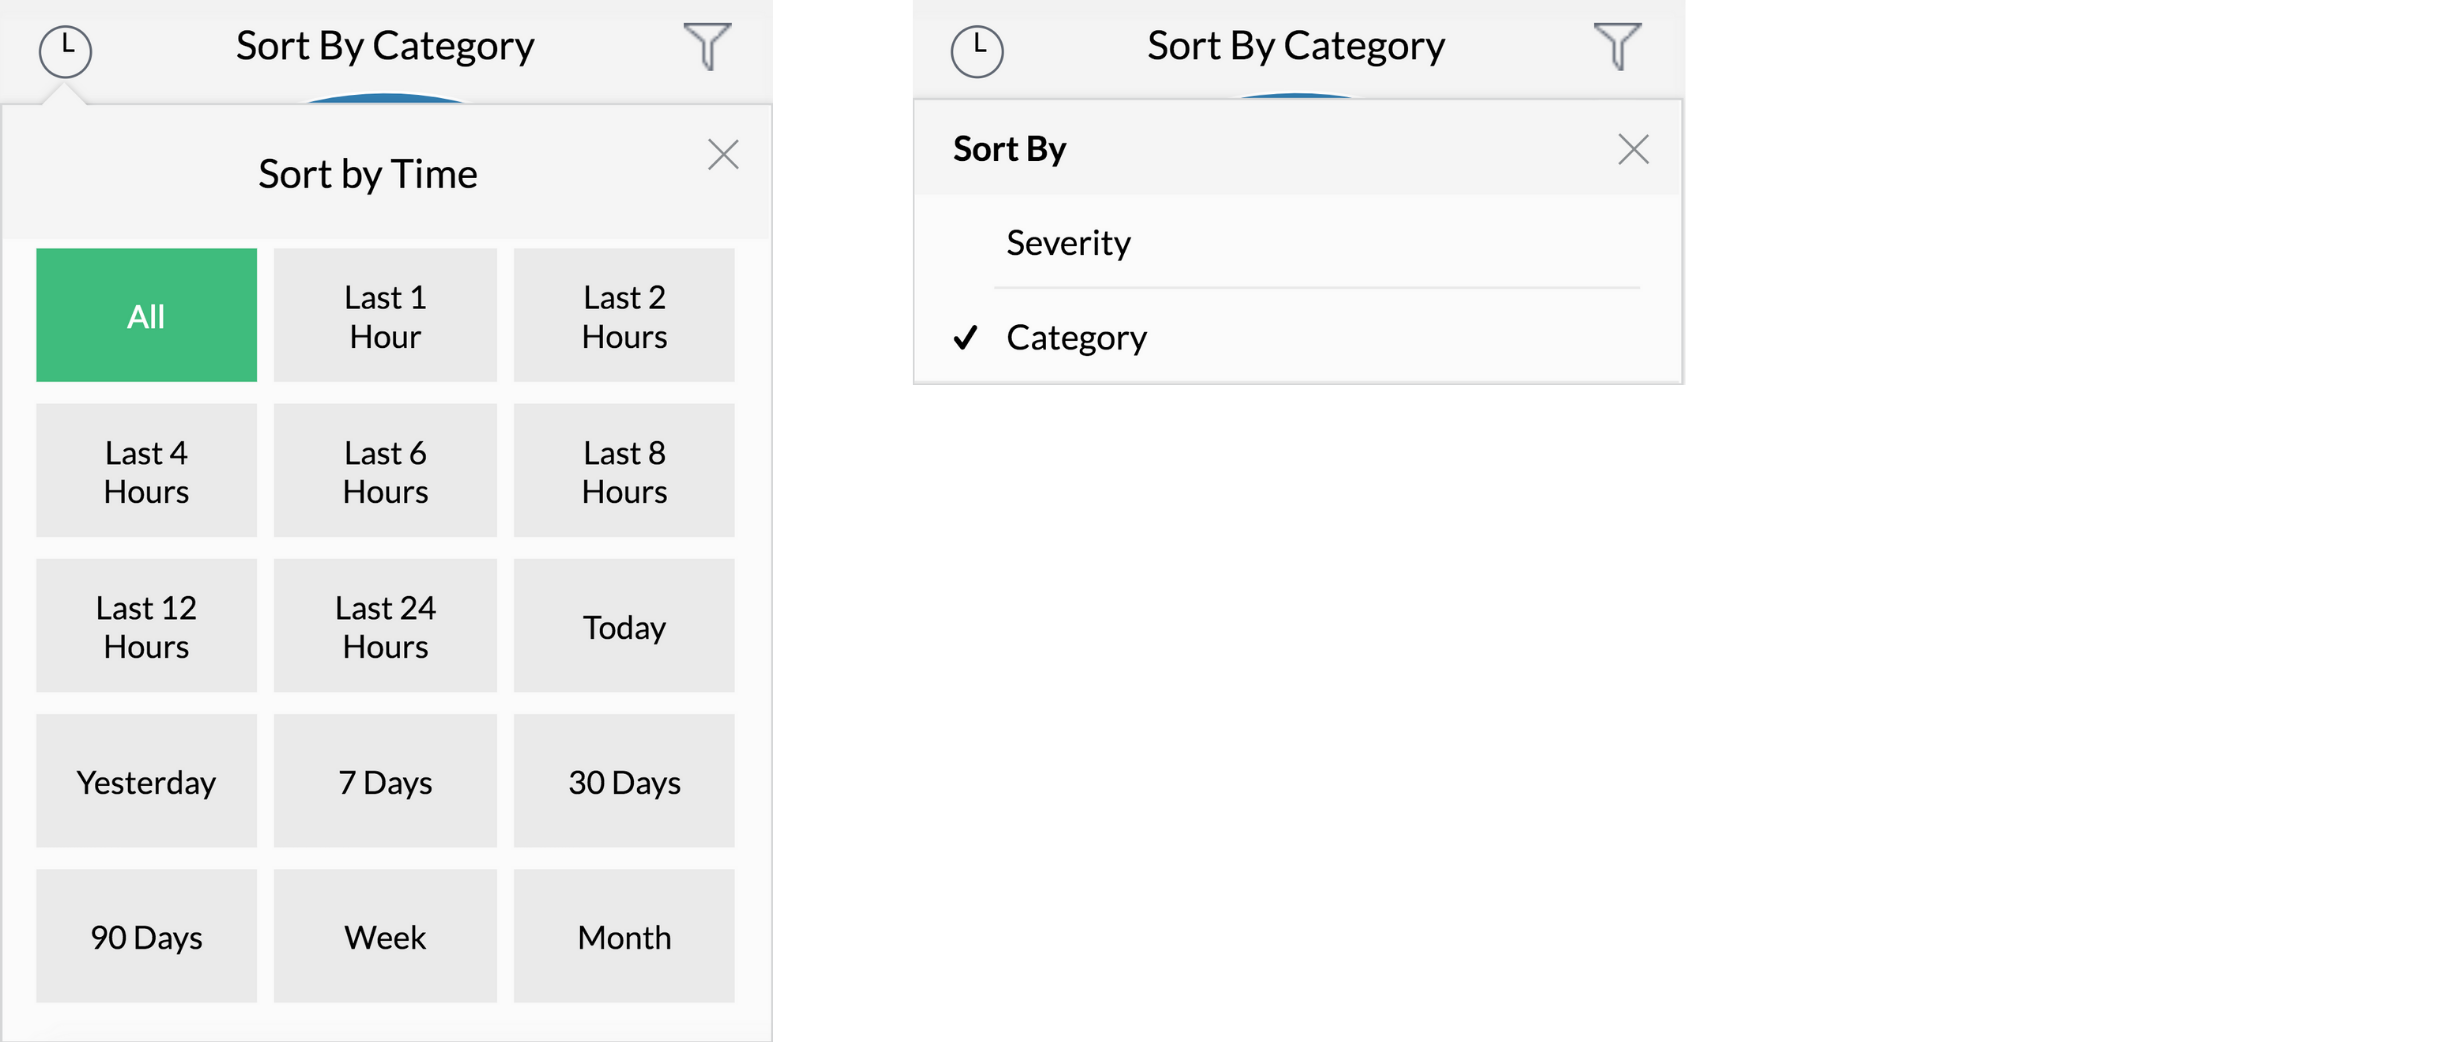
You can click on the Filter icon to change the view of the Alarms in NetFlow Analyzer, also you can sort the alarms by time on which it is generated by clicking on the icon  on the left side column.
| Filter | Description |
| Active Alarms | List up all the recent active alarms. |
| All Alarms | List up all the alarms for all category |
| NFA Alarms | List only NetFlow Alarms |
| NCM Alarms | List only Network Configuration Add-on alarms |
| Severity | List Alarms based on severity an event has occurred |
| Category | List all category alarms |
You can set the different view from the right hand side top for Alarms to display under the Alarms tab using the below option:
| View | Icon | Description |
| List view |  | Allows you to view the Alarms in list view |
| Block view |  | Allows you to view the Alarms in Block view |
| Color view |  | Shows Alarms and events in color view based on severity |
| Sorting |  | You can sort the Alarms based on Message, Source, Category, Technician, Severity, Time. |
| Search |  | Allows you to search Alarms based on Message, Source, Category, Technician, Severity, Time. |
You can click on each alarm for a detailed view on the Alert generated, and view the Traffic and Application statistics during the time the Alert was generated. Any technician who checks the alert can add notes for others to understand.
Alert Actions
- Unacknowledge: Using this option, you can remove the assigned technician and mark the alarm to be unresolved.
- Acknowledge: This option allows you to assign an operator from the list of technicians to work on the problem.
- Send Email: You can provide an email address and get email alerts every time the threshold value is reached.
- Export to PDF: You can export the specified alert profile into a PDF file and download it to share or analyze conveniently.
- Export to Excel: You can get your alert profile exported to XLS format and use it later for offline analysis.
You can also delete an Alert form the view by selecting the Alert and then click on the delete icon  on the right side top.
Events
When an threshold is violated in your network, an event occurs and multiple events correlate to trigger an alarm. An event can not be deleted from the UI. Events will be stored in the database until it reaches a count of 60 lakhs. After it exceeds the said count, the old events will be deleted automatically.
Types of Alerts
NetFlow Analyzer allows you to customize alerts and the type of notification. You can choose to be notified via SMS, email, SNMP trap, SysLogs, web alarms, run a program, or log a ticket.
1. For email and email based sms, email address will have to be provided.
2. For Chat based alerts, NetFlow Analyzer intergrates with Slack. It helps you get notified via the 3. Slack channel when an alarm is generated.
4. The Run Program option lets you automatically execute a script or a program when an alert is generated.
5. The Log a Ticket option lets you log tickets in ServiceDesk Plus/ServiceNow when an alert is generated.
6. Web Alarms notify you with a sound alert when a critical alarm is generated.
7. For SMS based alerts can be generated by providing the mobile number.
8. This option allows you to get notified through SysLog messages.
9. This option allows you to get notified through SNMP Trap messages.
You can configure alerts/notification templates according to your preference.