Top Hosts
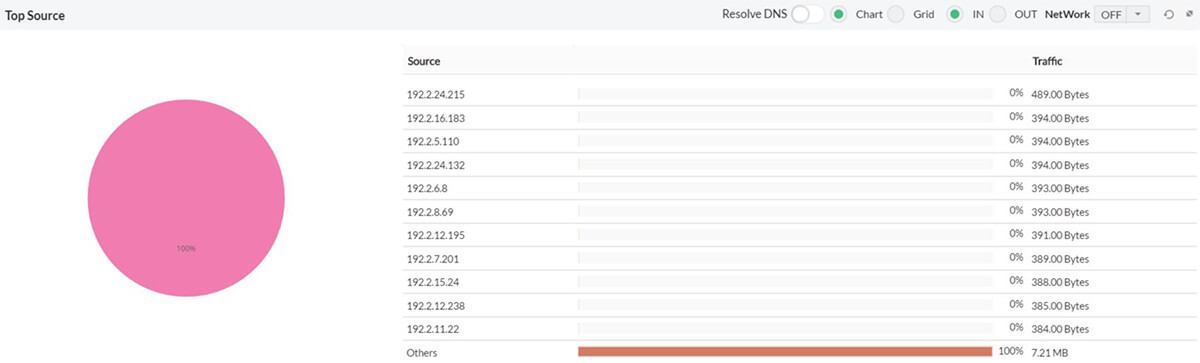
The Source tab shows the top source hosts contributing to traffic in the selected time period. The default view shows the Top SourceIN Report.
The Destination tab shows the top destination hosts contributing to traffic in the selected time period. The default view shows the Top DestinationIN Report.
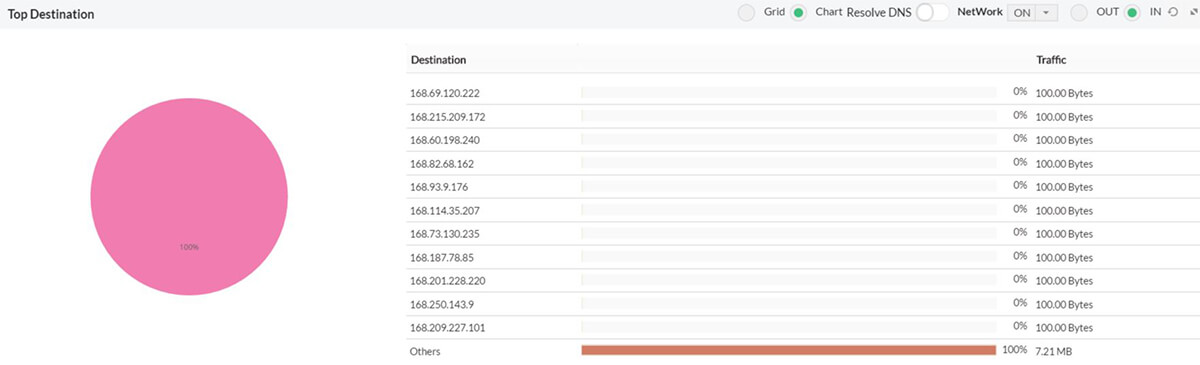
Choose between IN and OUT to display the top hosts in incoming or outgoing traffic.
Exand the widget by clicking on  to get the details list of Source and Destination reports.
When you drill down from an IP group, traffic is unidirectional, and hence the IN and OUT options are not available. |
The Time Period icon  lets you choose between options available in the drop-down as per your requirement at the top. The From and Toboxes let you choose custom time periods for the graphs. The time period for these graphs is based on the current system time. Once you select the desired date and time, click the OK button to display the appropriate source or destination traffic report.
The default report view shows the IP addresses of the hosts. Click the Resolve DNS link to see the corresponding DNS values.
Click the Network link to ON to see the network-wise top sources and destinations.
Ex: 192.168.4.0 / 24 . Here 192.168.4.0 is the IP address and 24 is the network mask.