Custom Dashboard
NetFlow Analyzer offers Dashboard as a graphical and tabular overview of all the network components in the network. With this dashboard view, you will be able to get a visualization of your network ; its performance and pinpoint the network elements when they go mayhem. NetFlow Analyzer offers the option to create and customize your dashboard through Custom Dashboard feature based your monitoring requirements. There are different widgets from NetFlow Analyzer, Network Configuration Manager, IPAM and SPM, DPI, and General available for users to display widgets of their own choice.
For example, a network administrator can utilize NFA widgets to monitor application traffic for mission critical applications, along with their associated interfaces, traffic conversations, and protocols. By creating a custom dashboard, they gain a bird's-eye view of network activities, enabling them to take appropriate actions to optimize network performance effectively.
You can create Custom Dashboard for NetFlow Analyzer Central UI for Across Probes and set it as default to view in login page. Across Probe, custom dashboard provides multiple widgets categories NFA widgets and NFA Across Widgets.
Creating New Dashboard
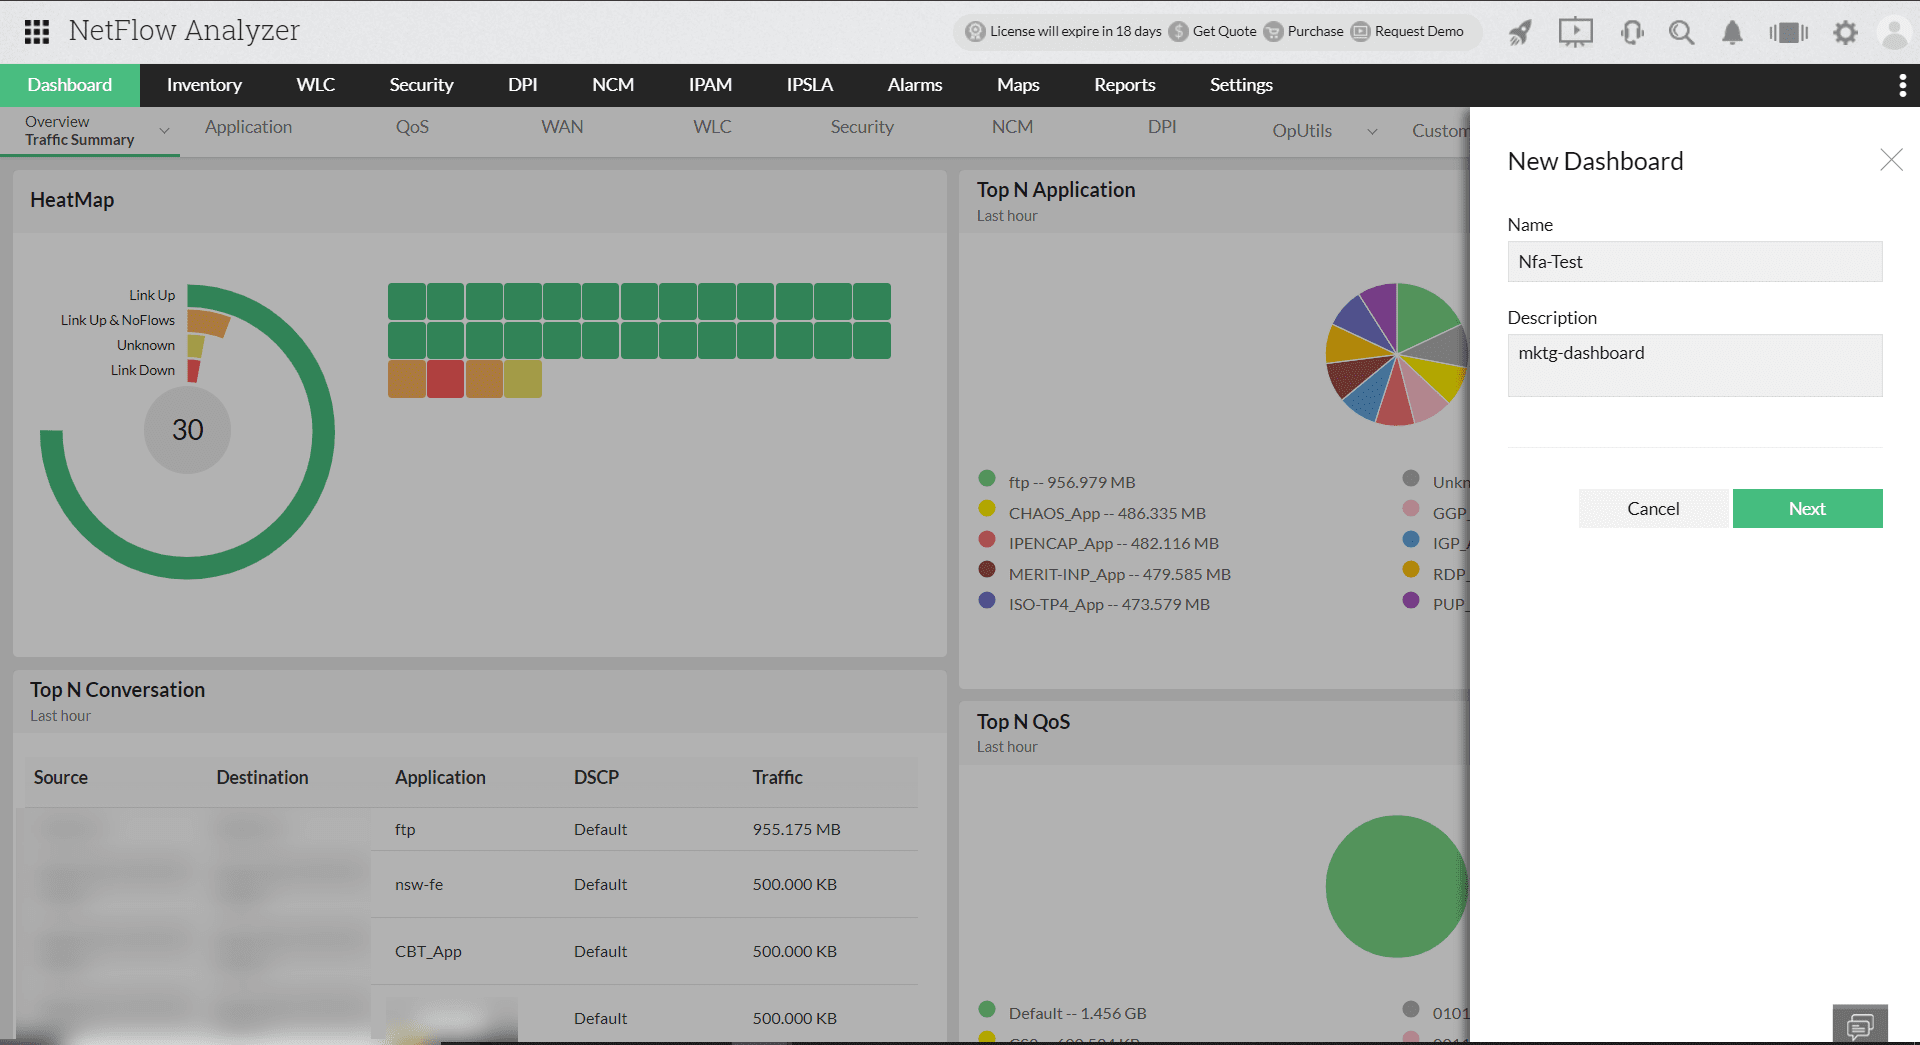
To create a new dashboard view, click on icon ![]() on the right top of the view and provide the below details and click Next
on the right top of the view and provide the below details and click Next
| Name | Name of the new dashboard |
| Description | Describe the view for easy reference and understanding |
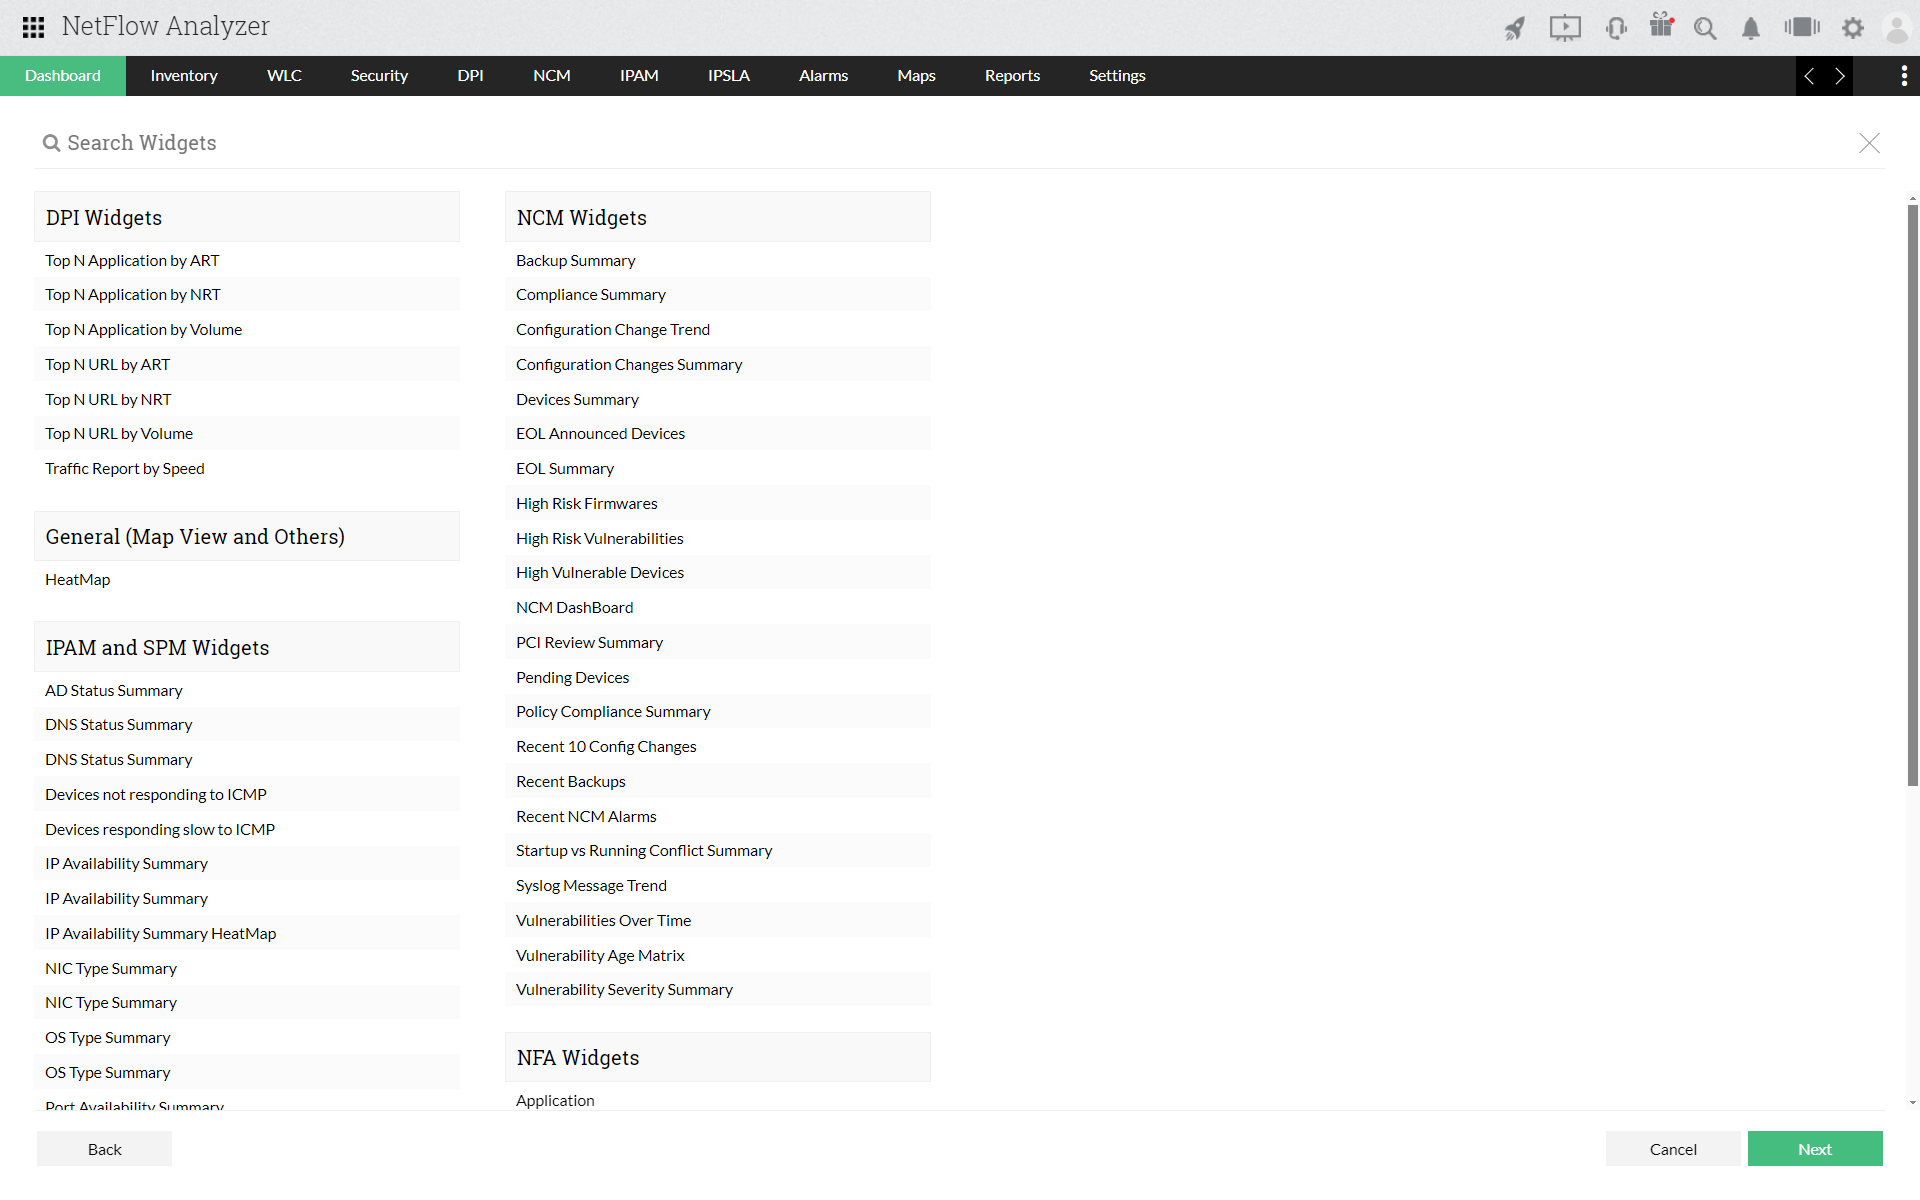
In next view you can select the various different widgets for NFA and NCM and click on next.
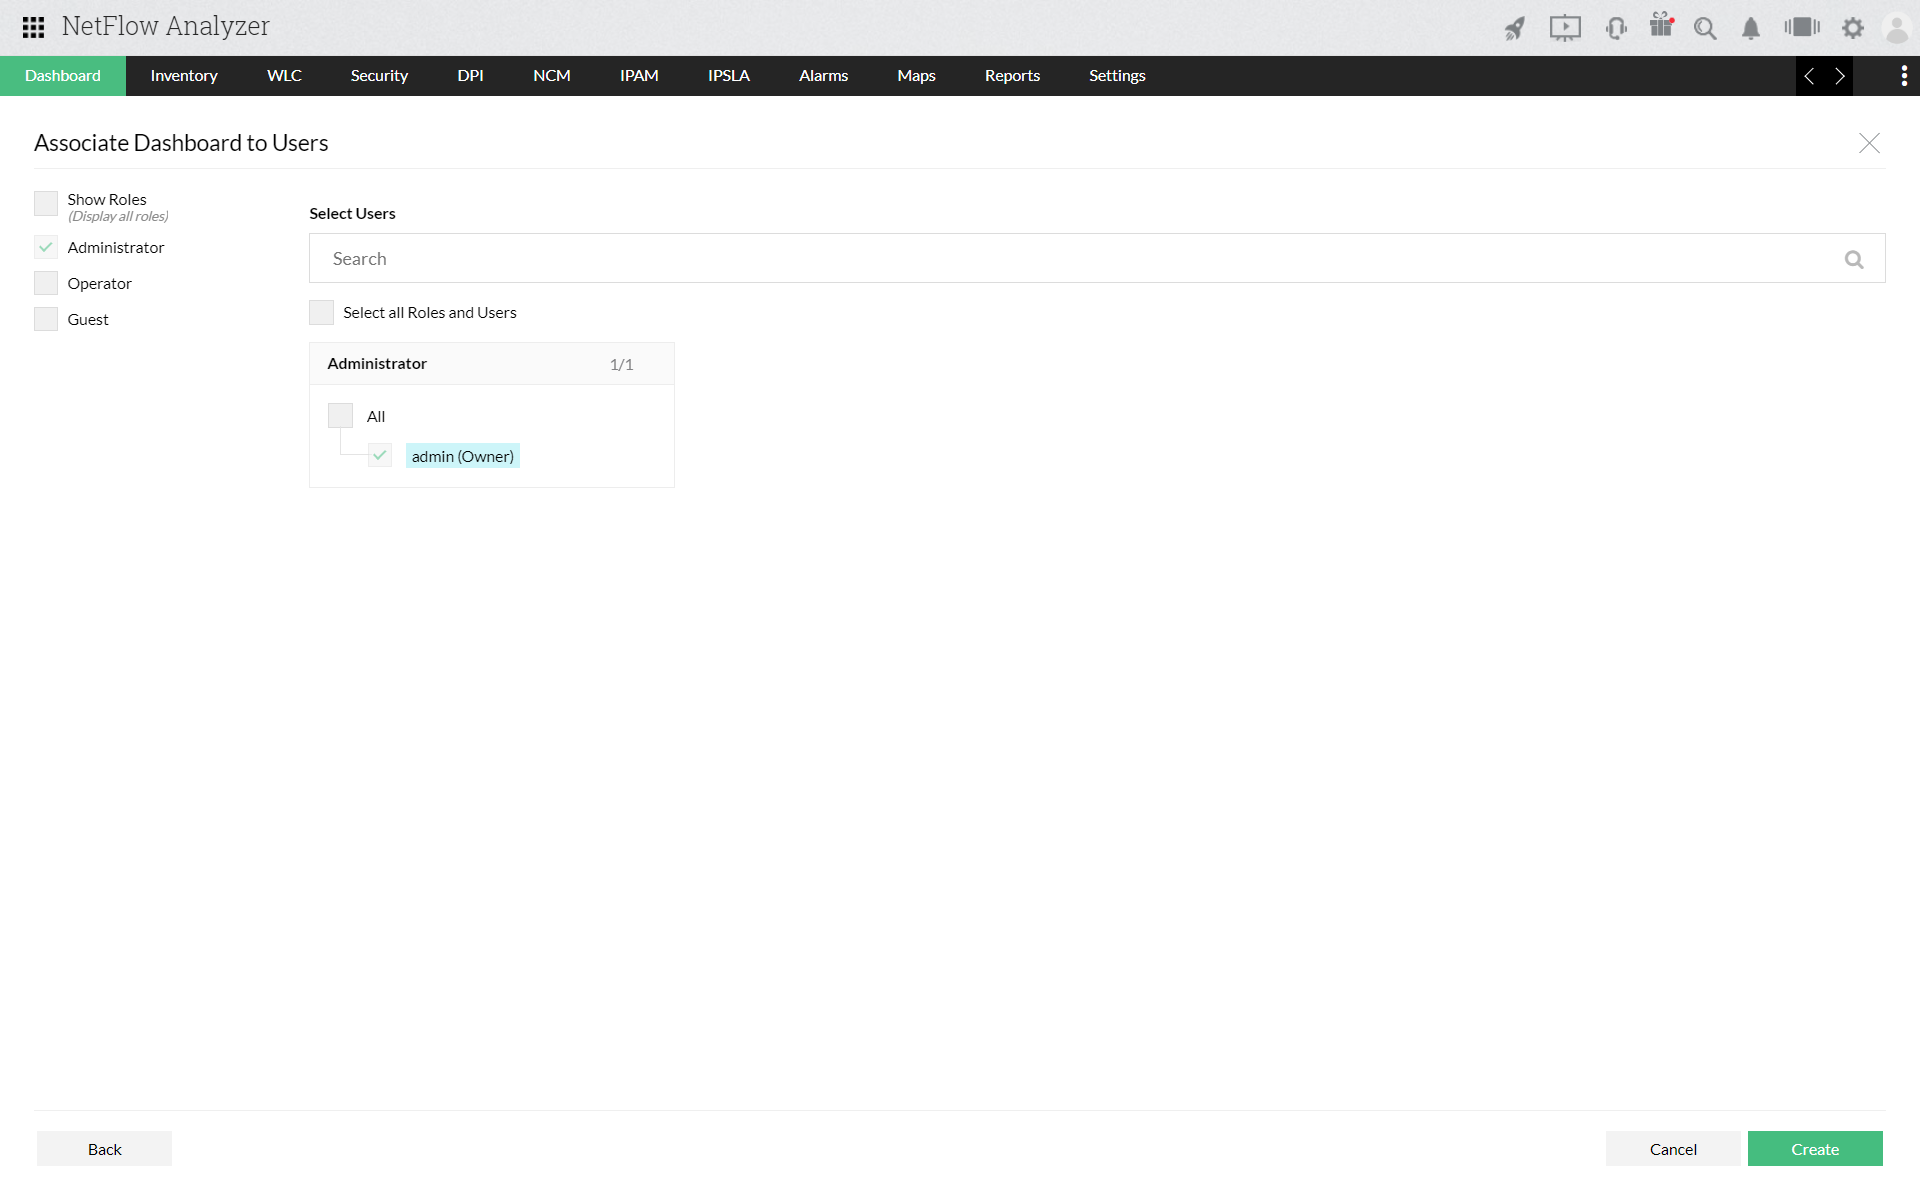
Select the required users to grant access, in the next screen.
With Custom Dashboard you can also ,
- You can refresh a widget by clicking on
 icon.
icon. - Delete a particular widget by clicking on

- Configure/edit a widget by clicking on
 icon.
icon. - Expand a widget using the
 icon.
icon. - To set the a custom dashboard as the default dashboard click on the icon
 and your dashboard view will be set to the default view.