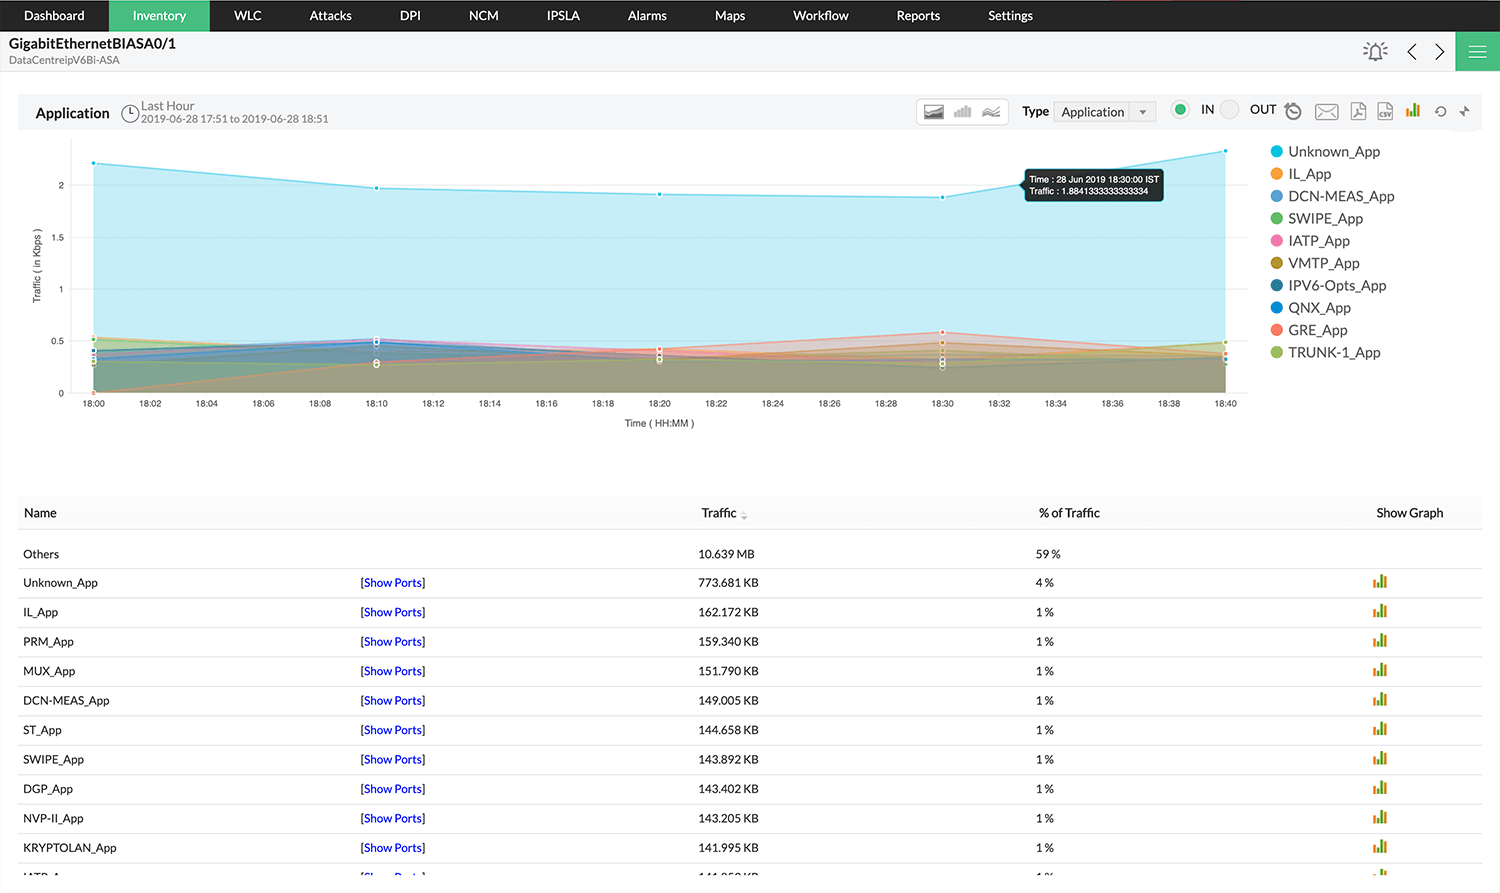
Troubleshooting traffic sources listed as Others in the Inventory
If only a small percentage of the overall traffic is listed as Others, it is because the total traffic value is updated every second, while the application, source or destination data is loaded only once every 3 minutes in the database. This difference in data between these values is listed as Others when while displaying the last-hour reports.

Also, NetFlow Analyzer stores two types of data, Raw data and Aggregated data. Raw data contains every flow received from every device and can be stored for up to 1 month and gives the complete port level information.
As far as the aggregated data is concerned, it stores the Top N records (Configurable through Settings > Server Settings > Record Count) for Application and Conversation tables. So flows that don't belong to the 'Top N' category will be dropped. This dropped traffic will be displayed as unaccounted in the Application and Conversation tables for reports greater than 1 hour.
Please visit the link given below to know more about the Data Storage pattern in NetFlow Analyzer: