- IT Operations Monitoring
- Network Monitoring
- Enterprise Network Monitoring
- Distributed Network Monitoring with OpManager Plus Enterprise Edition
- Enterprise Storage Monitoring
- Network Operations Management
- Data Infrastructure Management(DCIM)
- Hybrid Network Monitoring
- Network Path Analysis
- Root Cause Analysis
- Automation Workflow
- Alarm Escalation
- Adaptive Thresholds
- Deep Visibility
- Multi-vendor Support
- Network Forecasting
- Forecast Reports
- Enterprise Server Monitoring
- Observability in OpManager Plus
- Observability in ITOM
- Full stack Monitoring
- AIOps
- What is Observability
- Bandwidth Management
- Network Configuration Management
- Firewall Log Management
- IP Address and Switch Port Management
- Application Management
- ServiceDesk Plus ITSM Integration
- Cloud Monitoring
- Hybrid Cloud Management
- Digital Experience
- Closed Loop Remediation
- Network Provisioning
- Enterprise Network Visualization
- Add-ons
- Observability Concepts
- NetOps
- IT Operations Analytics (ITOA)
- Hyperautomation
- CloudOps
- NetDevOps
- Site Reliability Engineering (SRE)
- Infrastructure Automation
- Edge Networking
- Cloud Migration
- Cloud Native Adaptability
- Threat Detection
- Cardinality
- Total Experience
- AI Networking
- AI Infrastructure Monitoring
- WAN technology for enterprises
- AI in network management
- Layer 2 extension technologies
- CMDB in network monitoring
- Context-aware event correlation
- Border Gateway Protocol (BGP) Guide
- DCIM - Overview

Trusted by over 5000+ businesses
Improve service operations with insights from the network
Full-stack observability
Monitor and manage the entire IT stack from a single, unified console by enabling in-built add-ons and plugins. Observability cuts down the time and effort needed to correlate metrics between multiple tools, provide added context for alarms and events, and facilitate control over the entire IT stack.
AI-driven monitoring
ML enabled adaptive alarms cut down alarm floods and false positives from flooding your service management solution. In addition, you can detect anomalous data spikes, forecast performance metrics, and calculate resource utilization trends proactively and accurately to optimize operations.
Root cause analysis
Simplify root cause analysis with relationship mapping. Starting at layer 2, discover and map seed routers, seed switches, host devices, hosted devices, applications, and services across the entire organization. Isolate the source, symptoms, and affected devices of an outage with ease.
Cut down MTTRs with context-aware incident management
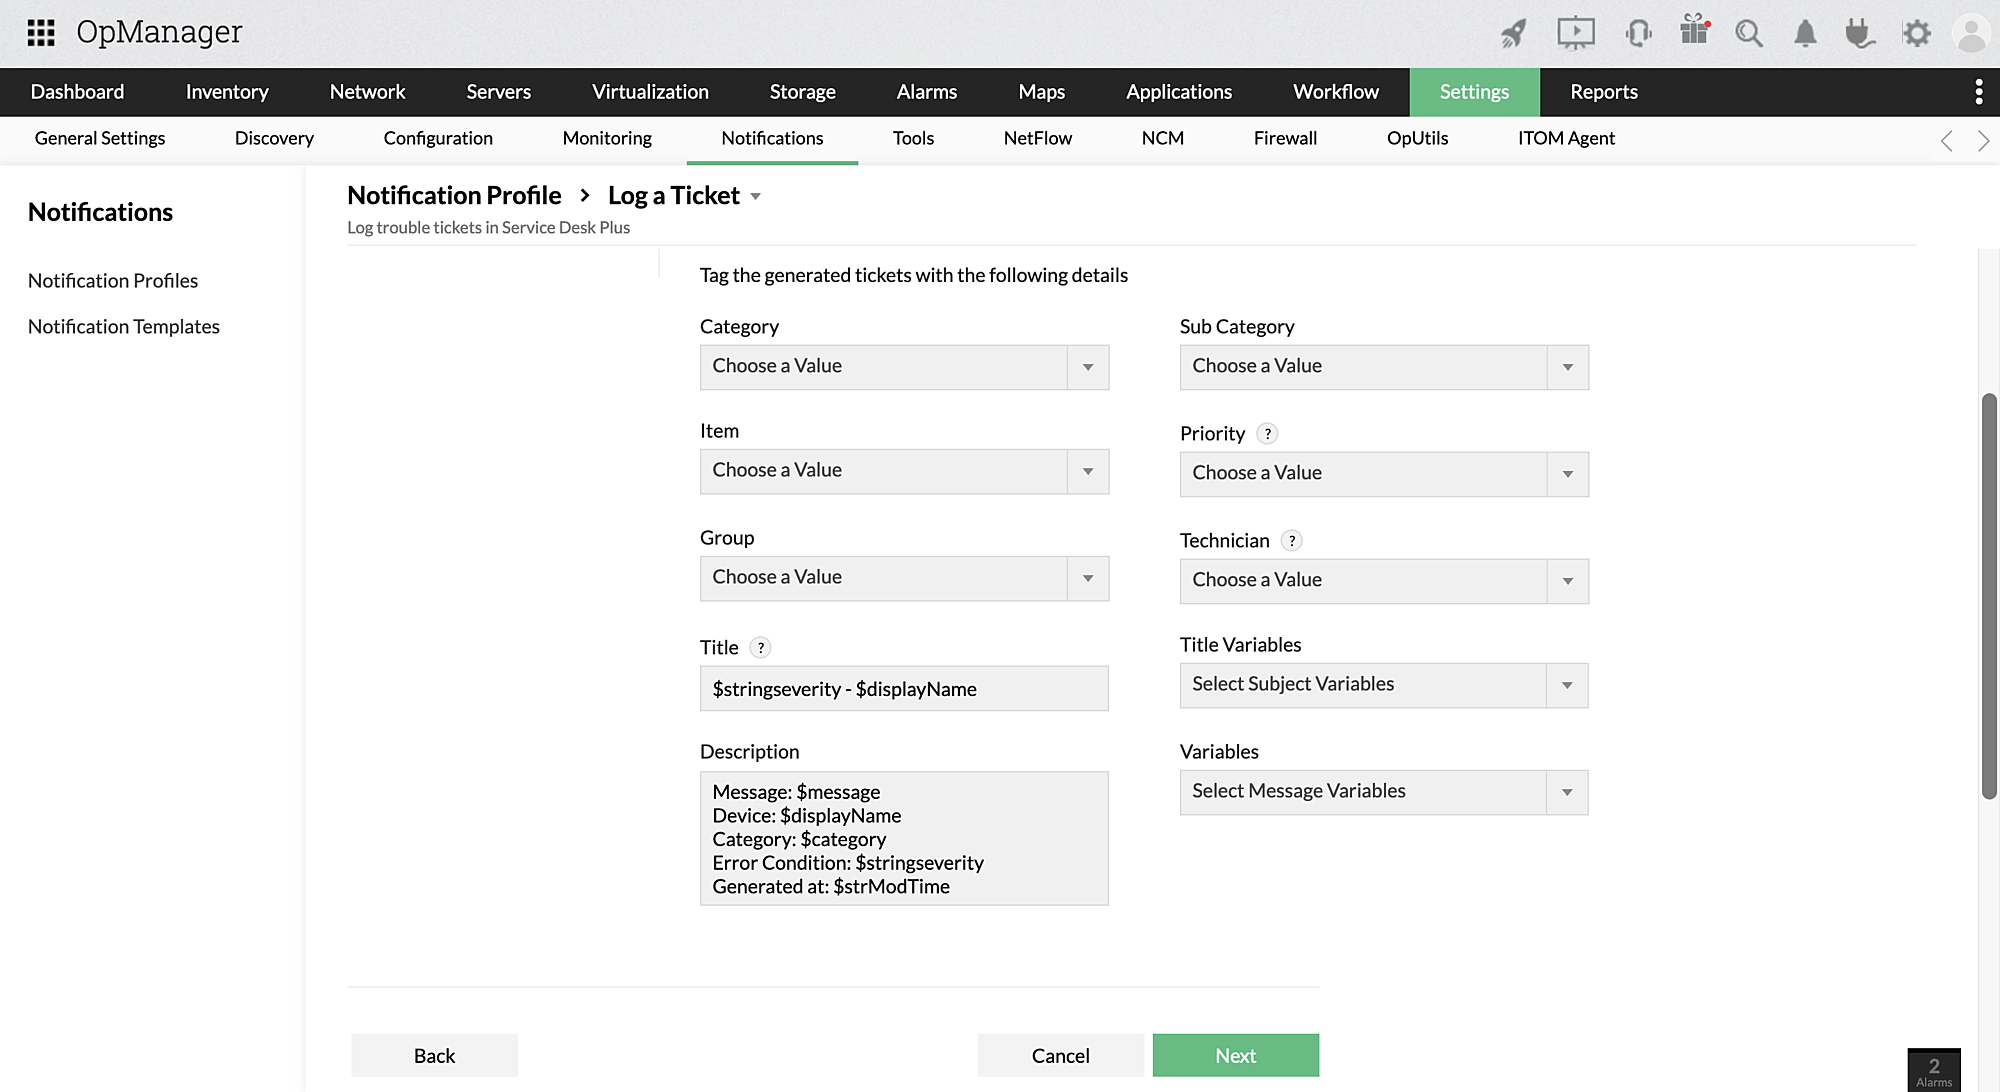
With the integration, devices in OpManager Plus are synced to ServiceDesk Plus' CIs. When OpManager Plus detects an alarm for a device, it automatically logs a ticket in ServceDesk Plus. The tickets will be rich in context: Including monitored information, meta data, and alarm cause. This ensures by the time the users raise an issue, the technicians have the requisite context to diagnose and resolve it.
Try a free, 30 day trialSync alarms with tickets
OpManager Plus raises tickets for select alarms with notification profiles. A two-way sync is established between OpManager Plus' alarms and ServiceDesk Plus' tickets. New alarms from the affected devices are recorded in the tickets, and technician's notes are recorded in the alarms. Alarms are cleared when the ticket is closed and can reopen tickets when they reoccur.
Automate CMDB management
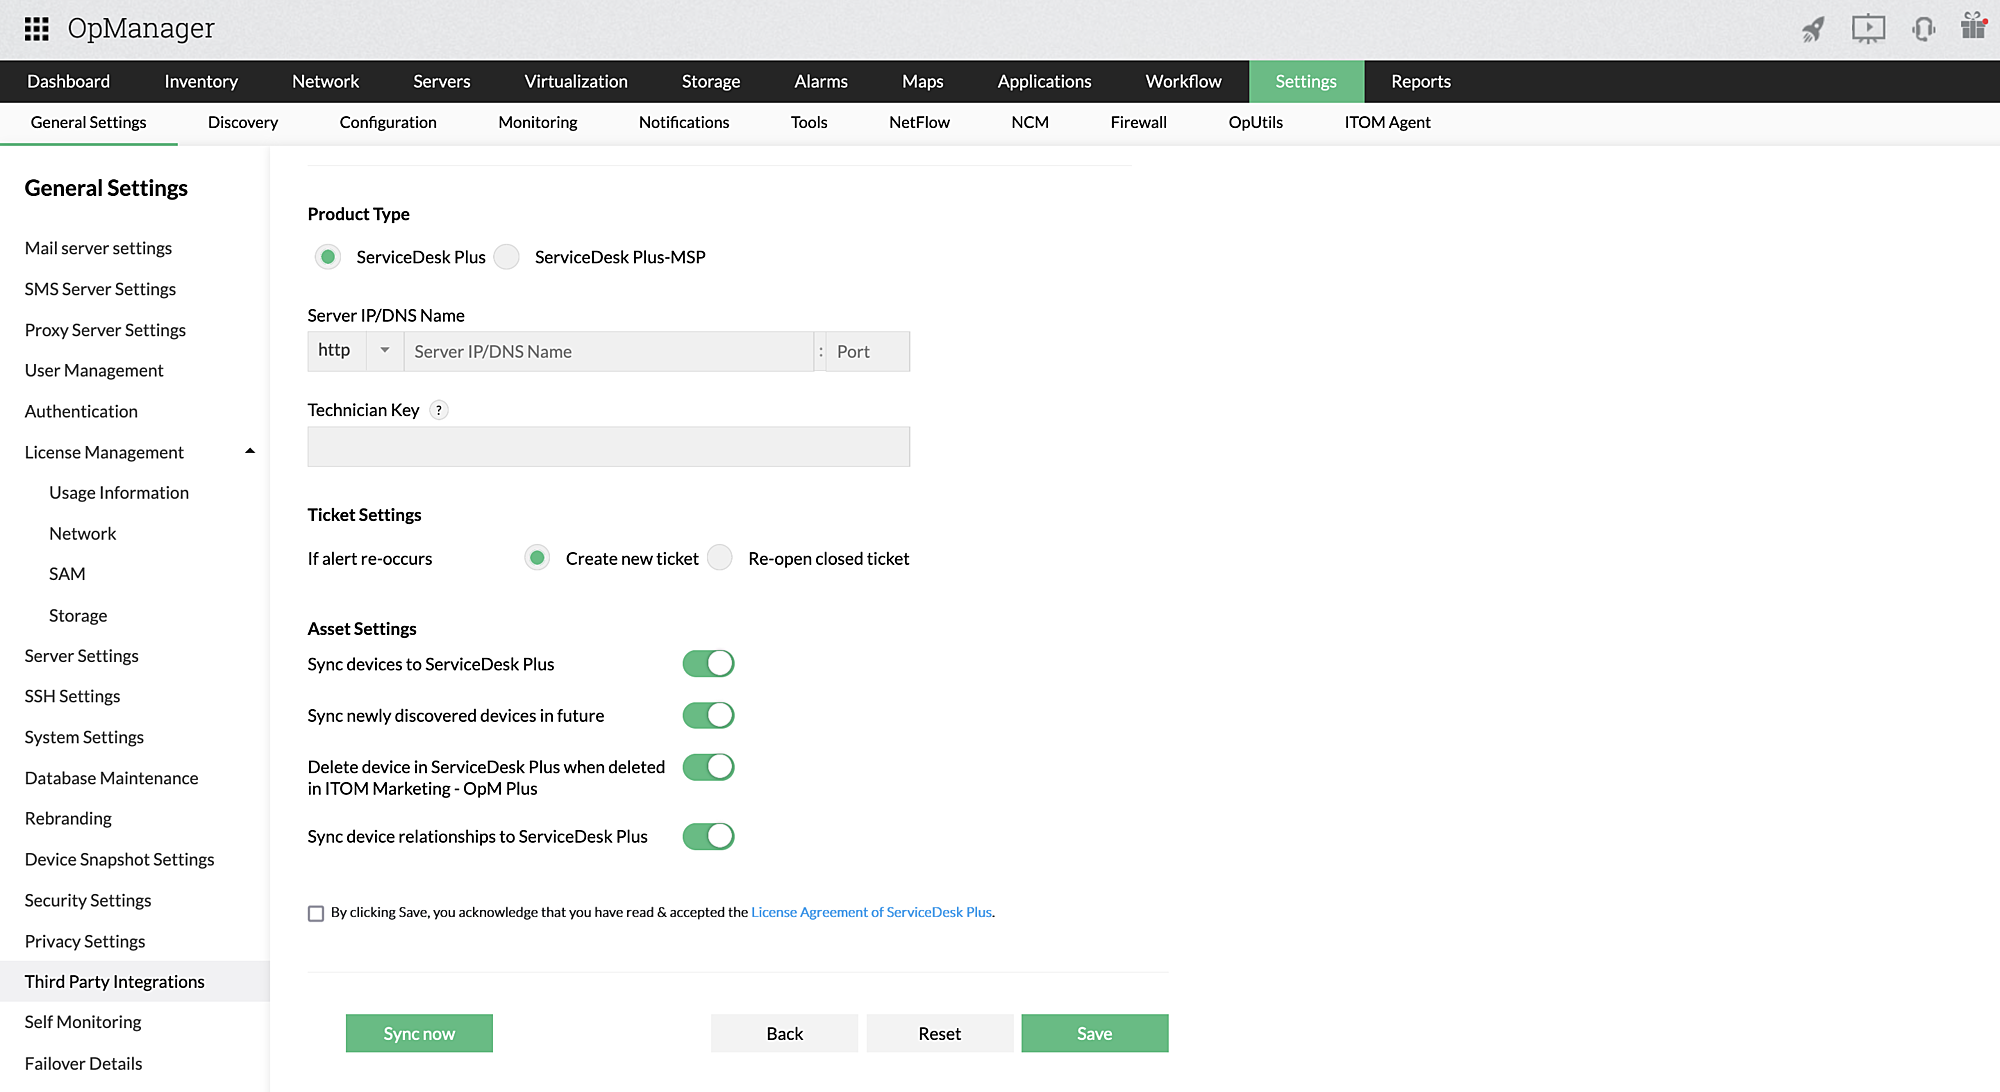
OpManager Plus keeps ServiceDesk Plus CMDB updated with scheduled discovery scans. Newly added devices, their dependencies, and metadata are updated in ServiceDesk Plus while decommissioned devices are removed. Discovery scans can discover LAN, wireless, storage, and virtual networks with dedicated discovery protocols and update this data in the CMDB.
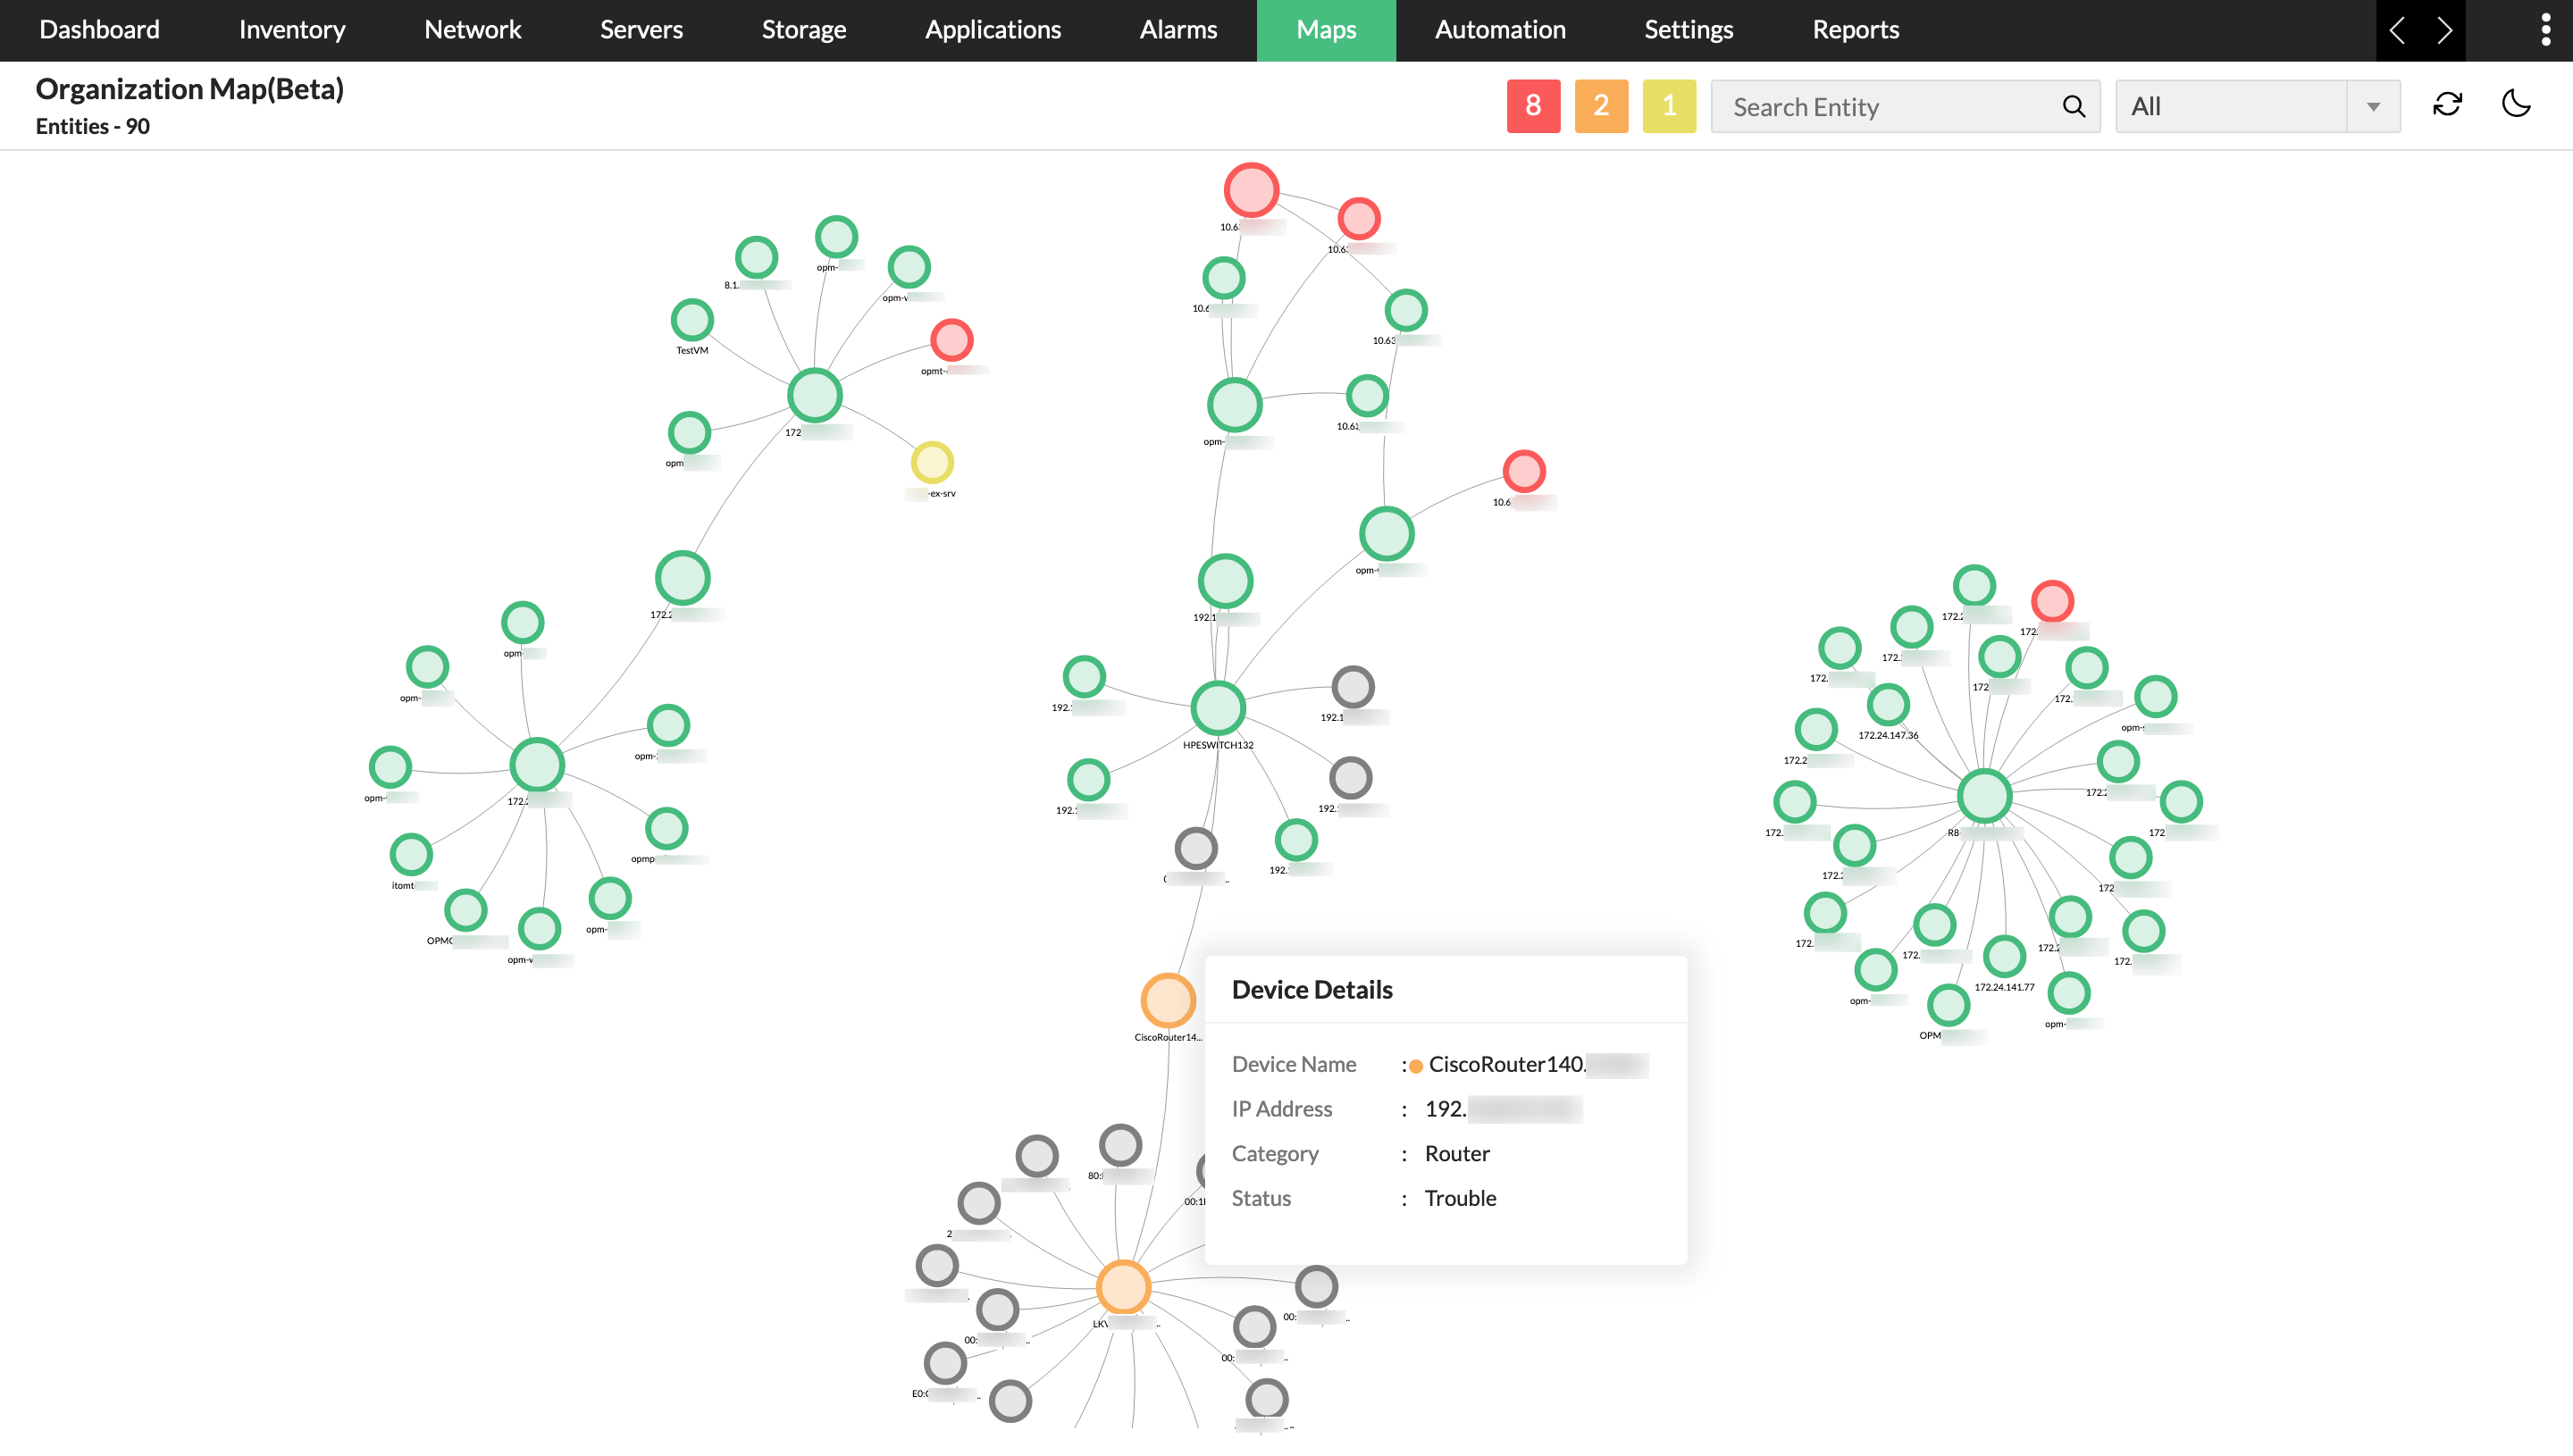
Map relationships across the organization
Relationships between devices, network infrastructure, servers, VMs, applications, and databases are mapped and presented in a sprawling map. When this map is synced with ServiceDesk Plus's relationship maps, technicians can access it to perform impact analysis with ease. Whether it's planned maintenance or unplanned outage, device dependencies, affected devices, and root causes can be isolated.
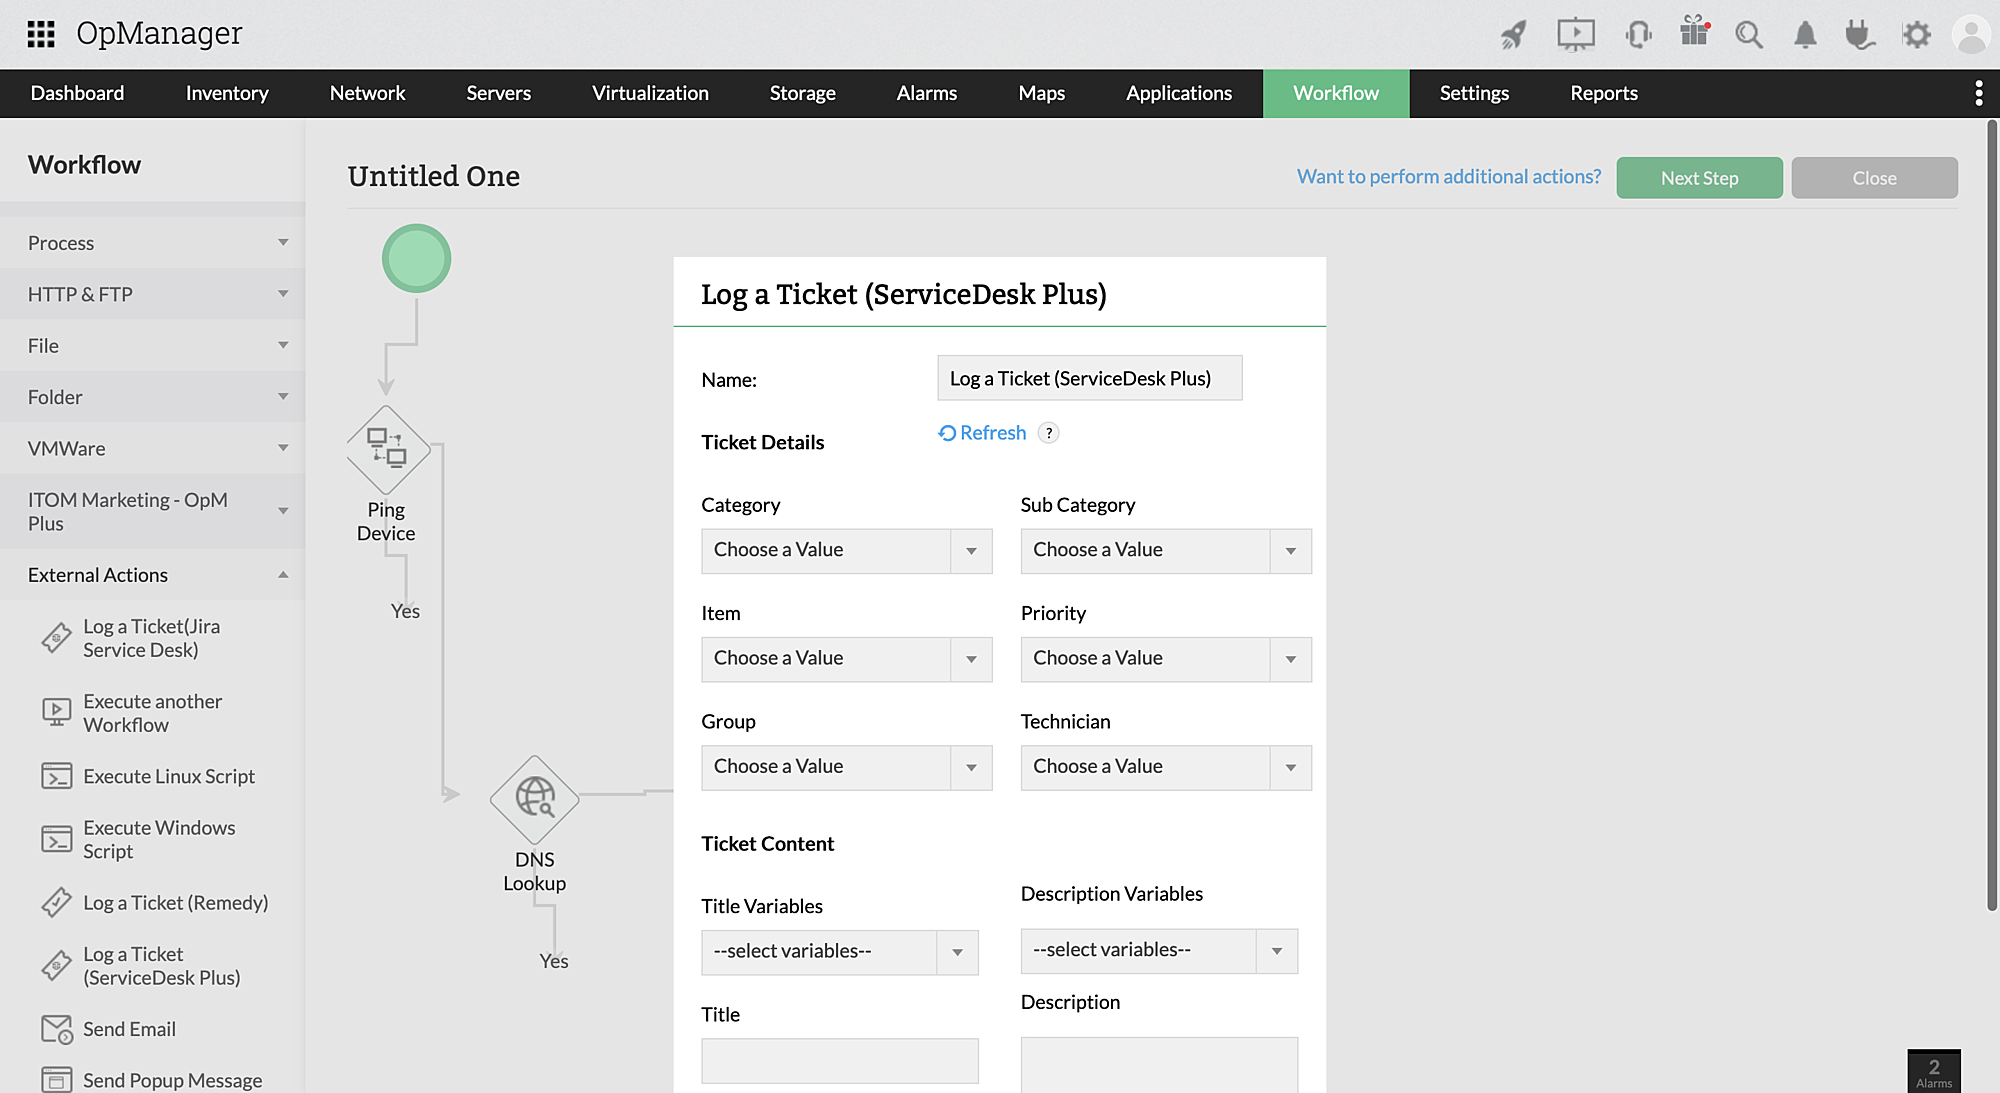
Automate first-level troubleshooting
OpManager Plus can execute first-level diagnostics and troubleshooting before raising tickets on ServiceDesk Plus. You can drag-and-drop actions from a list of 70+ remedial actions and configure these workflows to be triggered by alarms or on a schedule. Workflows can check for reachability, run scripts, execute commands, place devices on maintenance, restart or shutdown servers and services, and more.
Plan downtime for change requests and maintenance
When users raise requests for planned maintenance or asset change requests, you can avoid unnecessary alarm floods with OpManager Plus' downtime schedules. Users can configure the exact period the device is expected to be down or affected by the change in ServiceDesk Plus' "Change" section. OpManager Plus will suspend monitoring these devices within that time frame to ensure that alarm are not generated.
Full-stack observability with OpManager Plus
OpManager Plus helps you monitor and manage the entire IT stack from a single console. With extensive logs, in-depth metrics, and end-to-end traces, you can detect and resolve any issue in any part of the IT stack in no time. IT teams can replace multiple siloed IT tools with a unified IT management interface to improve correlation, minimize complexity, and reduce licensing spend.

OpManager Plus - ServiceDesk Plus Integration in action
Watch this on-demand webinar on how you can ensure high availability and business continuity by integrating ManageEngine OpManager and ServiceDesk Plus.
Loved by customers all over the world
“Easy Implementation, Excellent support & Lower Cost Tool - Team Lead, IT Services Industry”
Reviewer Role: Infrastructure and Operations
Company size: 500M - 1B USD
We have been using OpManager since 2011 and our overall experience has been excellent. The tool plays a vital role in providing the value to our organization and to the customers we are supporting. The support is excellent and staff takes full responsibilities in resolving the issues. Innovation is never stopping and clearly visible with newer versions.
“OpManager - 10 steps ahead of the competition, one step away from being unequaled - Network Services Manager, Government Organization”
Reviewer Role: Infrastructure and Operations
Company size: 5,000 - 50,000 Employees
I have a long standing relationship with ManageEngine. OpManager has always missed one or two features that would make it truly the best tool on the market, but over it is the most comprehensive and easy to use the product on the market.
“Easy Implementation with a feature rich catalogue, support has some room for improvement - NOC Manager, IT Services Industry”
Reviewer Role: Program and Portfolio Management
Company size: 500M - 1B USD
The vendor has been supportive during the implementation & POC phases providing trial licenses. Feature requests and feedbacks is usually acted upon swiftly. There was sufficient vendor support during the implementation phase. After deployment, the support is more than adequate, where the vendor could make some improvements.
“Great Monitoring tool - CIO in Finance Industry”
Reviewer Role: CIO
Company size: 1B - 3B USD
ManageEngine provides a suite of tools that have made improvements to the availability of our internal applications. From monitoring, management and alerting, we have been able to peak performance within our data center.
“Simple Implementation, Easy To Use. Very Intuitive. - Principle Engineer in IT Services”
Reviewer Role: Enterprise Architecture and Technology Innovation
Company size: 250M - 500M USD
ManageEngine support was responsive to all our queries.

“OpManager helps me monitor all aspects of the data-center and equipment like servers, switches and routers. It is fast, intuitive and centralized and you do not need to be an expert to deal with OpManager.”
Altaleb Alshenqiti
NGHA

“Donald Stewart, IT Manager of Crest Industries is happy with ManageEngine OpManager for its end-to-end network monitoring software. It is easy-to-use and offers fault and performance management for router.”
Donald Stewart
IT Manager, Crest Industries

“John Rosser, MIS Manager of Yale Chase talks about the proactive nature of ManageEngine OpManager & how his organisation gained value from it.”
John Rosser
MIS Manager
