- HOME
- ITOps Analytics
- Optimize IT infrastructure spending using advanced analytics
Optimize IT infrastructure spending using advanced analytics
- Last Updated: July 1, 2024
- 618 Views
- 3 Min Read
An organization's IT infrastructure is perhaps one of its biggest investments and, therefore, it's imperative that organizations focus on the performance of their infrastructure to ensure they give you the maximum bang for your buck.
The diverse nature and demands of different organizations means there's no single approach to managing IT infrastructure at scale, optimizing its usage, and ultimately, the money invested in it. Monitoring infrastructure usage, including all the servers and applications hosted on it, has proven to be somewhat helpful in understanding infrastructure usage and spending. However, a better approach is to track infrastructure by type such as cloud, on-premises, and the highly sought-after hybrid infrastructure.
This helps address two major challenges:
Tackle the avalanche of performance data flowing in: Most cloud infrastructure providers' monitoring services pump in a surplus of data into your systems. Besides, organizations prefer to deploy their own infrastructure monitoring applications to track performance. Not only does this create the obvious problem of duplication but depending on the type and number of infrastructure, organizations end up with a surplus of data, with no way of knowing how to categorize, segment, and utilize them to obtain beneficial information.
Focus on performance, and in turn, the ROI, based on the type of infrastructure: Focus on metrics pivotal to infrastructure usage and performance based on their type. For instance, for entirely cloud infrastructures, its important to track the number of server instances and their usage because vendors such as Amazon, Microsoft Azure, and Google charge organizations based on server configuration and the duration of usage. However, for private infrastructure, it's important to track availability along with usage and the number of server instances because the responsibility of ensuring availability in an on-premises deployment falls on that organization’s IT team.
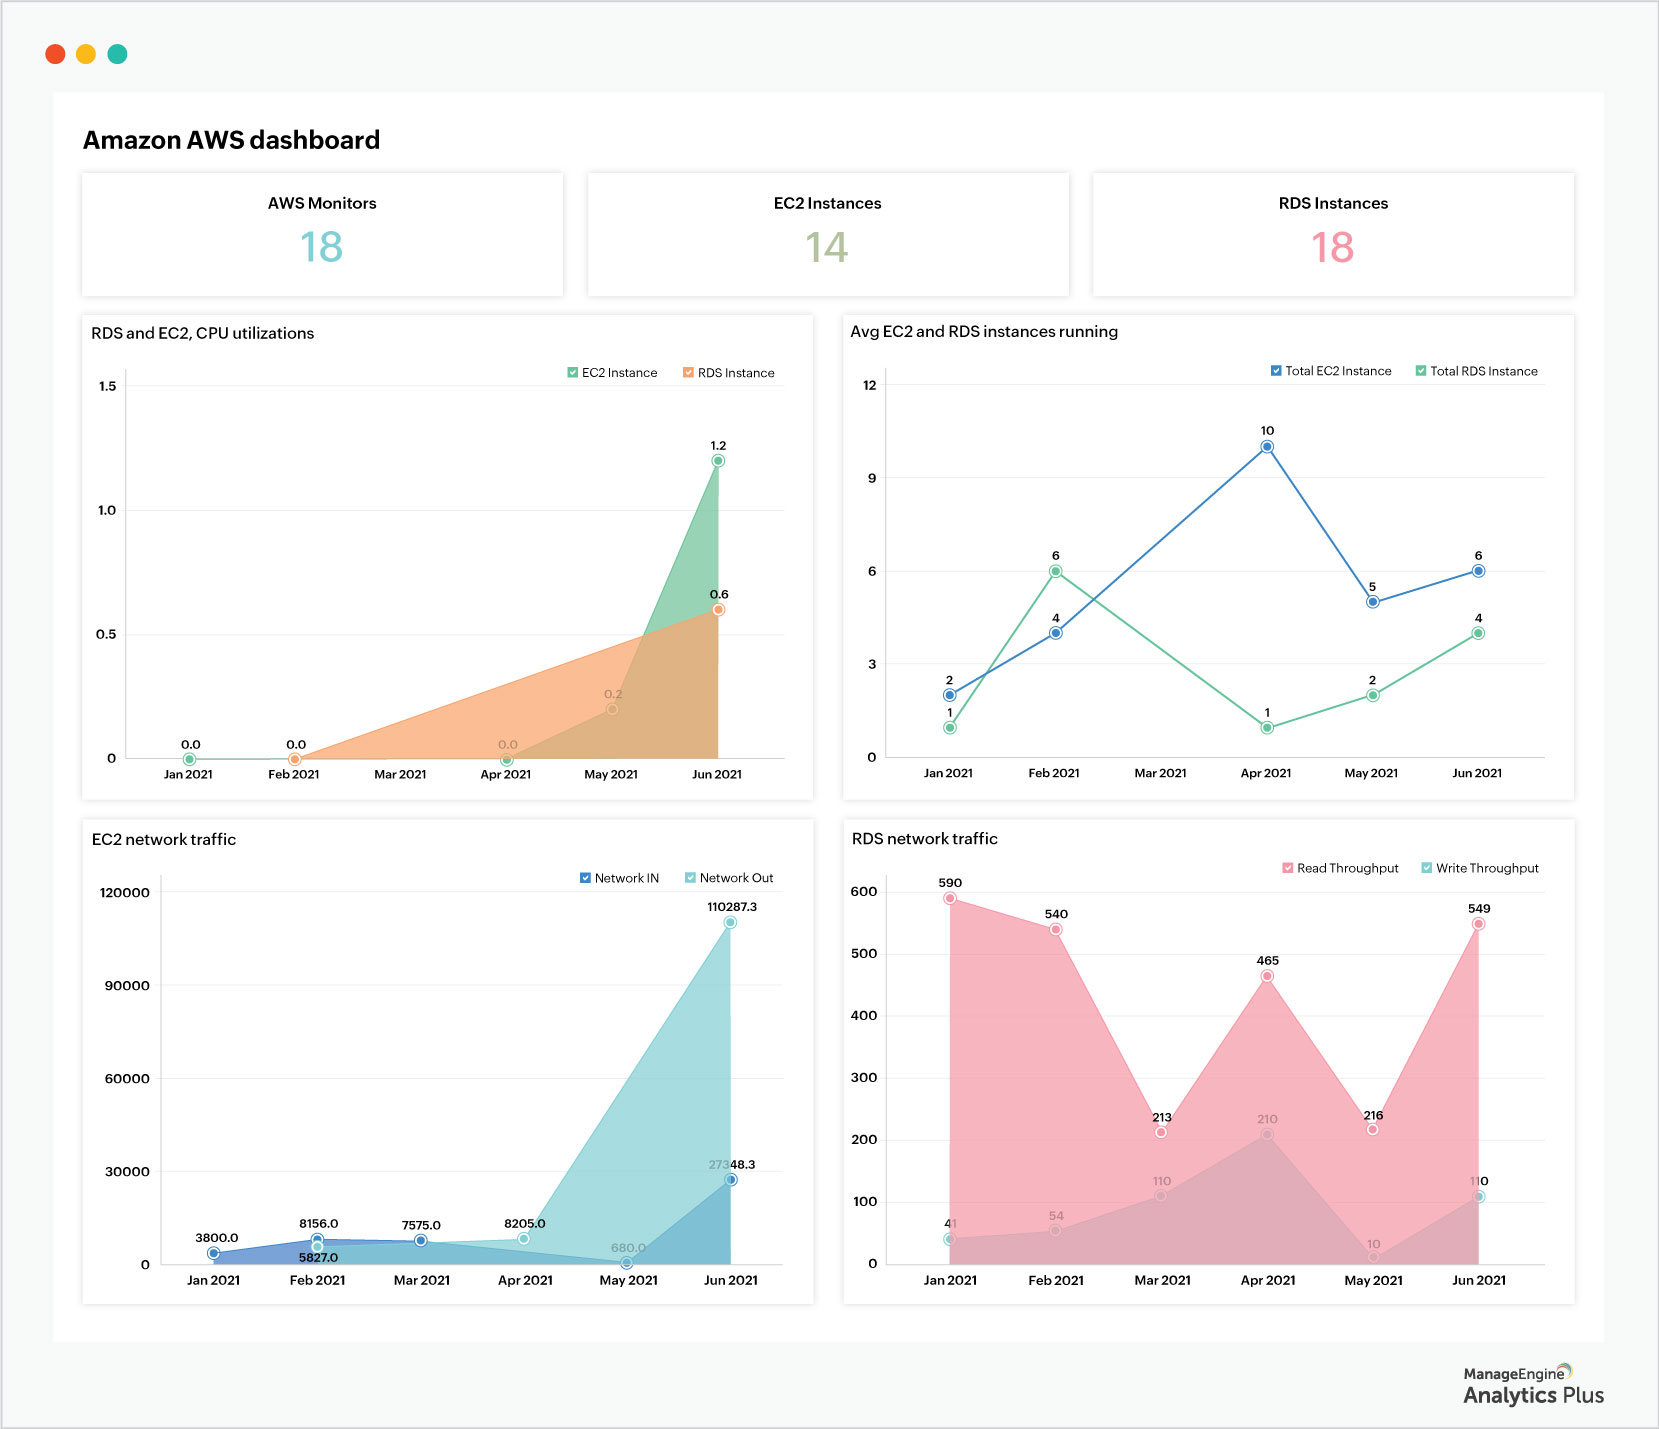
Shown below is a dashboard built specifically to track metrics critical to an AWS infrastructure. The dashboard displays metrics, such as the number of AWS, EC2, and RDS instances in use, along with a trend of historical usage. This enables organizations to track the scale of deployment, and determine if it’s in line with business needs. Metrics such as RDS and EC2 CPU utilization, RDS and EC2 network traffic, and disk I/O indicate whether the server configuration matches their performance needs. Organizations can use this information to understand how infrastructure is being used, to cut down on unused infrastructure, and even to plan future infrastructure purchases based on historical infrastructure usage.
For hybrid deployments, i.e, a combination of apps running on-premises and on public cloud, organizations should use a section of this dashboard to display alarms raised from the AWS infrastructure to make it easy to isolate issues faster and aid with quick remediation. Besides, a thorough knowledge of hybrid infrastructure usage makes it easier for teams to scale or cut down on cloud usage based on demand, helping you save on your infrastructure costs.
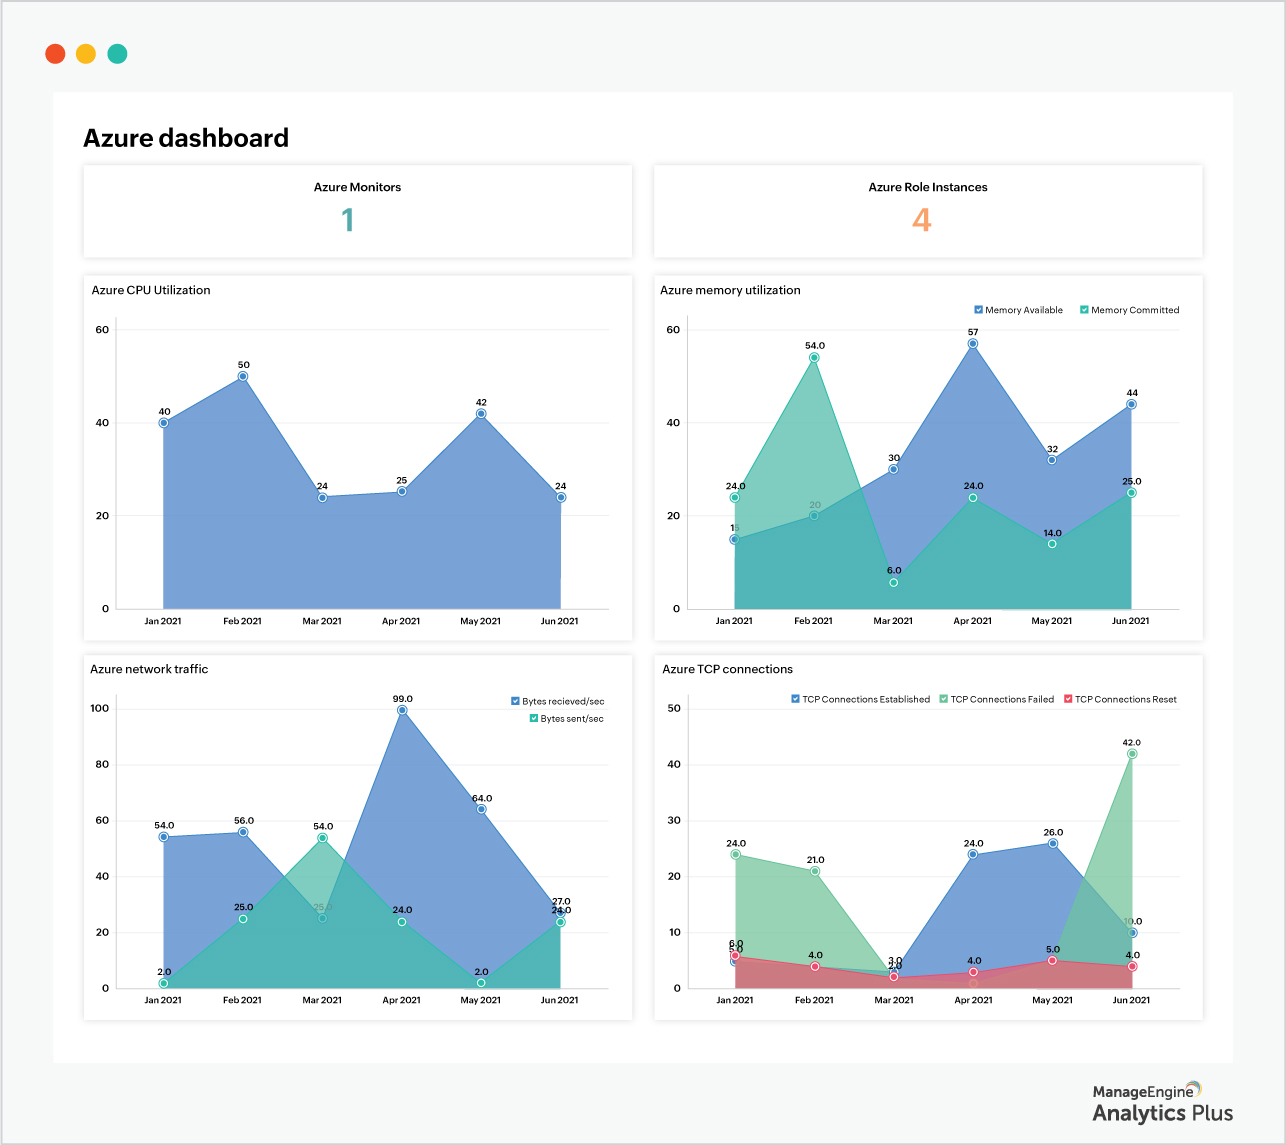
Here's a dashboard built for the Microsoft Azure infrastructure.
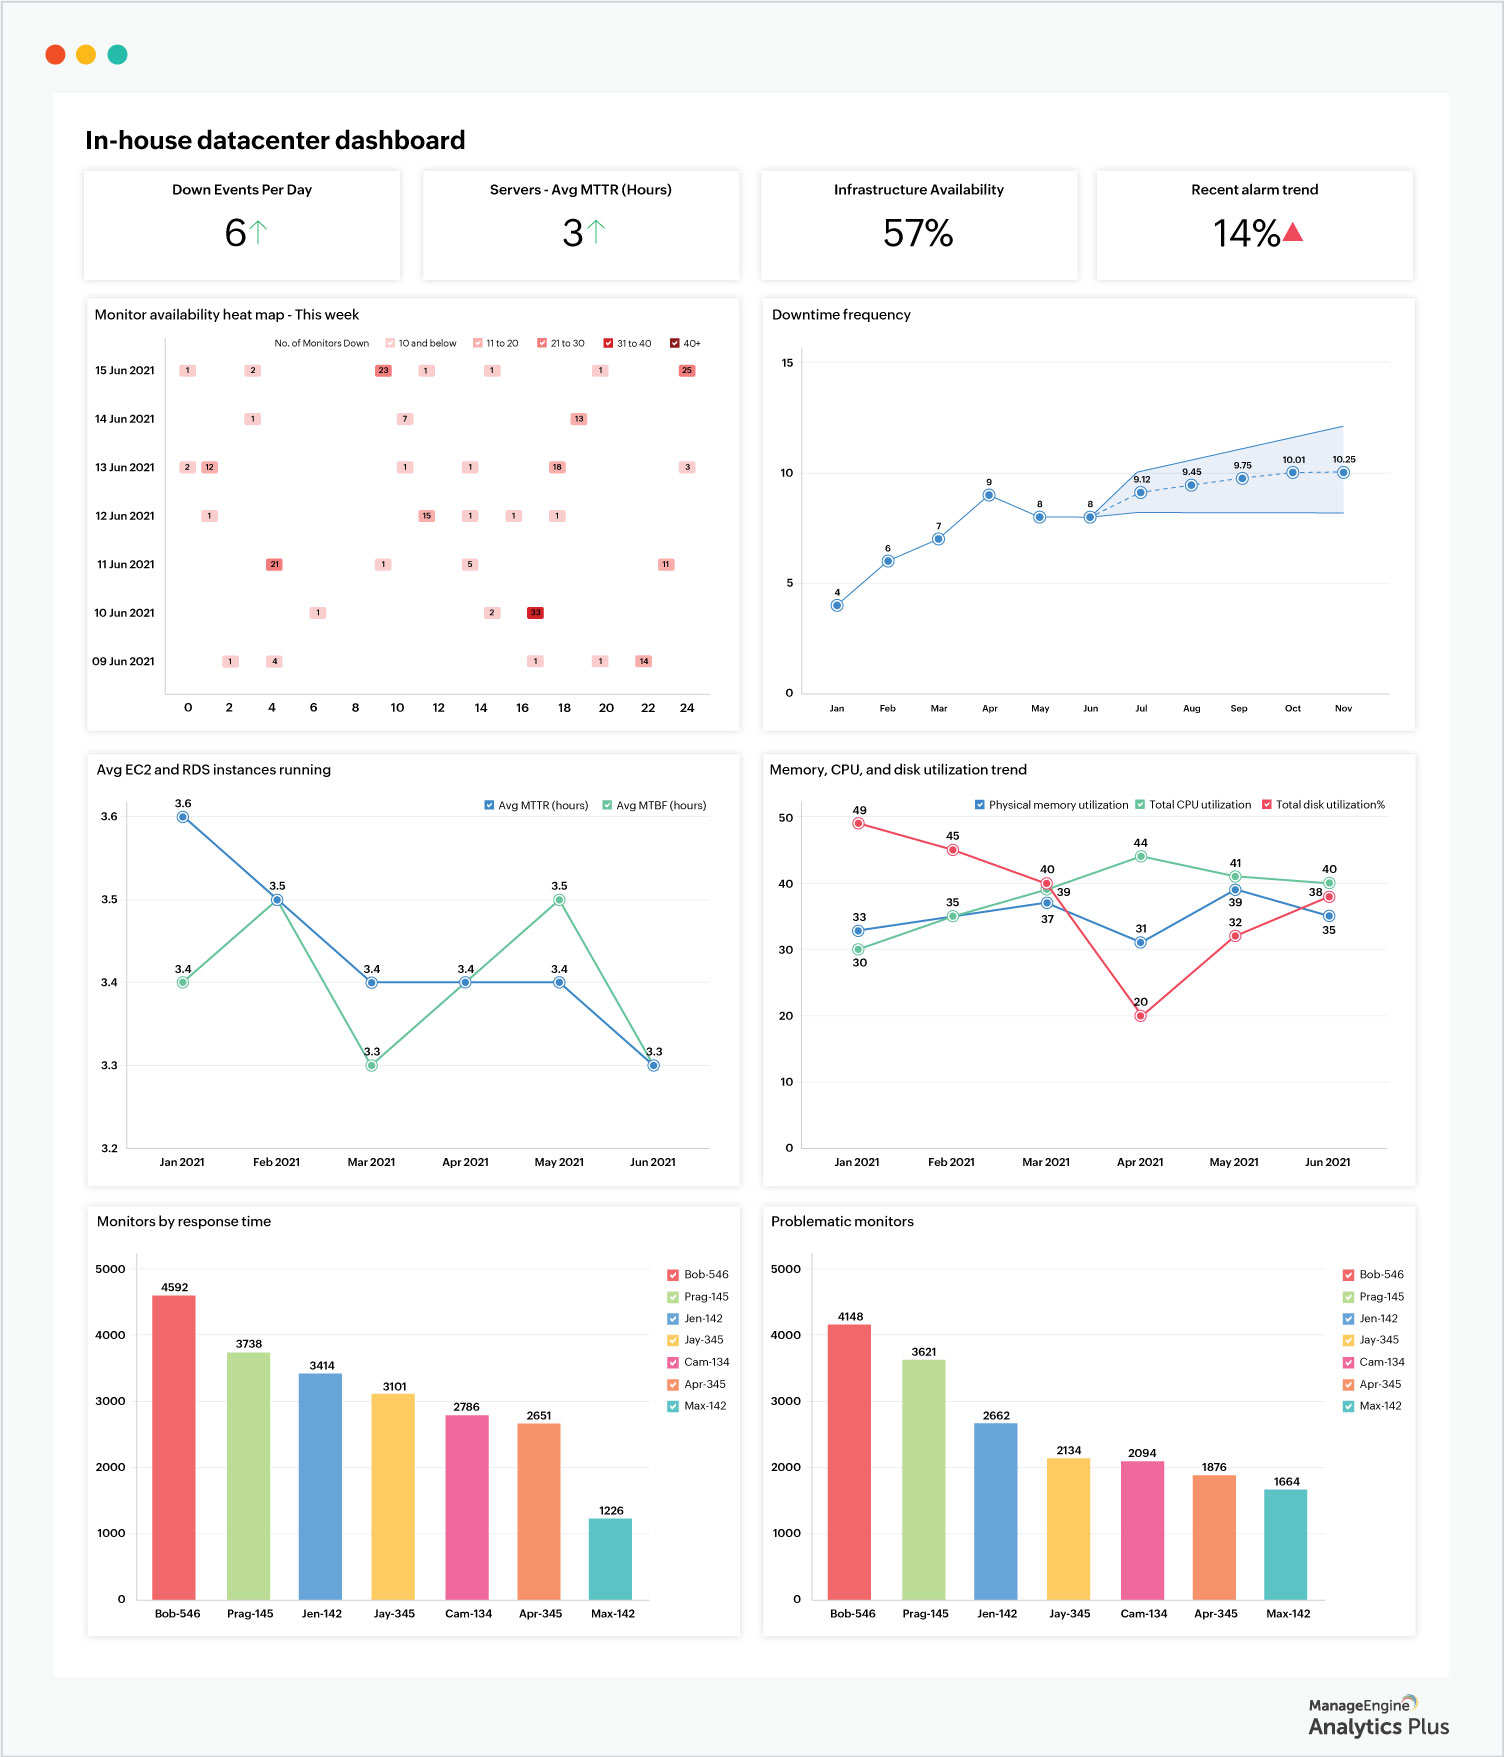
For private infrastructure, critical metrics include network bandwidth, availability, and uptime in addition to usage and performance of the apps that run on them. This is because private cloud infrastructure or in-house datacenters are primarily maintained by internal IT teams who are responsible for the upkeep of the infrastructure and ensuring peak performance of the apps that run on them. Organizations that primarily run infrastructure on premises should equate downtime with loss of revenue. This equation will lay higher emphasis on ensuring systems are up and running all the time.
These dashboards were built using Analytics Plus, ManageEngine's AI-enabled IT analytics application. If you'd like to create similar dashboards to view the availability, performance, and usage of your IT infrastructure, download Analytics Plus for free.
Need help setting up these dashboards? Set up a session with our experts for free, and learn how to create your own dashboards.
 Sailakshmi
Sailakshmi is an IT solutions expert at ManageEngine. Her focus is on understanding IT analytics and reporting requirements of organizations, and facilitating blended analytics programs to help clients gain intelligent business insights. She currently spearheads marketing activities for ManageEngine's advanced analytics platform, Analytics Plus.