


Timeline
2026
2026
June
Build Number: 6410 (Release on: June 23, 2026)
Introducing Live Connect support for ODBC
EnhancementAnalytics Plus now allows you to connect live with ODBC supported database.
Issues fixed
Issues fixedThe Apache OpenNLP vulnerabilities (CVE-2026-42027, CVE-2026-40682, and CVE-2026-42440) have been addressed in this release.
Enhanced In-product Chat Experience
NewThe in-product chat experience has been enhanced with a chatbot that provides immediate responses to common Analytics Plus queries and allows users to connect with a support agent on request seamlessly.
Build Number: 6400 (Release on: June 02, 2026)
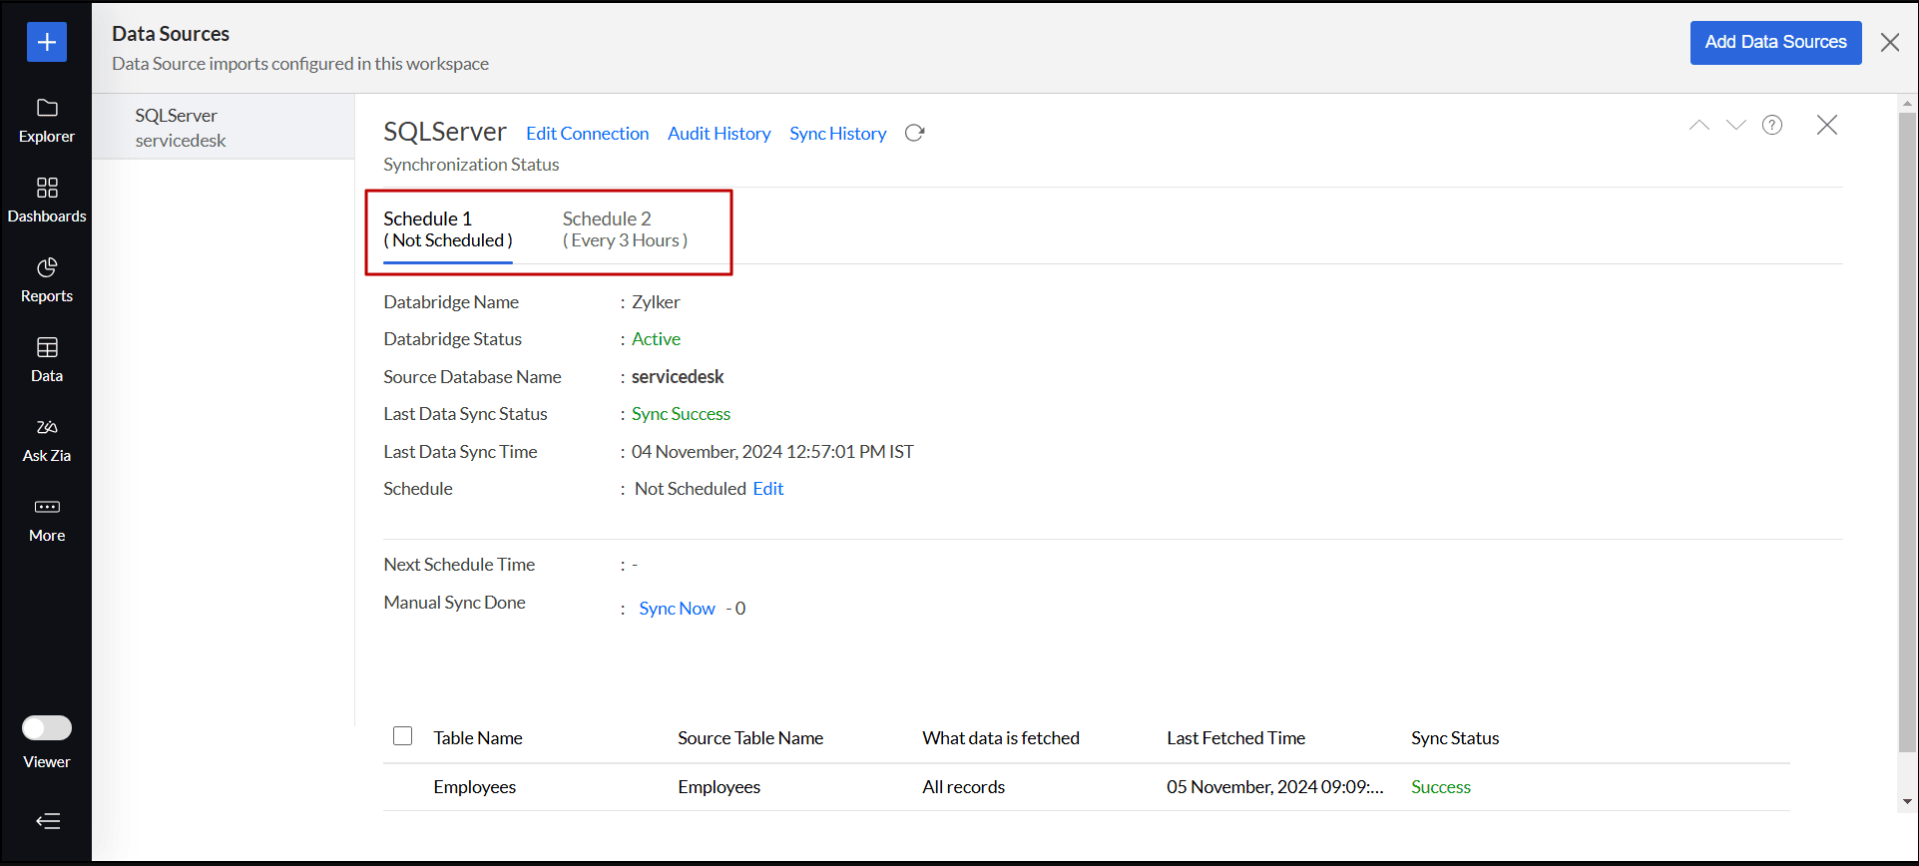
Move tables from one schedule to another
EnhancementAnalytics Plus now provides the flexibility to alter the sync schedules of tables in a workspace individually, making it easier to manage and organize data sync intervals from different sources.
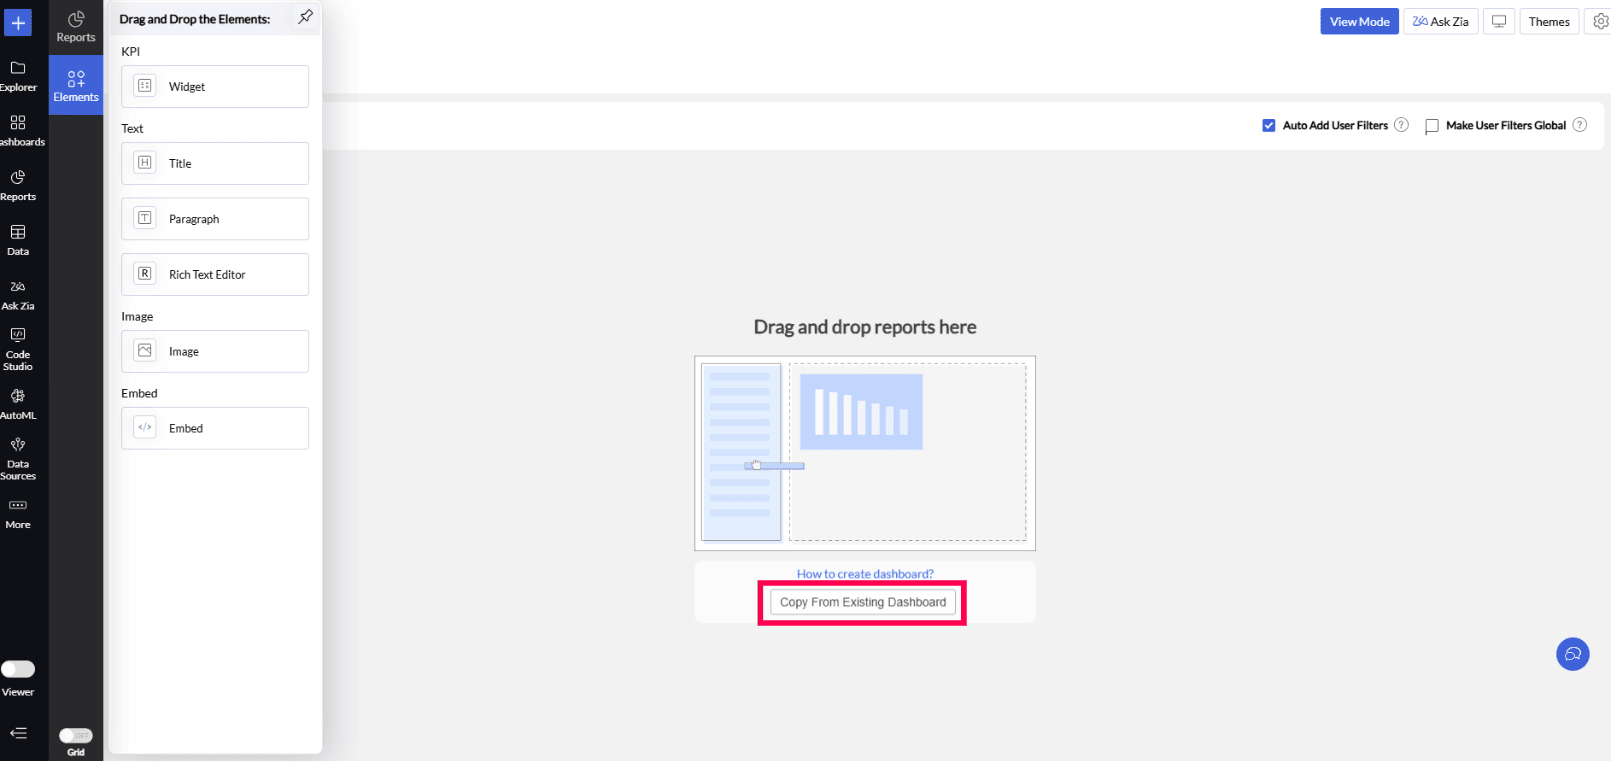
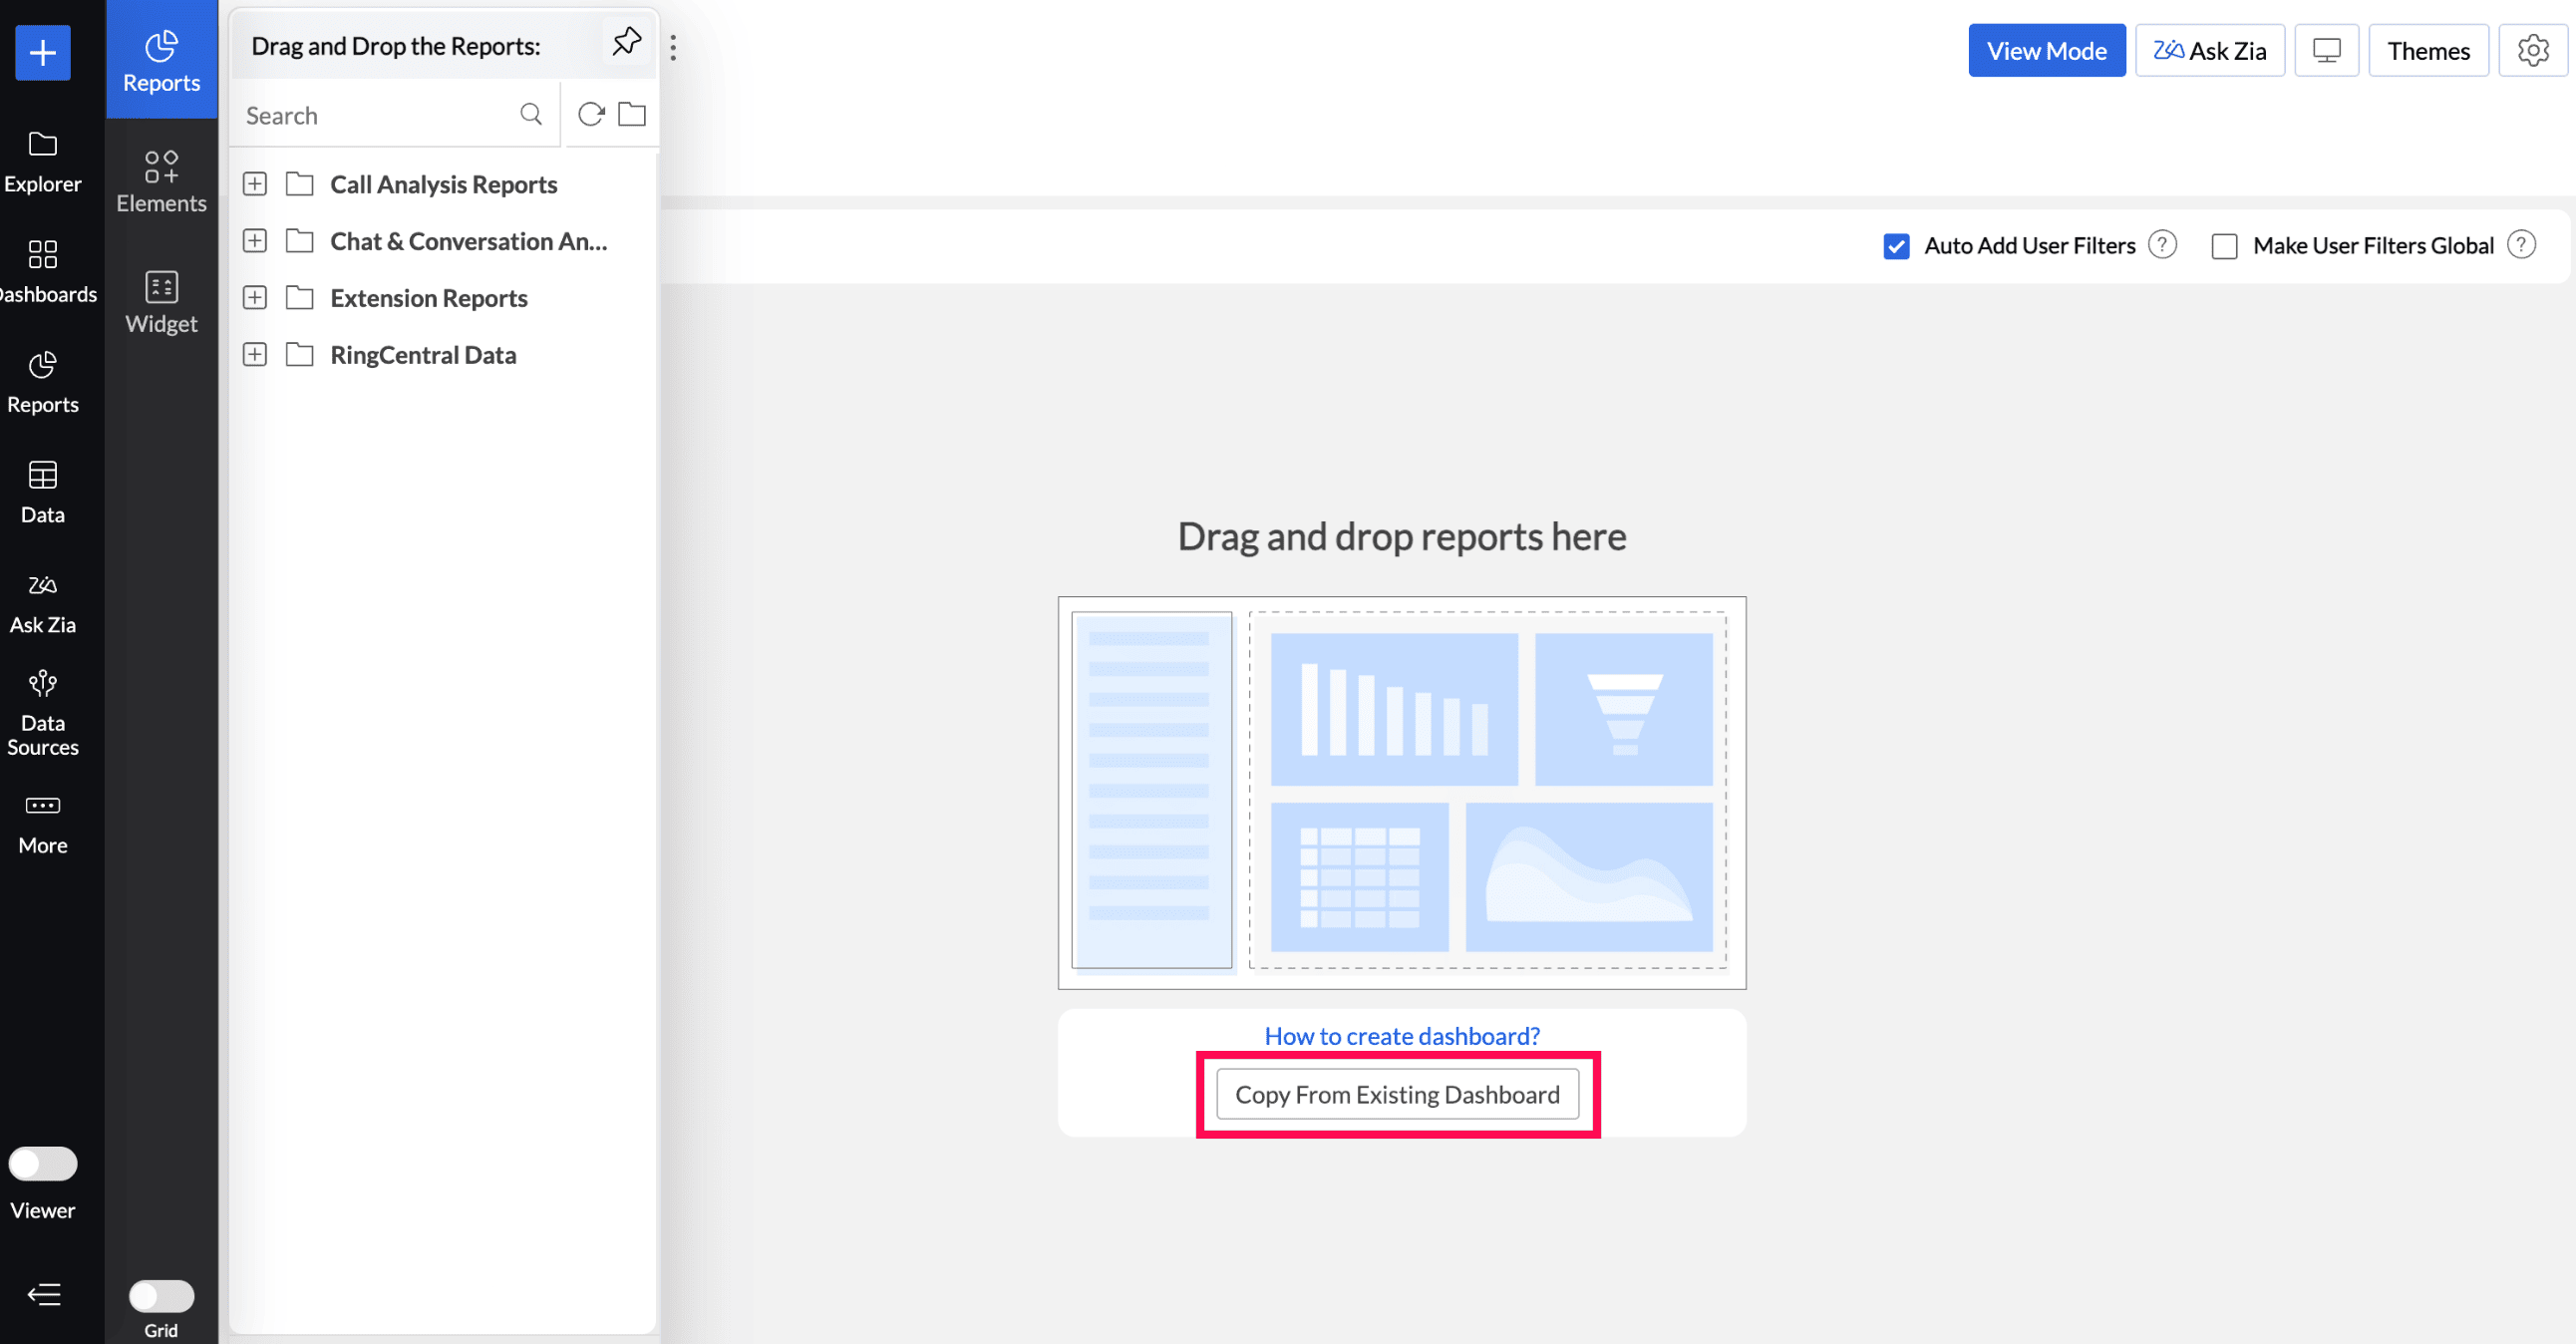
Dashboard Revamp
EnhancementThe "Copy from Existing Dashboard" option has been enhanced to provide a smoother and more intuitive way to reuse existing dashboards as a base for new dashboards.
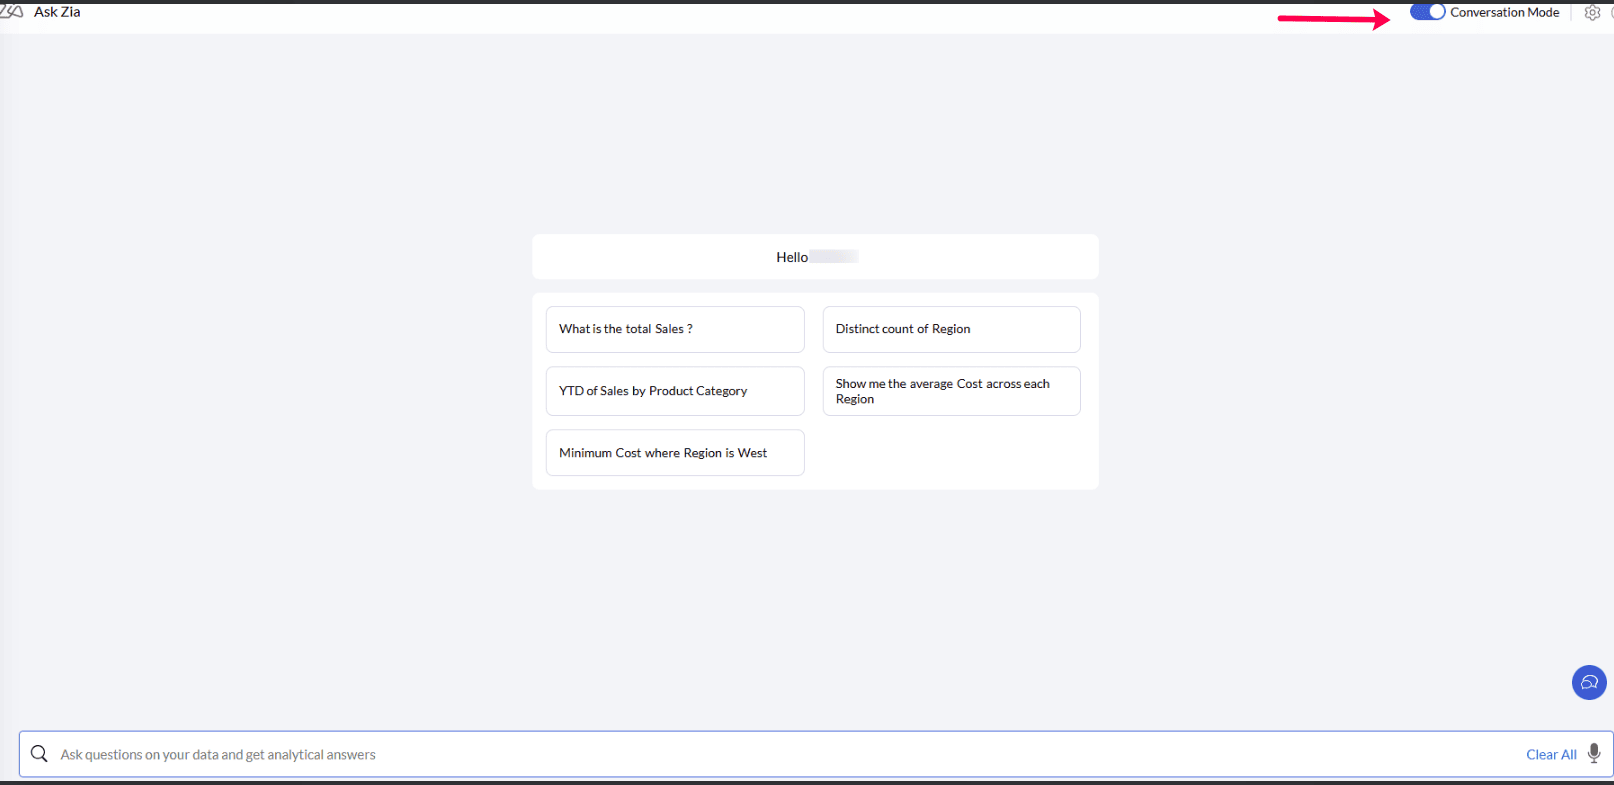
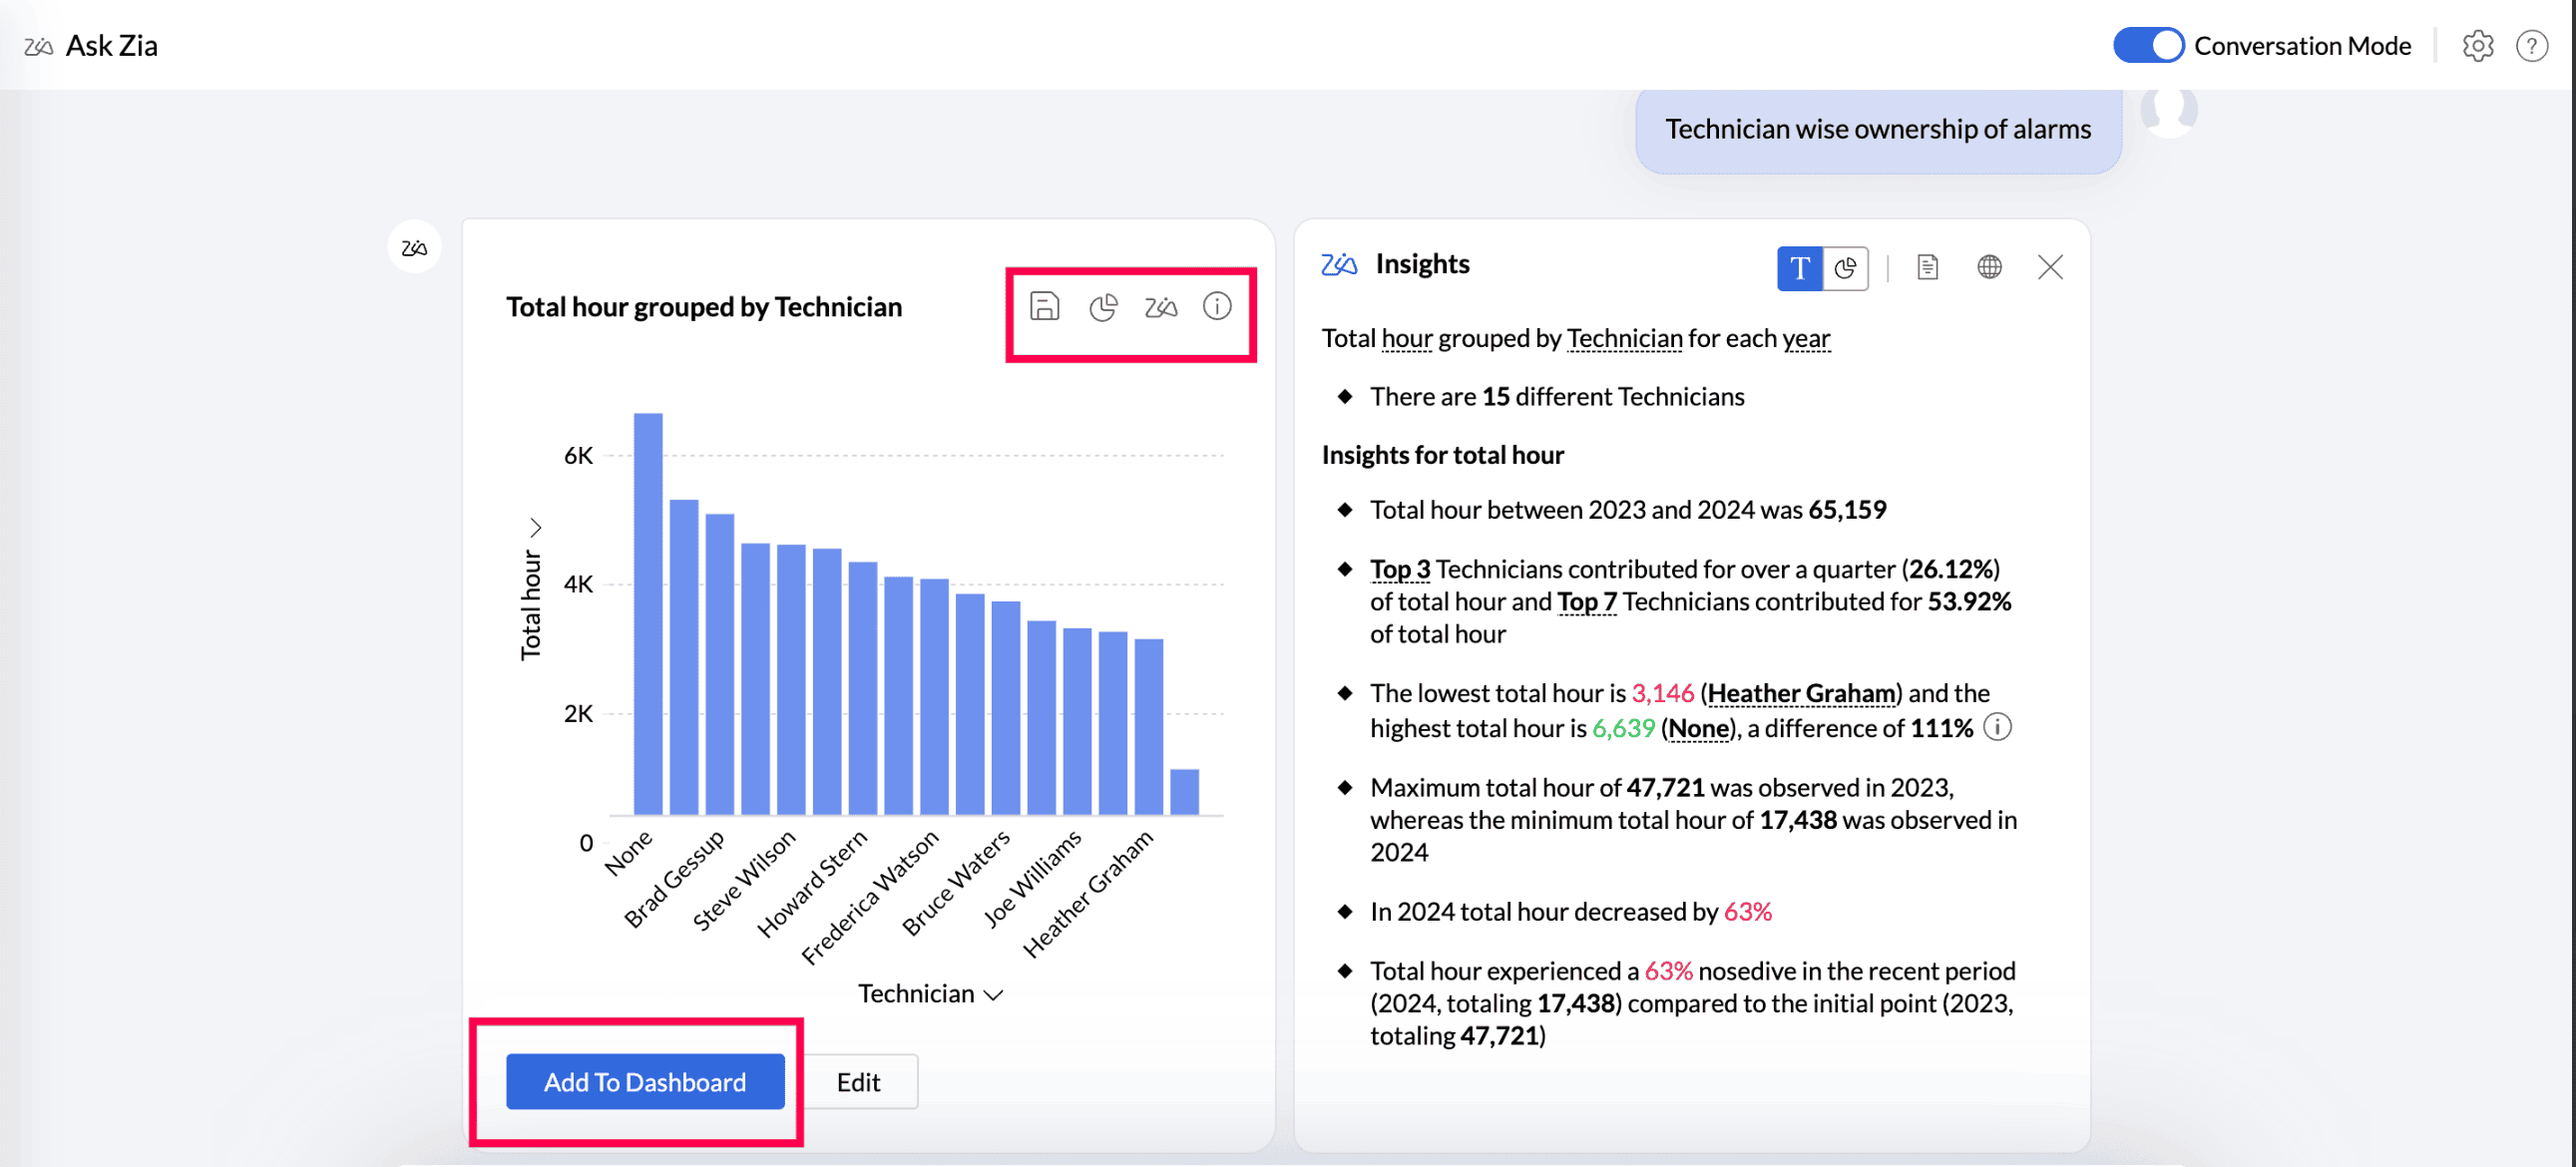
Enhanced Ask Zia UI for a Better Experience
EnhancementThe Ask Zia interface in Analytics Plus has been revamped for a more intuitive user experience. Key enhancements include:
- Clear toggle button to enter conversation mode.
- Zia Insights are presented in a dedicated space, optimizing content structure and enhancing readability.
- Insights are now displayed in a separate card for better clarity.
- The "Add to Dashboard" option has moved to the bottom for easier access.
Common Query Table Expression (CTE) support in Query Tables
EnhancementWe have added support for Common Table Expressions (CTE) in Query Tables, making it easier to write, manage, and optimize complex queries. With CTEs, you can break down large queries into modular, reusable components for better readability and performance.
Specify Dataset Location in Google BigQuery Integration
EnhancementYou can now define the dataset location when importing data from Google BigQuery into Analytics Plus. This enhancement provides more flexibility and better performance when working with BigQuery data in Analytics Plus.
Ask Zia — Brazilian Portuguese language support
NewWith the latest update, Ask Zia now includes support for Brazilian Portuguese to enhance the user experience for Portuguese-speaking audiences.
Introducing local database connectivity with Cassandra
NewAnalytics Plus now supports database connections to Cassandra, allowing you to import data from your on-premise Cassandra instances for reporting and analysis. This addition enhances support for distributed and scalable database systems.
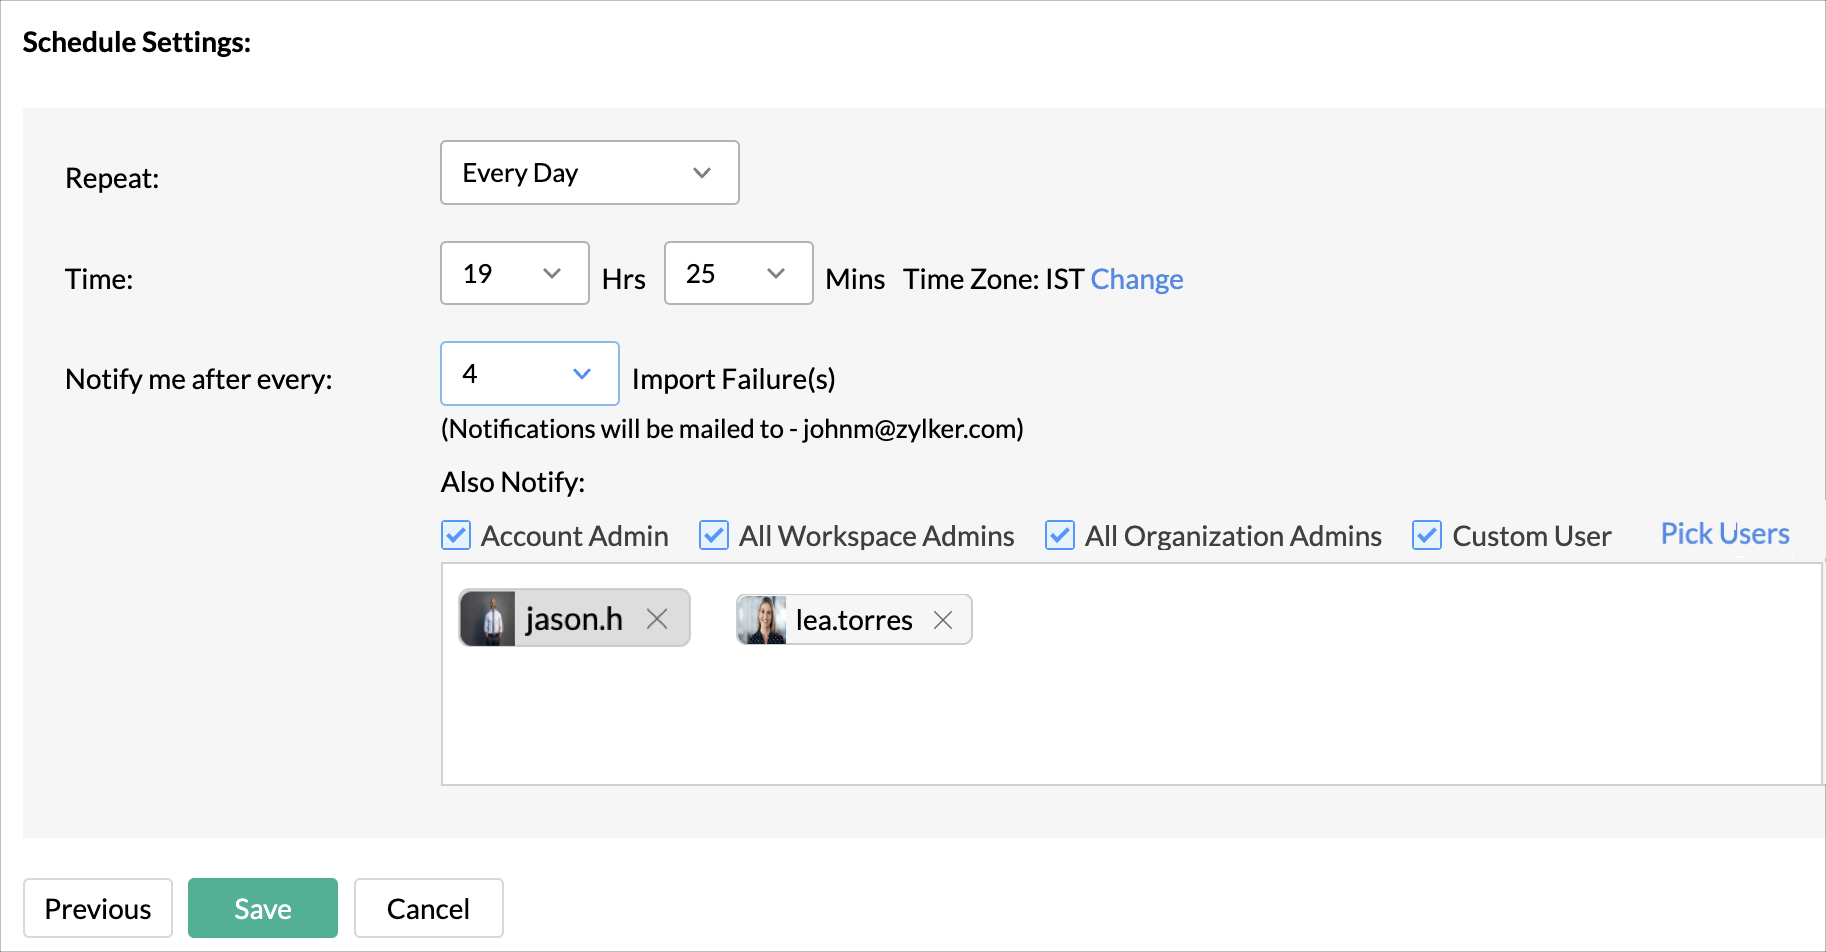
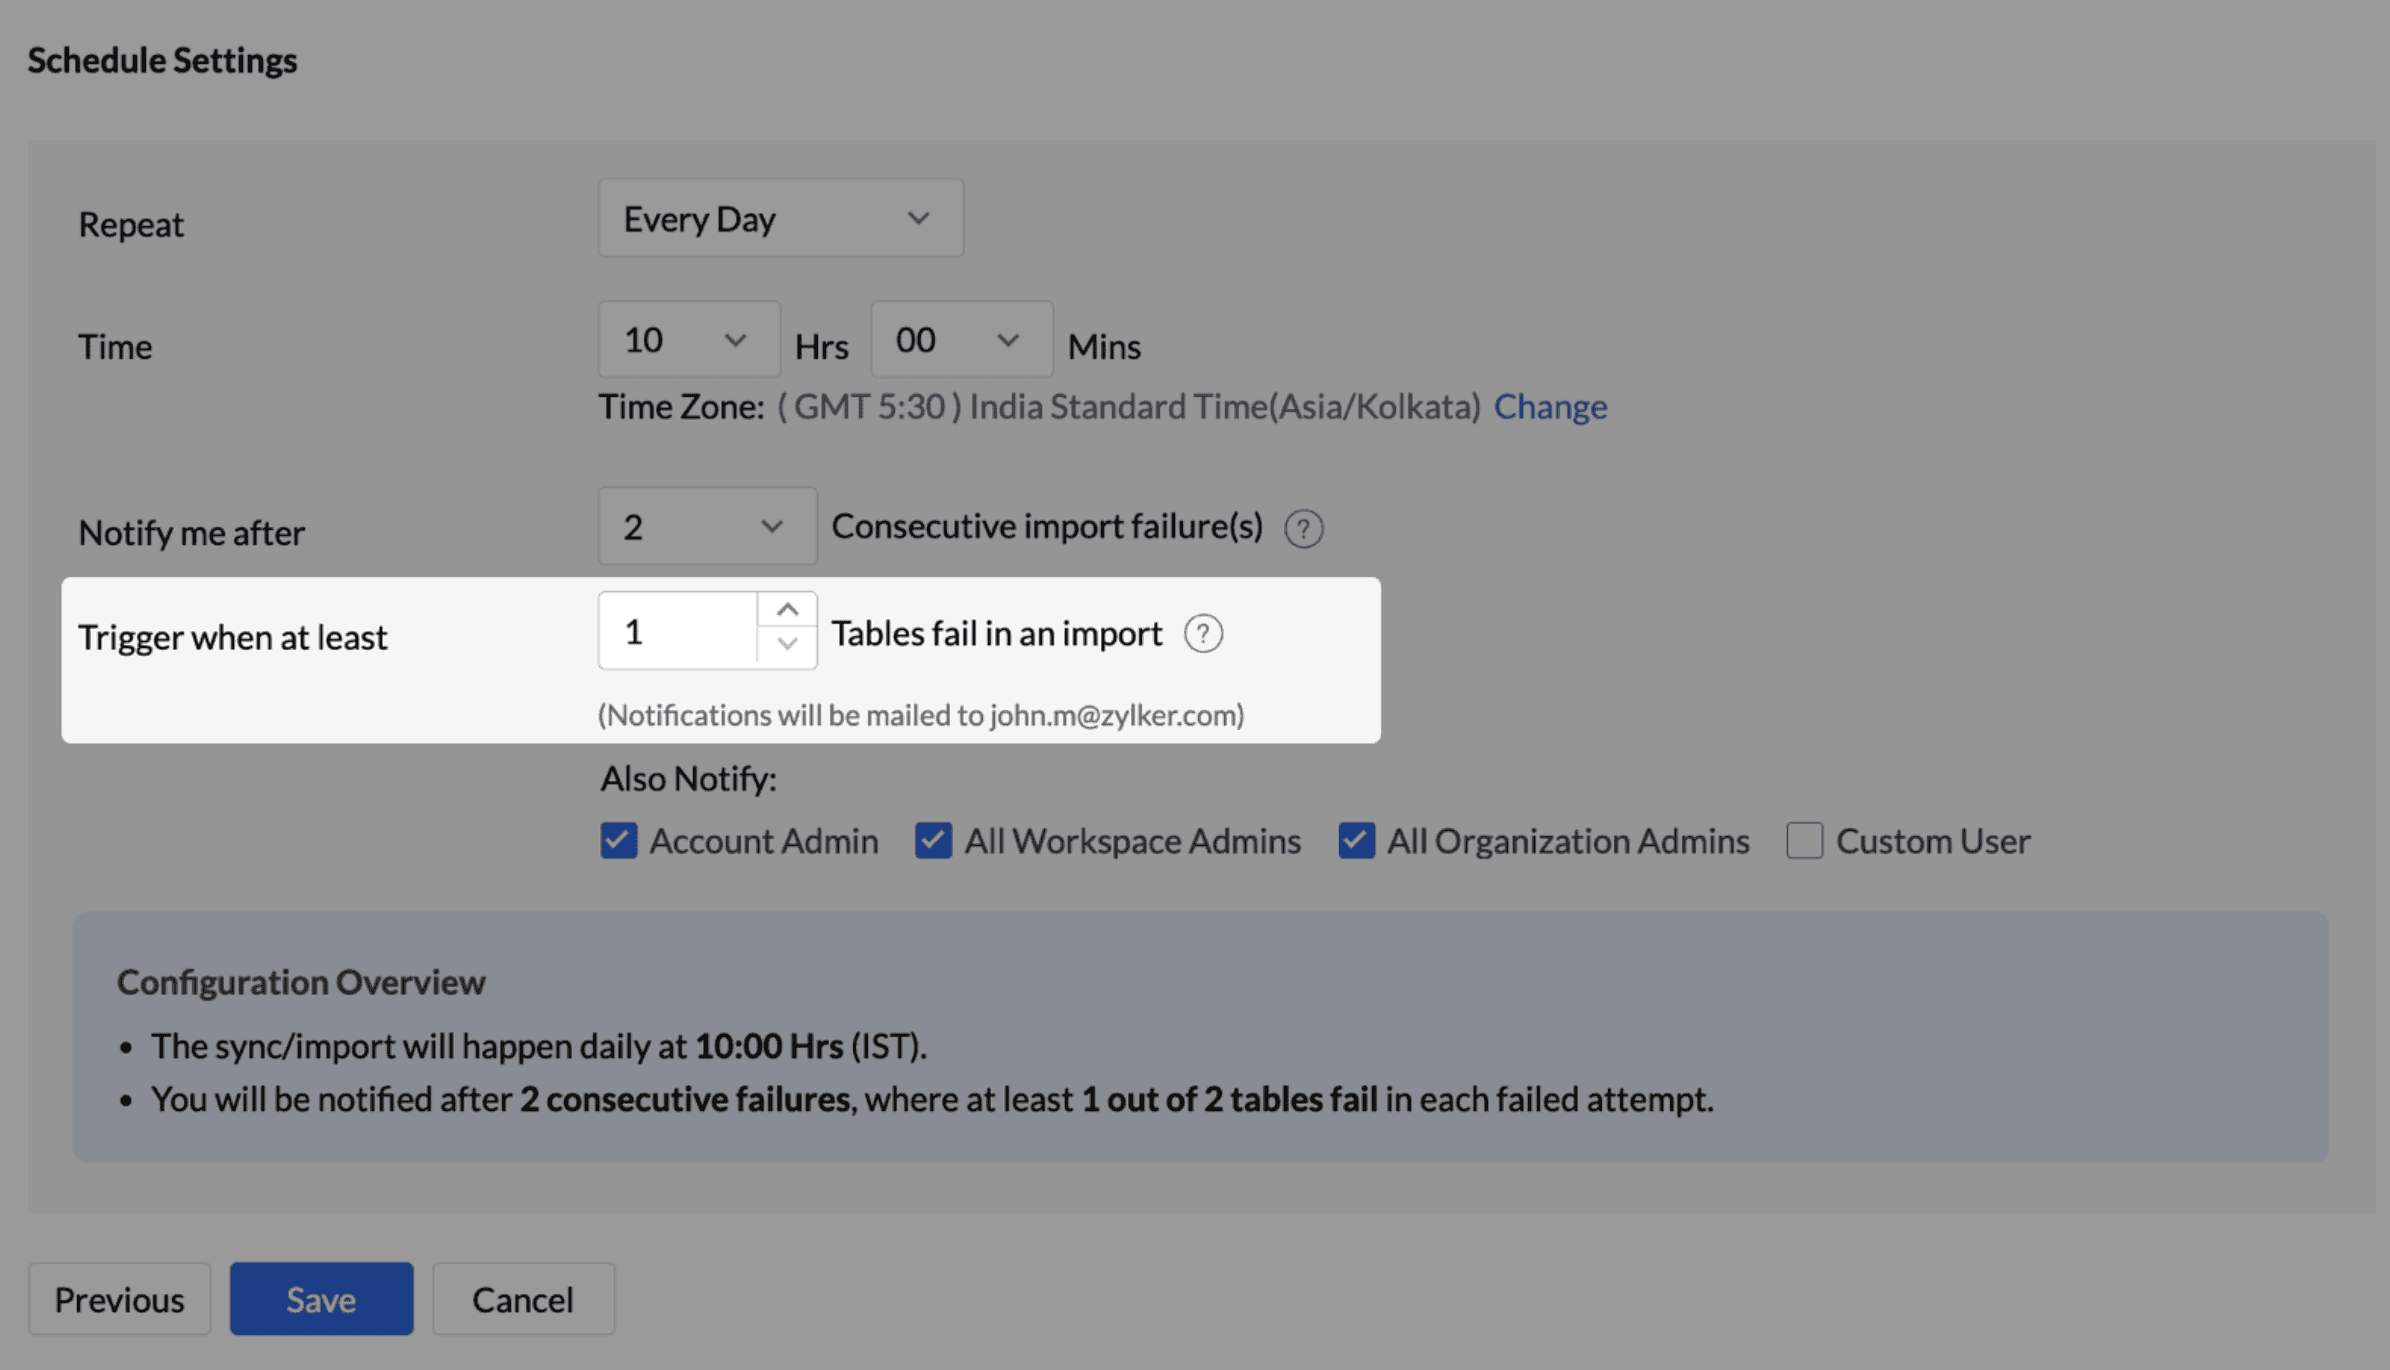
Cloud Database Synchronization — Failure Notification Settings
EnhancementYou can now configure synchronization settings to trigger a failure notification when a certain number of table imports fail. Simply set the value for the number of failed tables, and Analytics Plus will notify you when the condition is met. This gives you more control over monitoring imports and helps avoid missing critical sync issues.
Snowflake - New Authentication options
EnhancementAnalytics Plus now supports two new authentication methods for connecting to your Snowflake data:
- Private Key
- OAuth
These options provide more flexibility and enhanced security when configuring your Snowflake connections.
Lookup Suggestions
EnhancementCreating relationships between tables is now even easier. Analytics Plus now offers lookup suggestions based on your table’s metadata. These smart recommendations help you:
- Quickly identify potential relationships between tables.
- Reduce manual guesswork.
- Simplify your data modelling process.
Export Dashboard as CSV Files
NewExport dashboards directly as CSV files, making it easier to share, analyze, or archive your data outside the platform. This enhancement allows you to retain the underlying data from your reports and widgets, enabling seamless offline access and further analysis.
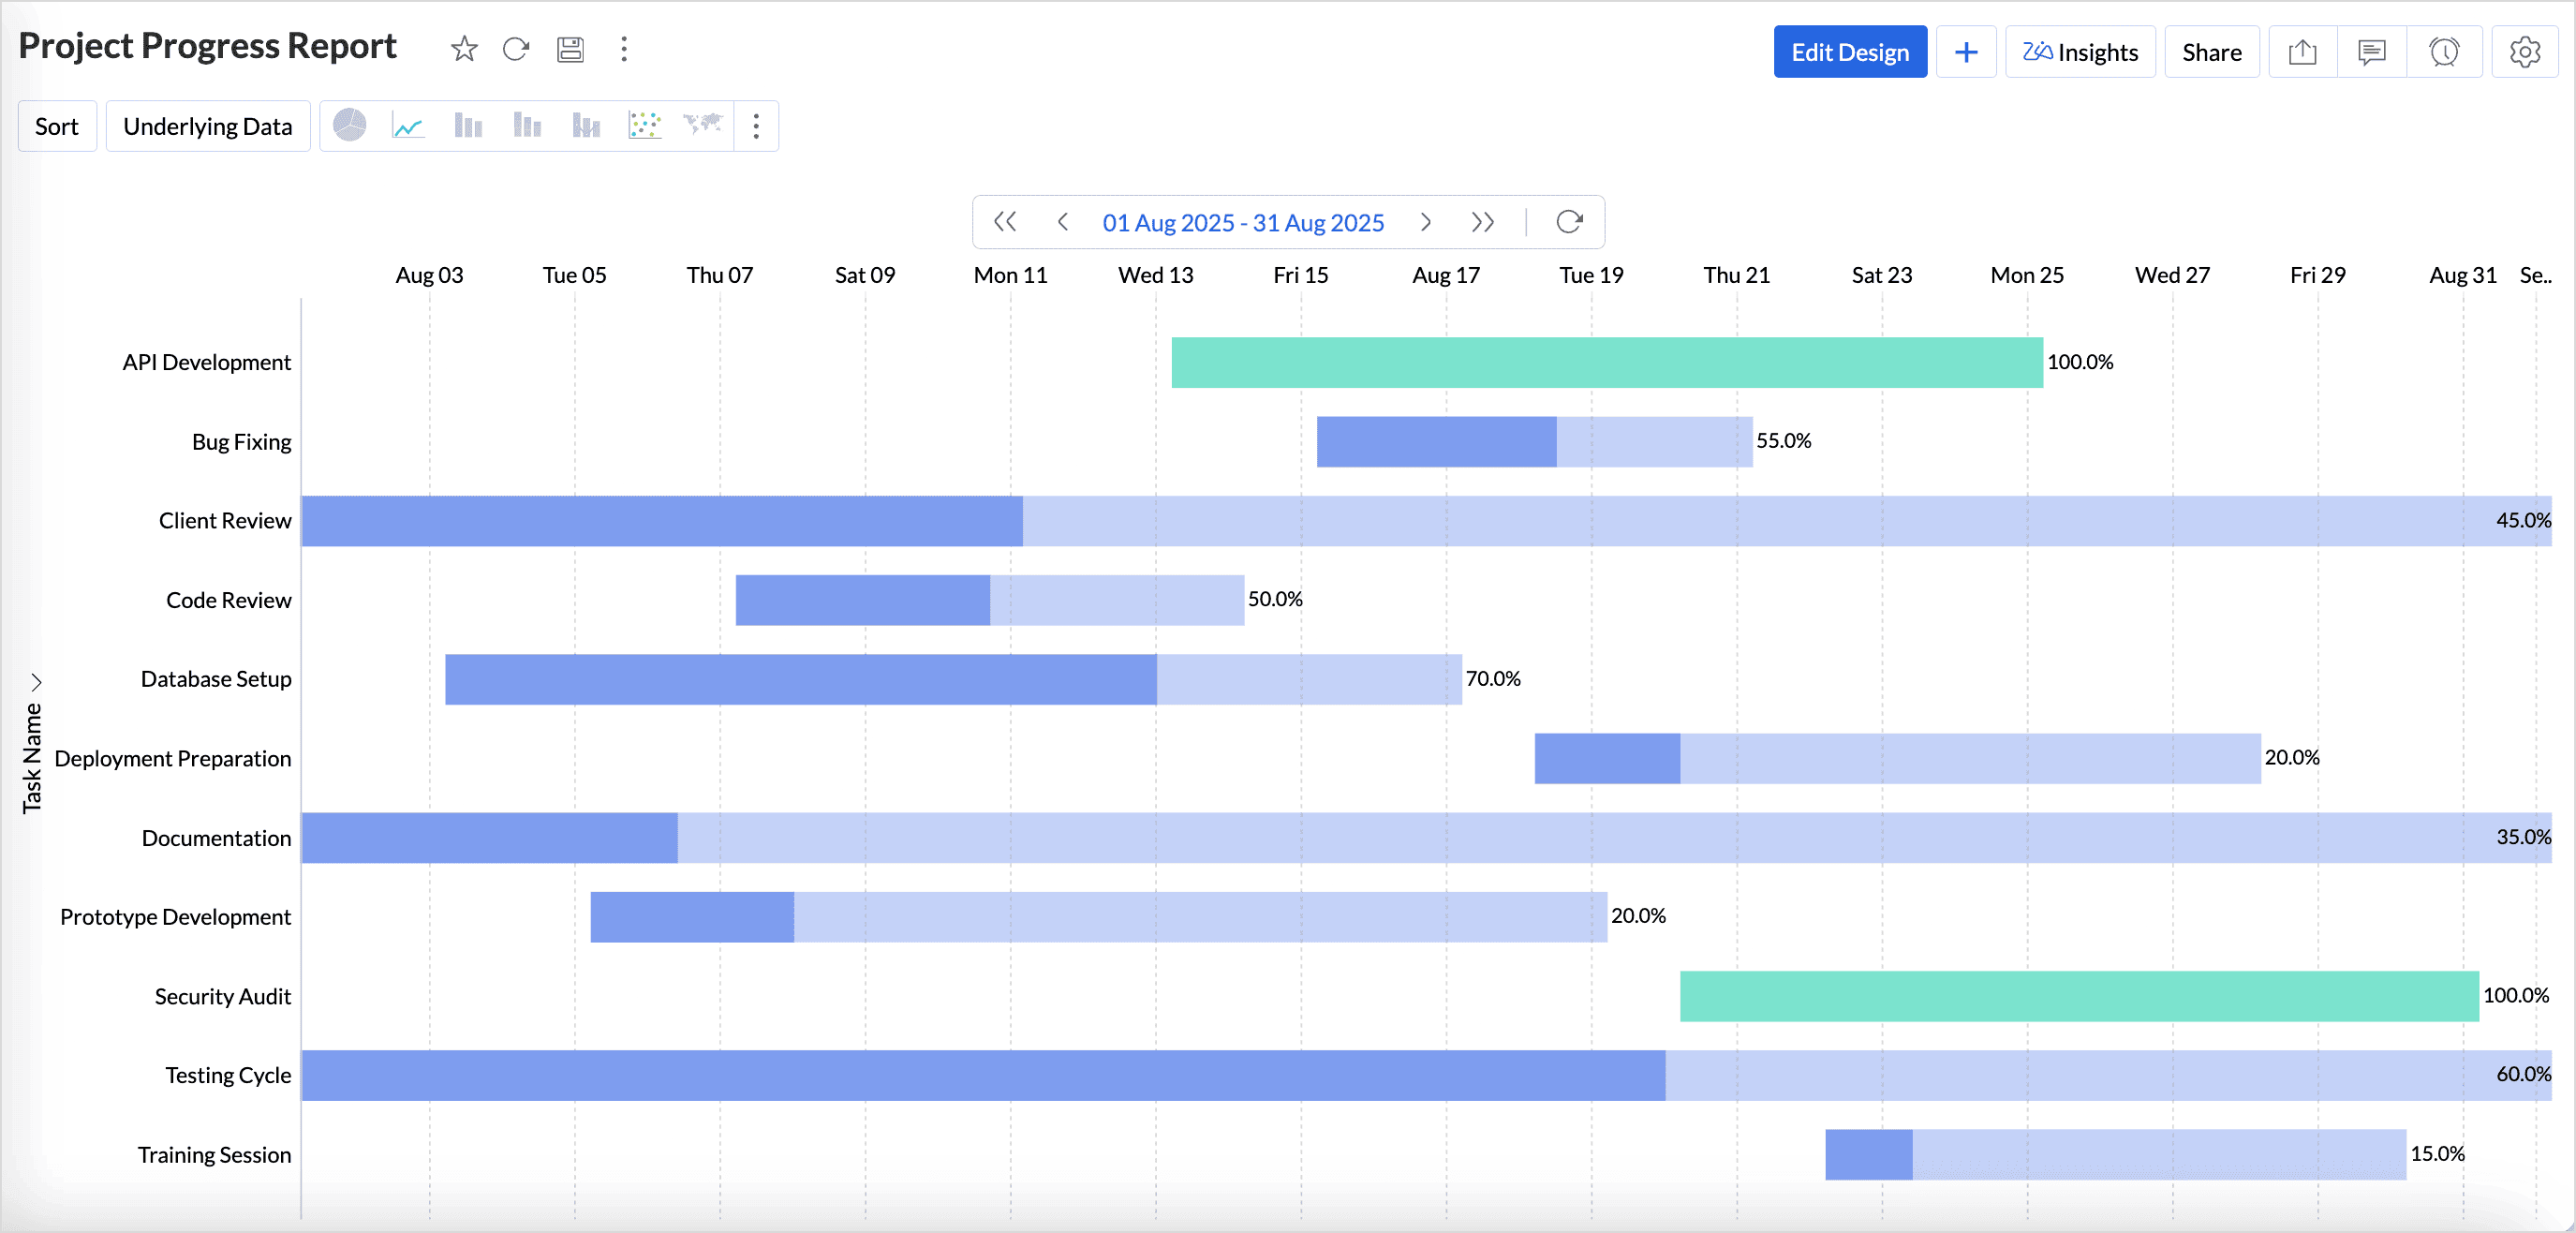
New Chart Support: Gantt Chart in Analytics Plus
NewIntroducing Gantt Chart in Analytics Plus to help you plan timelines, monitor task progress, and stay ahead of project delays.
Connect to Azure Managed SQL Instance
NewImport data from Azure Managed SQL Instance into Analytics Plus. This allows you to seamlessly integrate cloud-hosted SQL Server data without manual exports.
Incremental Fetch Enhancements
Enhancement- From Other Workspaces: Users can now configure incremental fetch for data imported from another workspace, bringing in only new or updated records. This improves sync efficiency and reduces load times.
- For Custom Queries: Incremental fetch is now supported for data imported via custom queries, retrieving only new or updated records to enhance performance and reduce processing time.
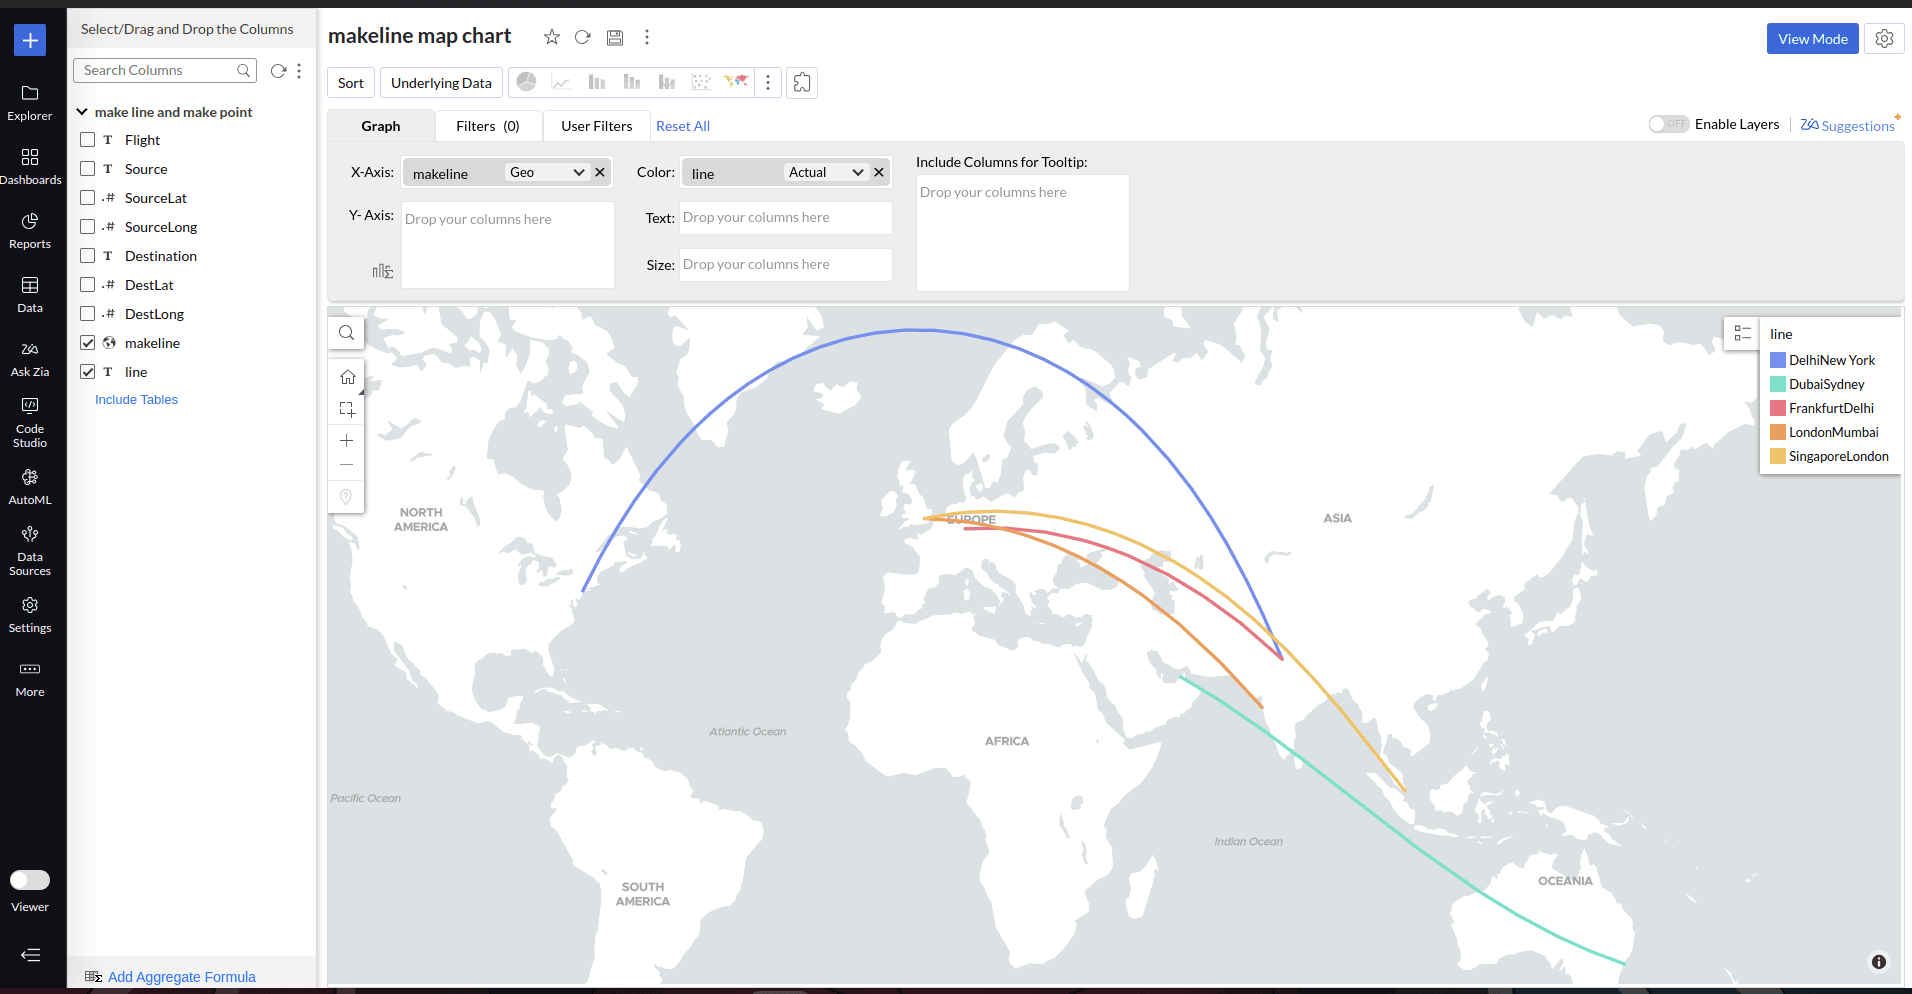
Map & Geo Analytics Enhancements
EnhancementExplore enhanced geo-visualization capabilities with improved layering, interactivity, and cleaner map insights for deeper location-based analysis.
- Map Charts now support up to five layers, increased from the previous limit of three layers, enabling richer multi-dimensional geo-analysis.
- Map Layering enhancements now support drill-through, unresolved location fixes, and dashboard filtering.
- Map chart tooltips are now cleaner with Latitude and Longitude values removed.
Databricks Integration Support
EnhancementAnalytics Plus On-Premise now supports Live Connect with Databricks, enabling you to analyze and visualize data directly from Databricks without importing it into Analytics Plus. This helps ensure access to up-to-date data for faster and more efficient decision-making.
Tabular View: Wrap & Clip Text
EnhancementManage lengthy headers in tabular views effortlessly with two new options:
- Wrap Text for improved readability.
- Clip Text to maintain a compact layout.
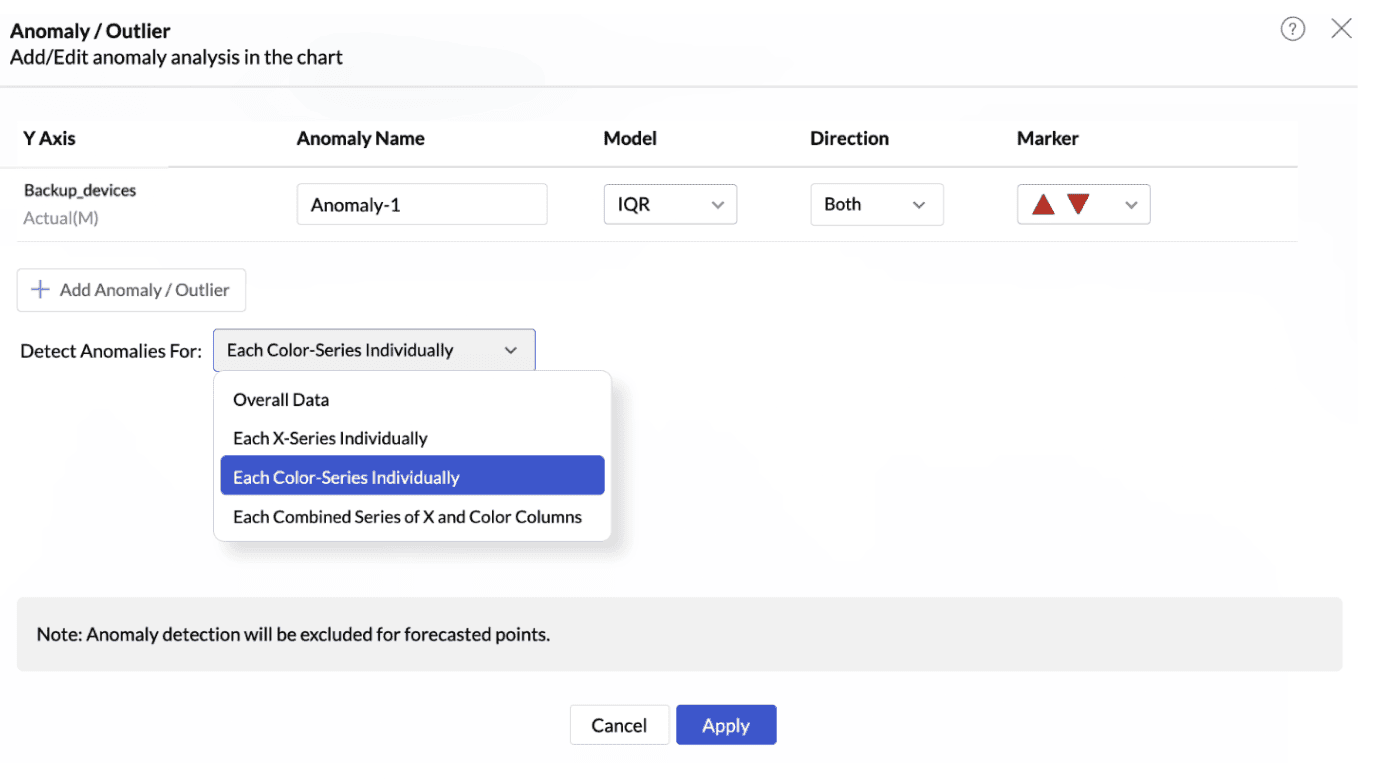
Anomaly Detection for Dimensional Fields
EnhancementAnalytics Plus now supports enhanced anomaly detection when a dimension field (category) is added to the Color shelf. Users can choose from multiple detection modes to better analyze deviations across different perspectives.
- Overall data
- Each X-Series Individually
- Each Color-Series Individually
- Each Combined Series of X and Color Columns
These enhancements offer greater flexibility and precision in uncovering unusual trends and outliers across segmented data visualisations.
Enhancements in Pivot
Enhancement- Conditional formatting now includes all icons and color bands in a single unified interface for easier trend highlighting.
- The settings panel for Pivot and Summary charts has been redesigned with a streamlined layout organized into five sections: Basic, Layout, Display, Format, and Drill.

- Freeze Column support is now available in Pivot and Summary Views, allowing selected columns to remain fixed while scrolling horizontally for easier comparison across wide reports.
- A new Sort across Group option is now available in Pivot Tables, enabling sorting across the entire table instead of within individual groups.
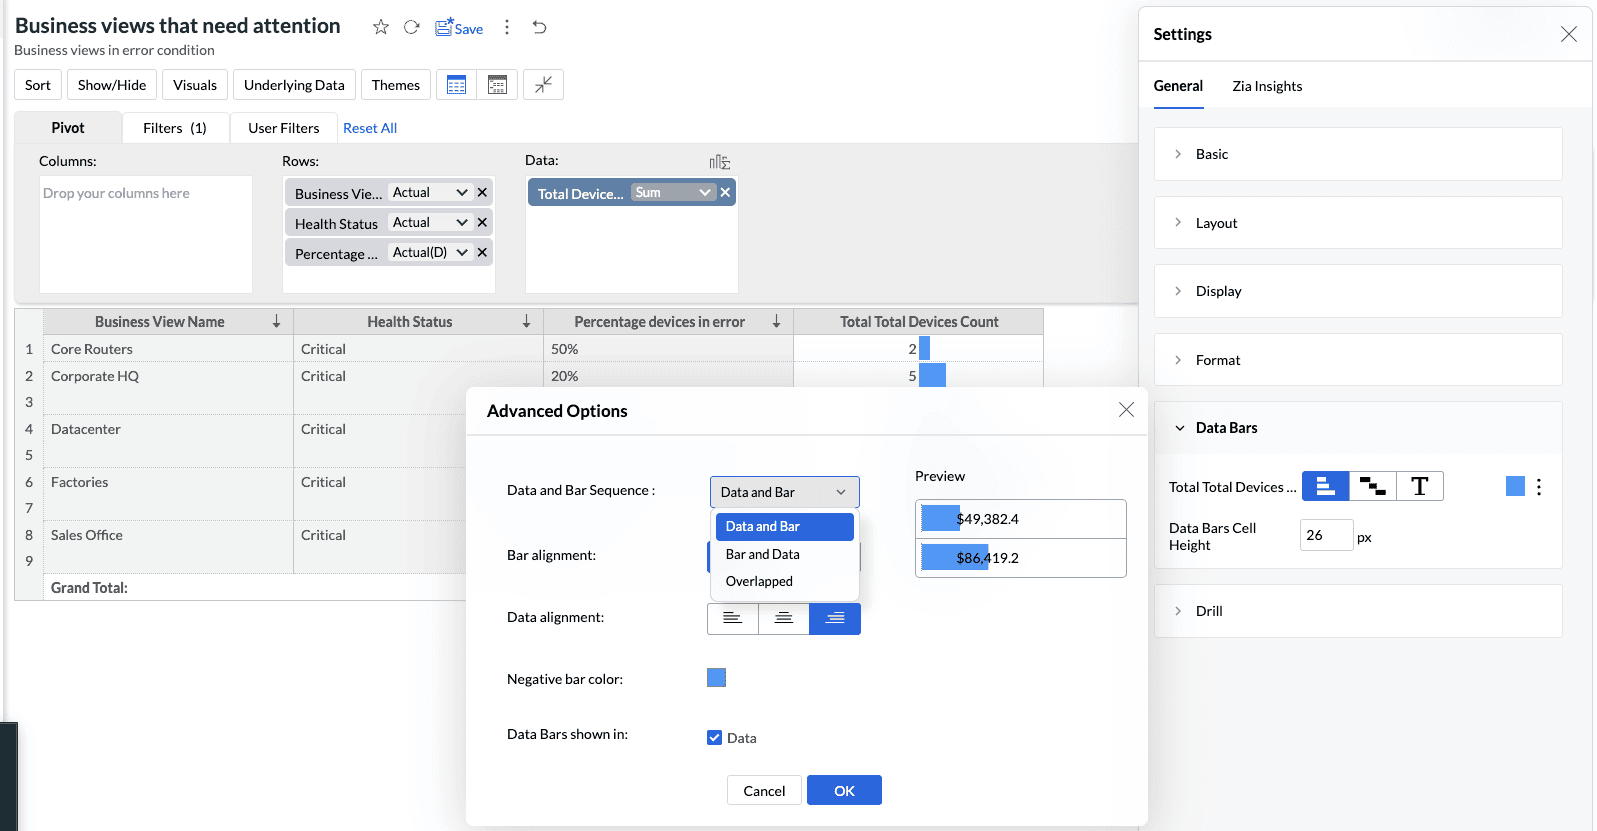
Visualize Data with Overlapped Data Bars
EnhancementData Bars are now enhanced to provide richer and more intuitive visual insights across your Pivot reports, including conditional formatting scenarios. With overlapped Data Bars, you can compare values, identify trends, and analyze performance variations directly within cells without switching between charts and tables.
Feature Highlights
- Visualize Trends: Identify patterns and performance variations directly within Data Bars.
- Dynamic Updates: Data Bars automatically respond to changes in the underlying data.
- Customizable Appearance: Configure colors, scaling, and direction based on your reporting needs.
- Overlapped Visualization: Compare multiple values effectively within a single view for faster analysis.
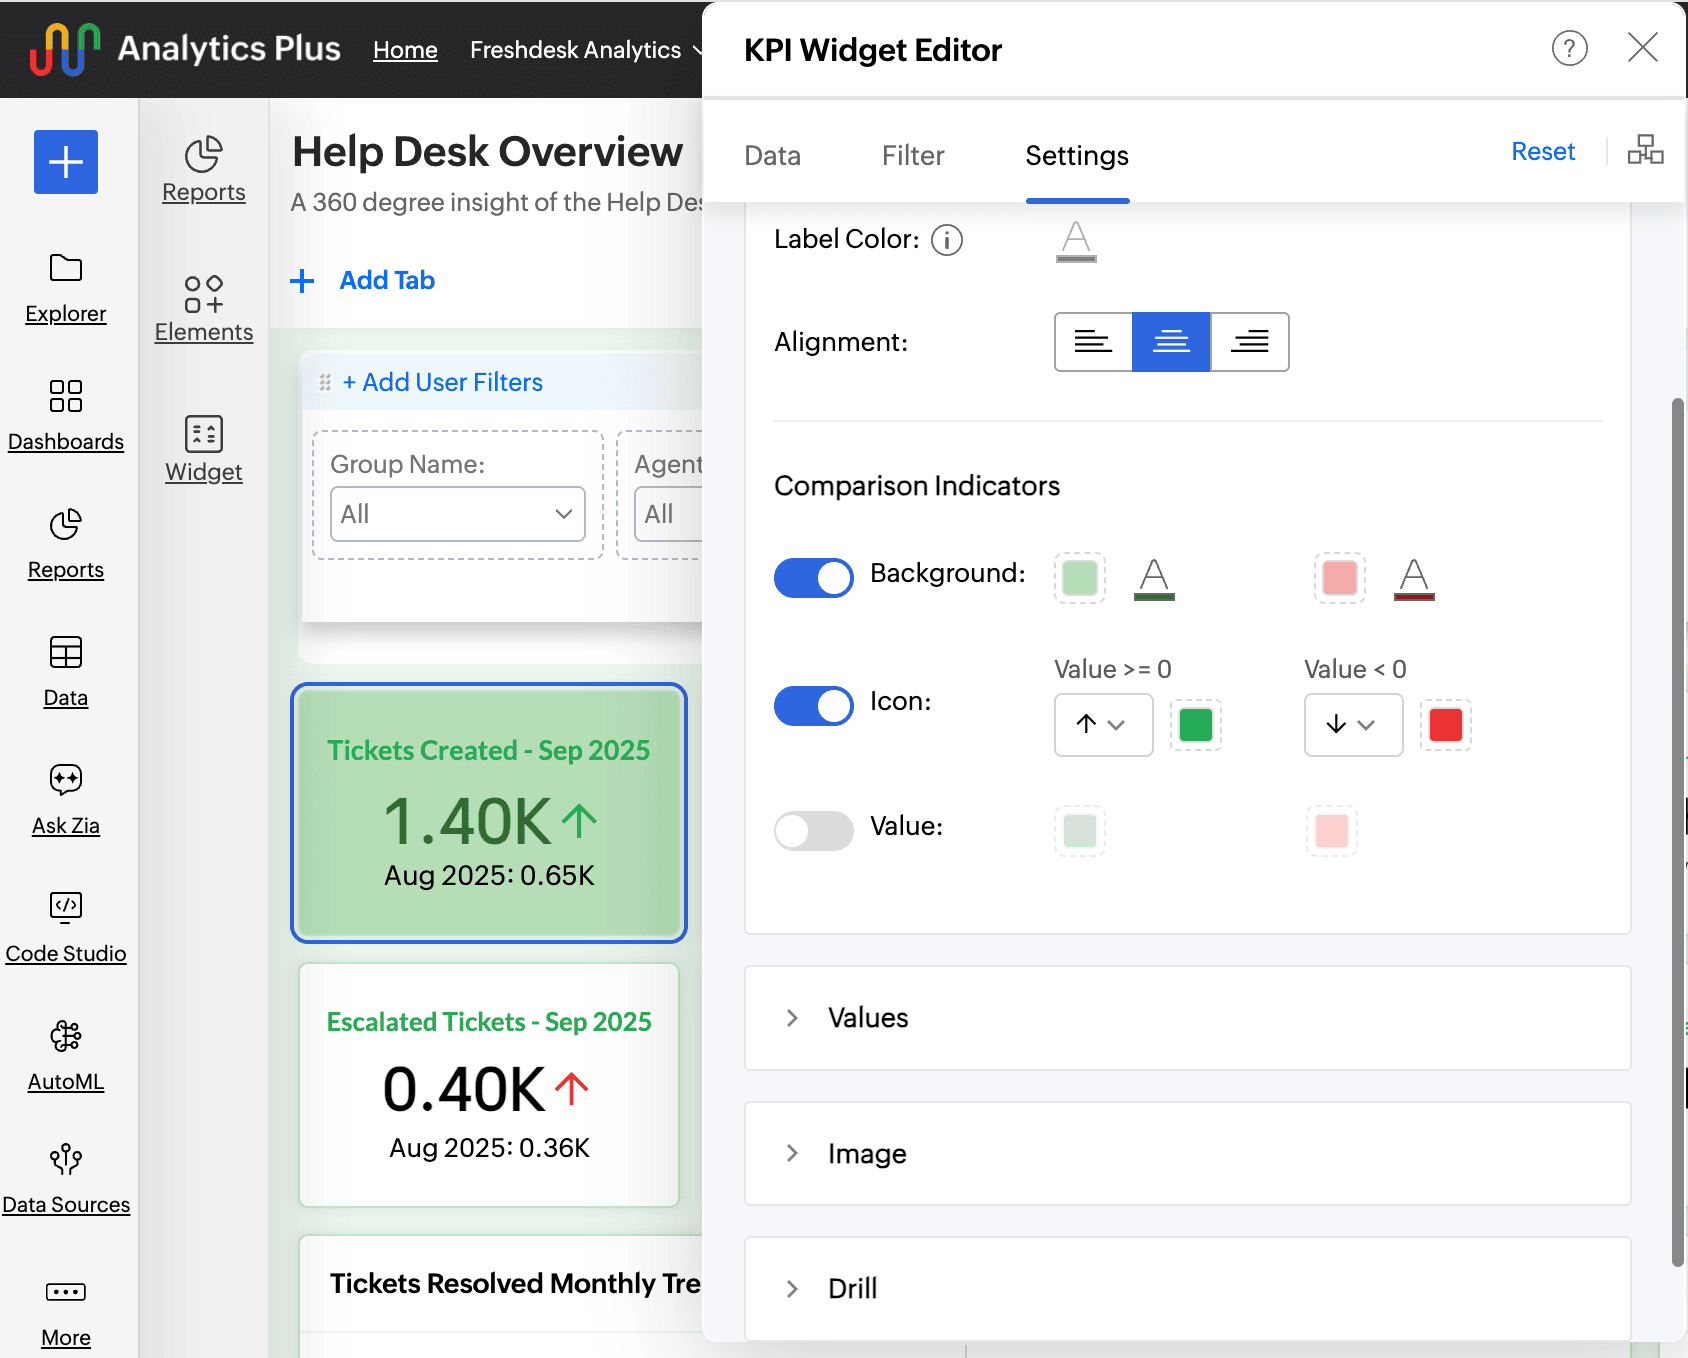
KPI Widget Enhancements
EnhancementAnalytics Plus introduces a series of enhancements to KPI widgets, making dashboards more interactive, informative, and easier to customize.
Key Highlights:
- Descriptive Tooltips: Add informational tooltips to KPI widgets using the Widget Info option. Display an info icon with custom descriptions to provide users with better context about the displayed data.
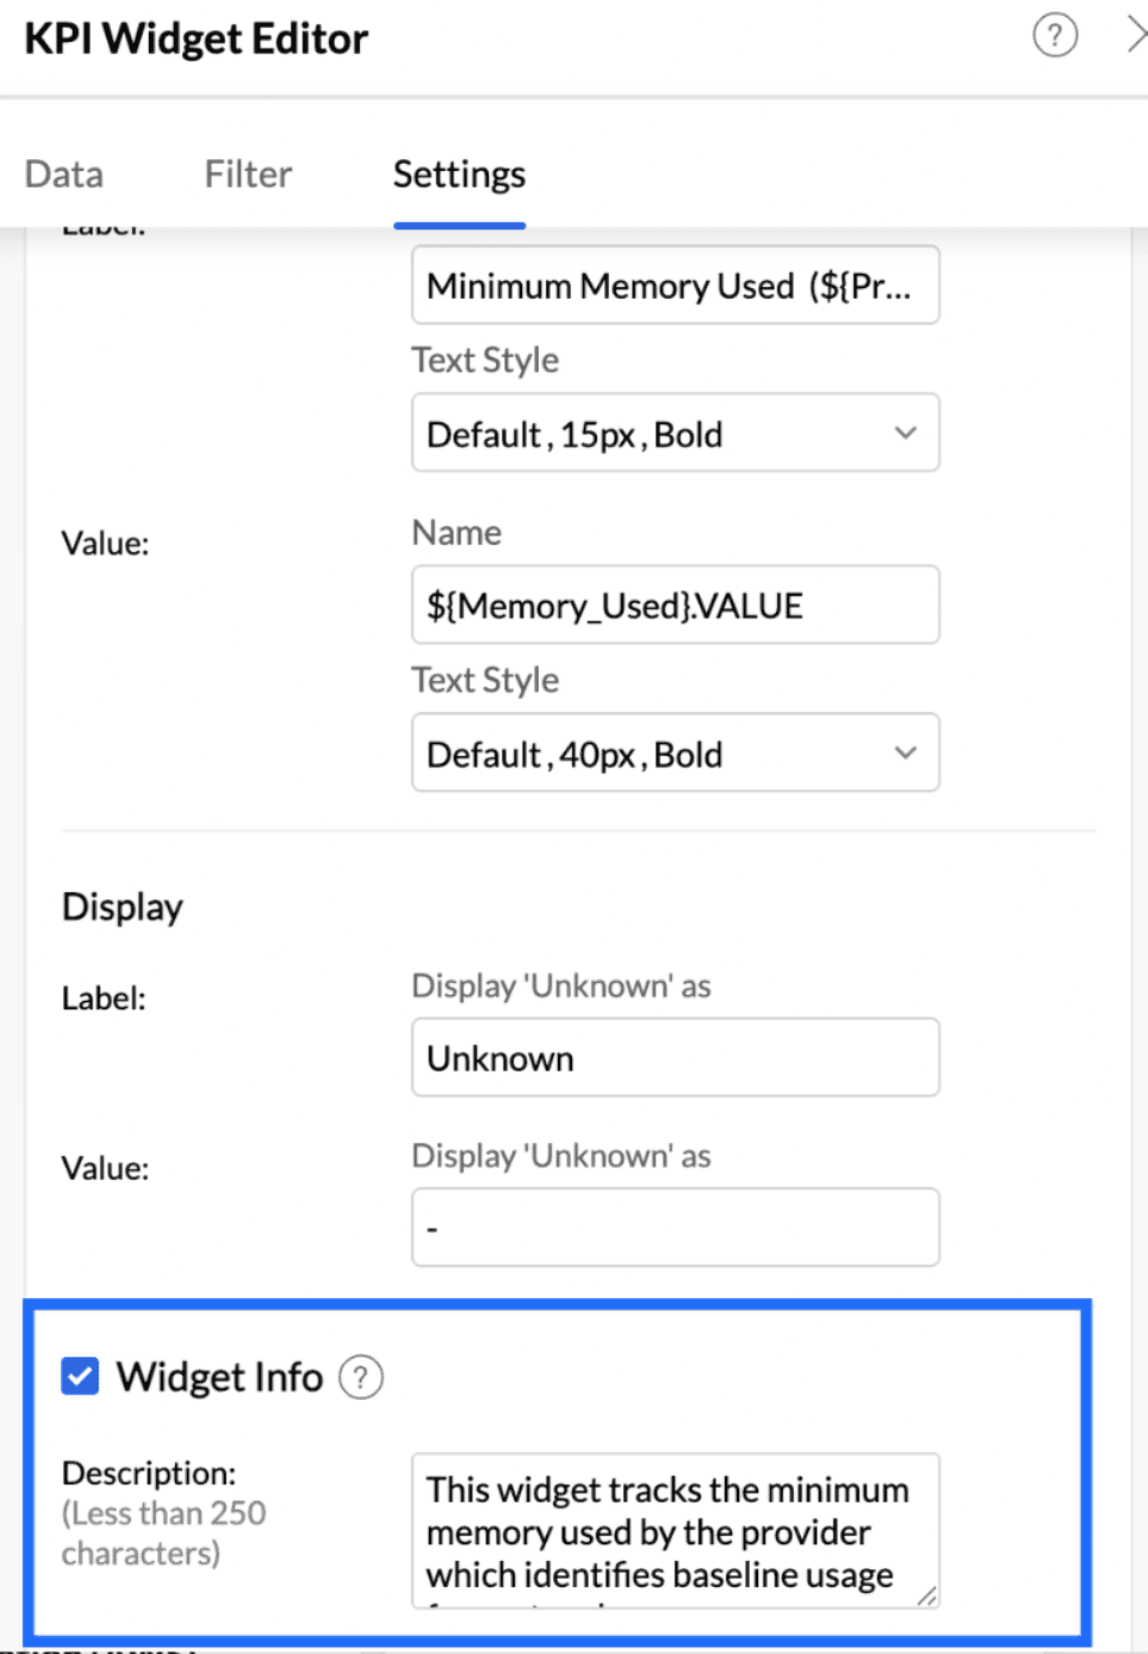
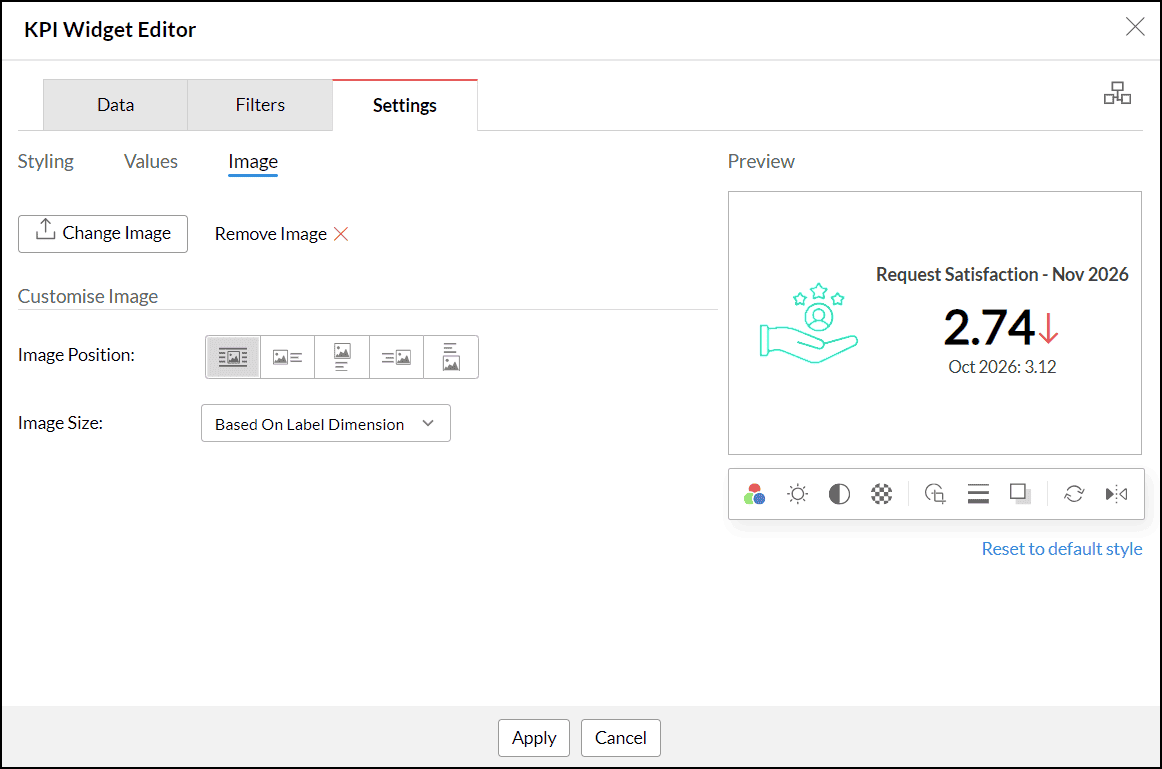
- Image Association: Associate images directly with KPI widgets to create more visually engaging dashboards. Images can dynamically change based on underlying metric values.

- Advanced Customization: Customize image size, position, and formatting to match your dashboard design better and preferences.
- Revamped KPI Widget Editor: Experience a completely redesigned KPI Widget Editor with a modern UI for faster and smoother customization.
- Flexible Widget Arrangement: Drag and reposition KPI widgets anywhere on the dashboard with ease.
- Bulk Save Support: Make multiple widget modifications and save all changes together in a single action.
Mar
Build Number: 6310 (Release on: March 23, 2026)
Issues fixed
Issues fixedThis release resolves key security flaws to improve protection and reliability.
- Resolved Apache Tika XXE vulnerability (CVE-2025-66516) in the tika-core component.
- Fixed vulnerability chain in Analytics Plus enabling Remote Code Execution.
- Patched Apache Struts DoS vulnerability (CVE-2025-66675) in multipart request handling and temporary file leaks, preventing disk exhaustion.
Feb
Build Number: 6300 (Release on: February 09, 2026)
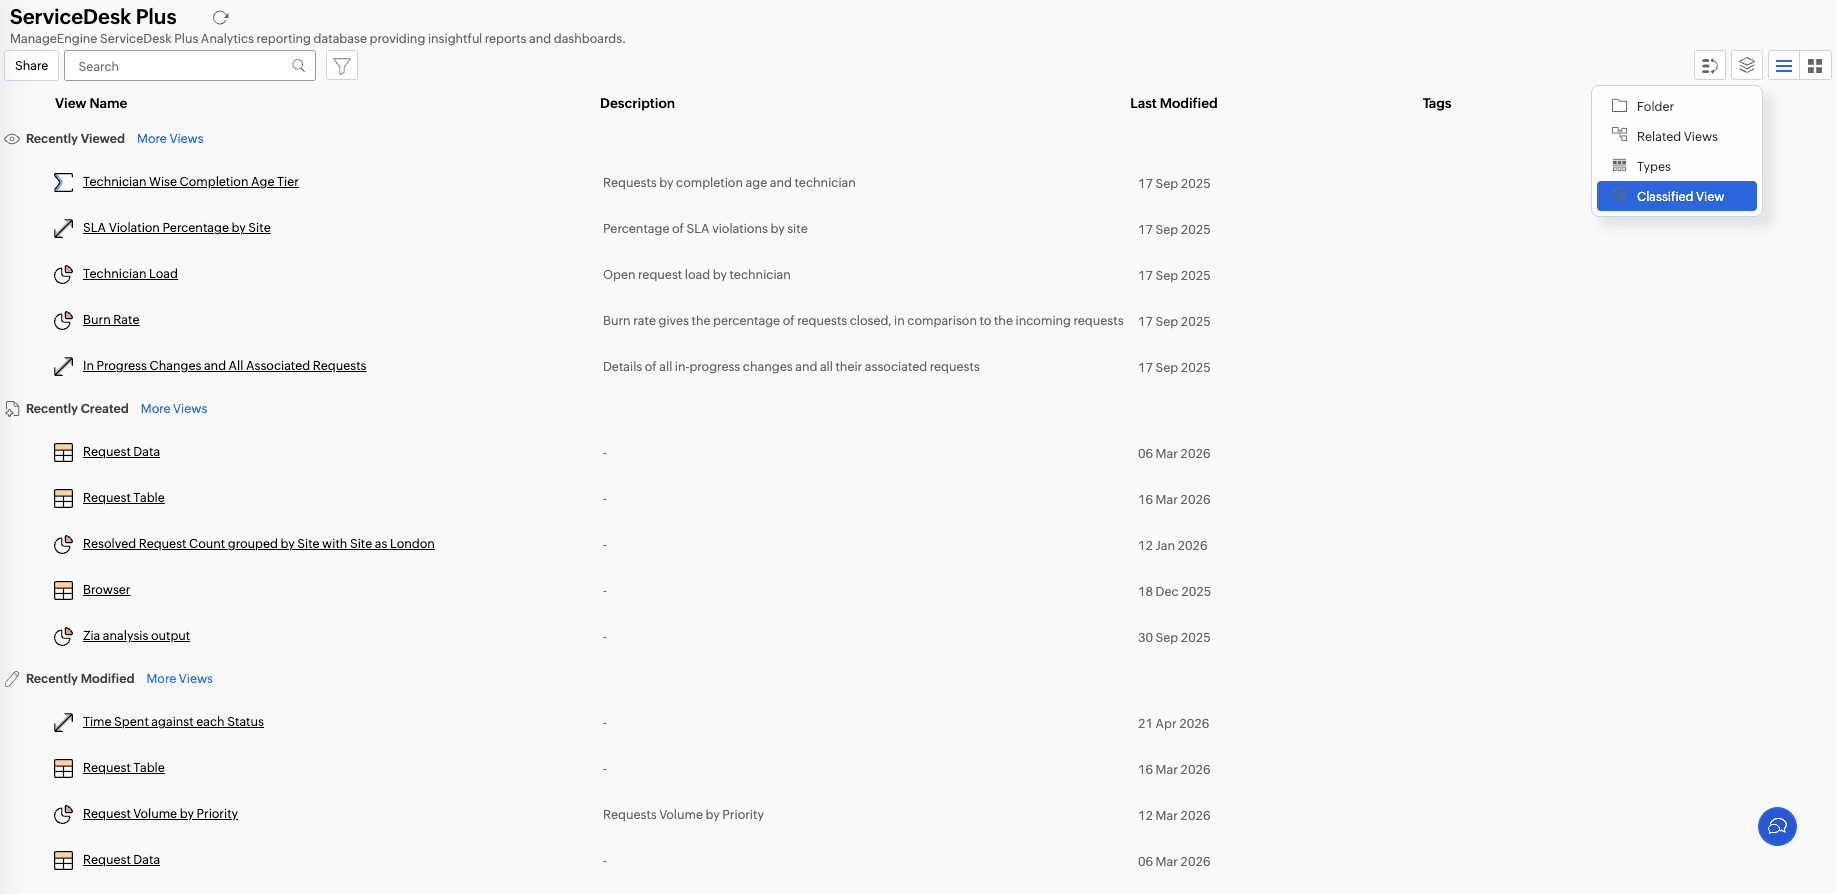
Introducing support for additional modules in ServiceDesk Plus
NewIntroducing support for Release, Problem, CMDB, and Approval modules from ServiceDesk Plus. Click here to learn more about this integration.
Note: Existing Analytics Plus users should upgrade to Analytics Plus build 6300 and ServiceDesk Plus build 15250 to access the reports in these modules.
Launching advanced analytics for Asset Explorer's CMDB module
NewAnalytics Plus now offers out-of-the-box analytics for Asset Explorer CMDB module. Click here to learn more about this integration.
Note: Existing Analytics Plus users should upgrade to Analytics Plus build 6300 and Asset Explorer build 7820 to access the reports in this module.
Launching advanced analytics for new modules in Vulnerability Manager Plus
NewIntroducing support for the following modules from Vulnerability Manager Plus:
- CVE Details
- Logical Drives
- High Risk Software
- Vulnerabilities and Associated Patches
- Vulnerabilities and Associated Products
- Vulnerabilities and Associated CVEs
Click here to learn more about this integration.
Support for MS Graph with OAuth in mail configuration
NewAnalytics Plus now supports Microsoft Graph with OAuth authentication for sending email notifications. Click here to learn more.
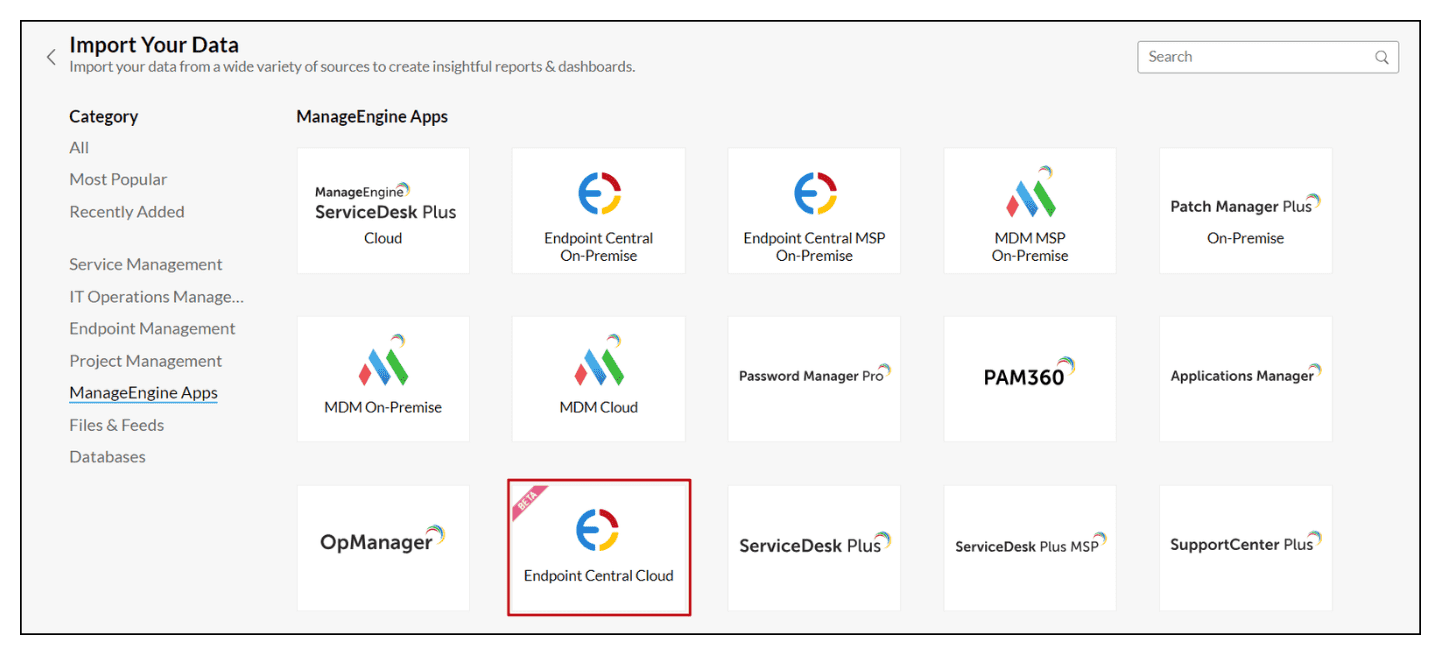
Introducing support for new modules in Endpoint Central
NewAnalytics Plus now supports additional modules for Endpoint Central from EMS version 11.4.2540.01, enabling enhanced reporting on device storage, software risk, and vulnerabilities. The new modules include:
- CVE Details
- Logical Drives
- High Risk Software
- Vulnerabilities and Associated Patches
- Vulnerabilities and Associated Products
- Vulnerabilities and Associated CVEs
Click here to learn more about this integration.
End of Support for Older Application Manager Version
EnhancementApplication Manager versions below v16000 reach End of Support on May 30, 2025.
- Starting with Analytics Plus 6300 and above, new integrations with Applications Manager versions below v16000 will no longer be supported.
- For customers with existing integrations using Applications Manager versions below v16000, these will continue to function only up to version 6300. From the subsequent release onward, support for these versions will be discontinued, and data synchronization will no longer occur.
2025
Dec
Build Number: 6230 (Release on: December 15, 2025)
Introducing support for additional modules in PAM360
NewAnalytics Plus introduces out-of-the-box analytics for PAM360’s Access Control, Access Policy, Self-Service Privilege Elevation (SSPE) and Zero Trust modules. Additionally, users can leverage in-built custom queries to build comprehensive, tailored reports and dashboards. Learn more.
Nov
Build Number: 6220 (Release on: November 21, 2025)
Support for v2 API integration
NewThe upgraded v2 APIs offer enhanced performance, additional functionality, and improved security for smoother integrations. Learn more.
Oct
Build Number: 6210 (Release on: October 29, 2025)
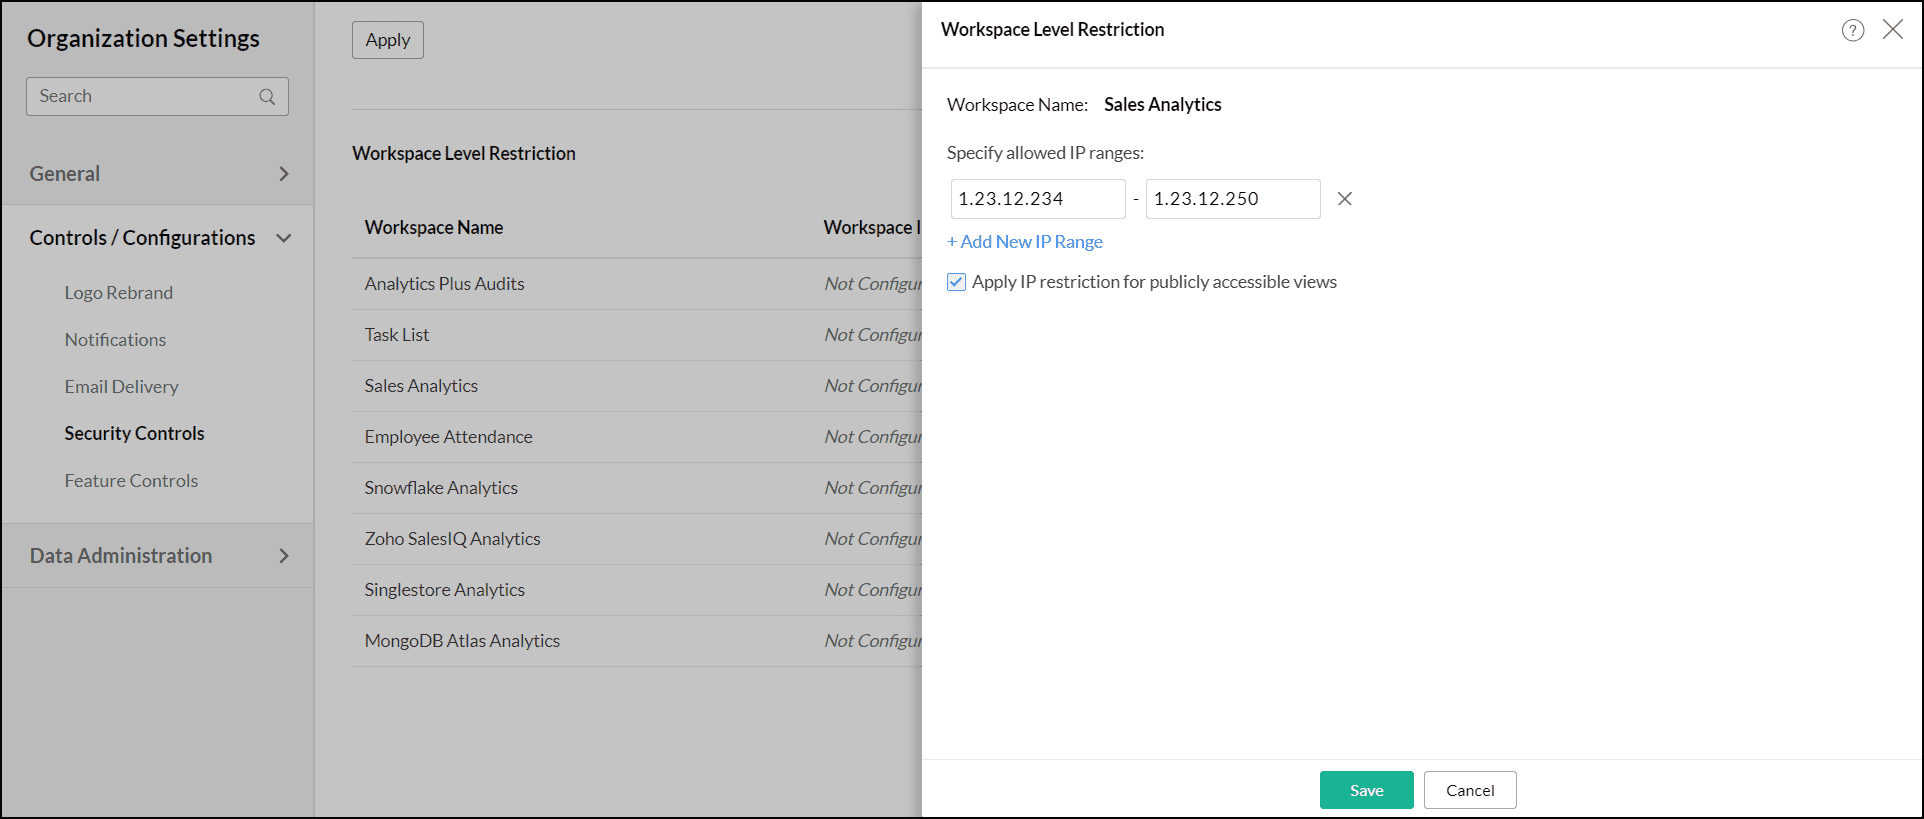
Enhancing Security Configuration:
NewIntroducing Advanced Security Settings and IP Restriction in Analytics Plus for robust account protection and management.
Advanced Security Settings
- Encryption & Protocol: Configure preferred TLS versions (TLSv1.2 and TLSv1.3) and select supported cipher suites to secure client-server communication.
- HSTS Header: Enforce HTTPS usage while accessing Analytics Plus using HSTS (HTTP Strict Transport Security) for enhanced browser level security. Configurable max-age (6 months, 1 year, or 2 years) setting allows admins choose the time window for https enforcement.
- Antivirus Scanning: The Antivirus Scanning option scans uploaded files for potential threats before they are processed by Analytics Plus.
Administrators can define allowed IP ranges for application access, including options to enforce restrictions for Admin accounts, ensuring access is limited to trusted networks.
New Database Connectivity:
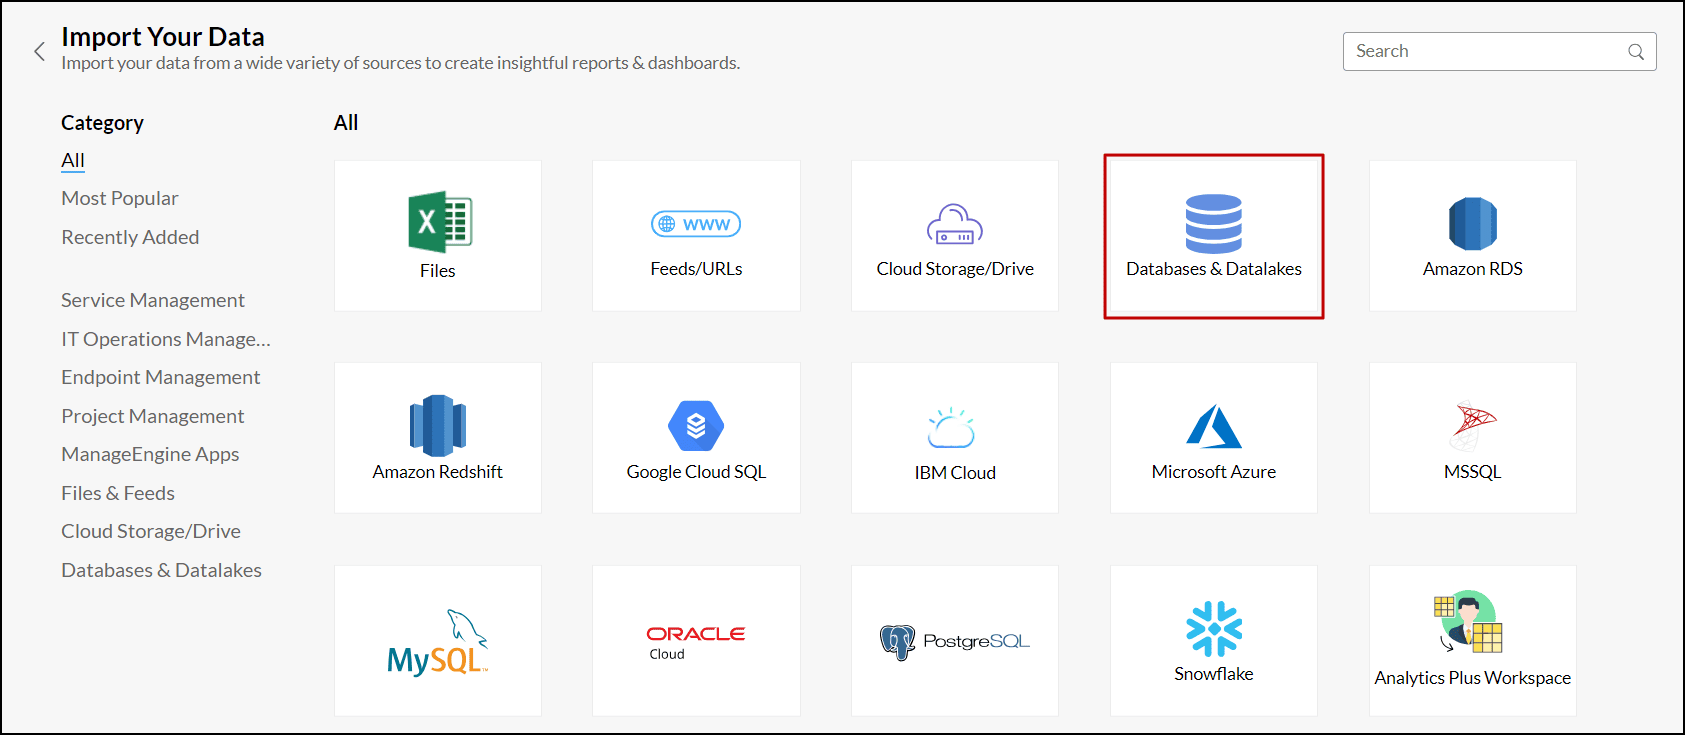
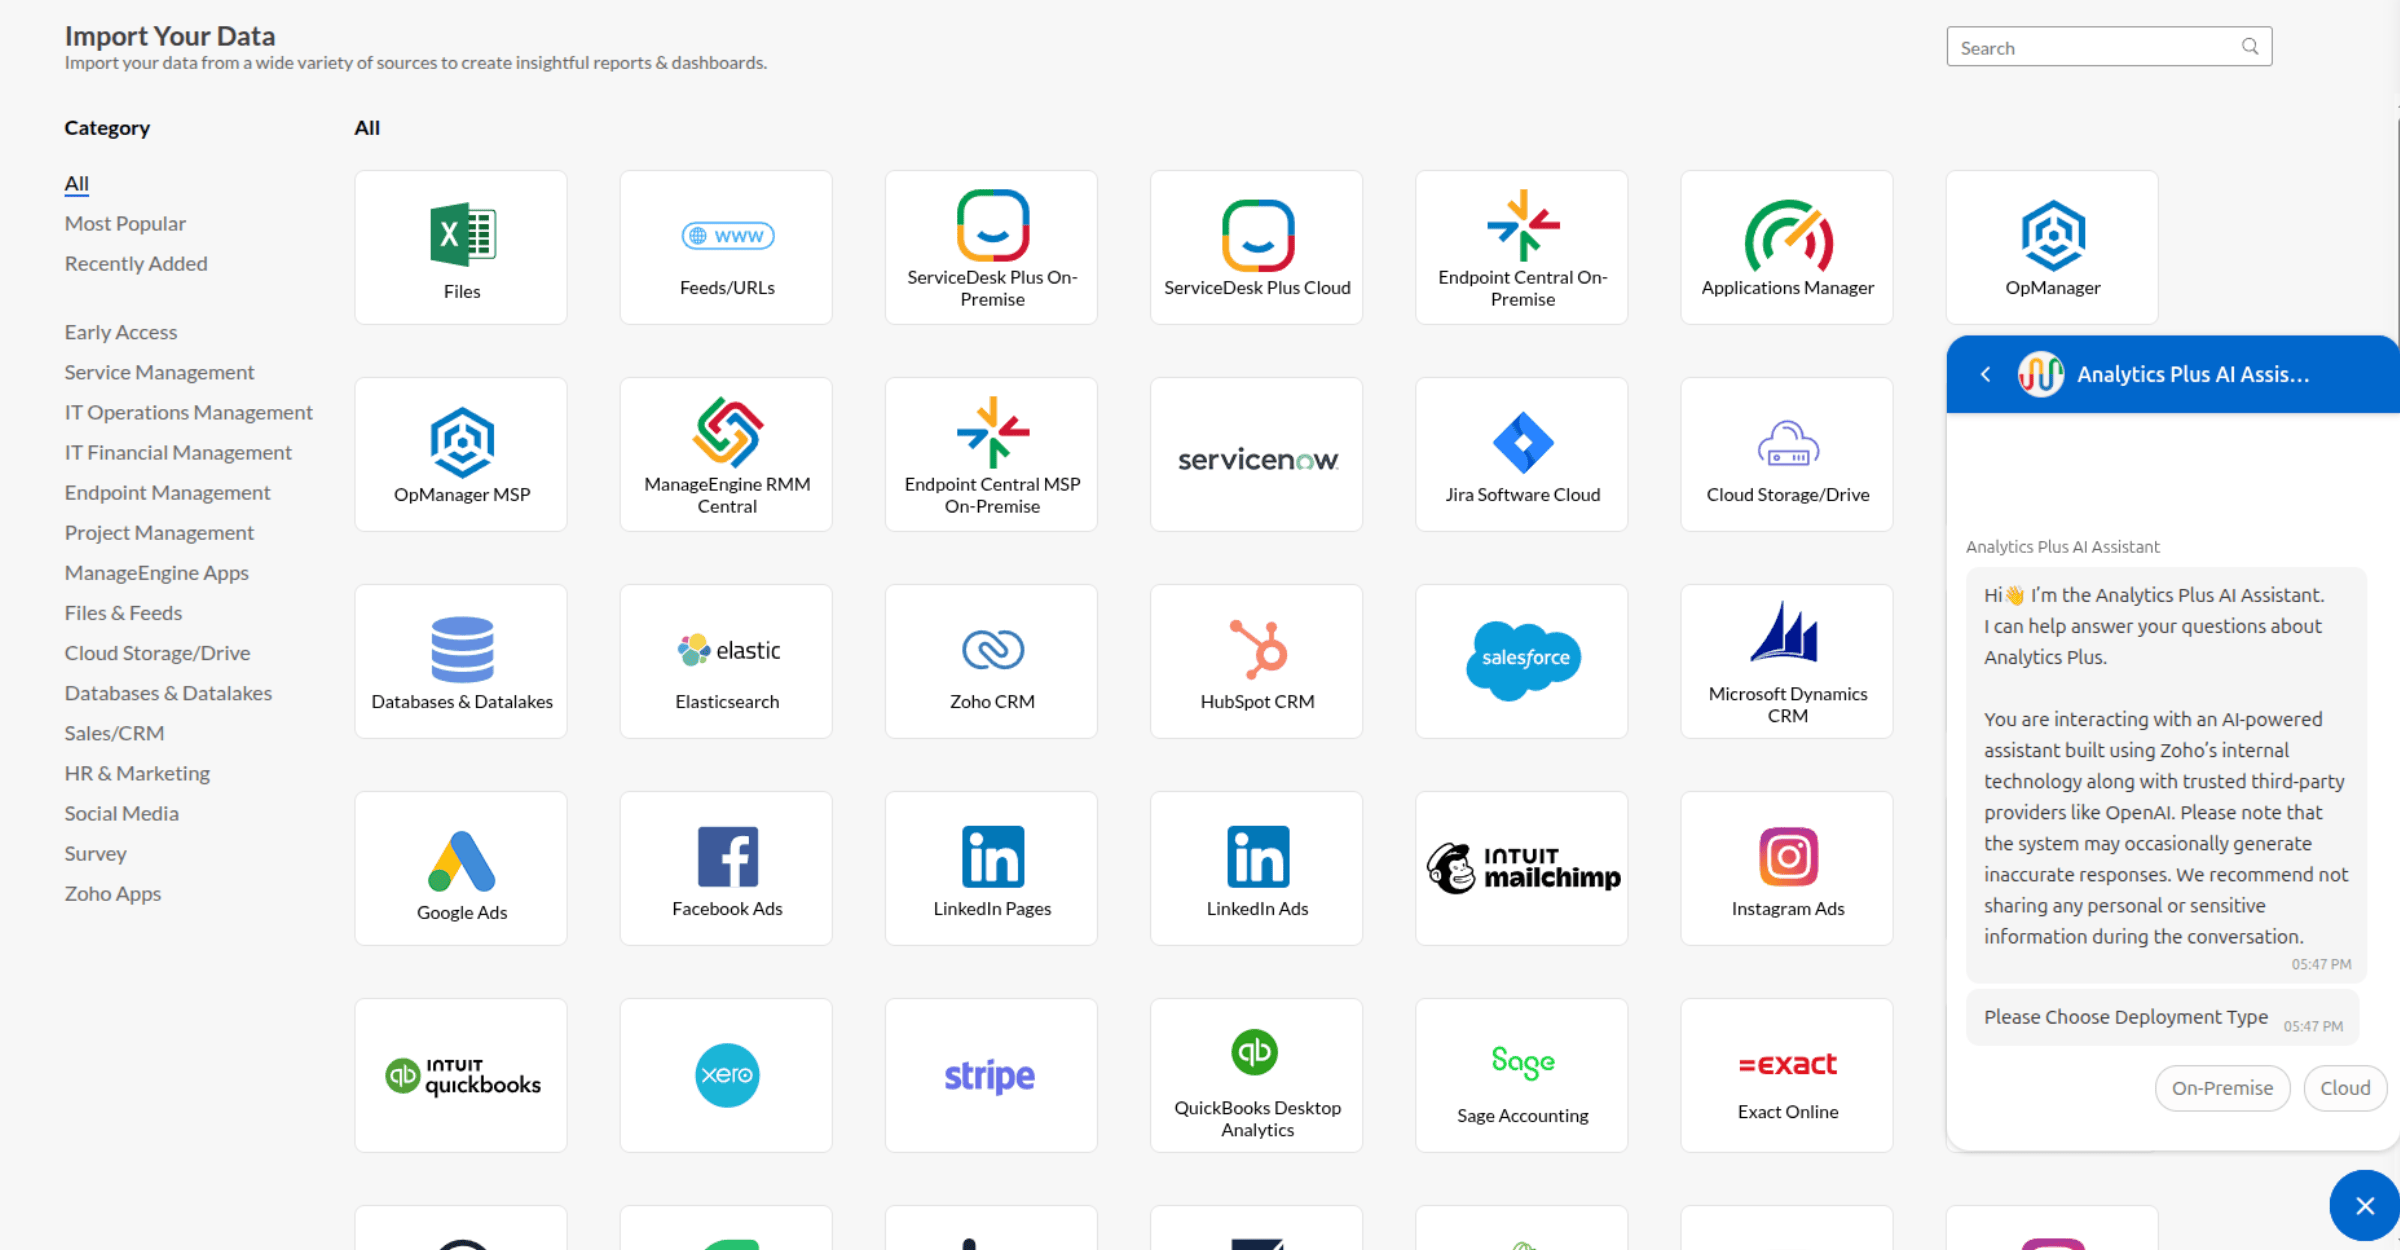
NewWe have expanded the supported data sources for Analytics Plus. You can now import your data from the following databases:
- ODBC Supported Database
- OLEDB Supported Database
- HFSQL Database
Sep
Build Number: 6200 (Release on: September 02, 2025)
Core Database Engine Upgrade to PostgreSQL 17.2
Enhancement- Upgraded core database engine from PostgreSQL 11.4 to PostgreSQL 17.2 to deliver enhanced performance, scalability, and access to the latest features.
- This upgrade introduces advanced capabilities such as multi-correlation primitives, enhanced array aggregation, and optimized join evaluation, along with critical bug fixes to improve overall stability.
Issues fixed
Issues fixedAn authenticated SQL injection vulnerability in Analytics Plus (CVE-2025-9428) has been fixed in this release. Learn more.
Aug
Build Number: 6171 (Release on: August 01, 2025)
Issues fixed
Issues fixedAn unauthenticated SQL injection vulnerability in Analytics Plus (CVE-2025-8324), which could lead to account takeover has been addressed in this release. Learn more.
July
Build Number: 6170 (Release on: July 24, 2025)
Launching integration with BMC Helix Operations Management
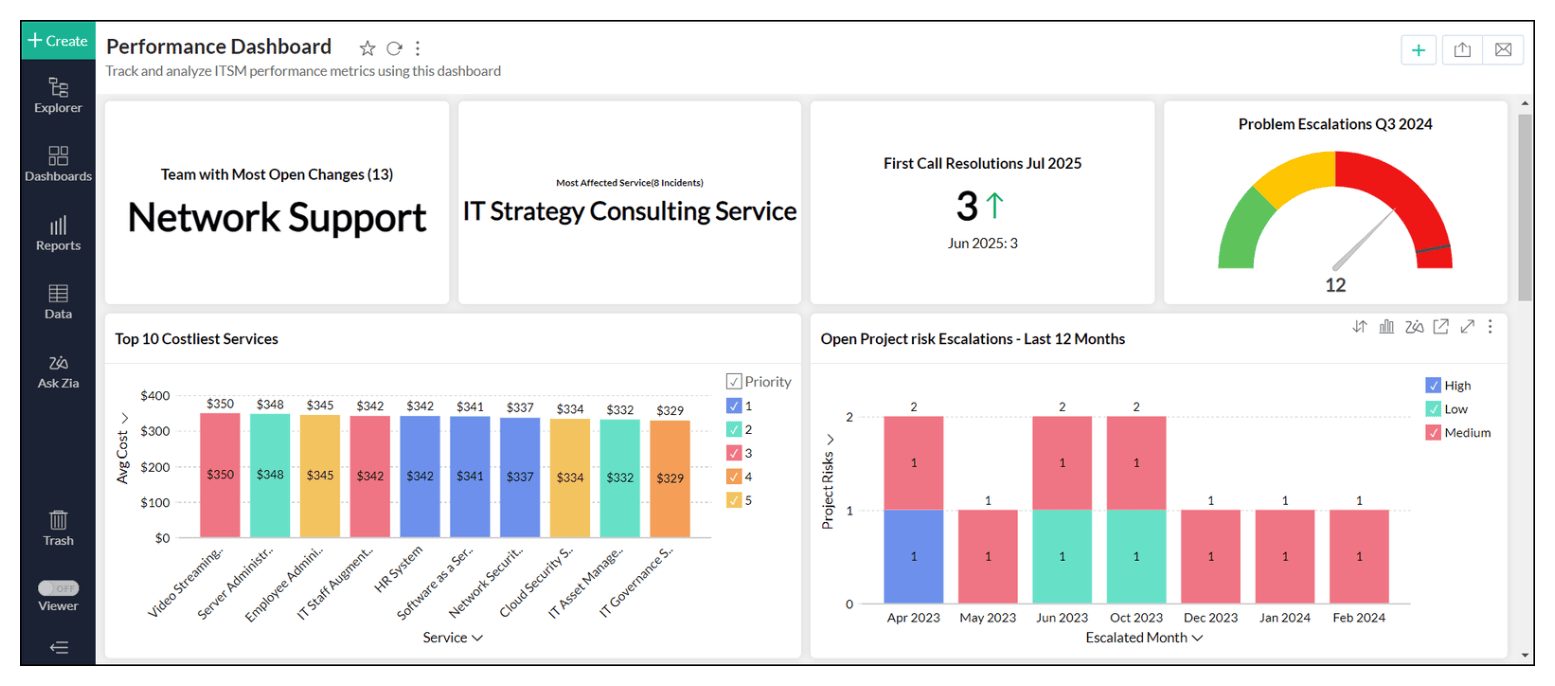
NewAnalytics Plus now integrates with BMC Helix Operations Management, enabling seamless analysis of IT performance metrics. Leverage advanced analytics to monitor key metrics, optimize service performance, and drive informed decision-making. Click here to learn more.
TLD Policy Enforcement – Real time user alert
NewAnalytics Plus now validates email addresses and displays an error notification when unsupported top-level domains (TLDs) are entered. Common unsupported domains such as .abc, .test, and .local are restricted, while valid ones like .com and .global are accepted. This applies when sharing views, adding workspace admins, or managing user groups–ensuring domain compliance and reducing configuration errors.
June
Build Number: 6160 (Release on: June 19, 2025)
Launching integration with Lansweeper
NewAnalytics Plus now supports Lansweeper integration, enabling seamless import of comprehensive IT asset data. Gain actionable insights through customizable dashboards and detailed reports to optimize your asset management. Click here to learn more.
Enhancing Security Configuration
NewIntroducing a new Security Configuration section in Analytics Plus settings to enhance your account protection and management. This section includes:
- Manage Account Lockout: Configure the number of failed login attempts that trigger temporarily account lockout to prevent unauthorized access.
- Password Policy: Define password complexity and expiration rules to secure user accounts.
- User Session Management: Track and manage active user sessions in Analytics Plus to enhance account security, enforce session policies, and prevent unauthorized access.
Click here to know more about the configuration.
Optimizing Export to other Workspace
EnhancementThe Workspace export feature now uses a background scheduler, enabling uninterrupted usage during large exports. Users will be alerted via notifications once the process completes.
Updating Personal Edition capabilities
Issues fixedData alerts and workspace migration have been disabled for Personal (free) Edition users, as this edition supports only a single user with limited functionality. Click here learn more about edition comparison.
May
Build Number: 6150 (Release on: May 22, 2025)
Launching integration with PRTG
NewAnalytics Plus integrates with PRTG, enabling you to import and analyze your network monitoring data through powerful dashboards and reports. Click here to learn more.
Enhancements to distributed processing
EnhancementIntroducing enhancements to our multi-server architecture that simplify the provisioning, license management, and horizontal scaling of application servers–enabling centralized control and improved operational efficiency.
Enhancing sync status visibility
EnhancementTo provide a clearer picture of the data synchronization status from ManageEngine Applications Manager, and OpManager, the following sync statuses have been introduced.
- Sync Success: Shown when all modules are synced successfully.
- Sync Partial Success: Displayed when one or more modules fail, replacing the previous full failure message.
- Batched Sync in Progress: Indicates that data is being fetched in batches and sync is ongoing.
- Sync Failed: Shown in cases of complete sync failure as a result of connectivity issues or authentication failures or if the mandatory modules fails (Inventory, Alarms & Availability History of Monitors/Devices).
These updates ensure more accurate and actionable information of the sync process across ManageEngine Applications Manager, and OpManager integrations.
Launching the Enhanced Installation Info Page
EnhancementDiscover the all-new Get Installation Info view–now with a modernized layout and richer system metrics, giving you quicker, clearer access to your application's performance data.
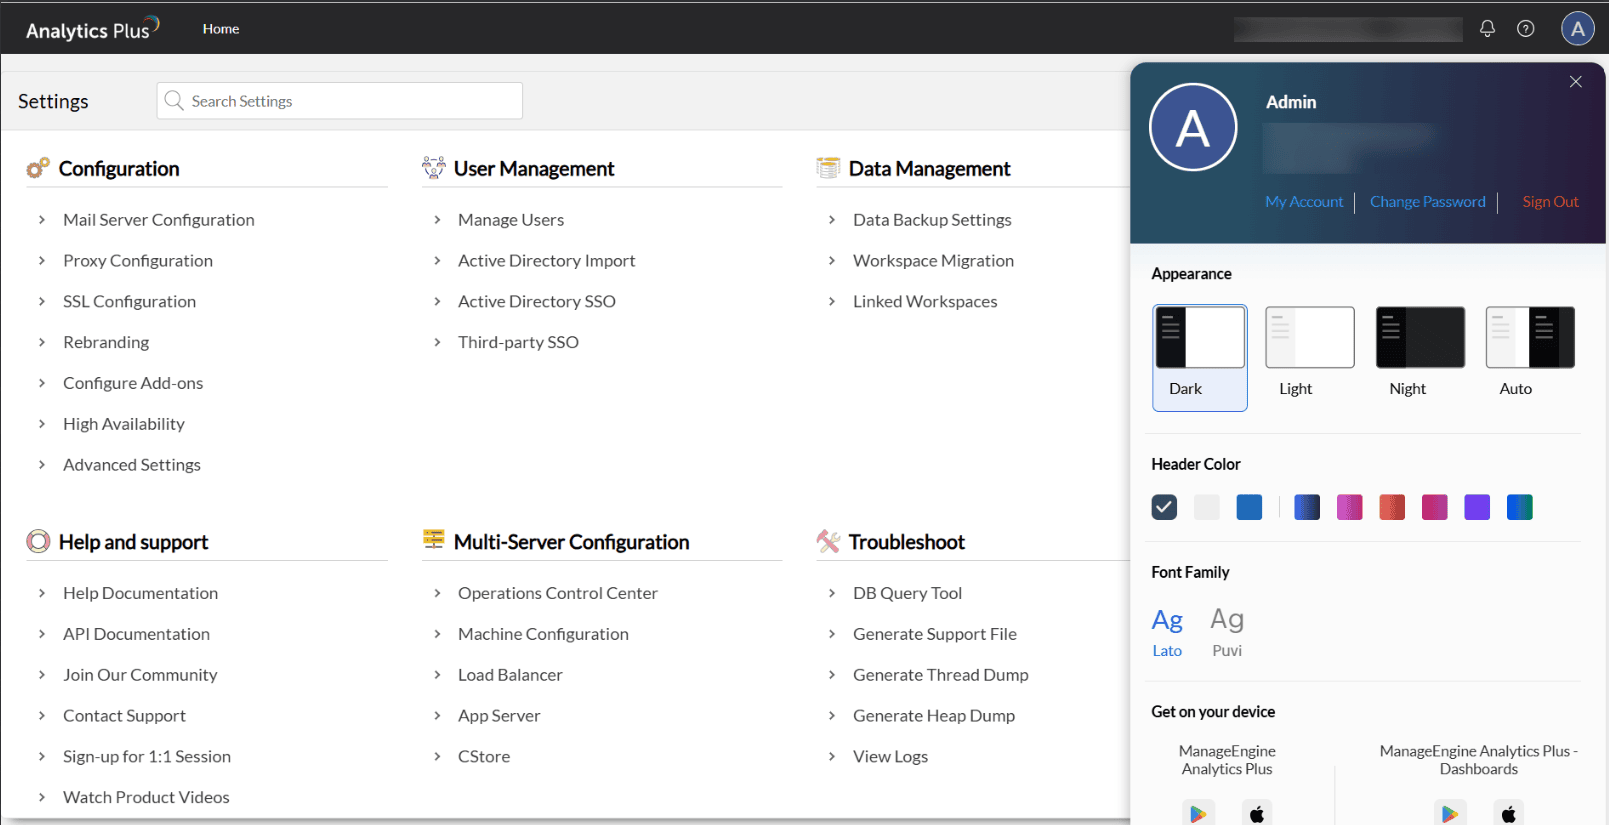
Migrating to the Enhanced User Interface
EnhancementWith the release of build 6150, the interface is upgraded to the new and enhanced UI, providing a more user-friendly layout, smoother navigation, and better access to key features like configuration settings and personalization options.
Legacy interface image:
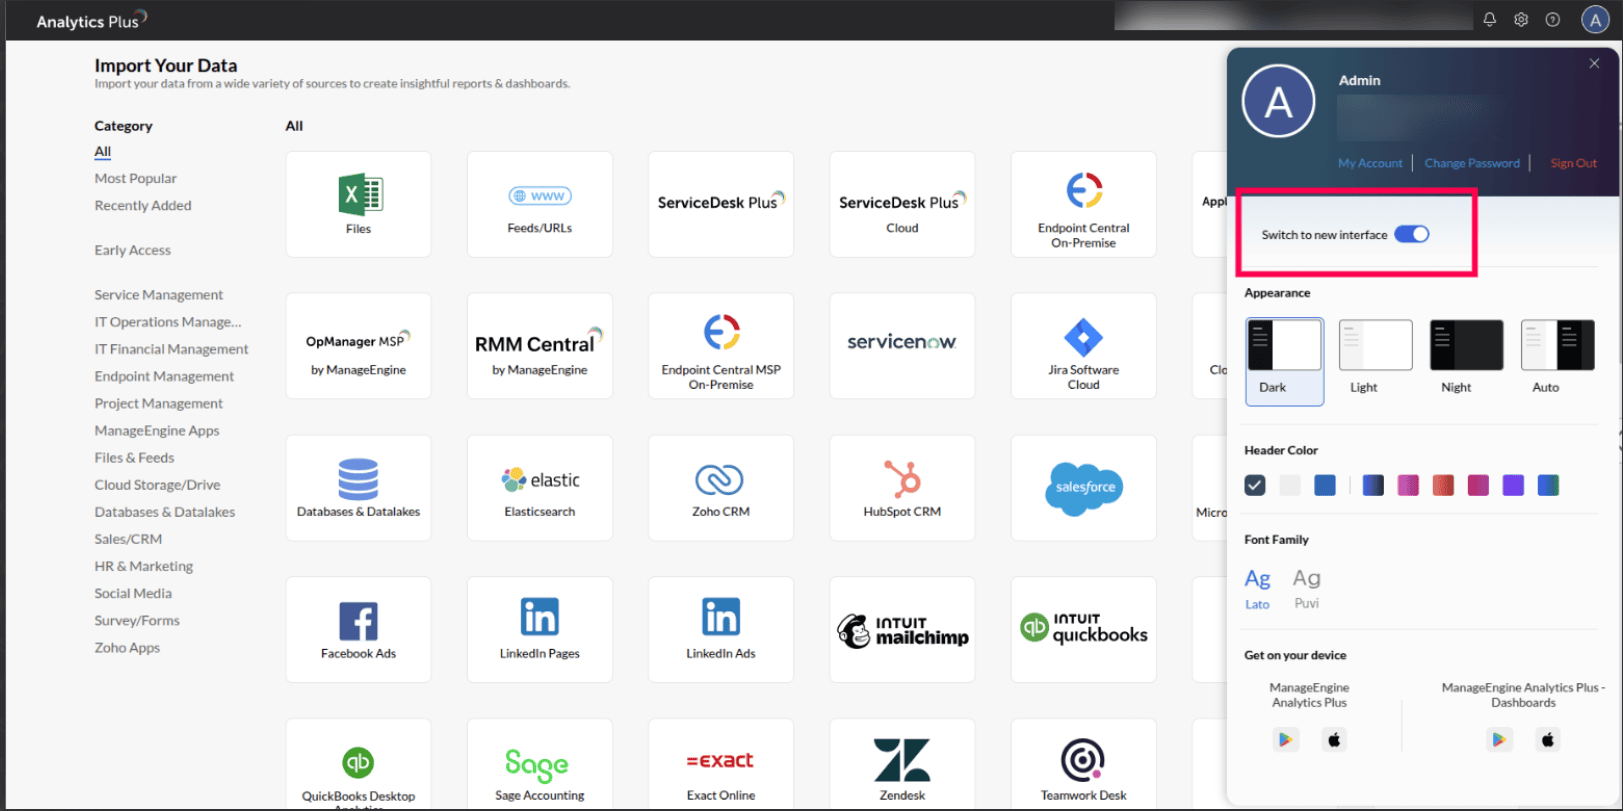
6150 interface image:
April
Build Number: 6140 (Release on: April 23, 2025)
Launching Vulnerability Manager Plus integration
NewAnalytics Plus now integrates with ManageEngine Vulnerability Manager Plus (VMP), offering pre-built analytics to assess vulnerabilities and enhance security management. Click here to learn more.
Invitation email for Migrated Users
EnhancementAfter being reactivated following a workspace migration from one server to another, users will receive an invitation email containing their login credentials.
Issues fixed
Issues fixedA Path Traversal vulnerability (CVE-2024-53677) in Apache Struts 2 has been addressed in this release.
Mar
Build Number: 6130 (Release on: March 11, 2025)
Issues fixed
Issues fixedThis release focuses on enhancing product stability by addressing critical security vulnerabilities:
- A Cross-Site Scripting (XSS) vulnerability in the Manage Users page has been identified and resolved.
- CVE-2025-1724: A vulnerability in AD Authentication that could allow user account takeover has been identified and fixed in this release.
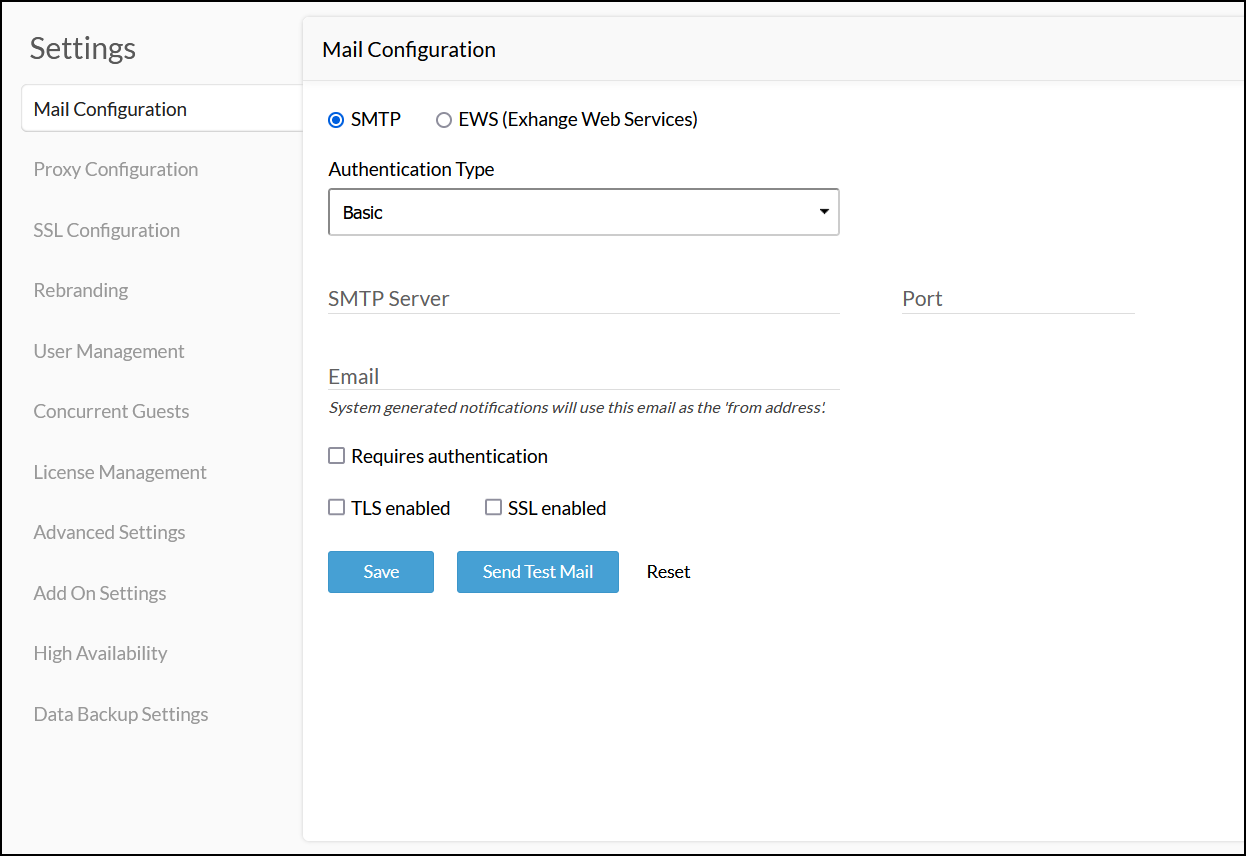
- Unified Email Notification Configuration: The email notification settings have been relocated from under "Settings > Advanced Settings page" to "Settings > Mail Server Configuration page" for a more streamlined user experience.
Feb
Build Number: 6120 (Release on: February 11, 2025)
Launching RingCentral integration
NewAnalytics Plus now integrates with RingCentral, providing pre-built insights to optimize call center performance and elevate customer service. Click here to learn more.
Introducing integration with Mosyle
NewAdvanced analytics for Mosyle delivers comprehensive insights into all your managed devices, streamlining Apple device management effortlessly. Click here to learn more.
Notifications of failed login attempts
EnhancementAnalytics Plus admins and users can now receive email notifications of failed login attempts, enhancing application security.
Jan
Build Number: 6110 (Release on: January 16, 2025)
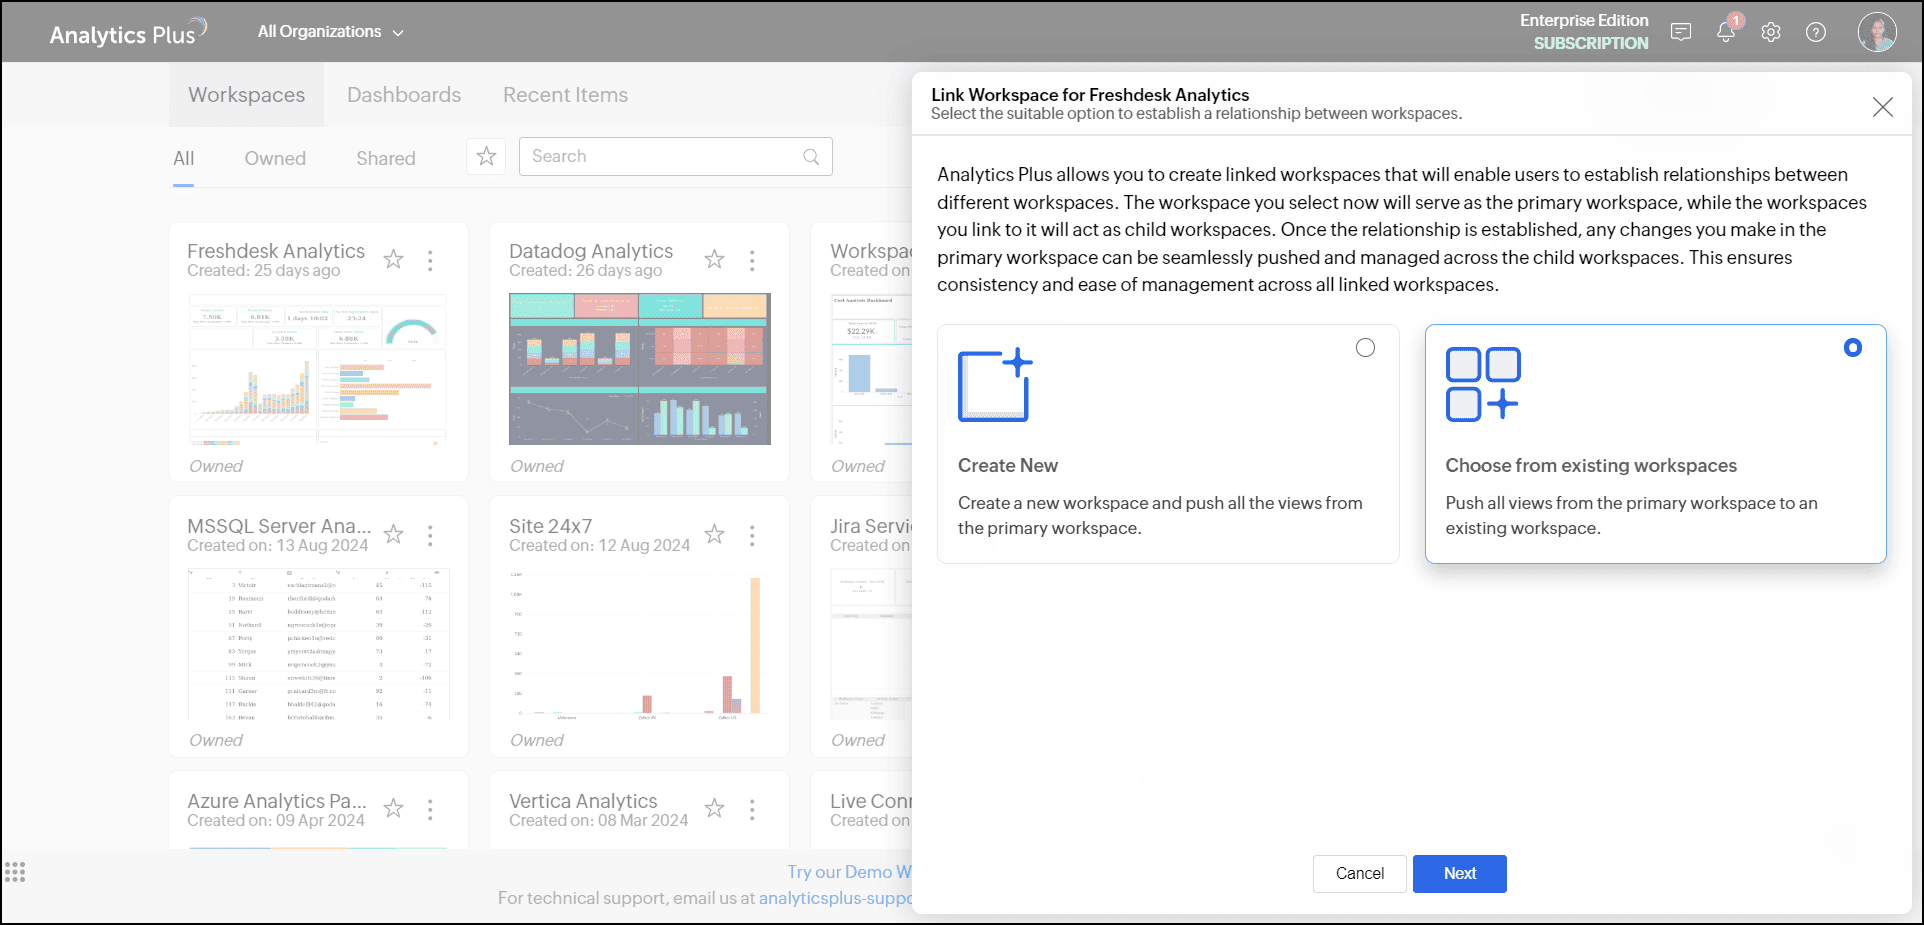
Unveiling Linked Workspaces
NewLinked Workspaces in Analytics Plus, easily connect two workspaces to sync and share views. With one click, update secondary workspaces with changes (addition or modification of views) from the primary workspace. This feature saves time, keeps reports up-to-date, and organizes views across workspaces centrally. Click here to learn more.
Introducing support for additional modules in Jira
EnhancementAnalytics Plus now supports the Status Transitions module for Jira Software (Cloud and Server) and the Organization module for Jira Service Management.
Issues fixed
Issues fixedA security vulnerability that allowed authorized users (such as managers or viewers) to delete or restore other users' workspaces has been resolved by implementing robust authorization checks.
2024
Nov
Build Number: 6100 (Release on: November 27, 2024)
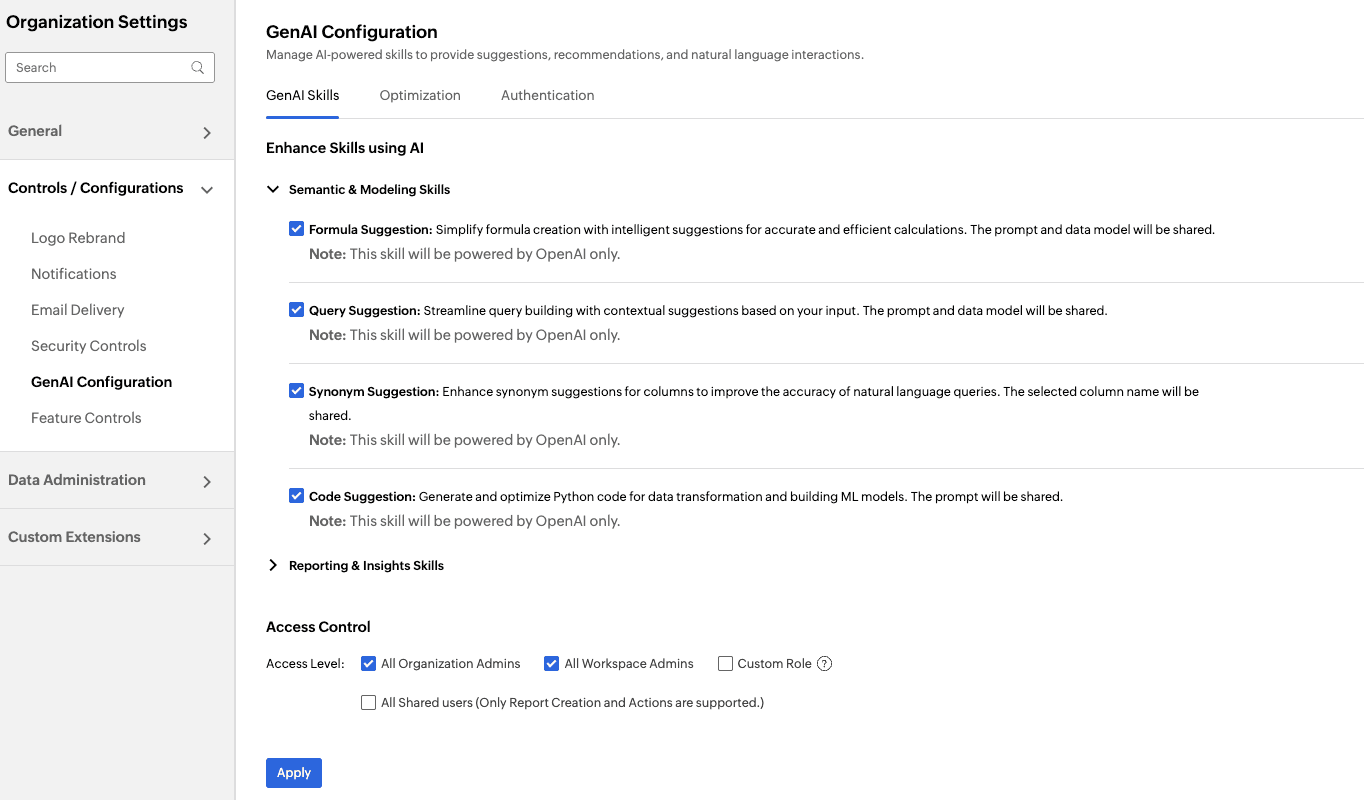
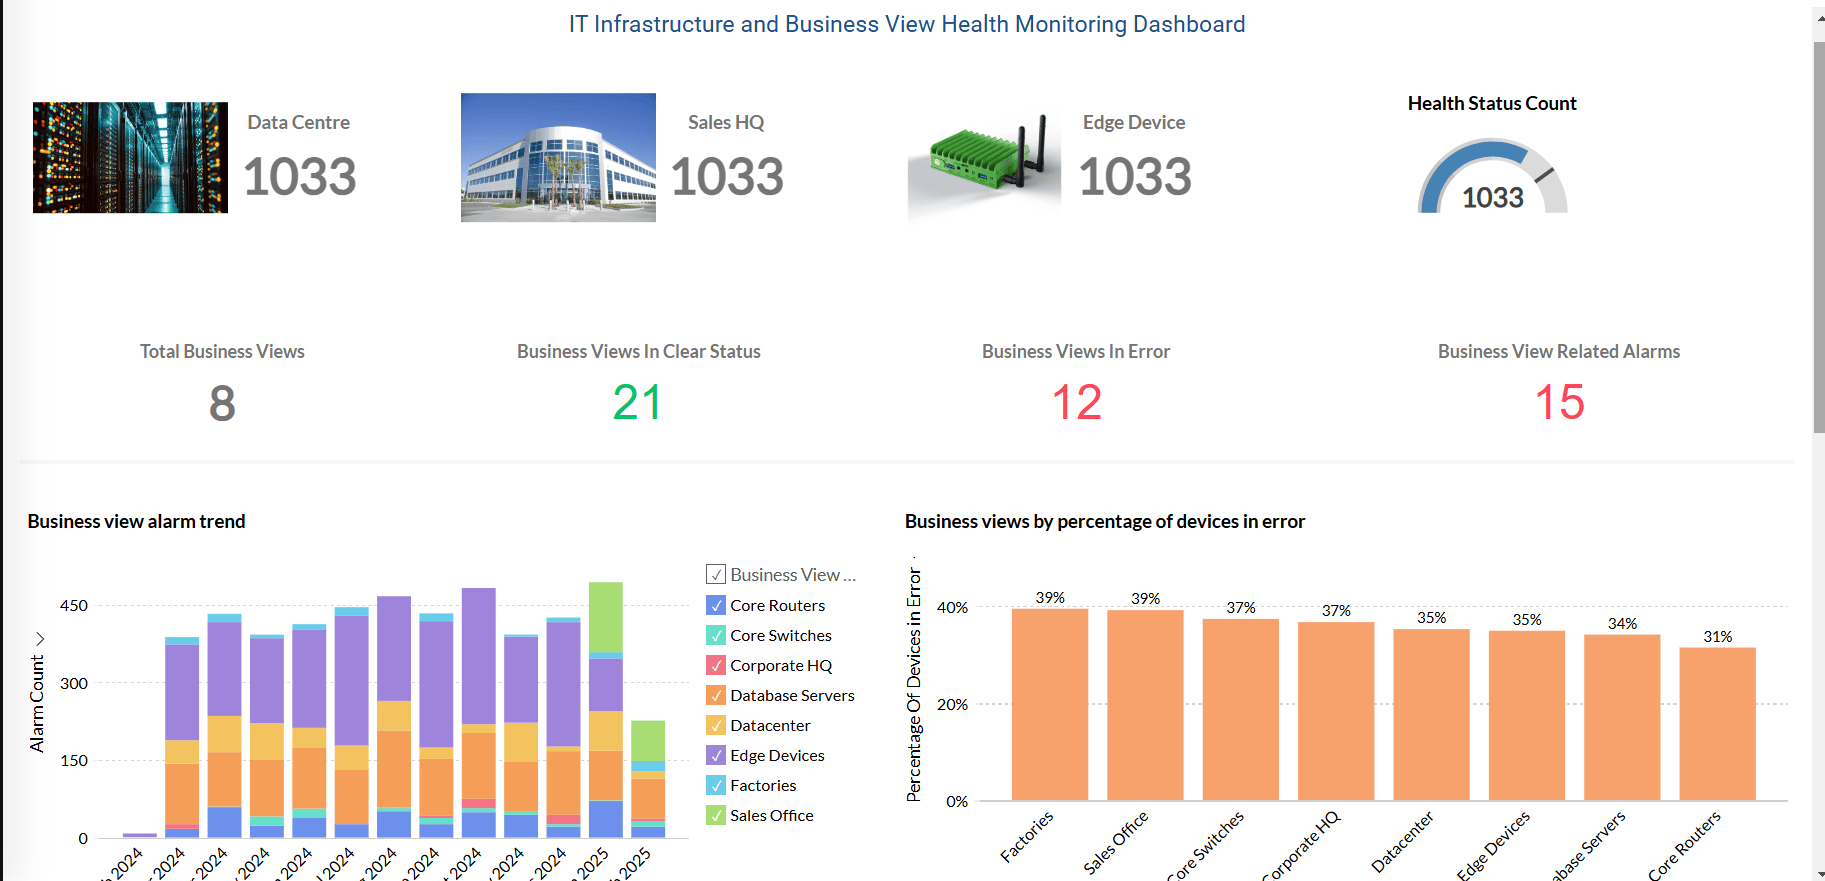
AI-Driven analytics in Ask Zia
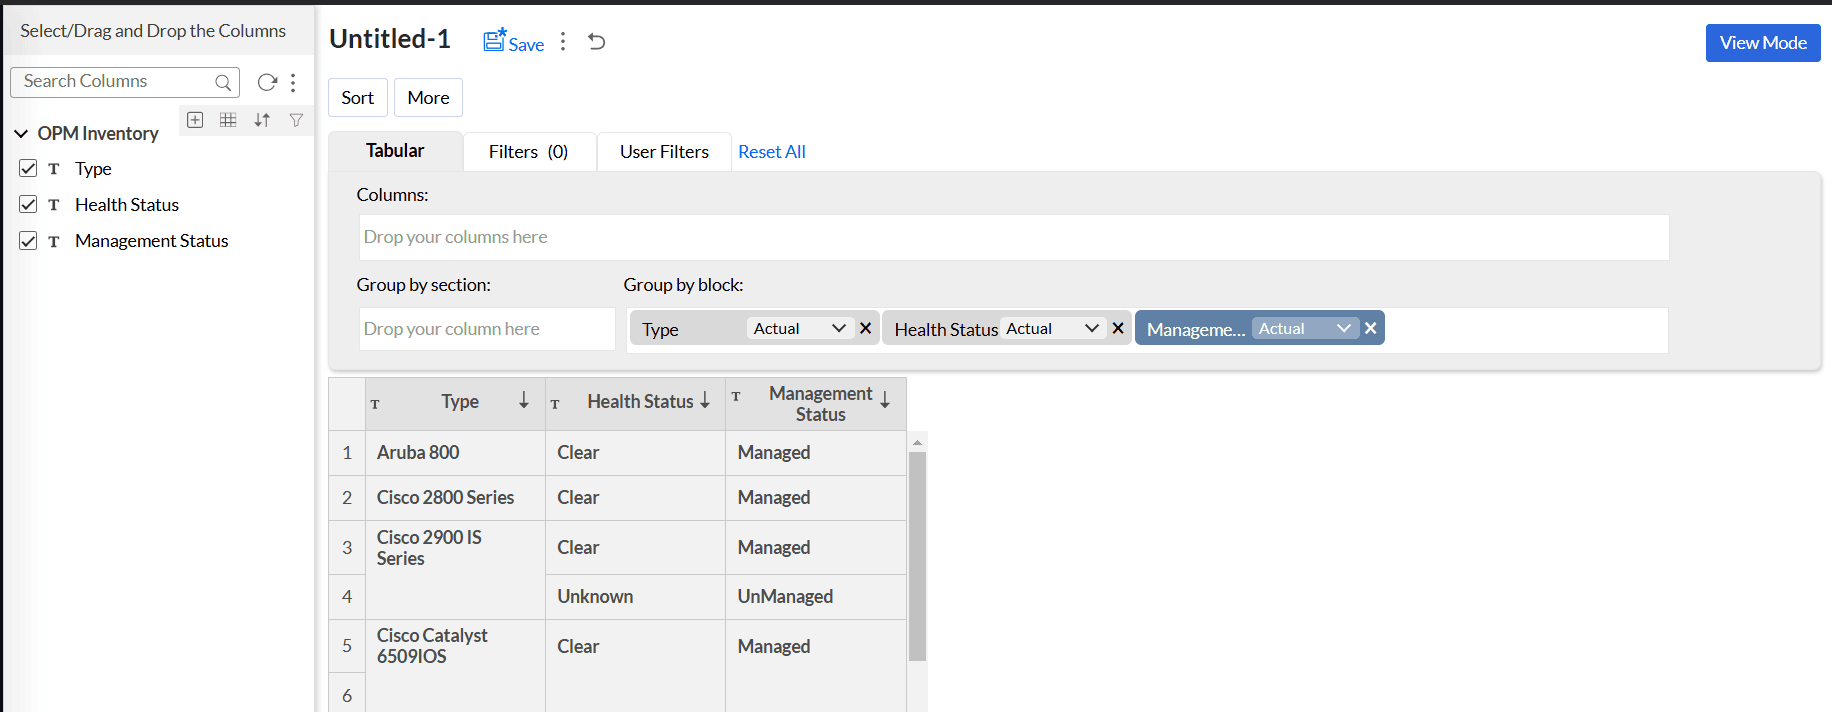
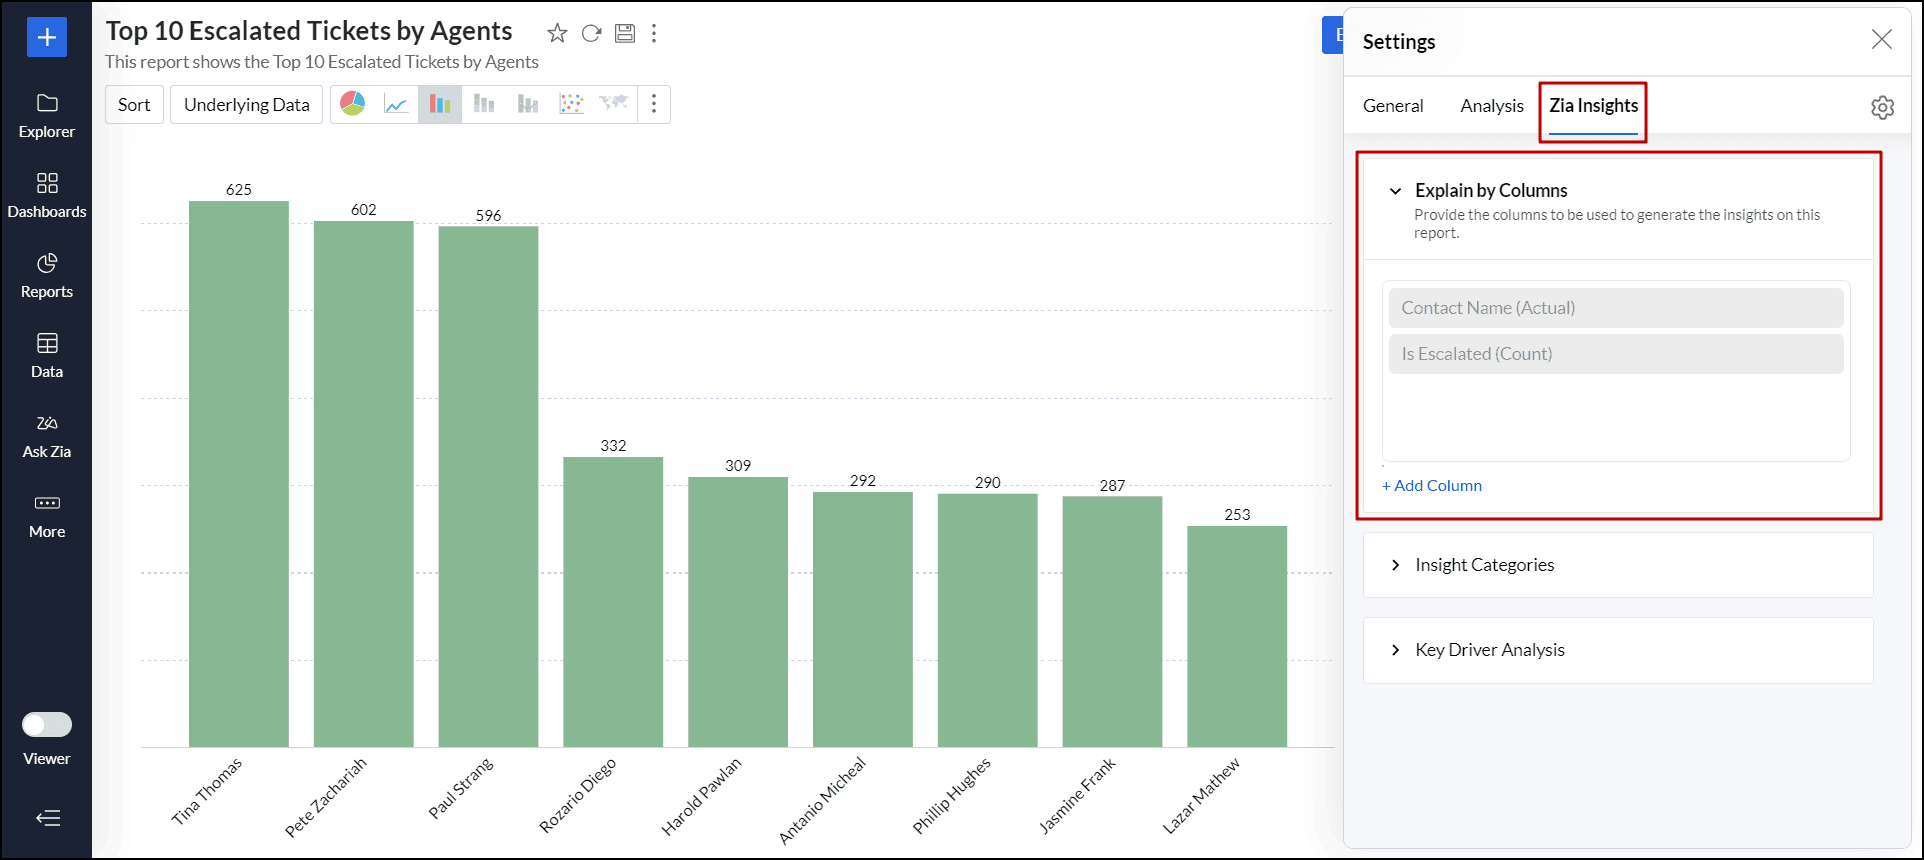
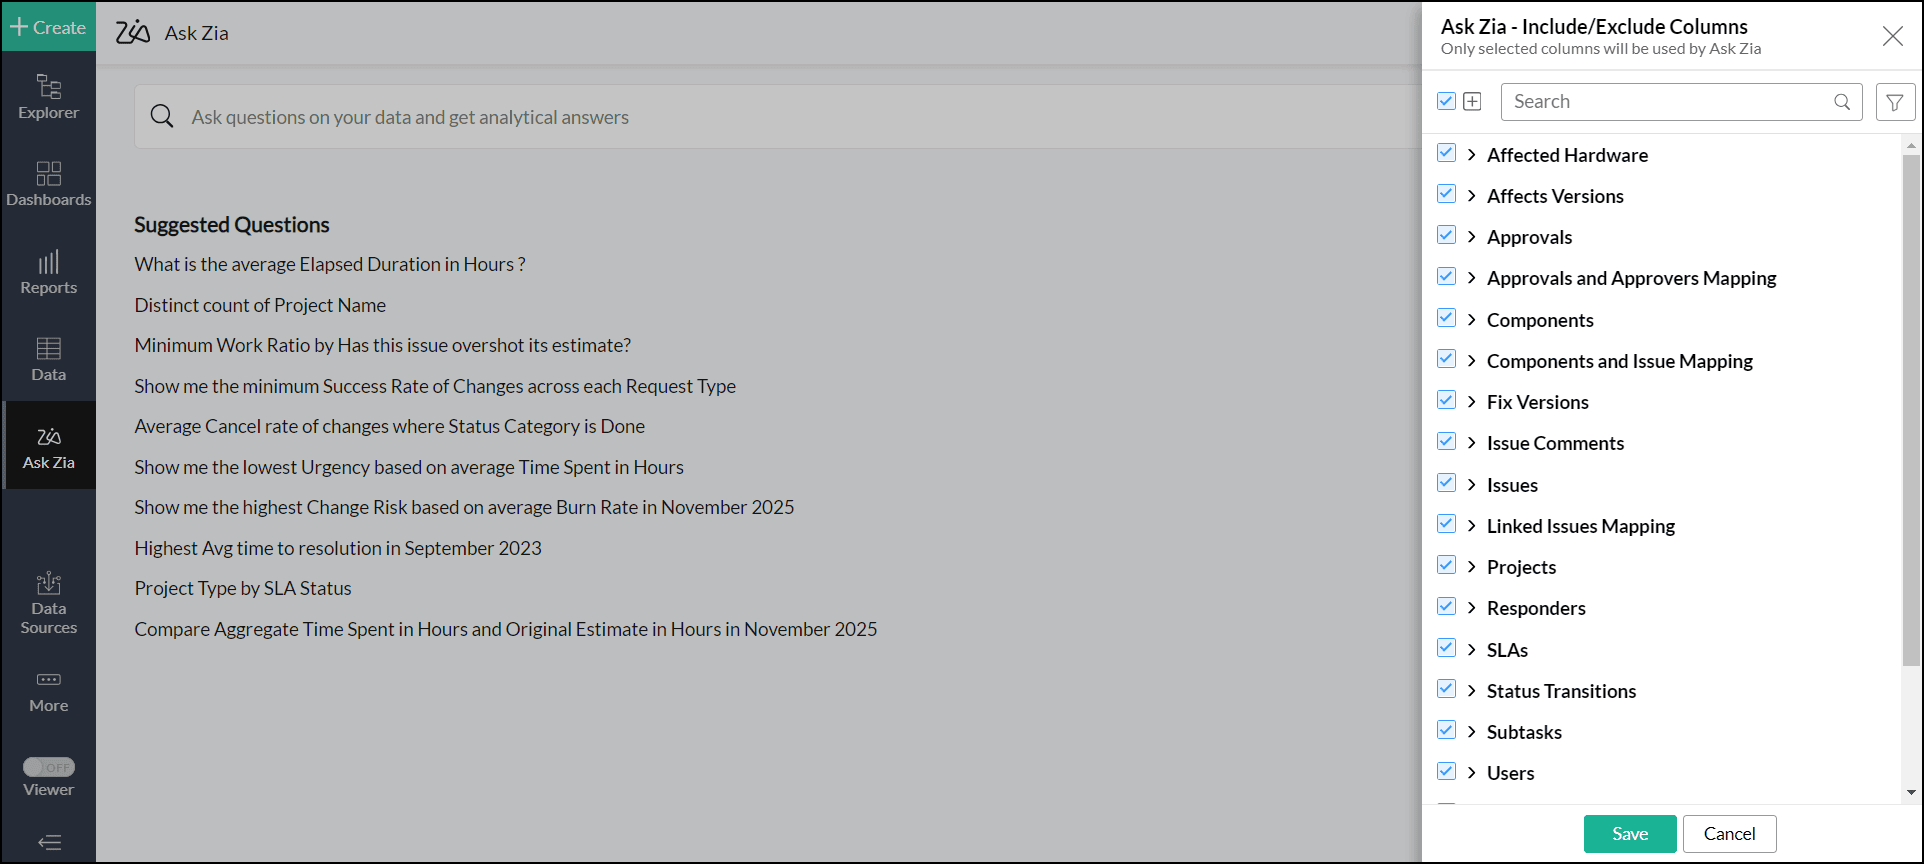
NewConfigurable insights
With Analytics Plus, you can now select columns to be used for Zia Insights, allowing you to get targeted insights for KPIs of interest, thus ensuring a focused interpretation of observed trends. Click here to learn more.

Ask Zia conversation mode can now handle complex mathematical questions, helping you find and assess correlation in your data. Click here to learn more.
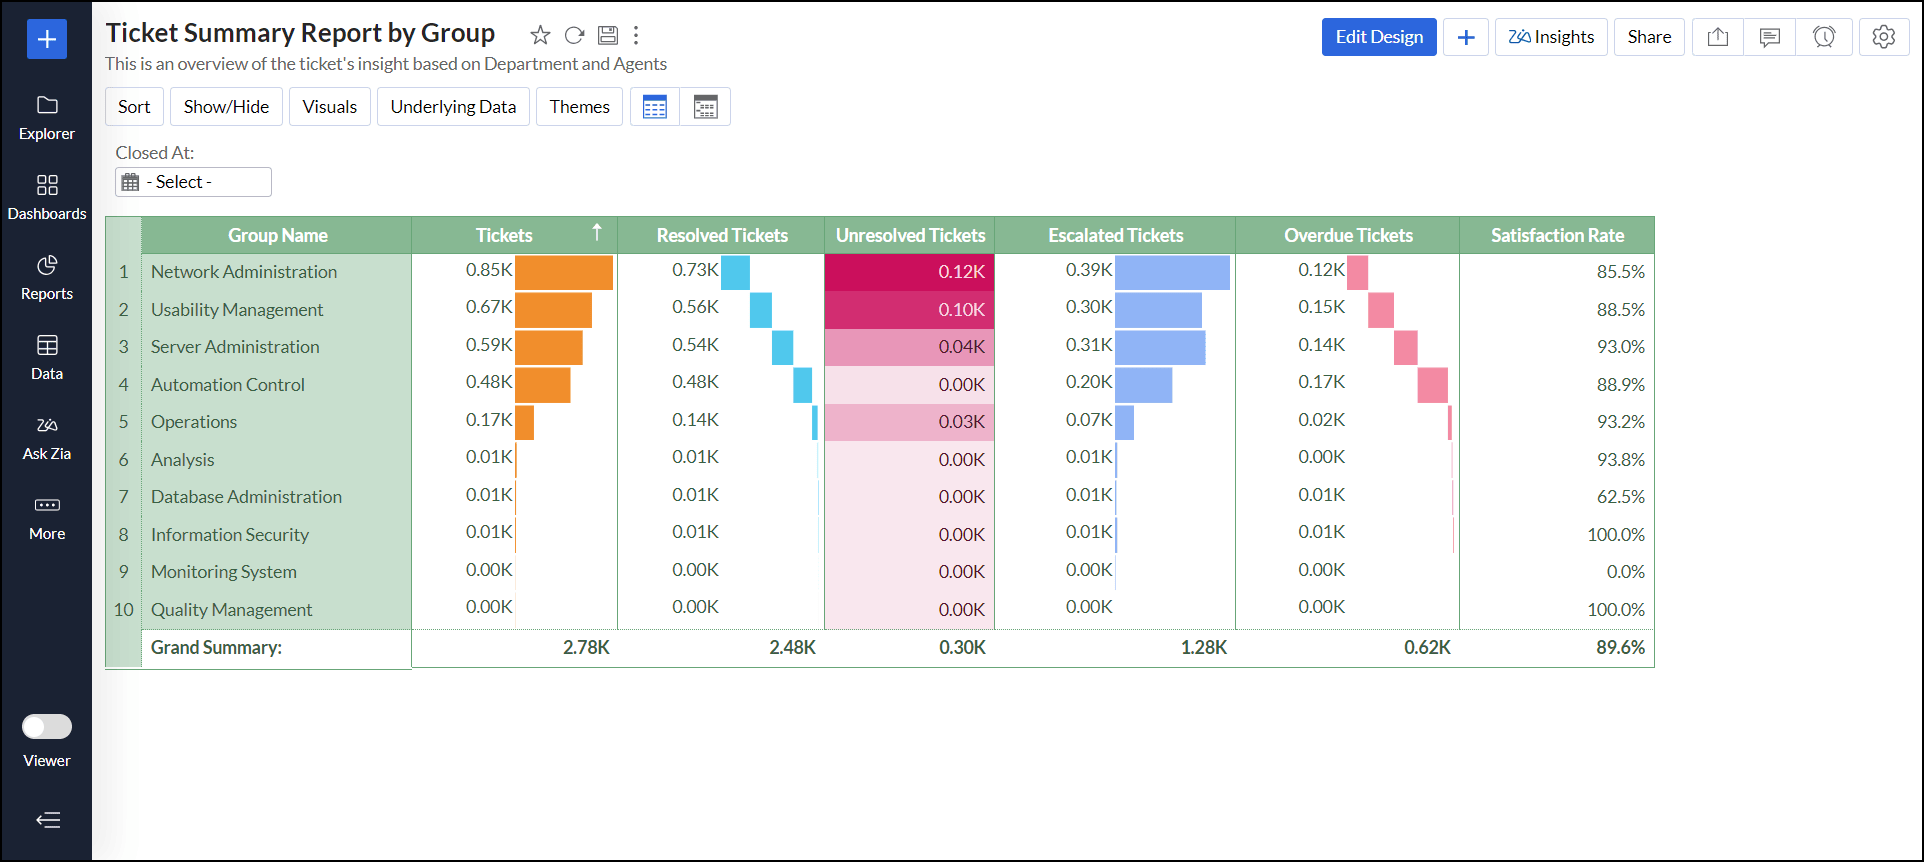
Introducing Data Bars for pivot tables
NewTransform your pivot tables into powerful storytelling tools with Data Bars (Bar and Waterfall) charts, ideal for analyzing complex data sets and highlighting key insights. Click here to learn more.

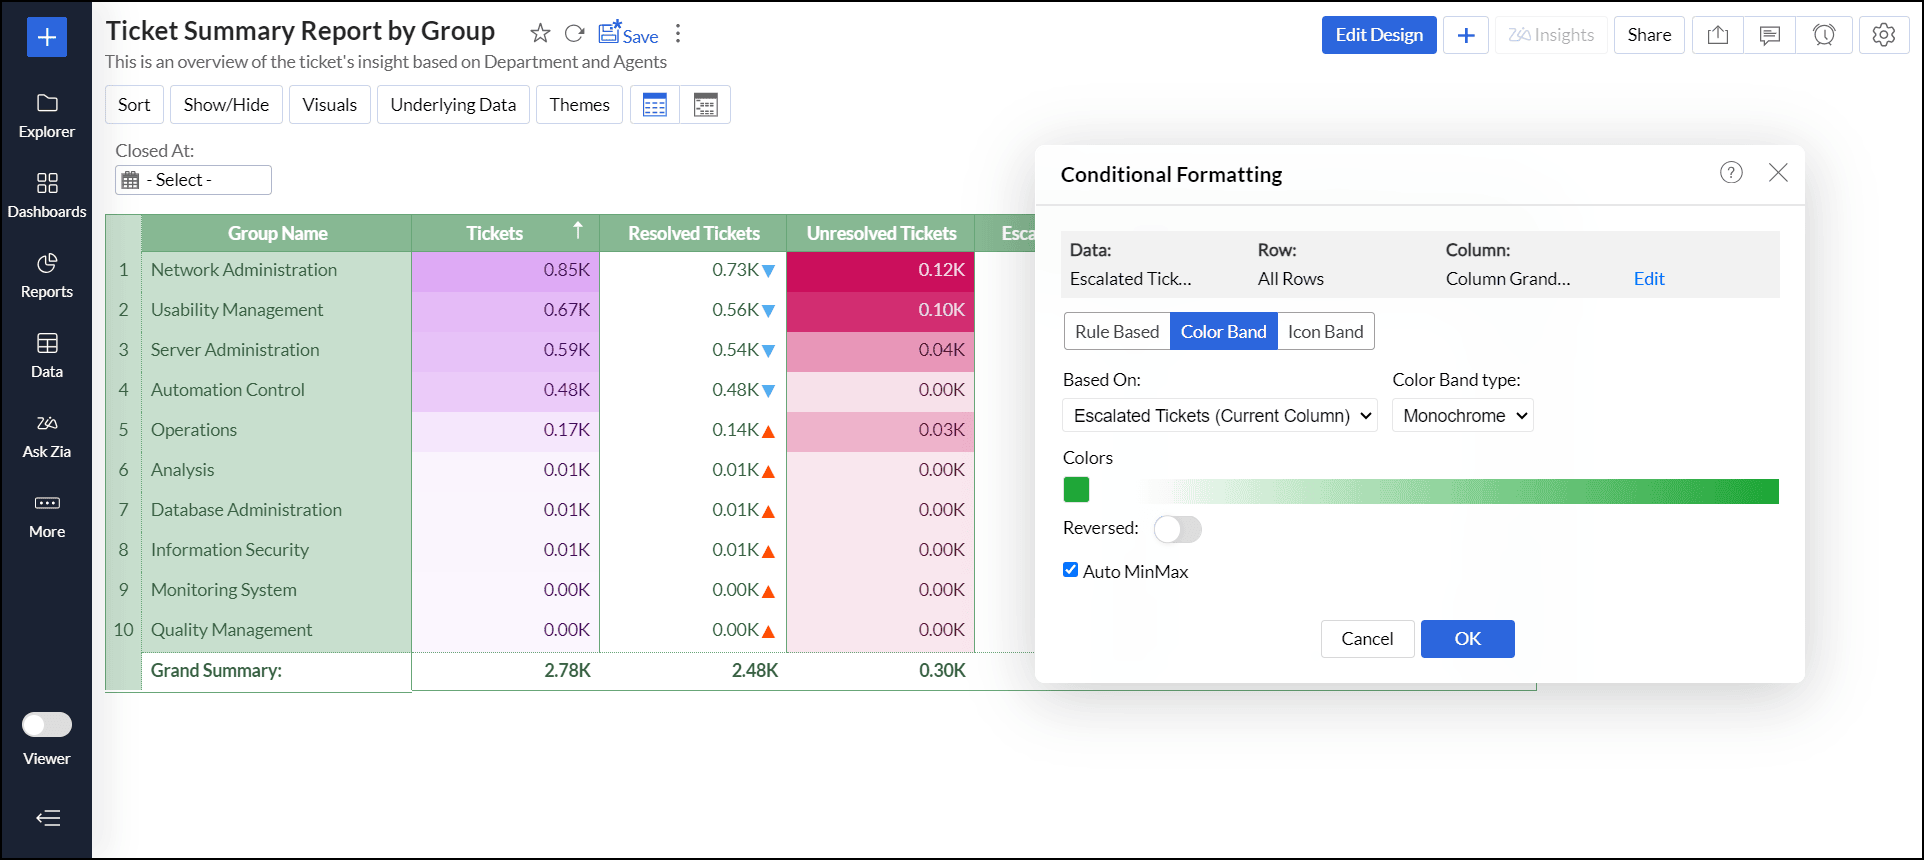
New color bands and icons in the pivot table
EnhancementAnalytics Plus now provides new conditional formatting options, including color bands and icons, to highlight key data points and improve data comprehension. Click here to learn more.

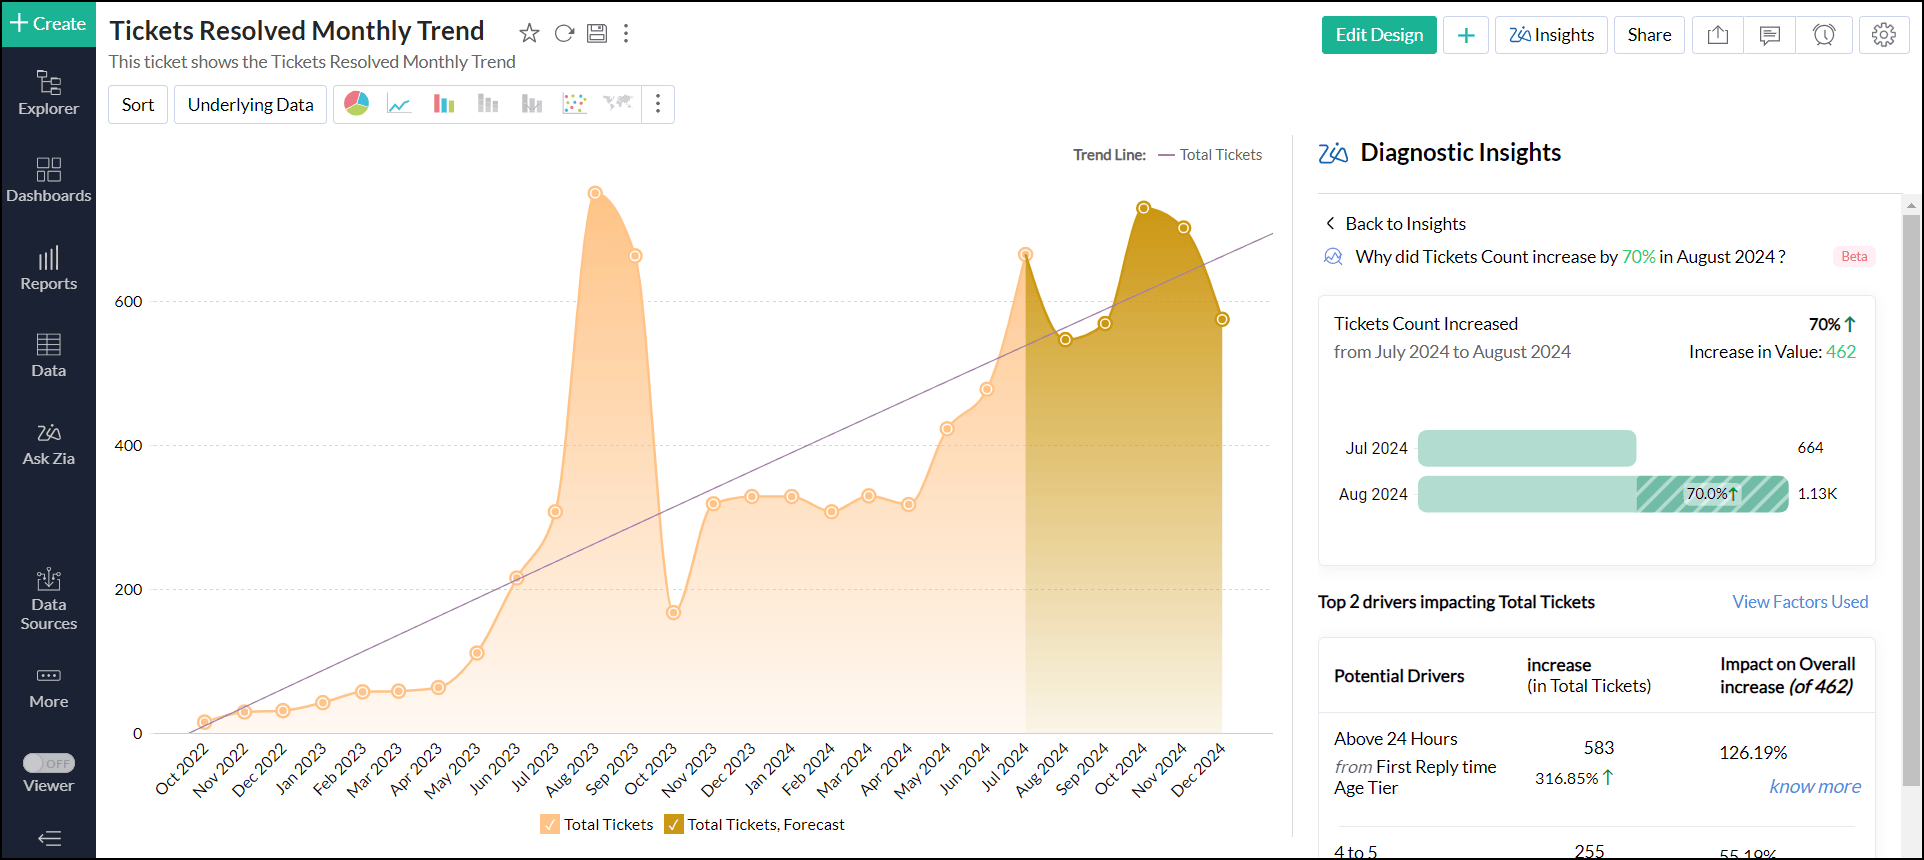
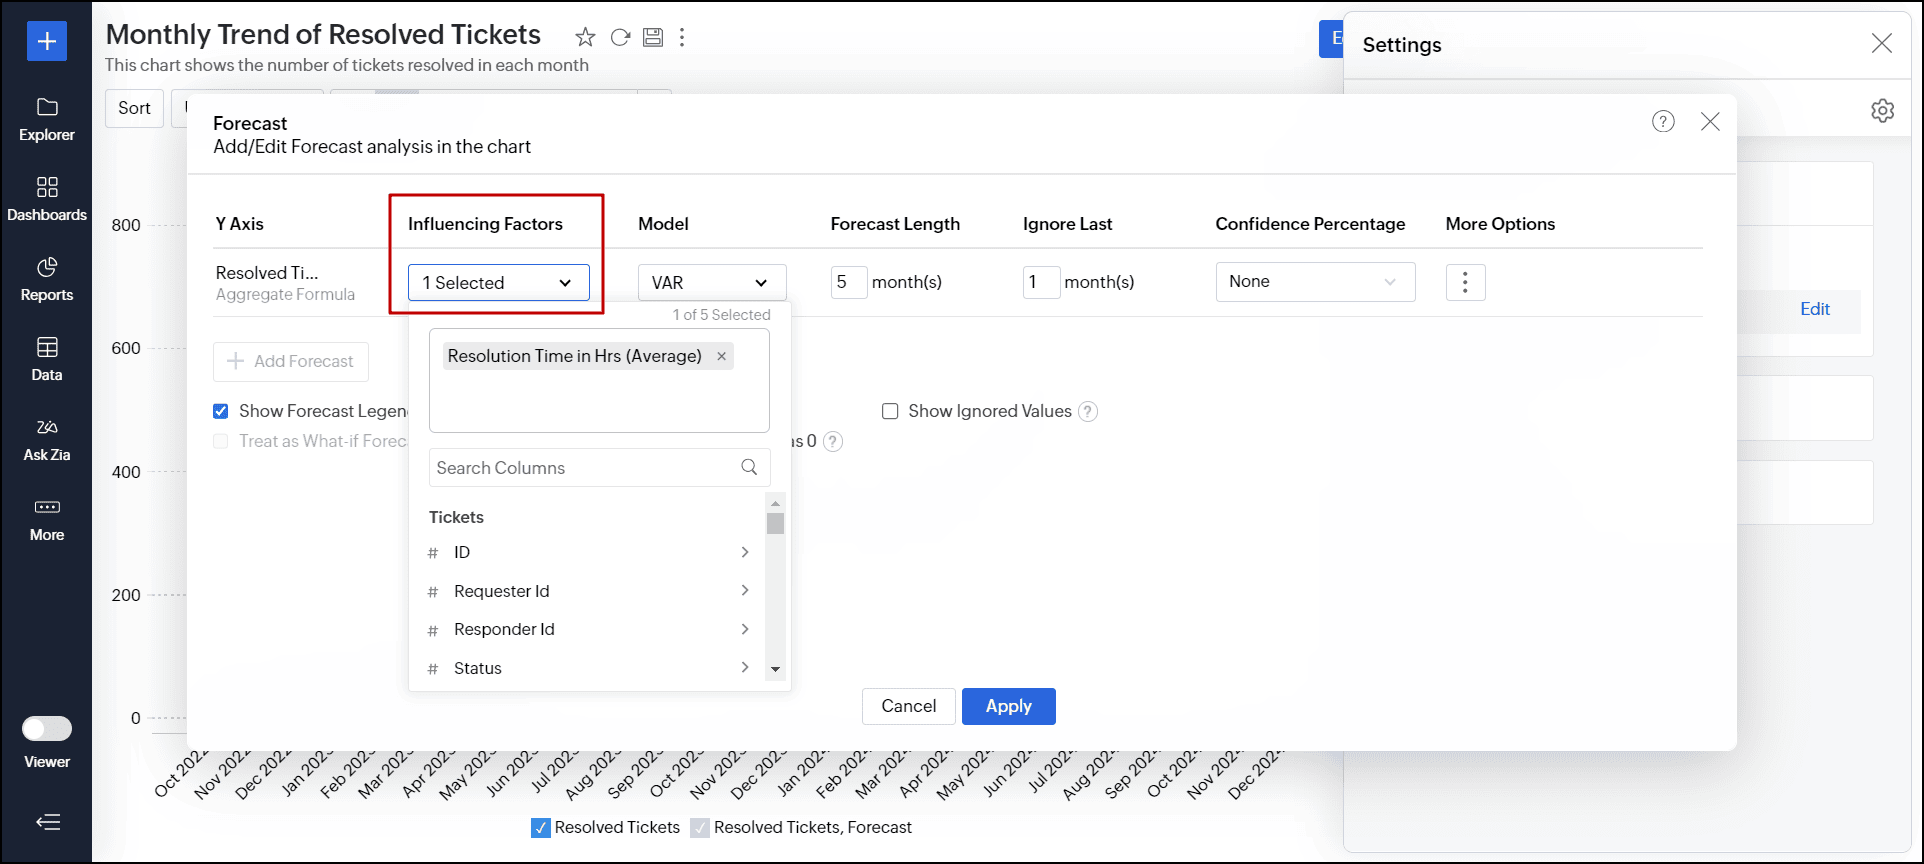
Presenting Multi-variate forecasting
NewElevate the accuracy of forecasting by including factors for prediction. For instance, when forecasting the monthly trend of resolved tickets, predictions usually rely only on historical data. By including influencing factors like the availability of technicians and the priority of incidents, you can achieve more precise forecasts. Click here to learn more.
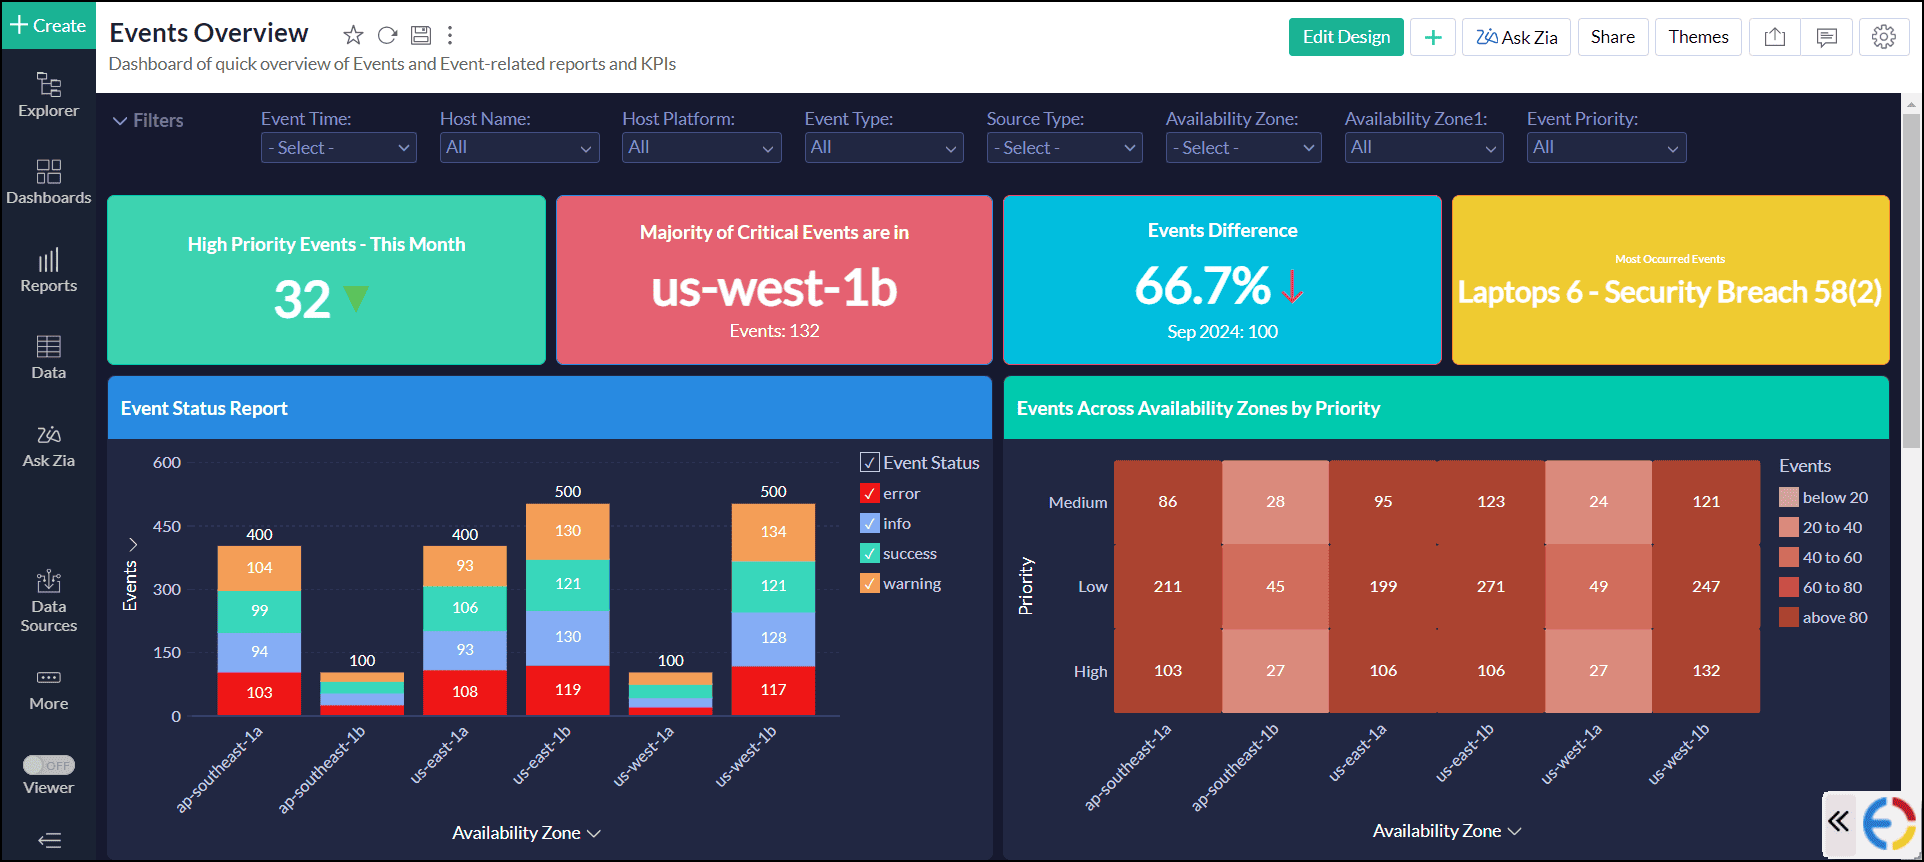
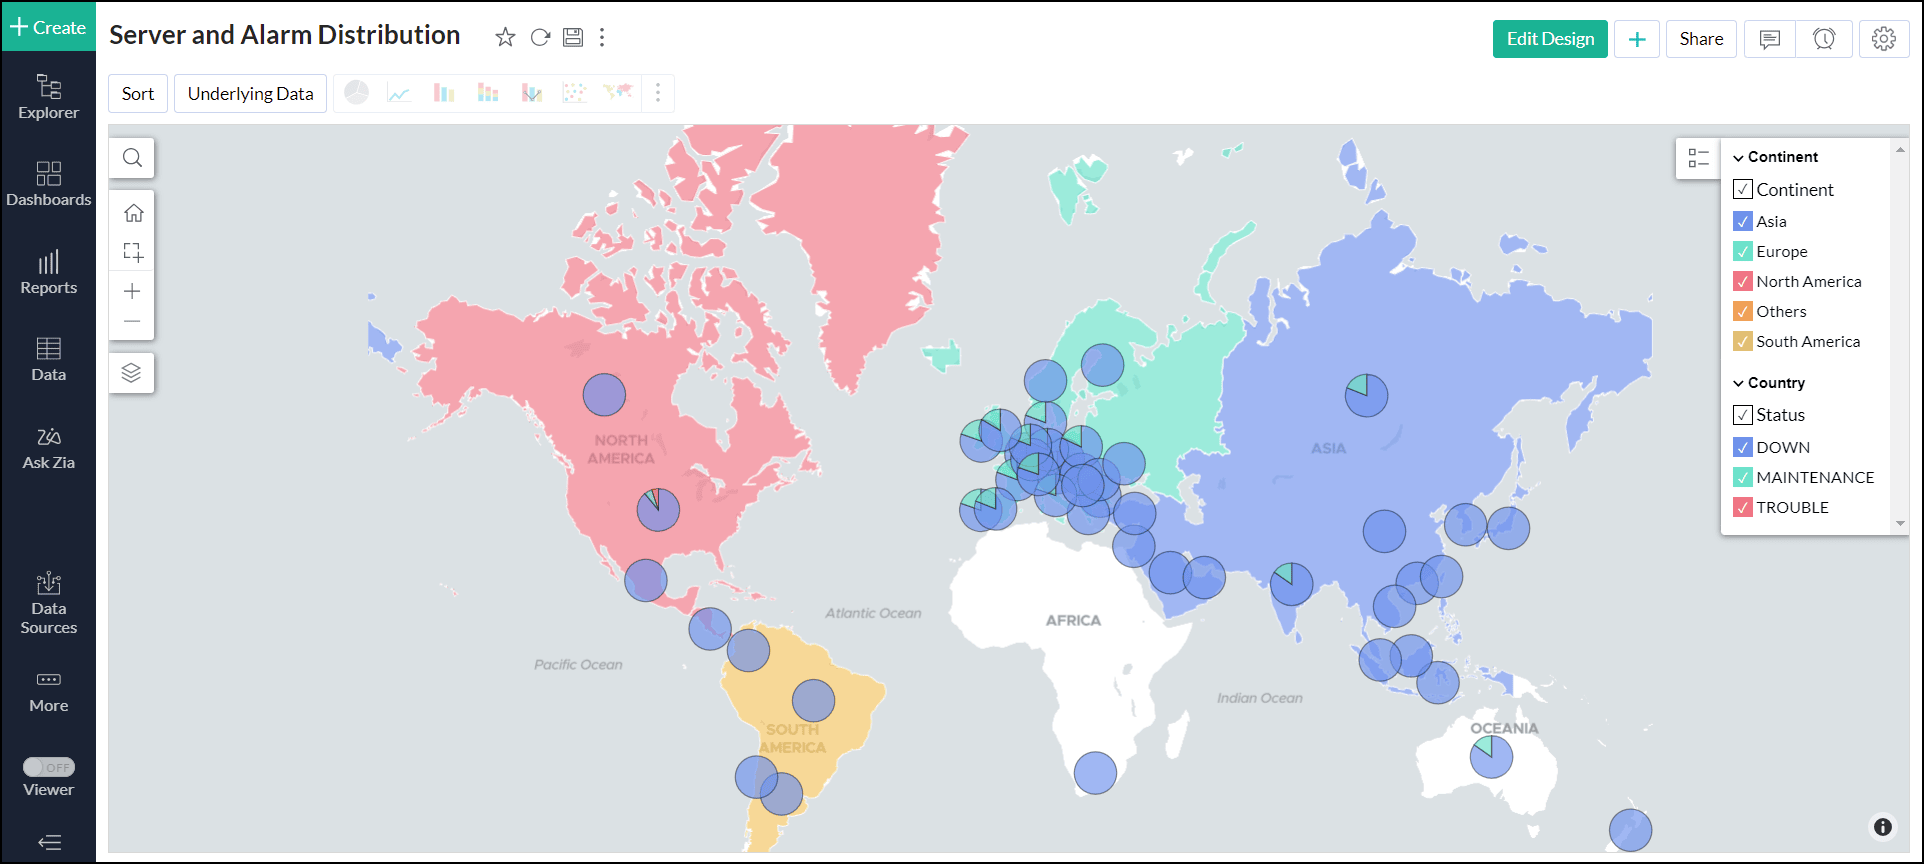
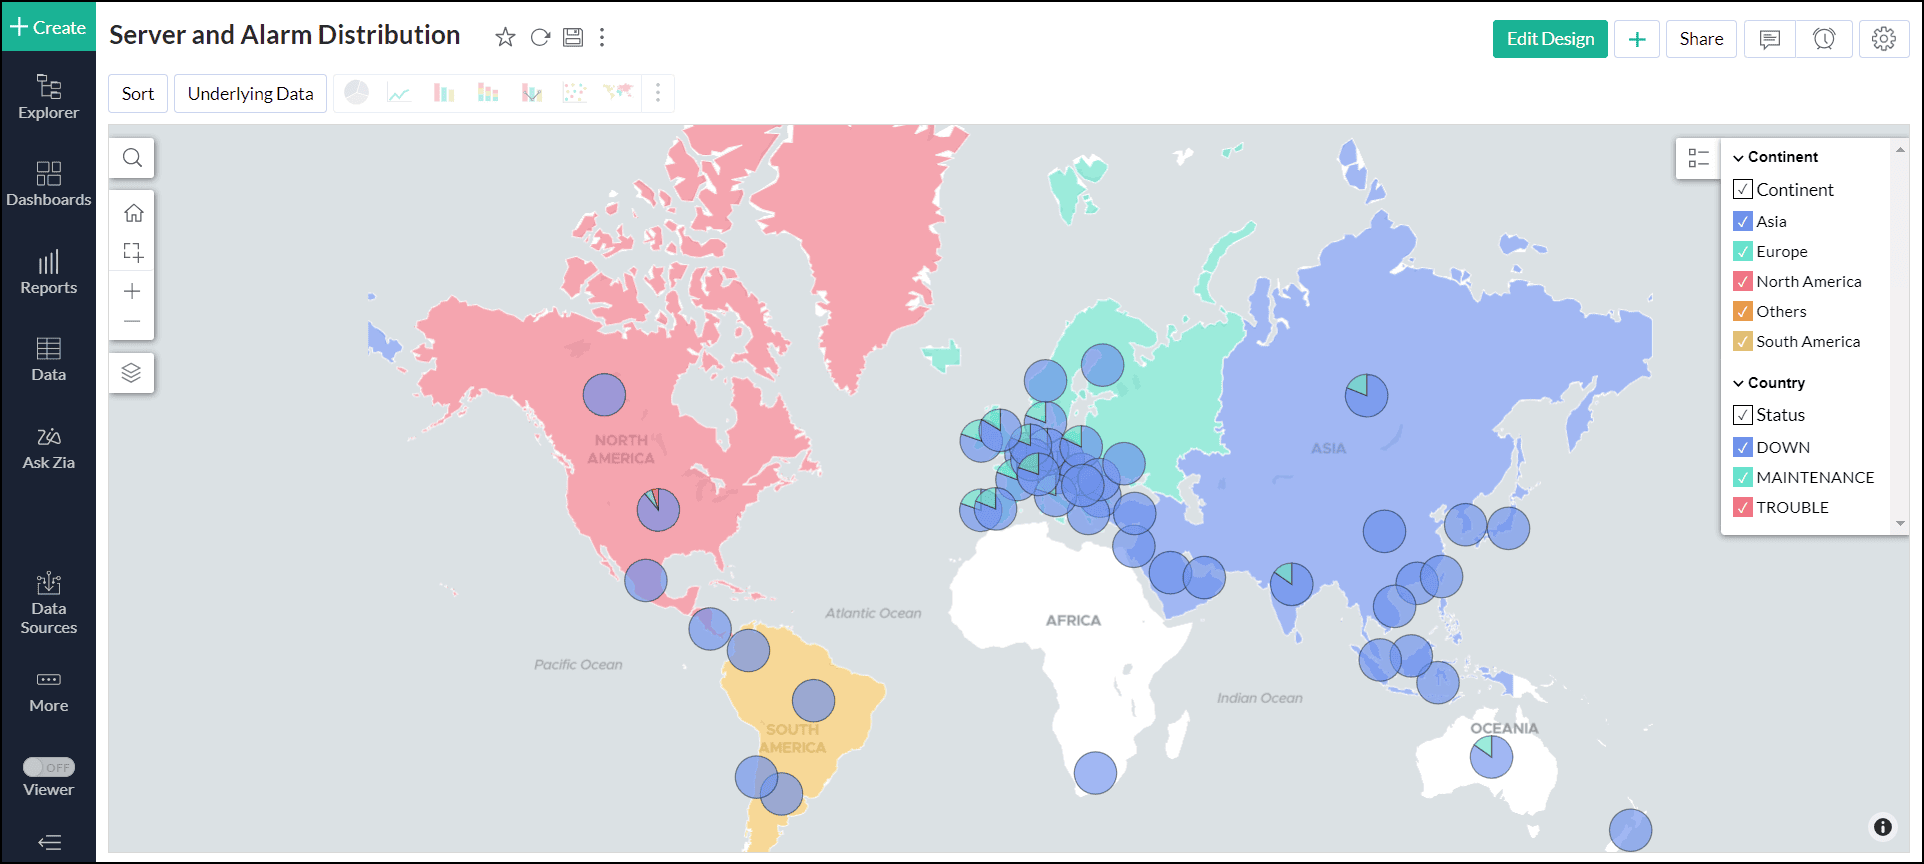
Map layering in Geo map charts
EnhancementAnalytics Plus now allows you to stack multiple data sets on a single geo map, with each layer representing different types of information, such as the distribution of Servers and Alarms. By integrating these layers, you can easily visualize the total number of servers (monitors) available and the number of alarms in various statuses at each location within a single report. Click here to learn more.
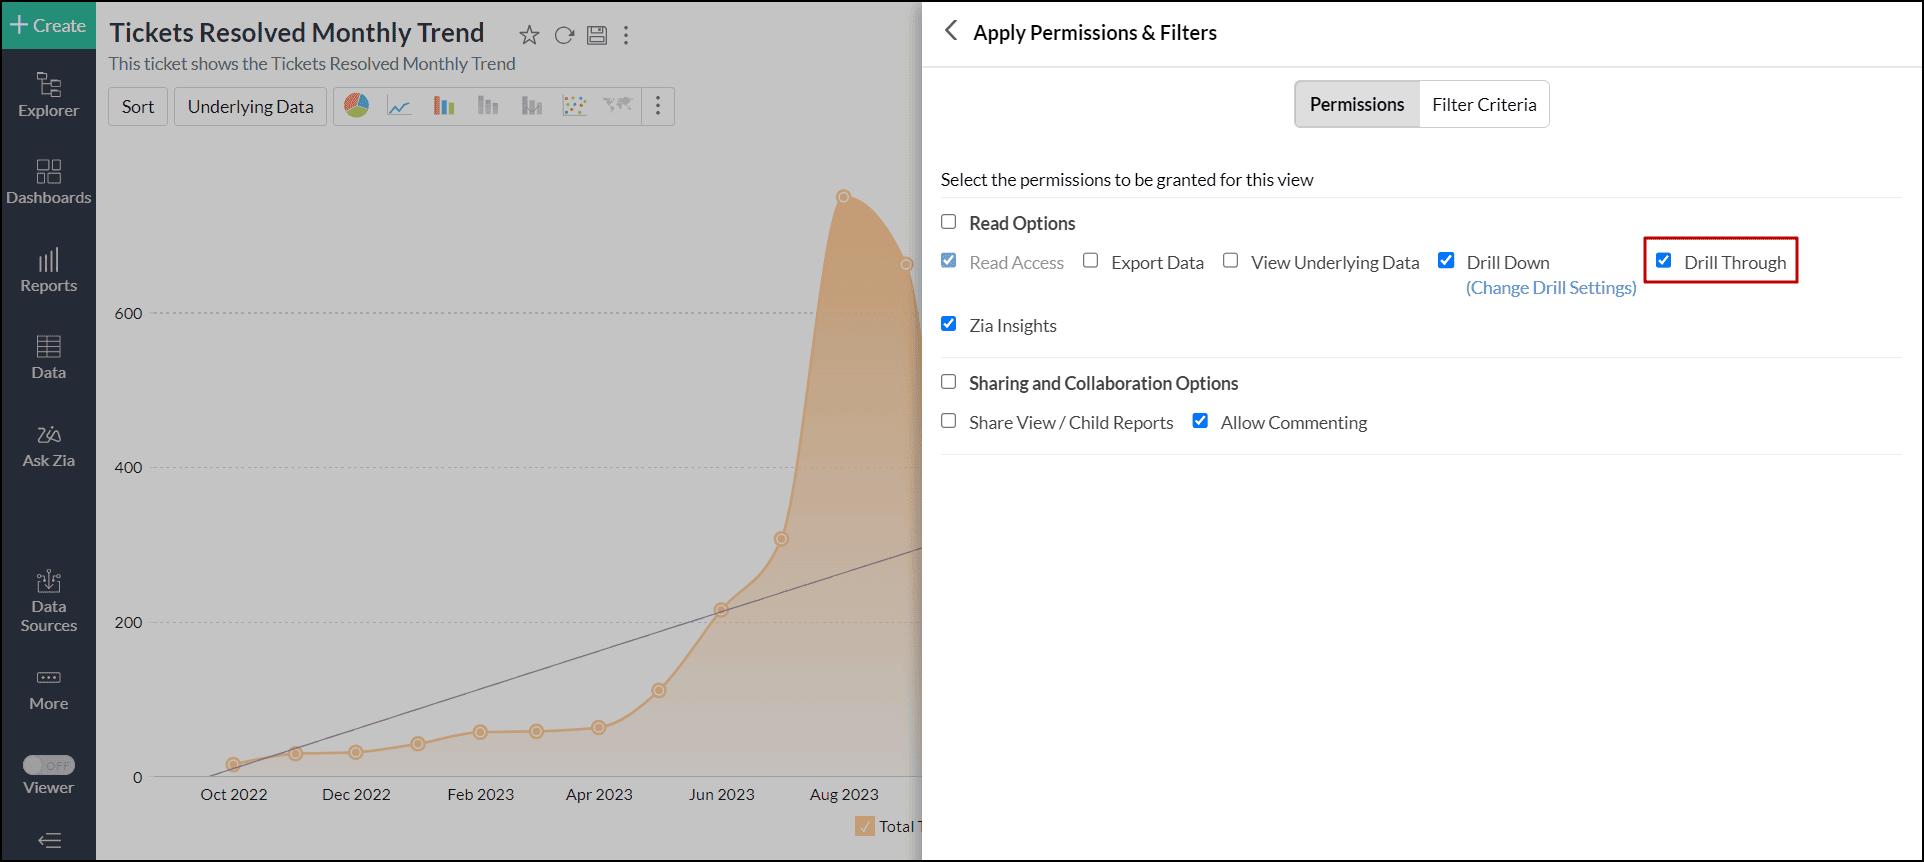
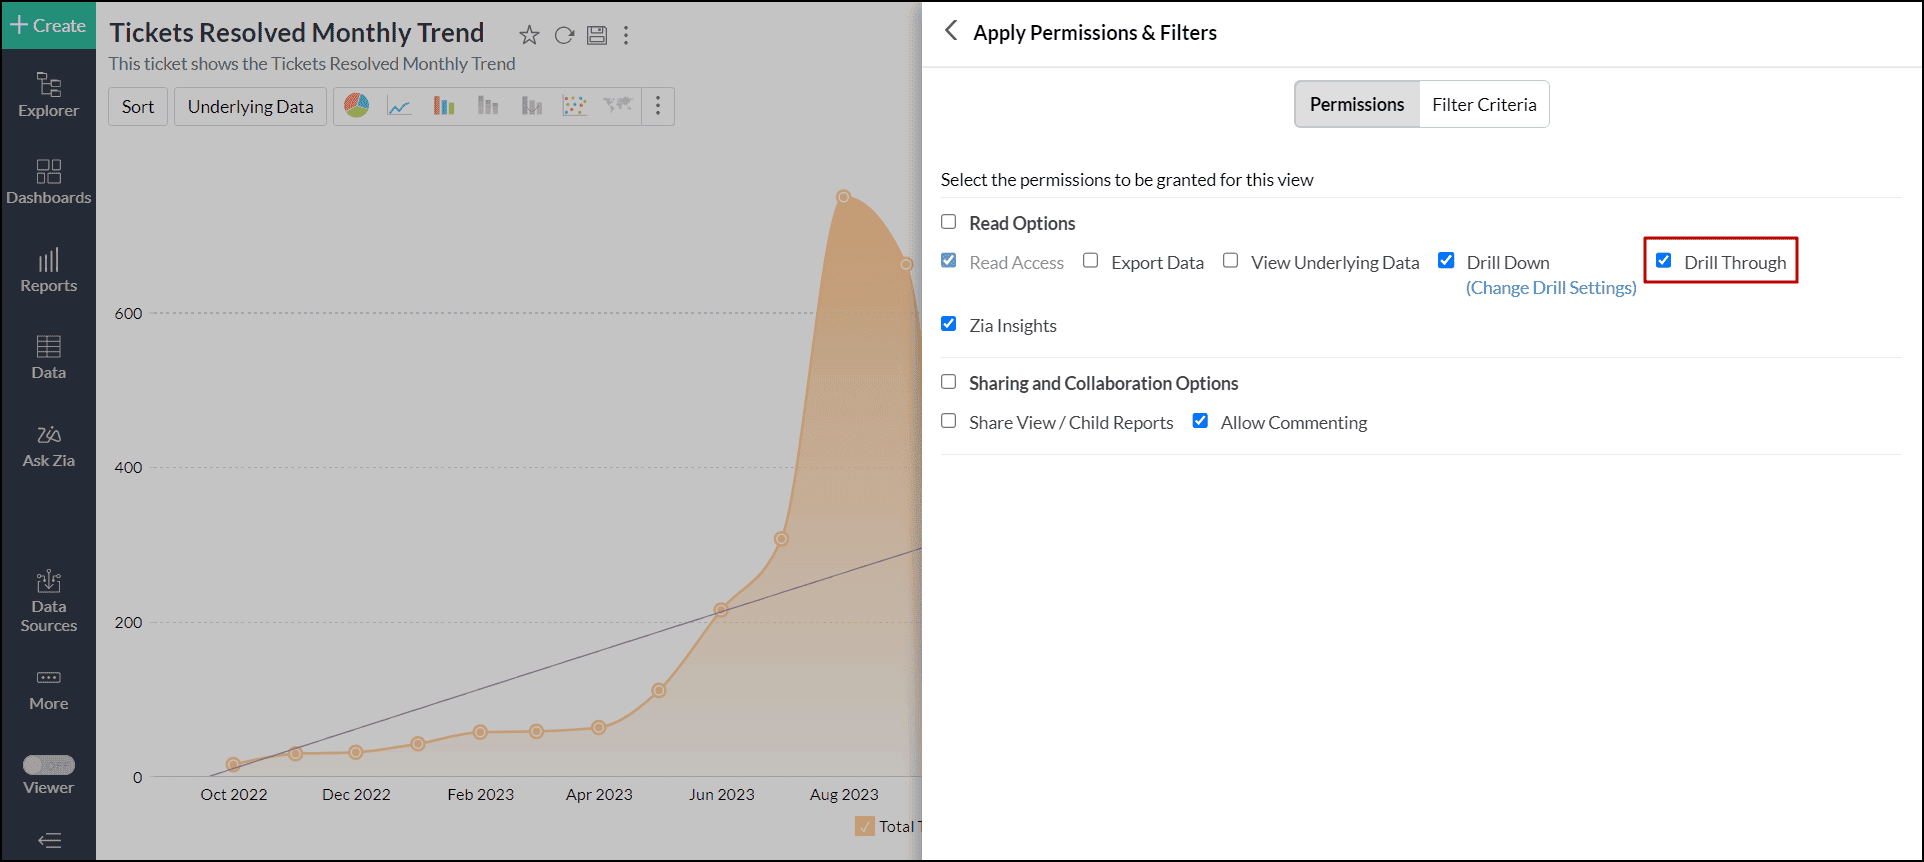
Equip users to drill through reports
EnhancementWhen sharing views, Analytics Plus lets report owners enable the Drill Through option, granting other users the ability to drill through to related views. Click here to learn more.
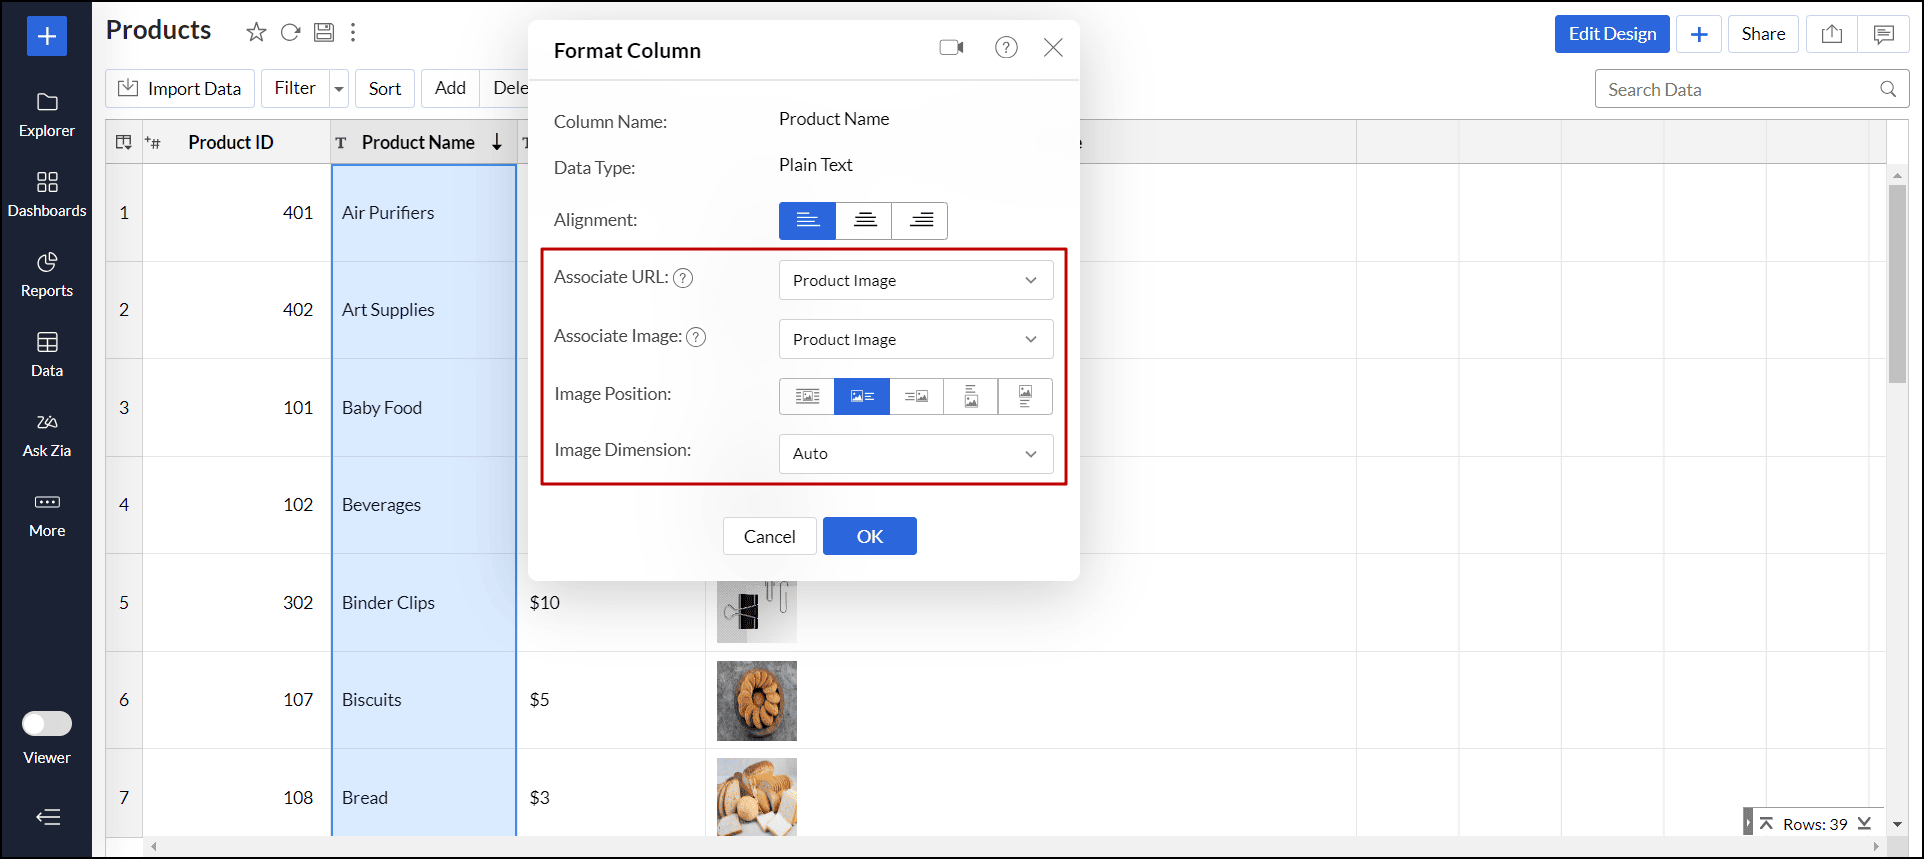
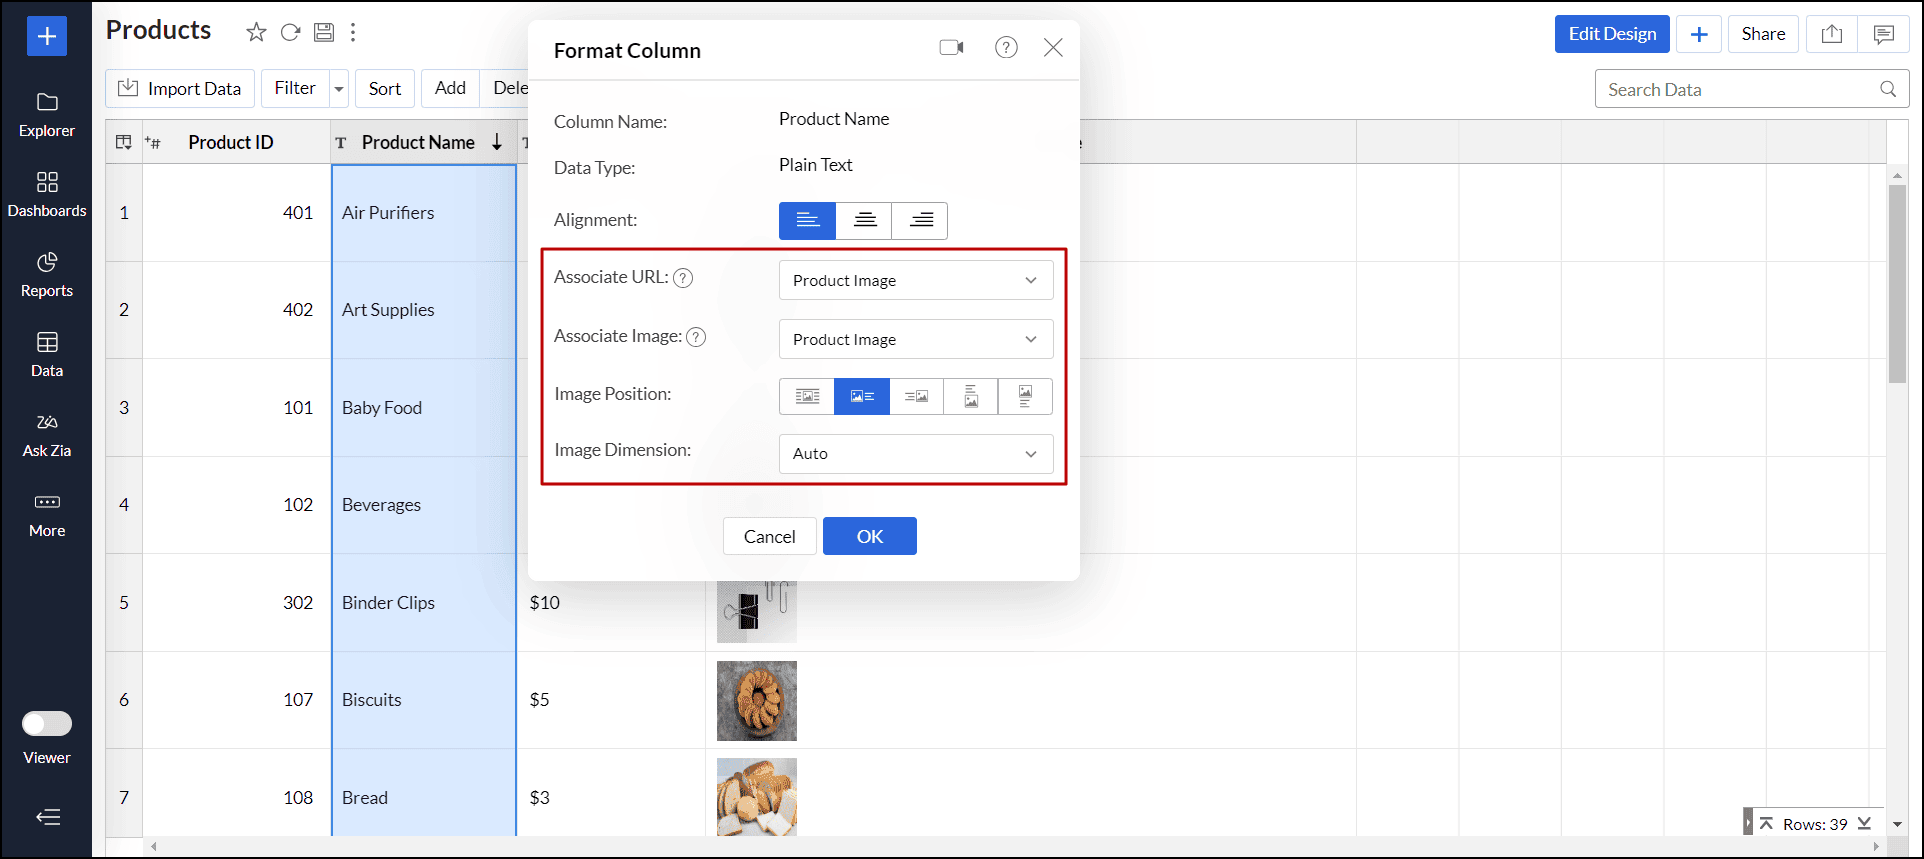
Associate Images / URLs in data tables
EnhancementYou can now include hyperlinks or images directly in your data tables.
Interactive chart customizations
EnhancementSee your charts update in real-time as you customize them with the new chart settings interface, now accessible in the right-side pane. Click here to learn more.
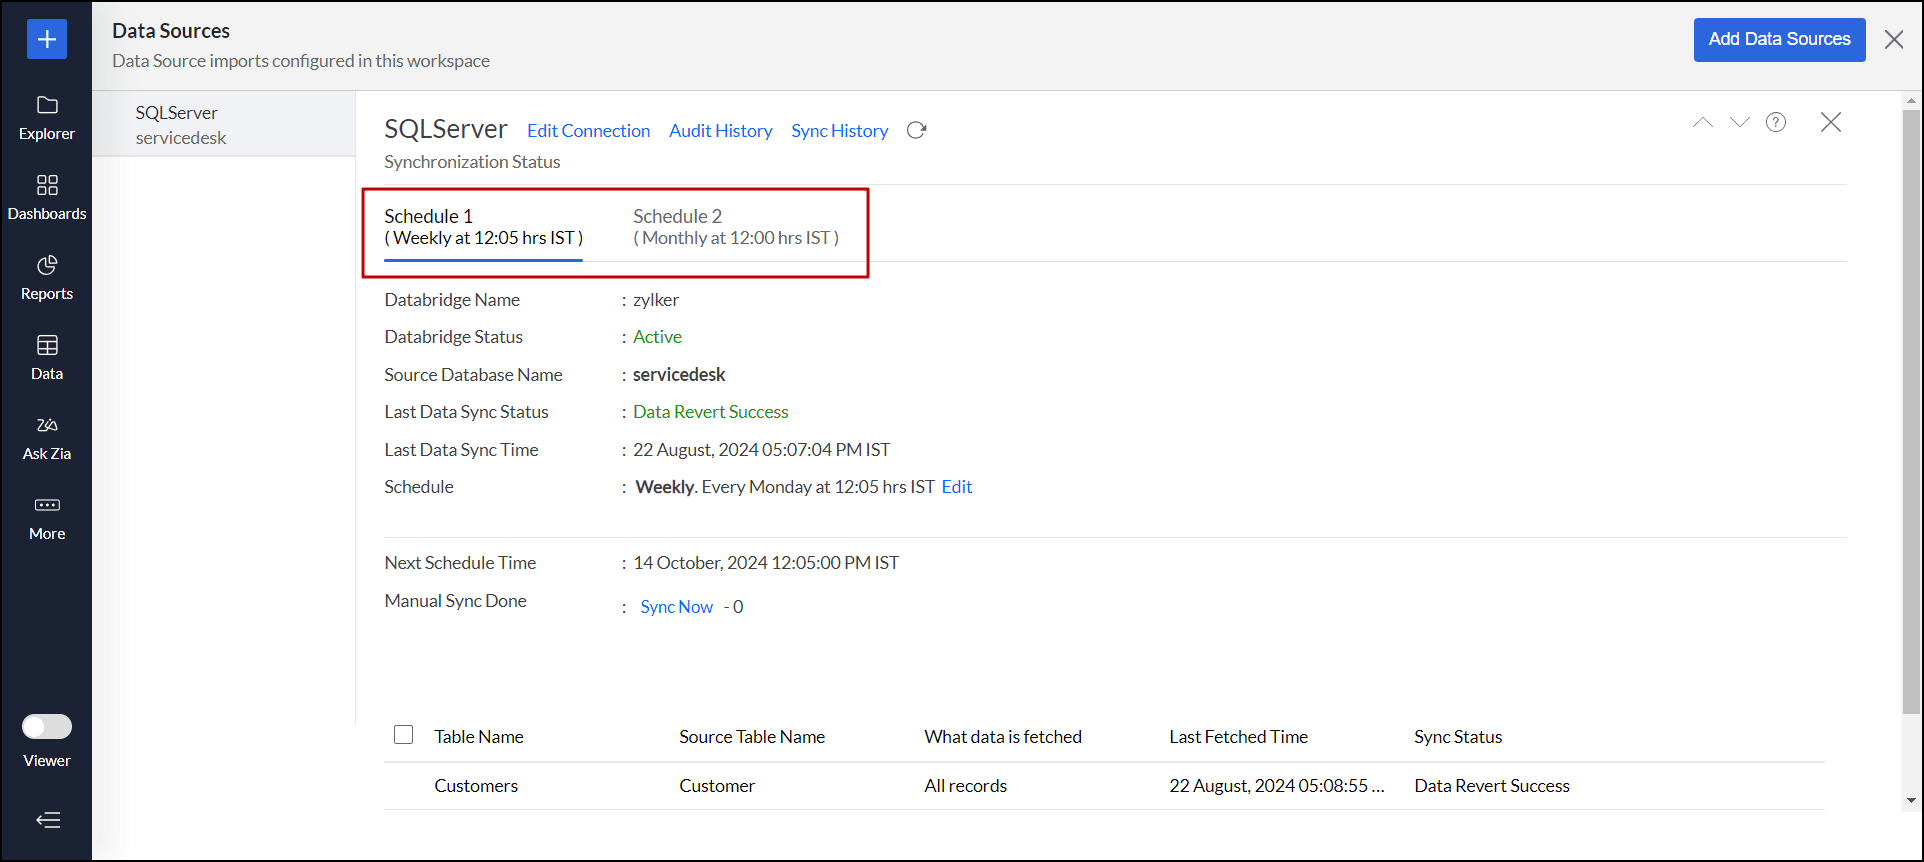
Individual sync schedules for application modules
EnhancementAnalytics Plus allows you to set different sync intervals for each module or table imported from the same application or data source. Click here to learn more.
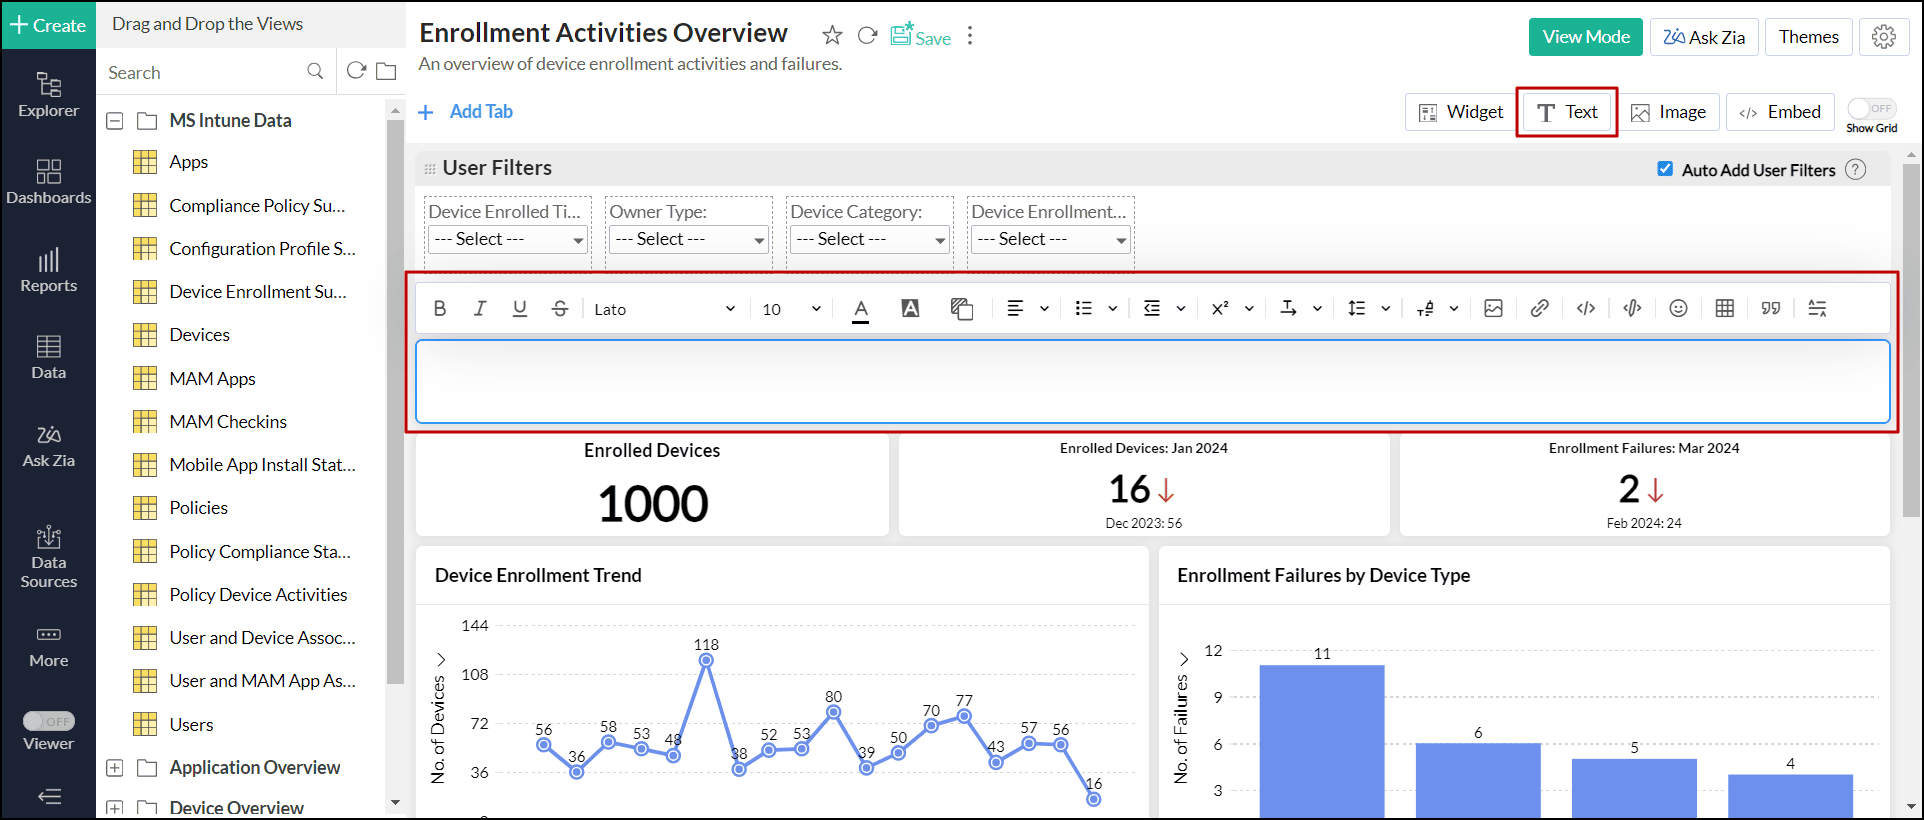
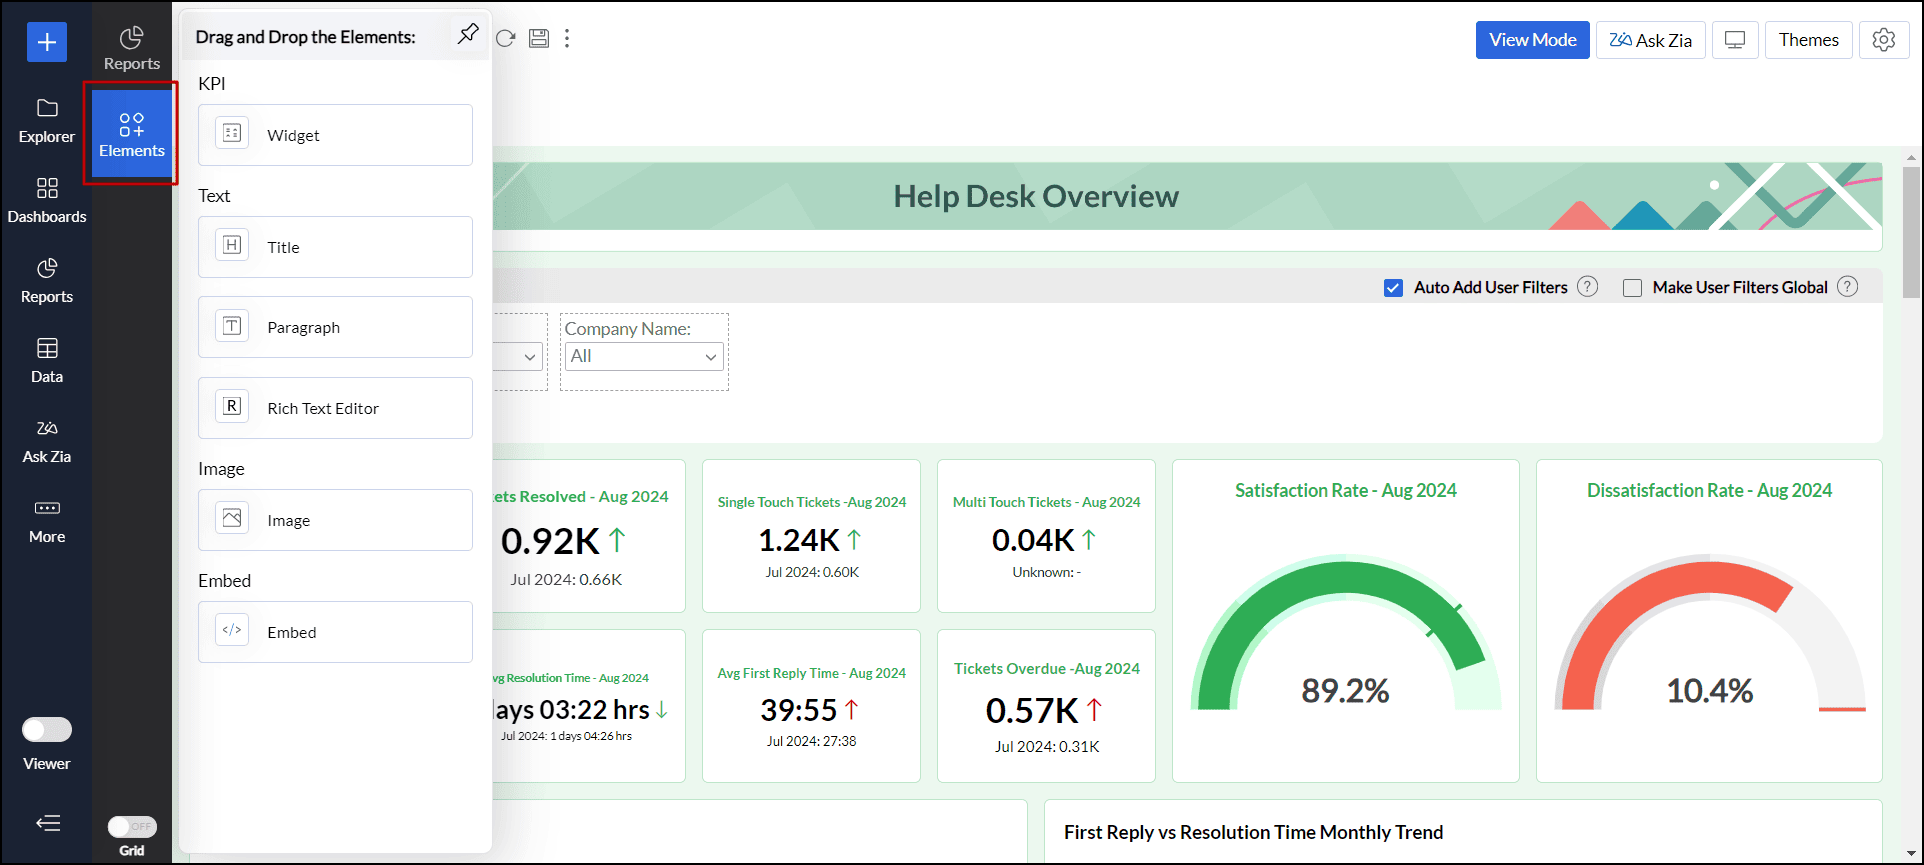
Dashboard advancements
EnhancementEnhanced user interface
The dashboard designer now includes an Add Elements section that allows for easy incorporation of widgets, text, images, and embedded URLs through a simple drag-and-drop interface, enhancing your dashboard in no time. Click here to learn more.
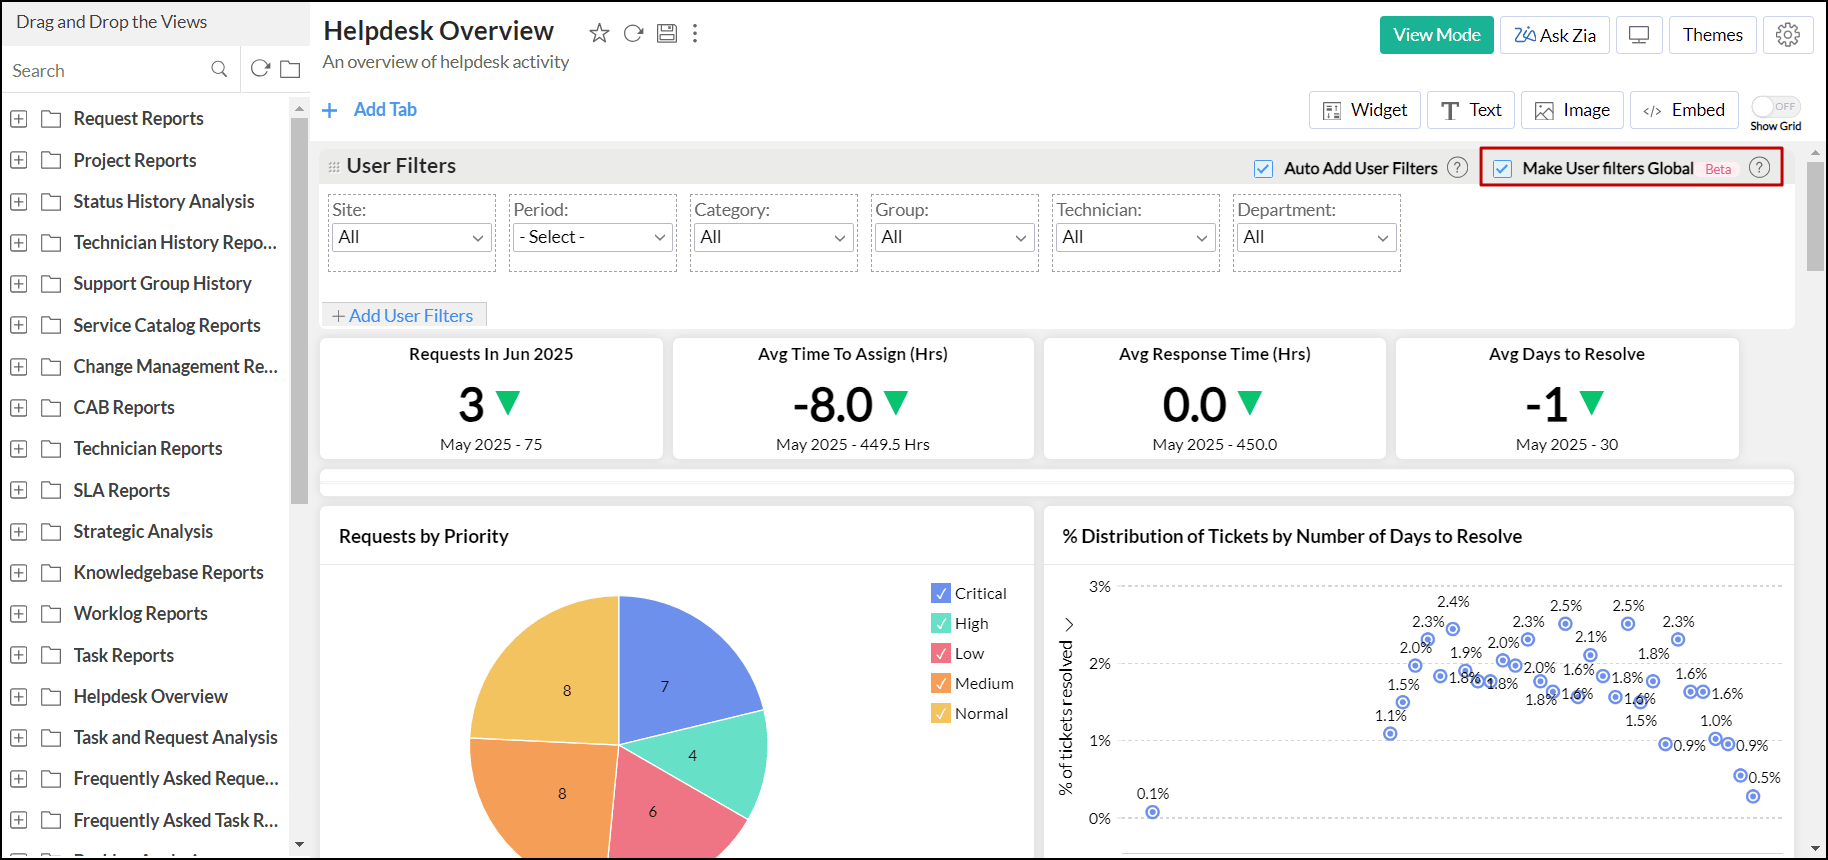
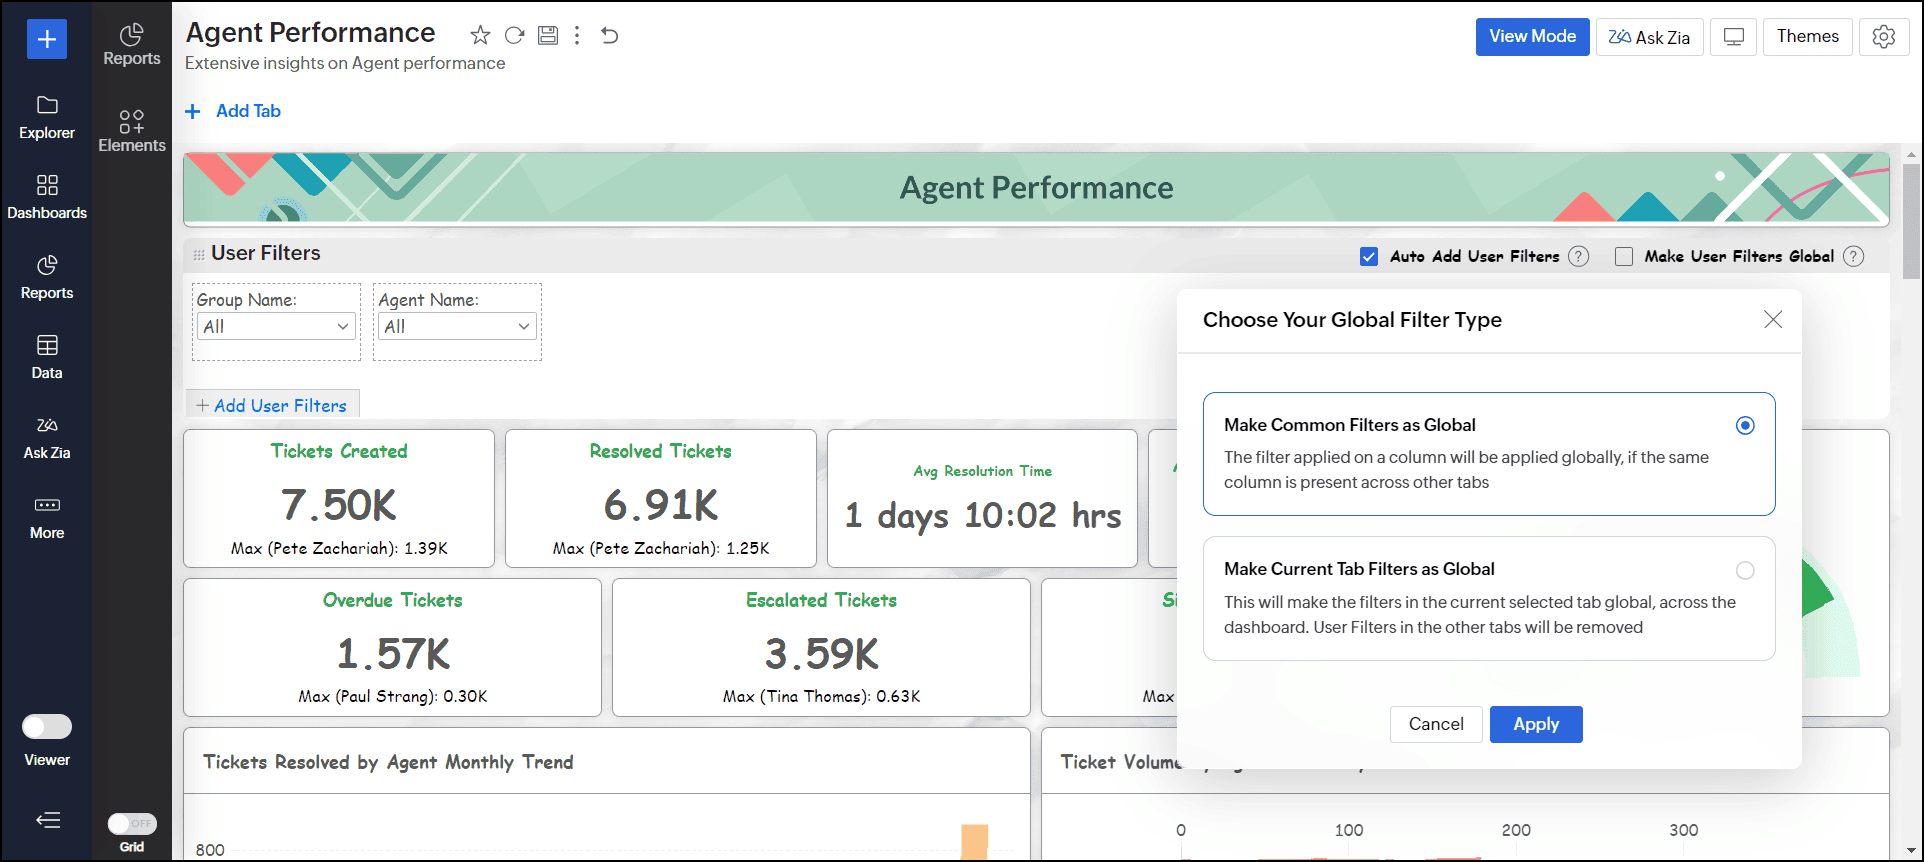
With the latest enhancement, you can now choose to set up global user filters, selecting either the filters that are common across tabs or filters of the selected dashboard tab. Click here to learn more.
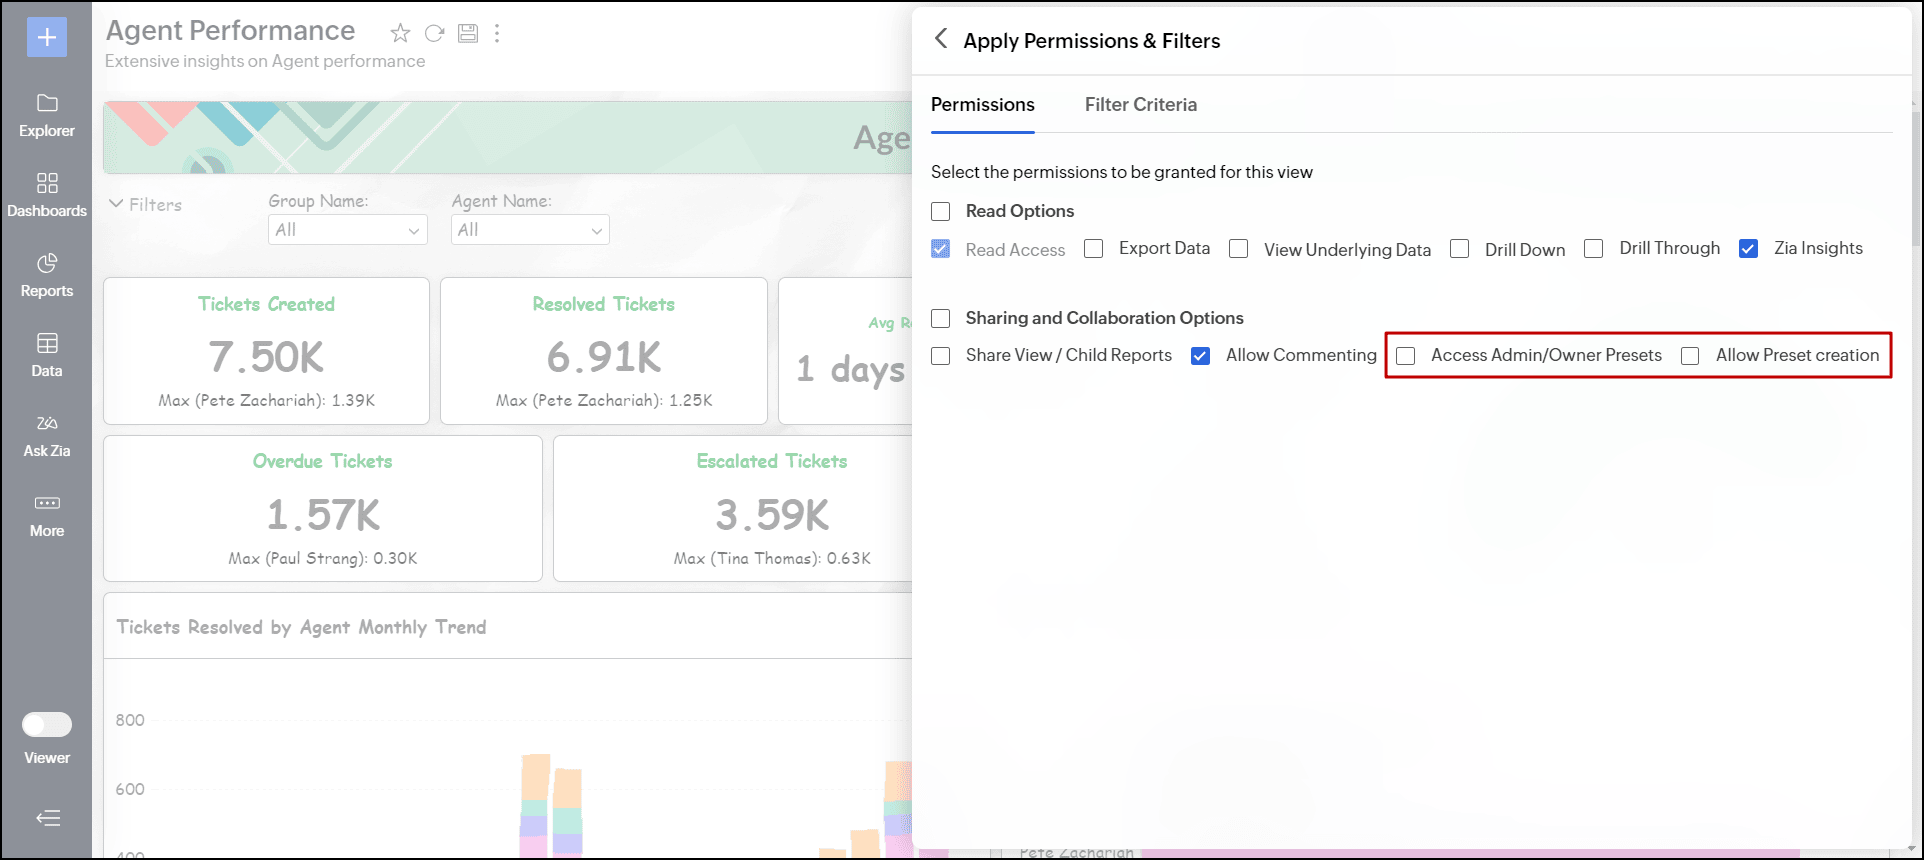
When views are shared, the view owners can enable users to apply existing presets or grant them the ability to create their own custom presets.

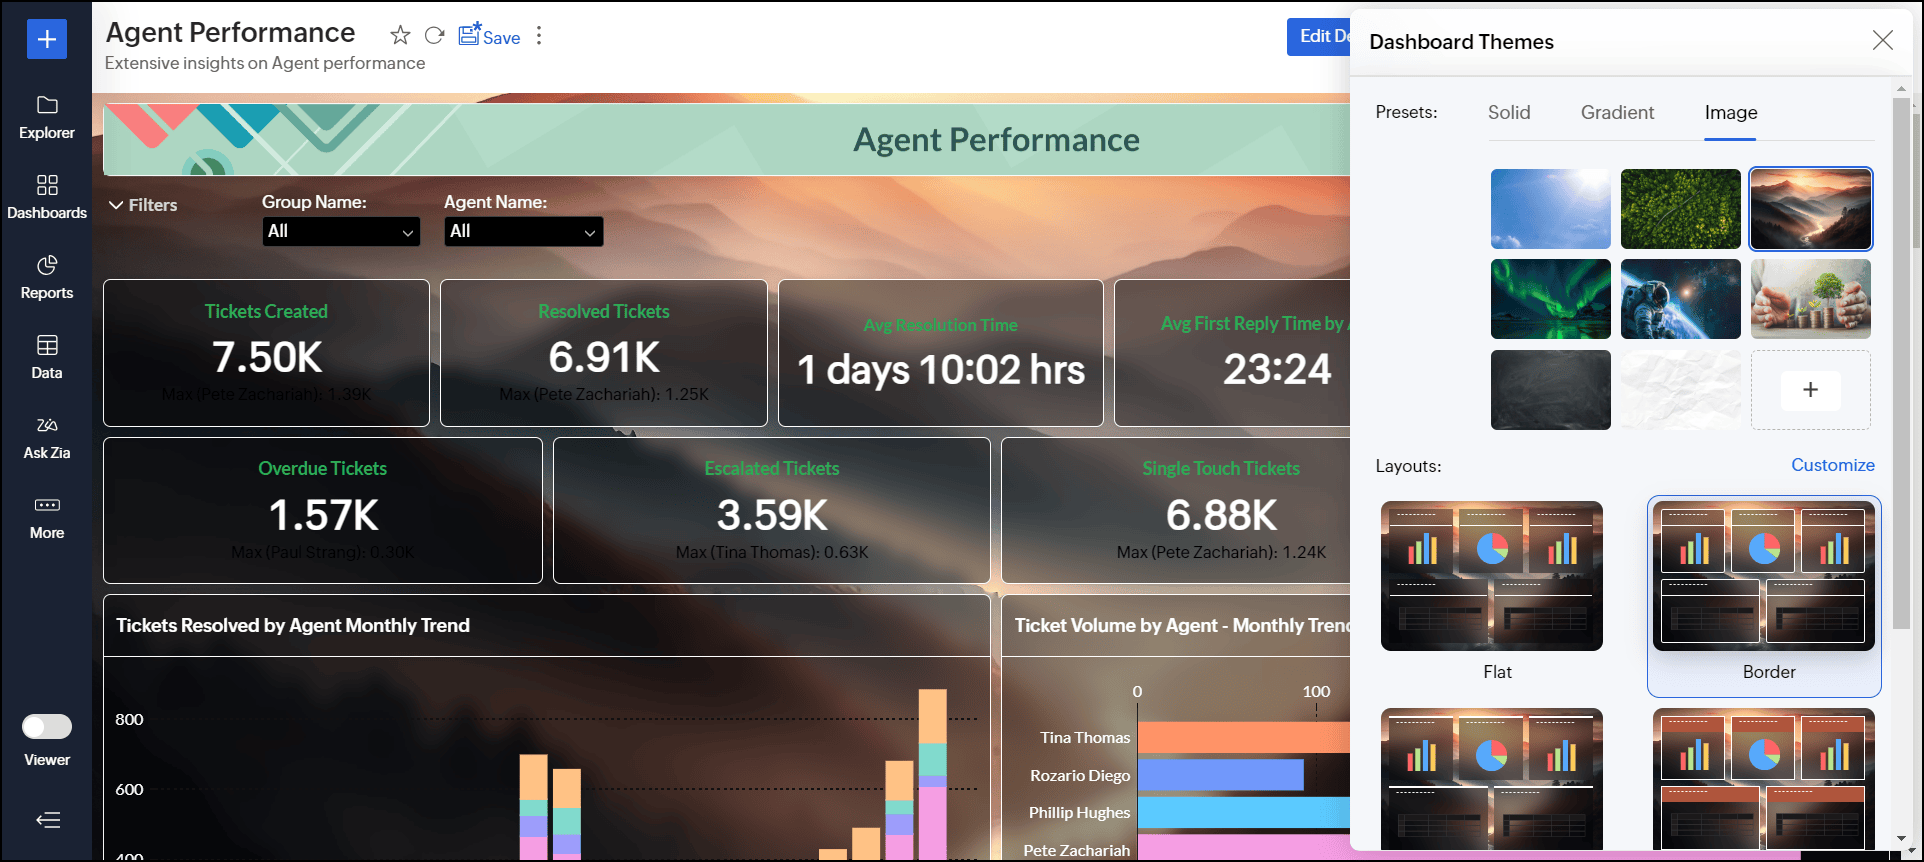
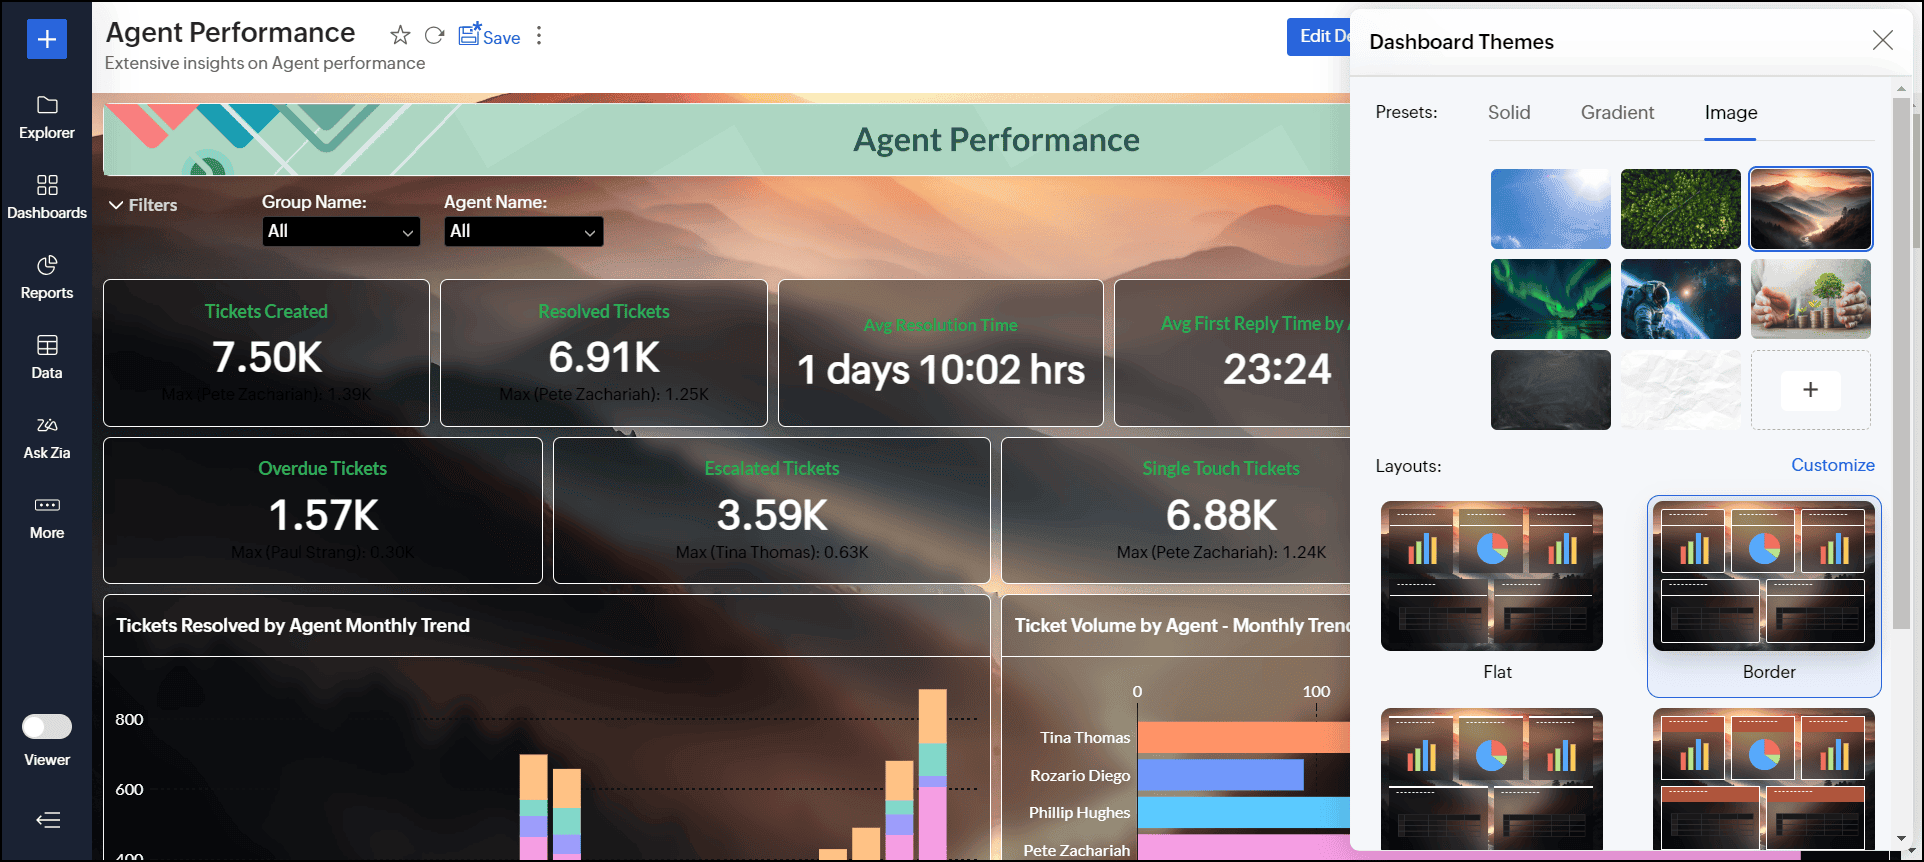
Design eye-catching dashboards using our new themes and background card effects. Showcase reports on transparent cards against vibrant images and enjoy extensive customization options that boost visual appeal and clarity.
Important update on OpManager Integration
EnhancementTo set up a new OpManager integration or ensure the existing one continues to function in Analytics Plus, users must have OpManager Manager build 126000 or later.
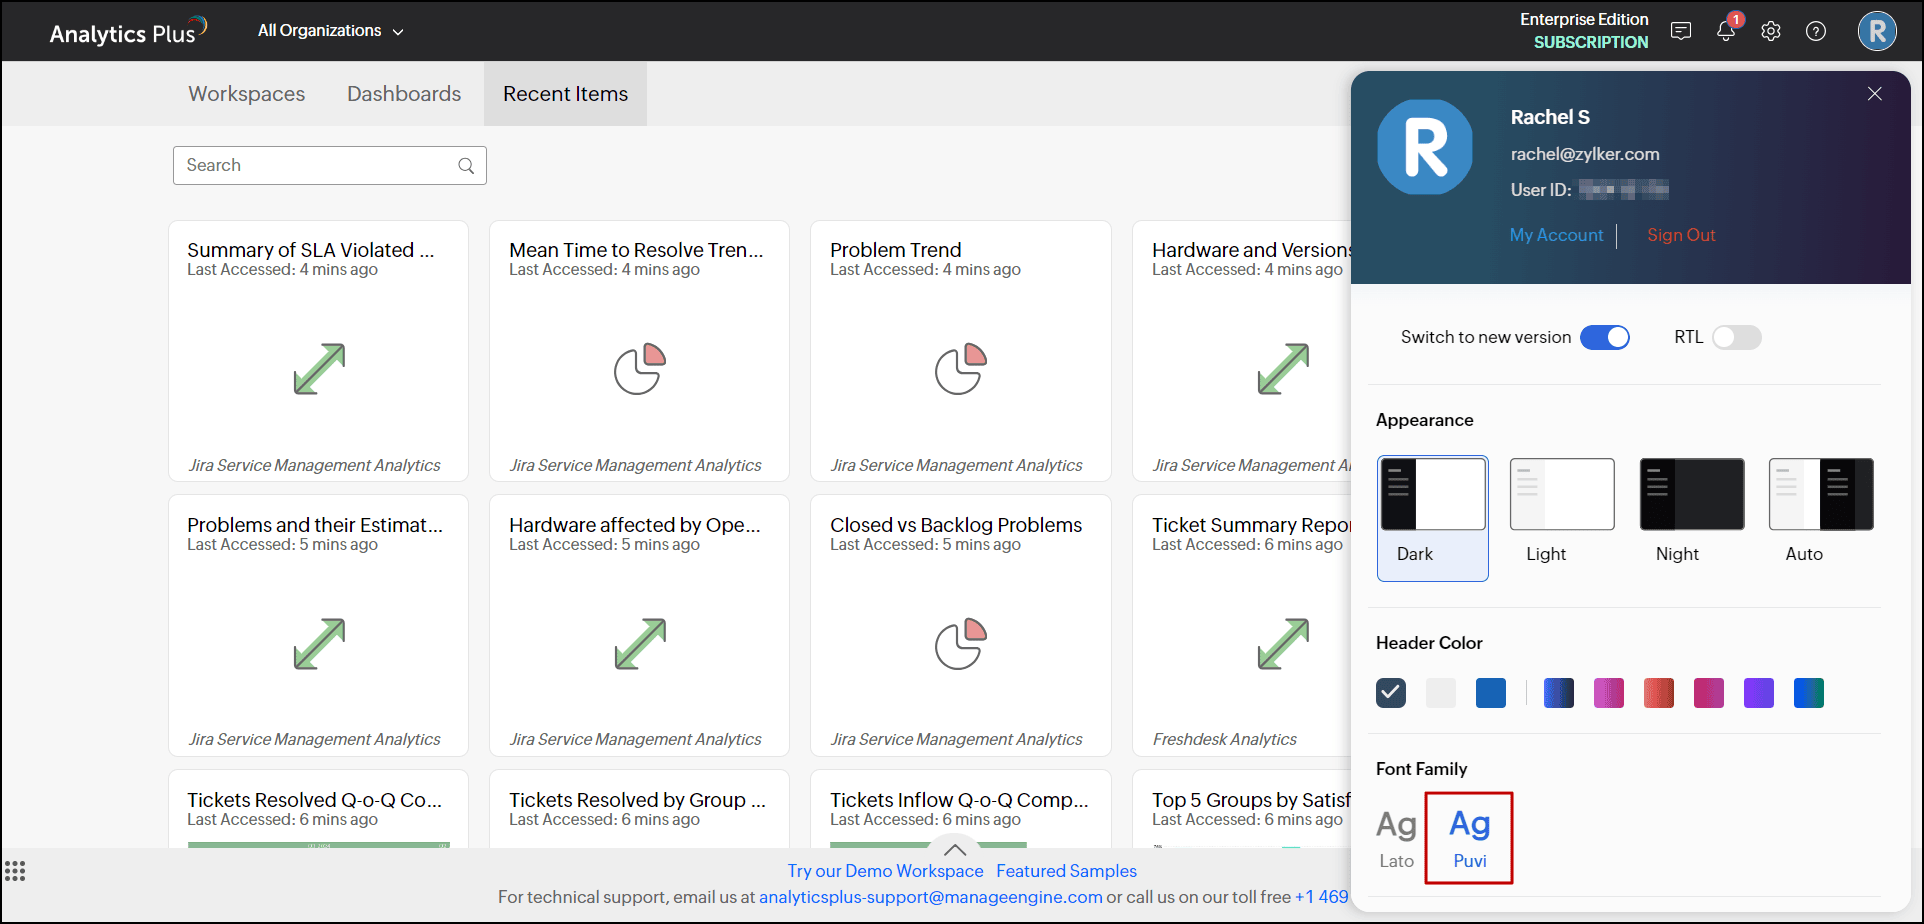
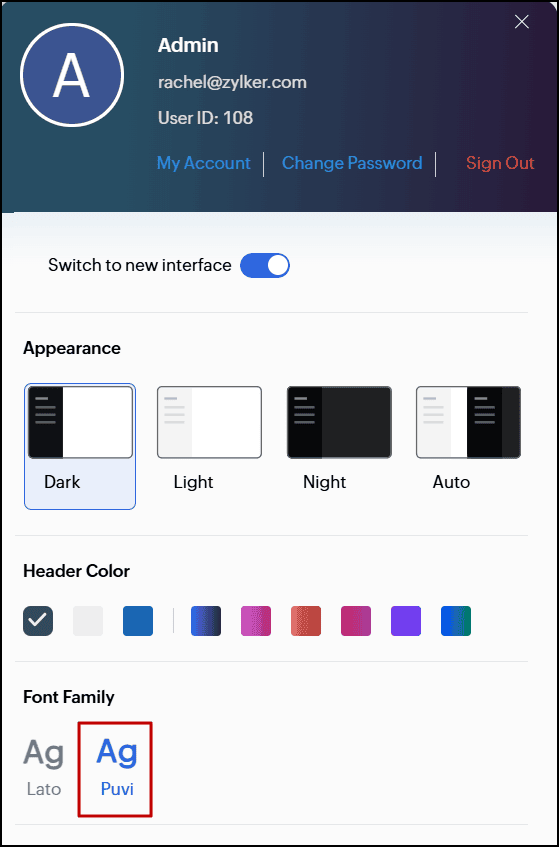
Puvi Font Support
EnhancementAnalytics Plus now supports Zoho's font, Puvi. You can try this new font from the Profile tab.
Issues fixed
Issues fixedA critical Sensitive Data Exposure vulnerability (CVE-2024-52323) that could lead to privilege escalation has been addressed in this release. This issue could allow authorized users (such as managers or viewers) to access sensitive tokens and perform actions typically reserved for administrators. Click here to learn more.
Sep
Build Number: 6000 (Release on: September 23, 2024)
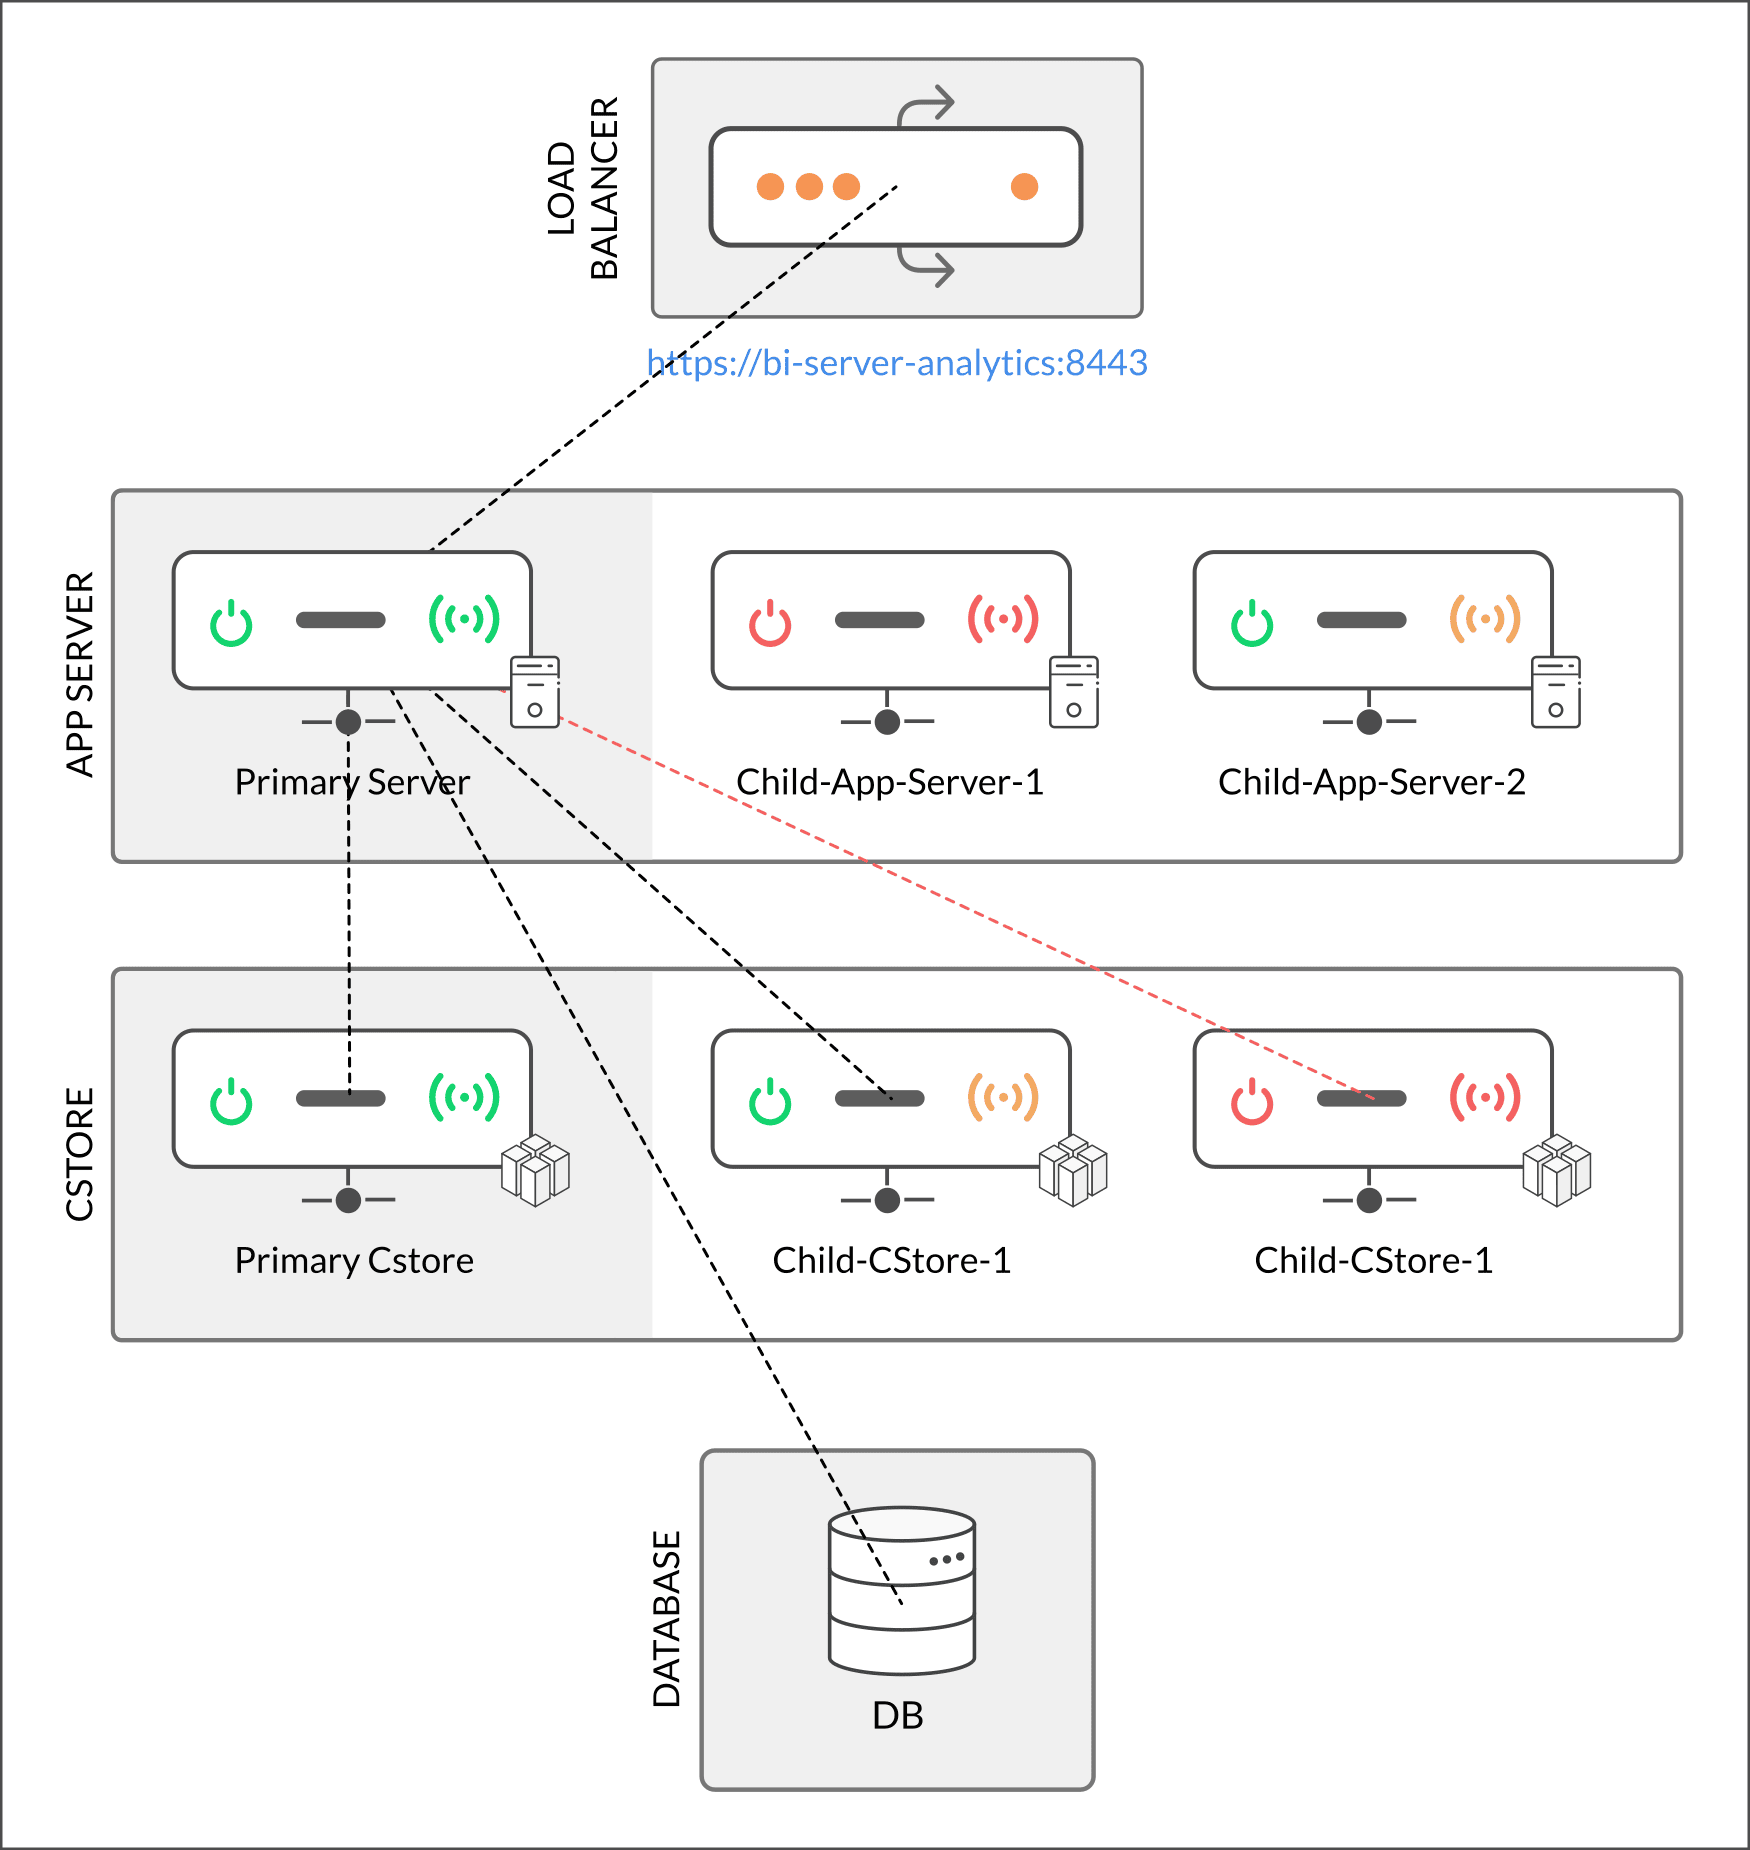
Unveiling Multi-server architecture
NewIntroducing distributed architecture in Analytics Plus to handle highly intensive data processing needs at enterprise scale. This configuration allows for load distribution across several servers, thereby boosting performance, reliability, and scalability. Click here to learn more.
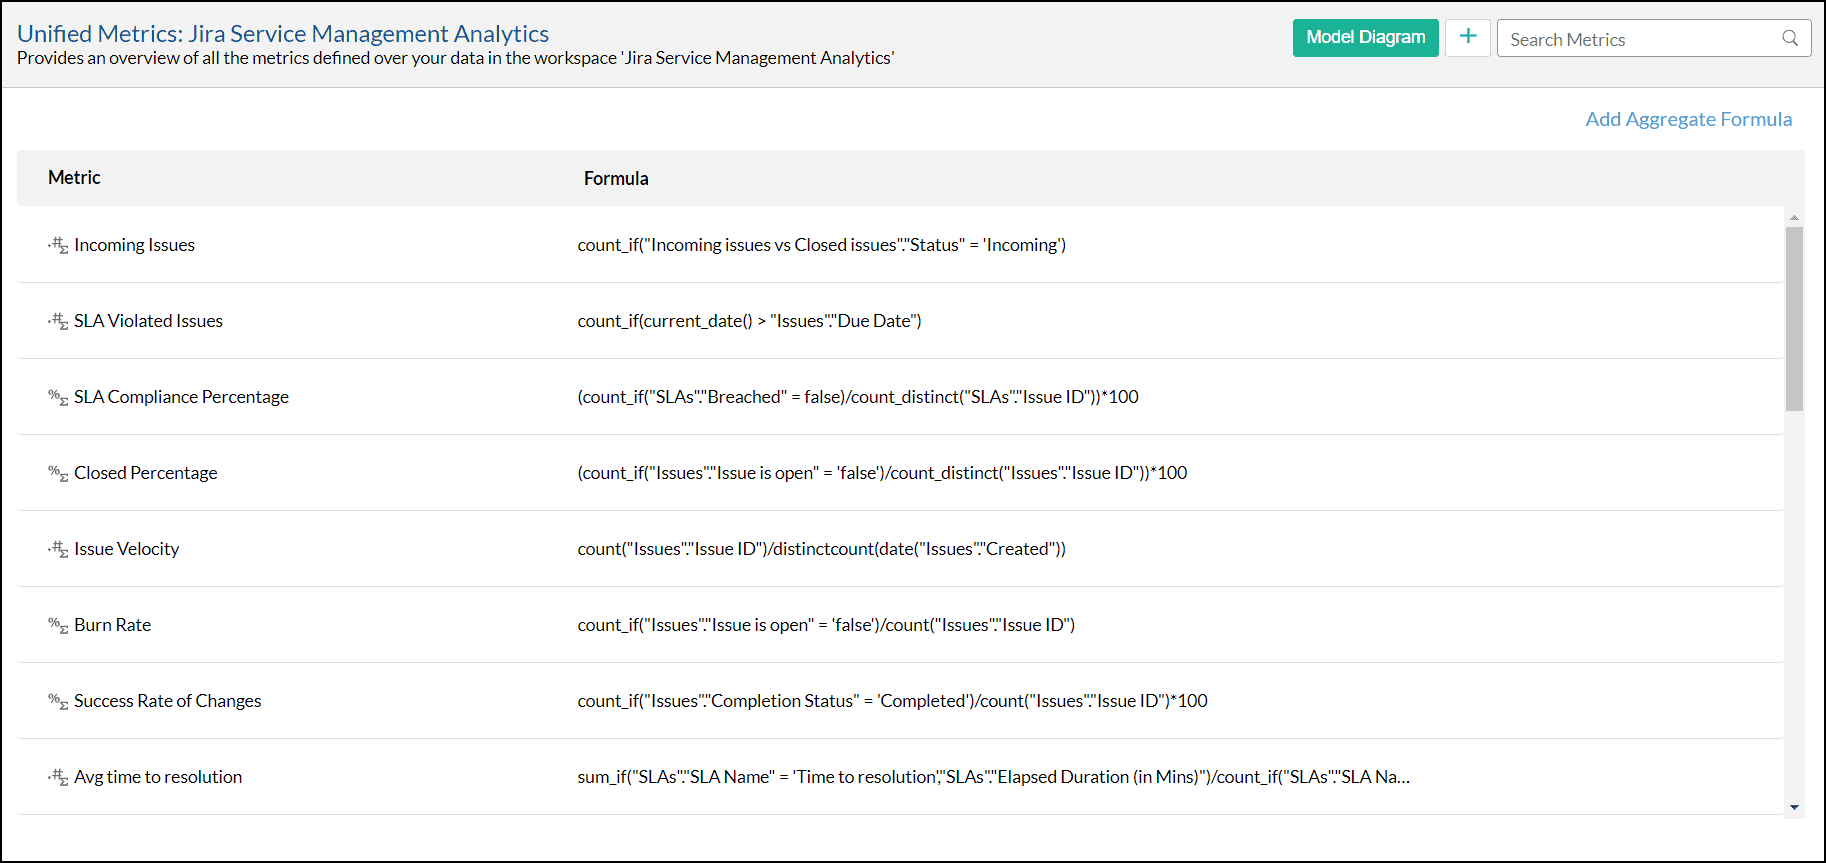
Introducing Unified Metrics
NewUnified Metrics in Analytics Plus, a single interface to manage all KPIs within a workspace. This serves as the single directory for all IT metrics by allowing users to search for KPIs of interest. Click here to learn more.
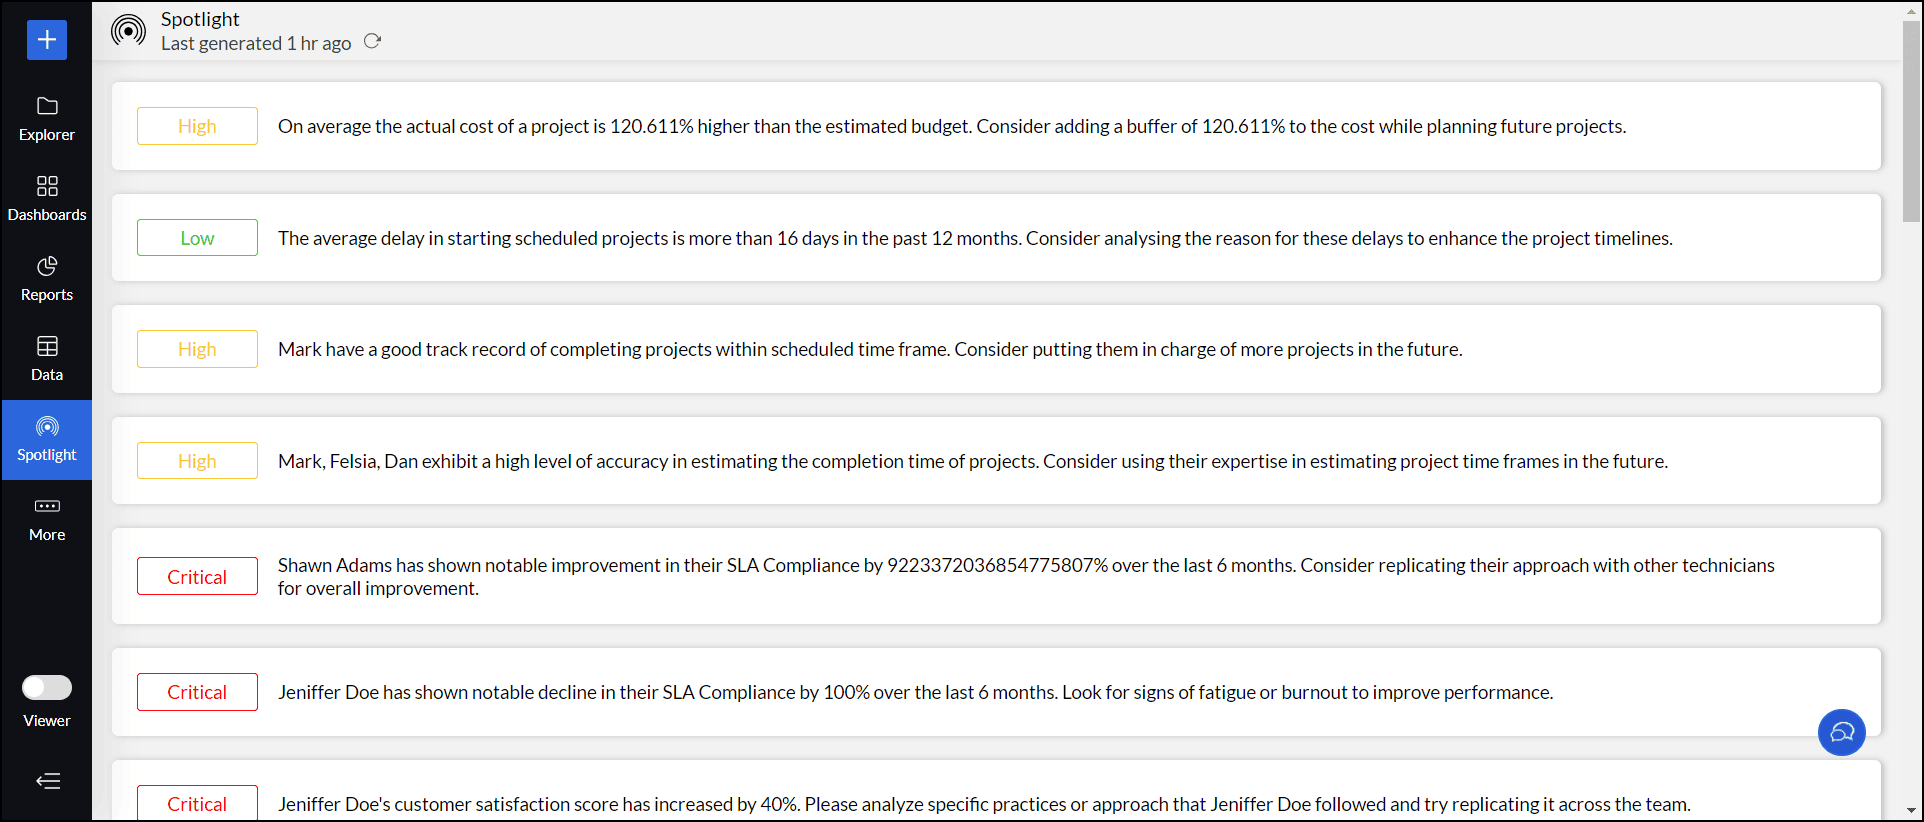
Advancements to Ask Zia
NewAsk Zia Insights now delivers visual narratives! It automatically identifies key trends from your data and delivers quick, visual summaries of relevant KPIs. This new feature complements the existing text-based summaries, giving you a more comprehensive view of your insights. Click here to learn more.
Chart suggestions by Ask Zia
NewIntroducing Zia Suggestions in charts, providing insightful chart recommendations when creating charts. Zia generates a variety of auto-generated charts tailored to your data, which you can easily preview and apply with just a click. Click here to learn more.

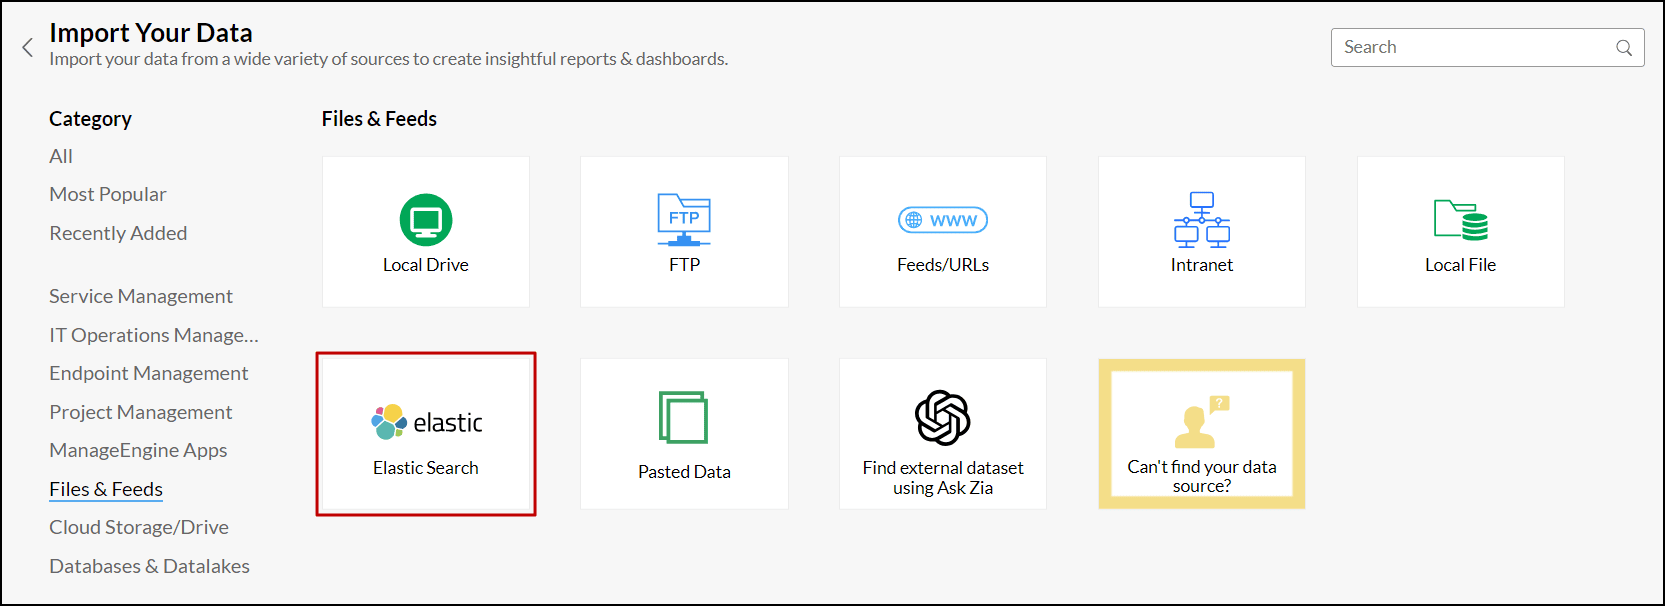
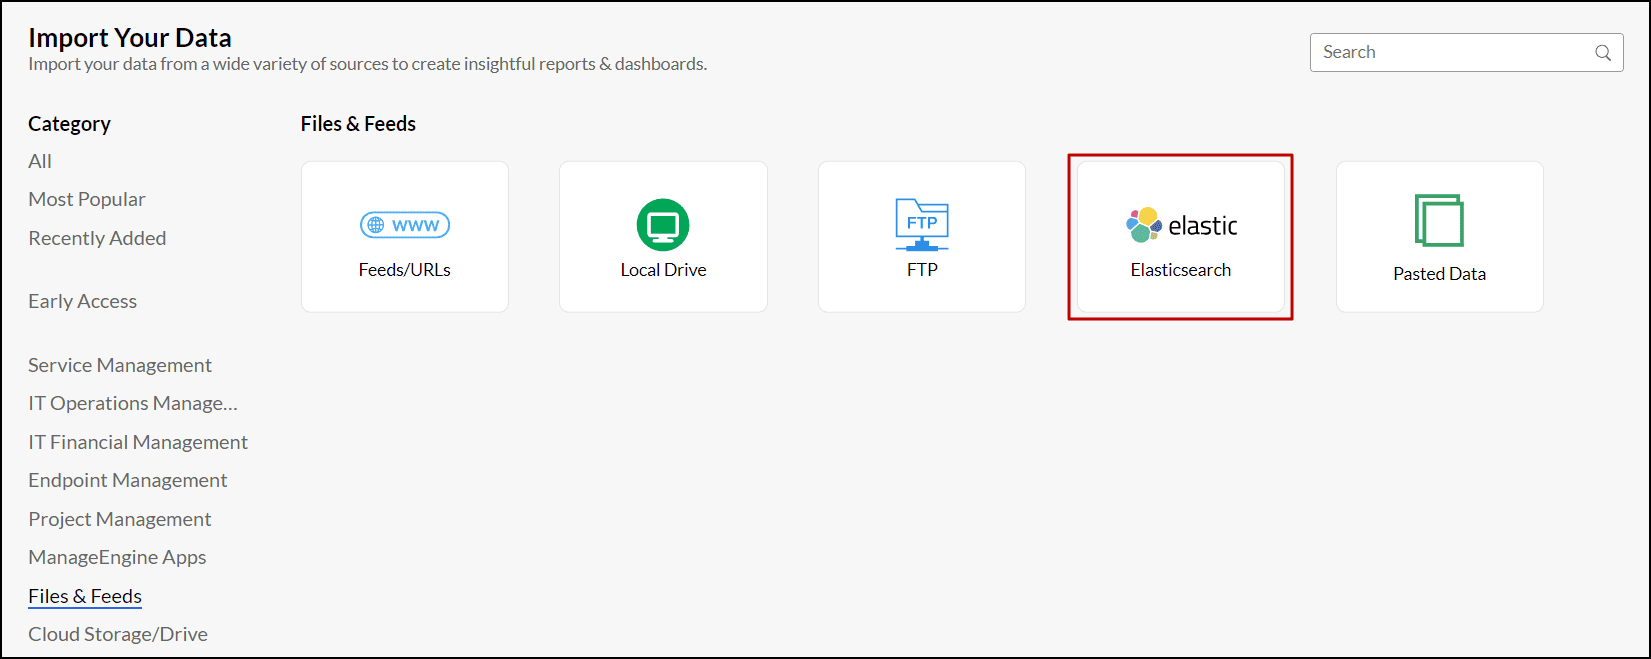
Import data from Elasticsearch
NewYou can now seamlessly import your Elasticsearch data into Analytics Plus, enabling in-depth analysis, dynamic report generation, and actionable insights from your log data. Click here to learn more.
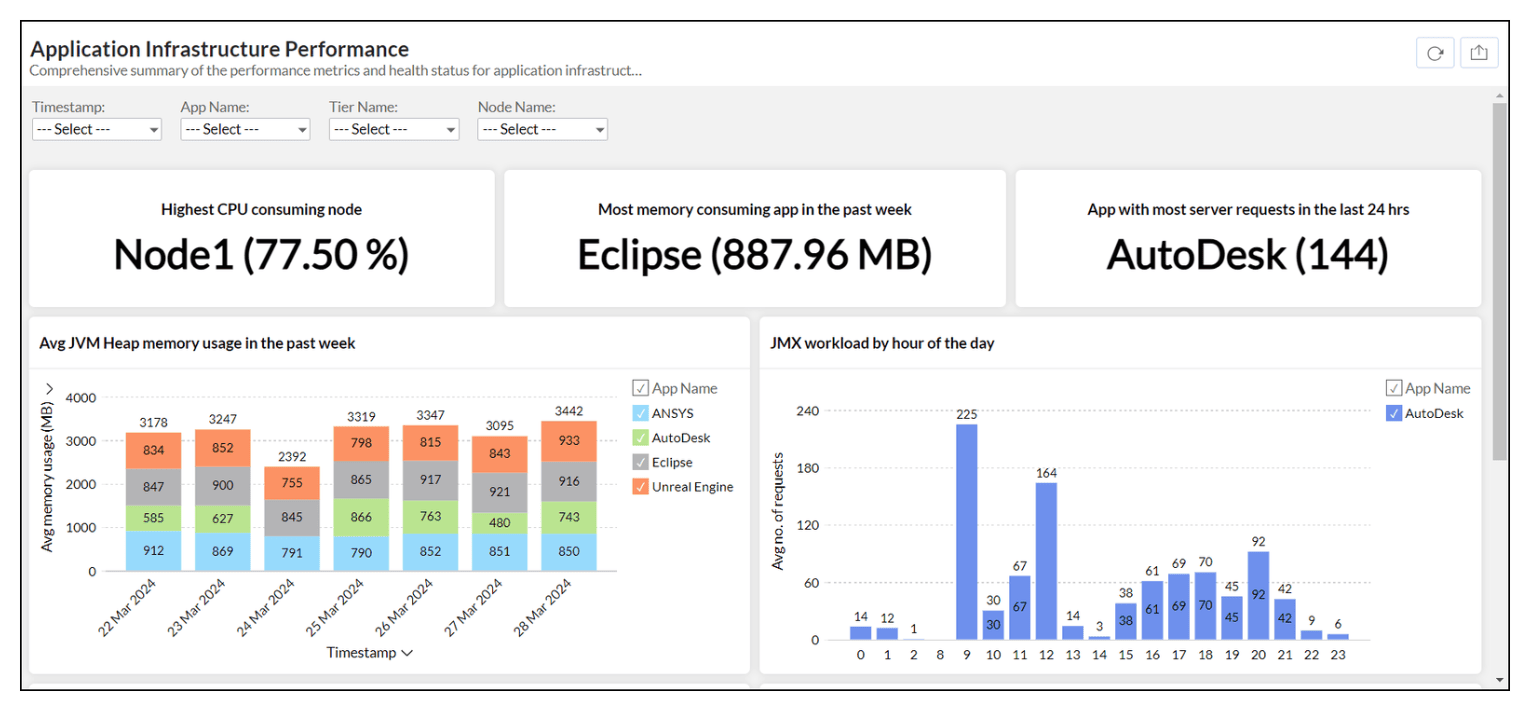
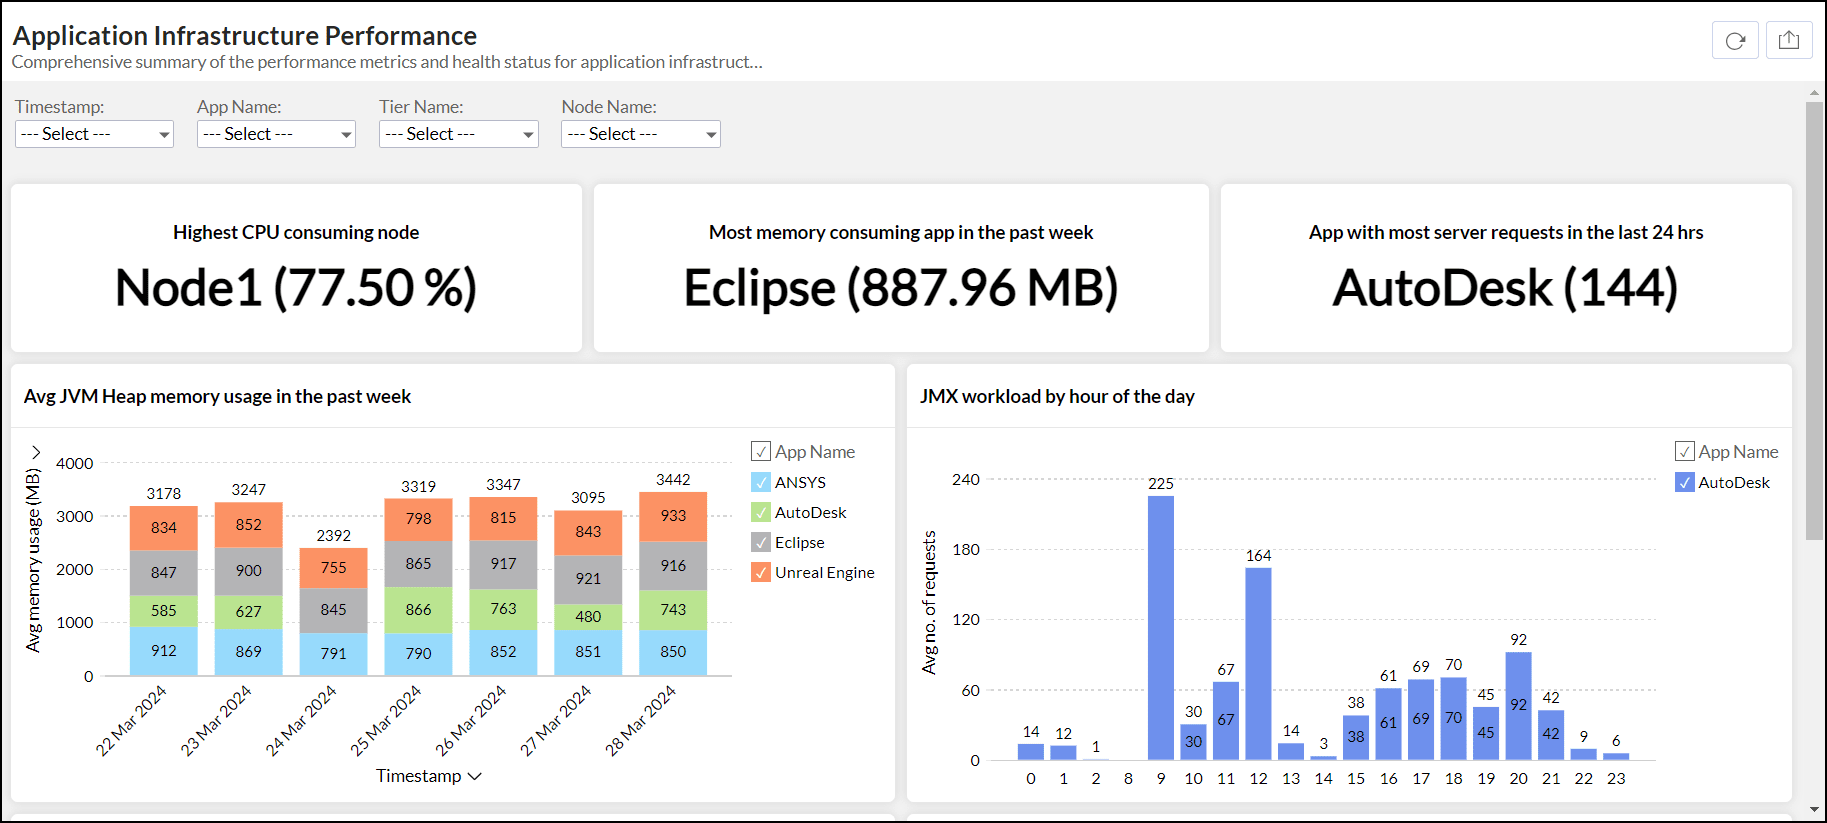
Introducing out-of-box analytics for Datadog
NewAdvanced analytics for Datadog provides deeper insights into your application and infrastructure performance. You can easily identify trends and patterns in your data to catch anomalies before they impact infrastructure performance. Click here to learn more.
Import data from more local databases
NewAnalytics Plus now lets you import data from the following local databases:
- Yellowbrick
- Clickhouse
- Dremio
- Druid
- Neo4j
- Trino
- Presto
- Databricks
Refreshed user interface
NewAnalytics Plus' user interface just got refreshed! Effortlessly switch between the refreshed look and the old view with these exciting updates. The new user interface includes:
- Fresh color scheme
- New Light theme
- Confirmation buttons are now conveniently highlighted
- Revamped icons
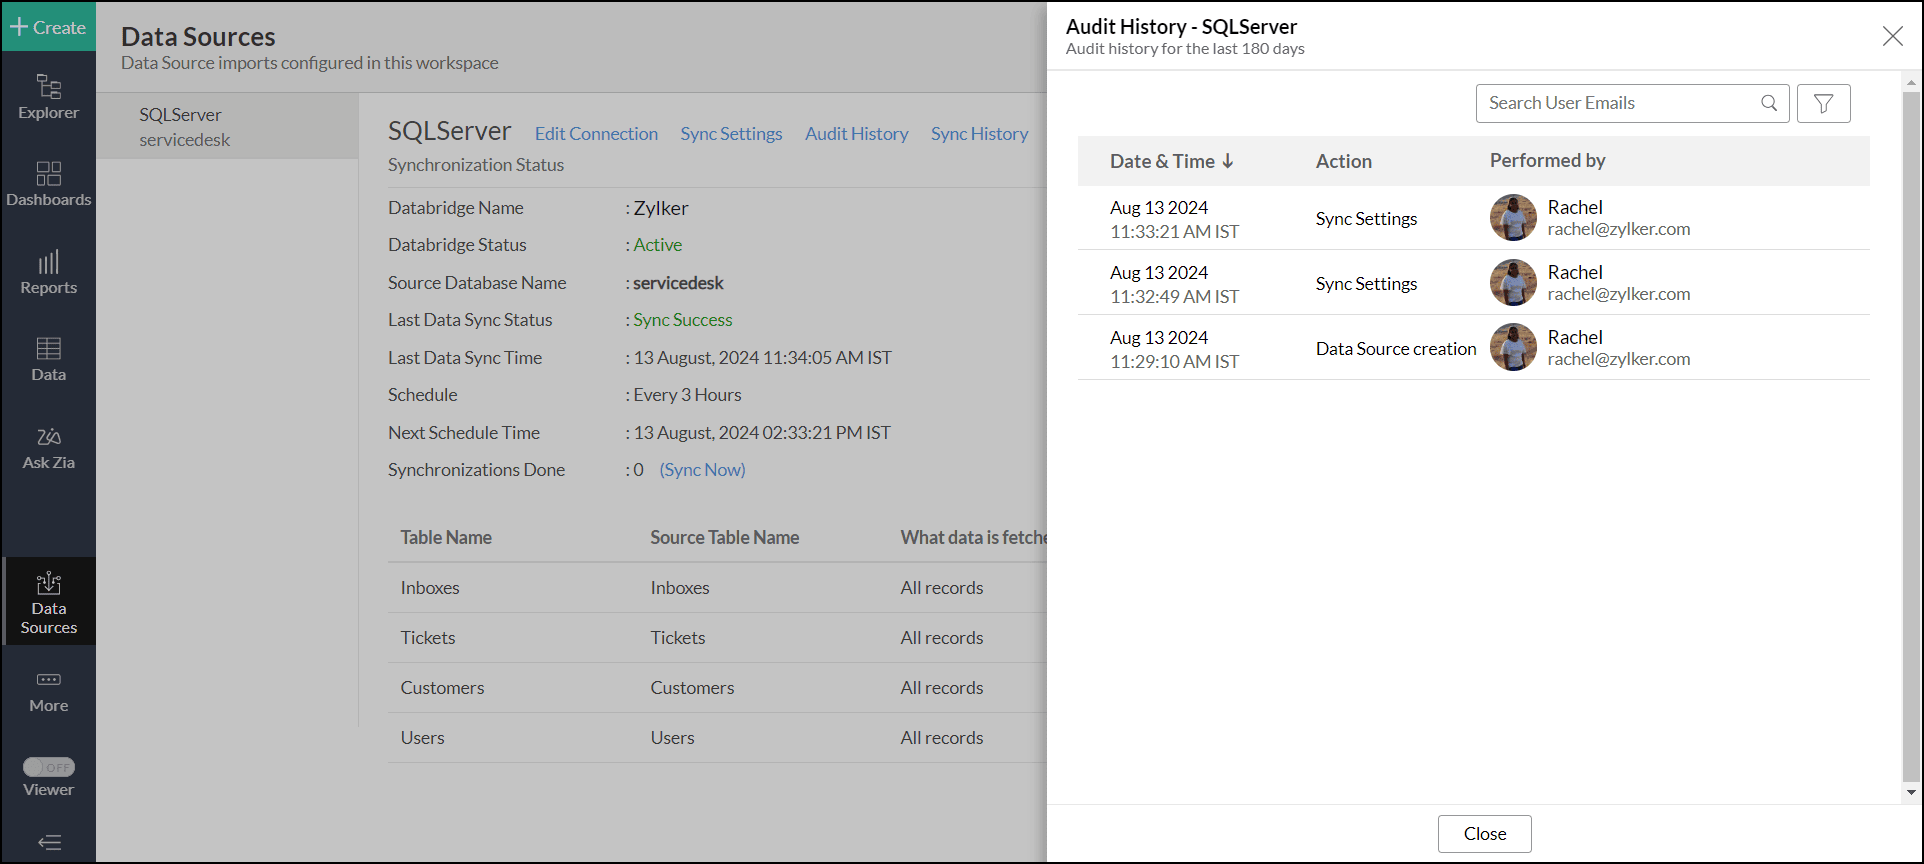
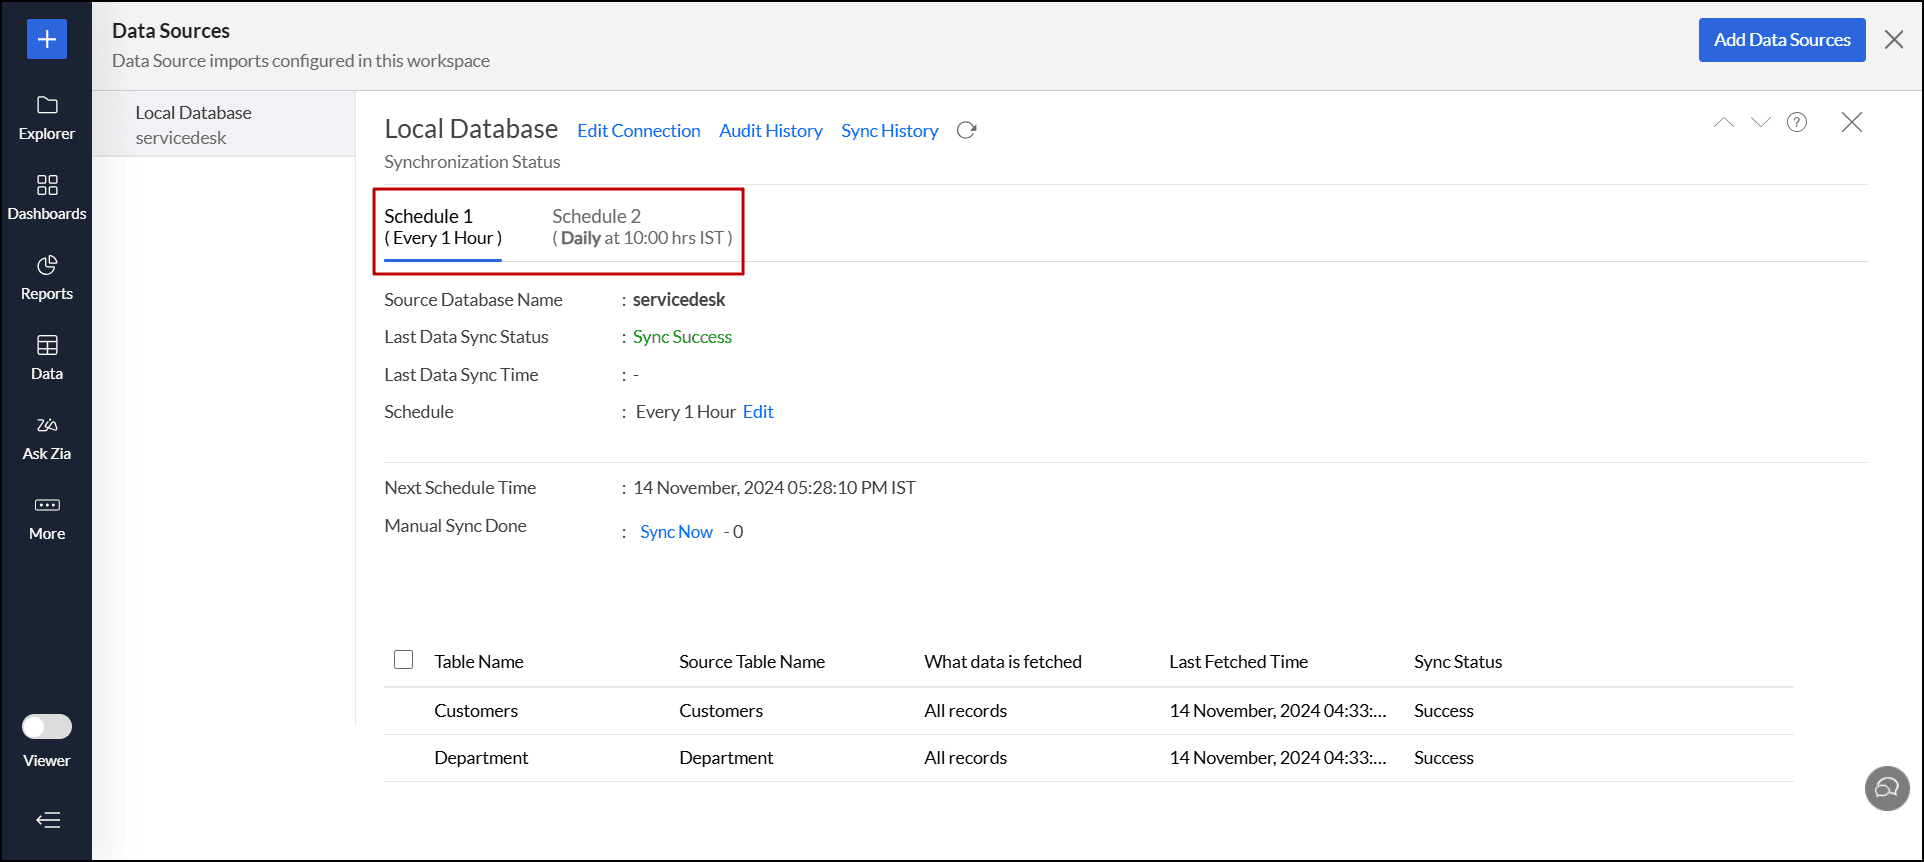
Rolling out audit, sync history & rollback features for data import
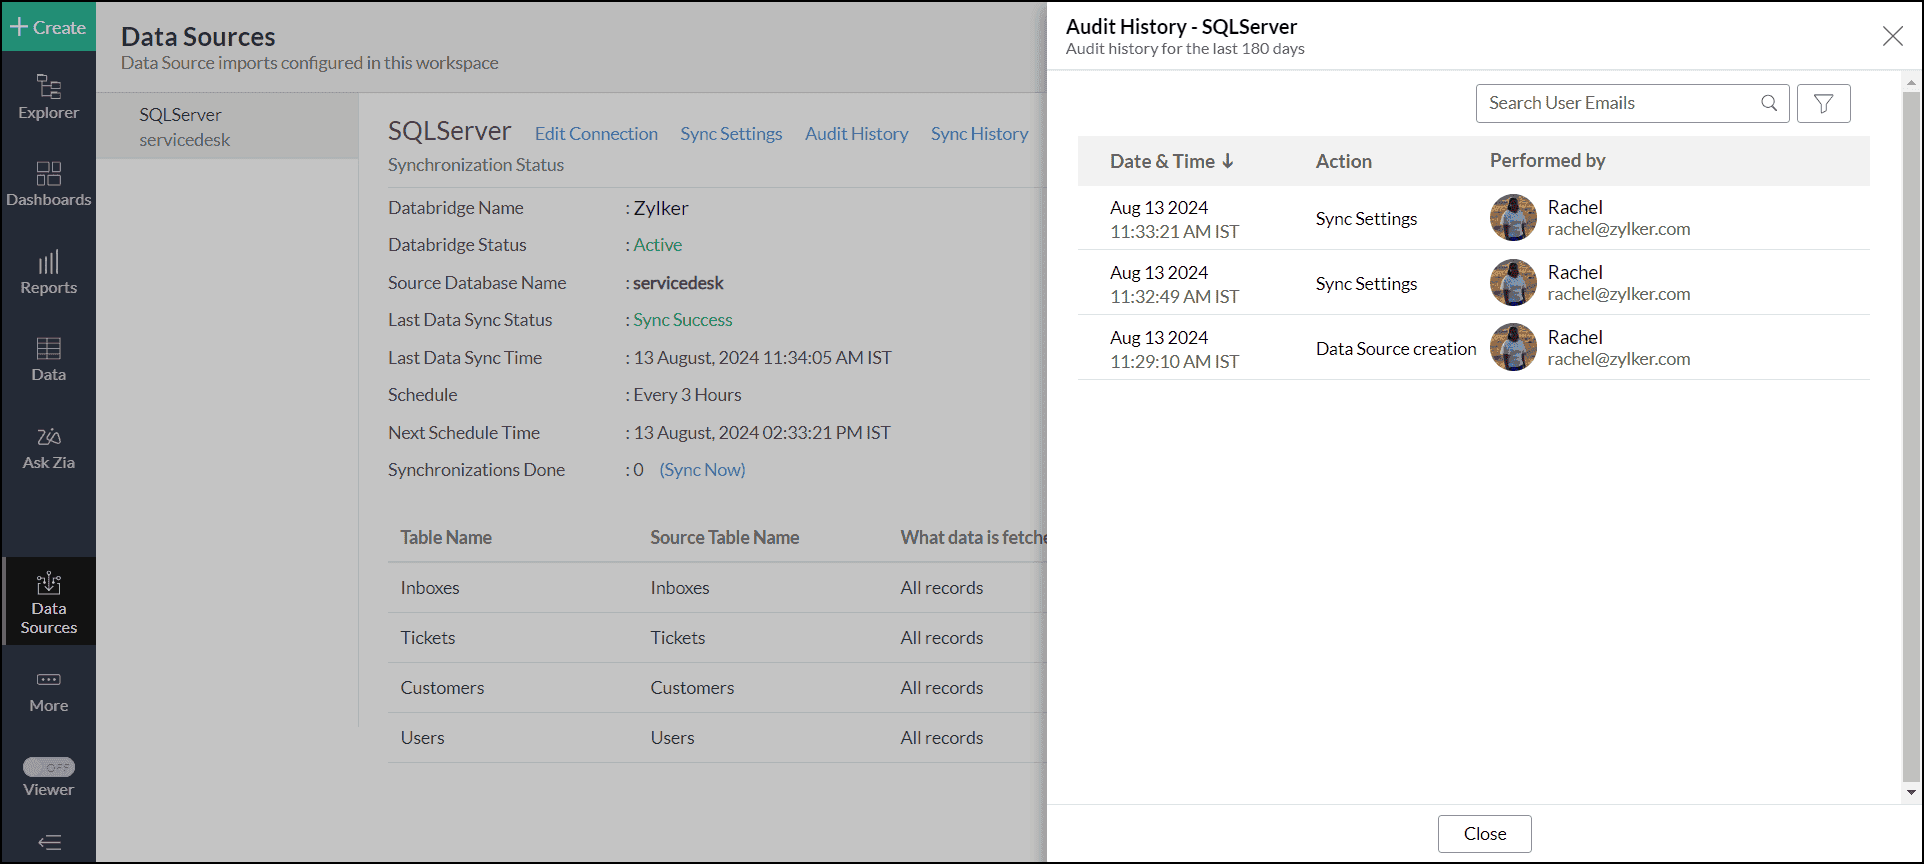
NewAudit history
Analytics Plus now offers audit history, a detailed record of all actions performed with respect to data synchronization from various sources. This will include changes to sync settings, edits to the data import configuration, and more. The history captures the type of action performed along with the timestamp and information about the administrator who performed it. Click here to learn more.
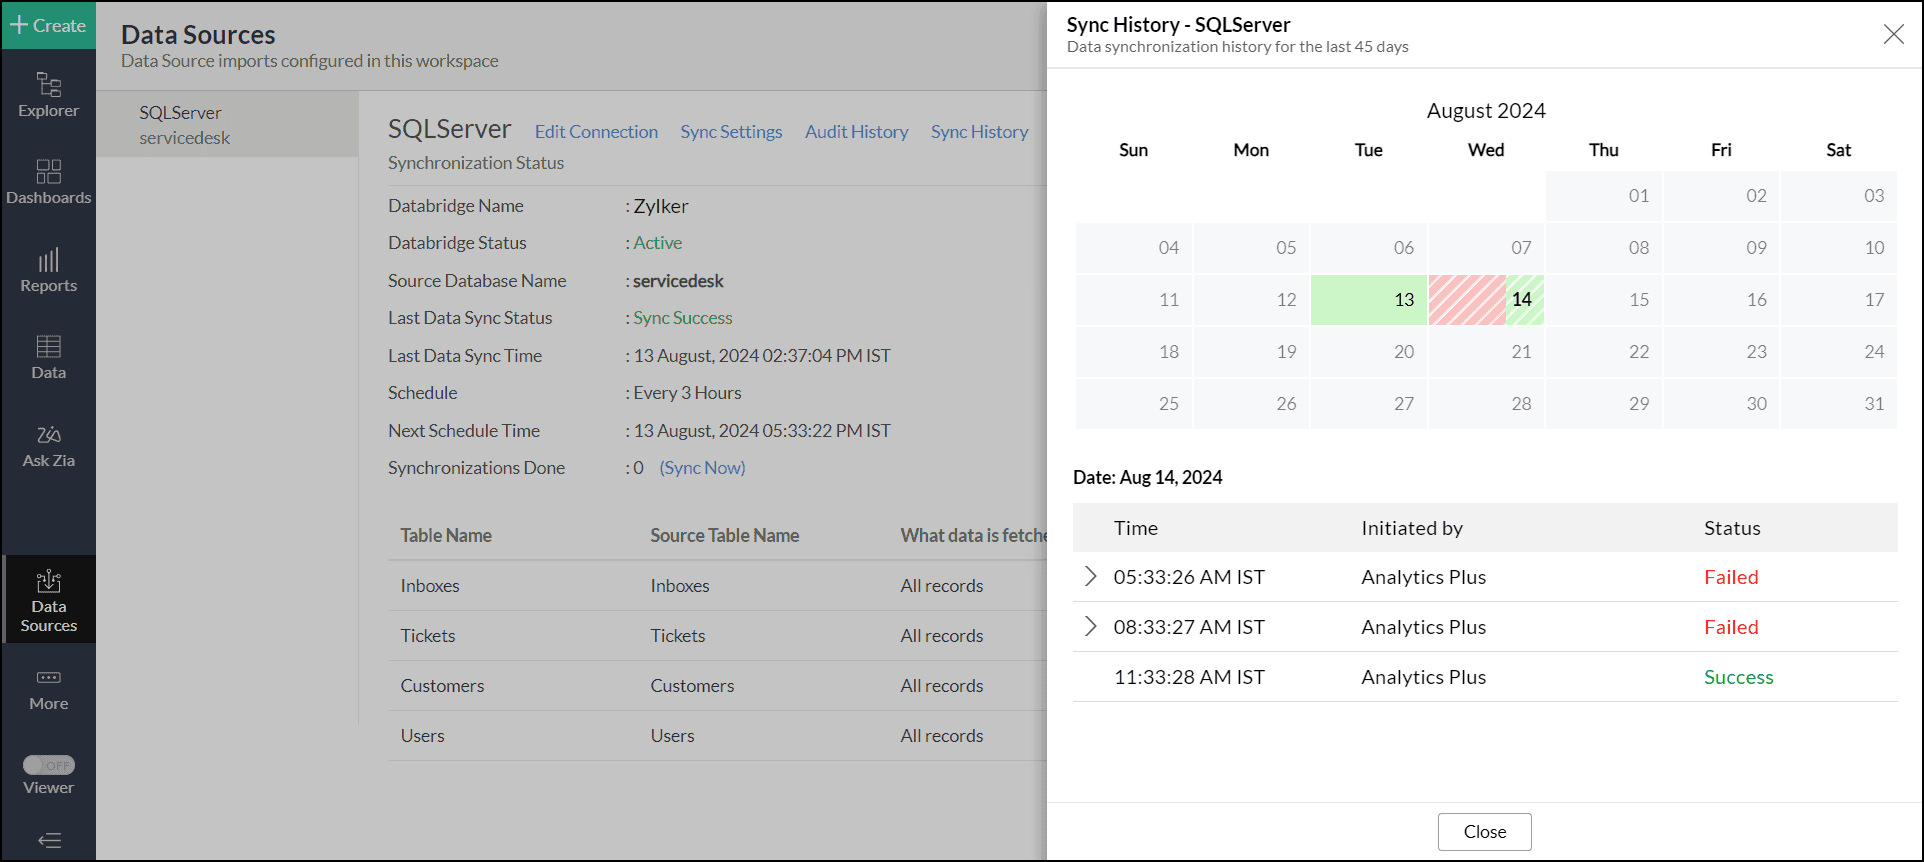
Analytics Plus' sync history delivers a comprehensive log of data synchronization activities with color-coded indicators, allowing administrators to track the status of each sync. Click here to learn more.
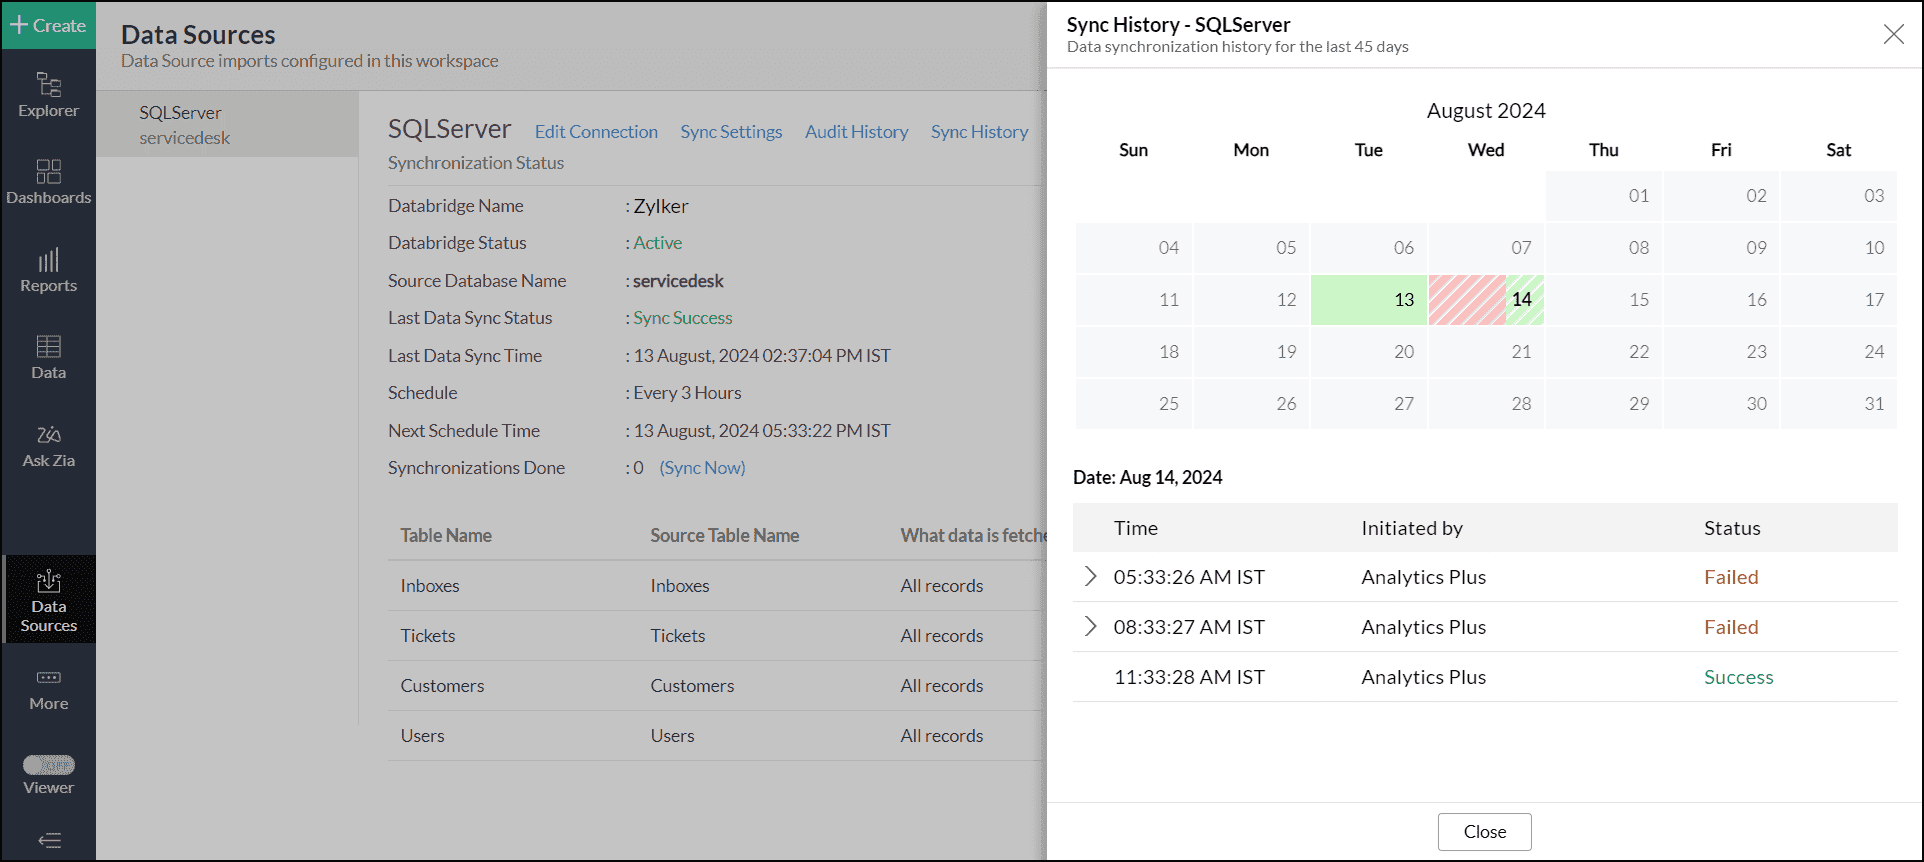
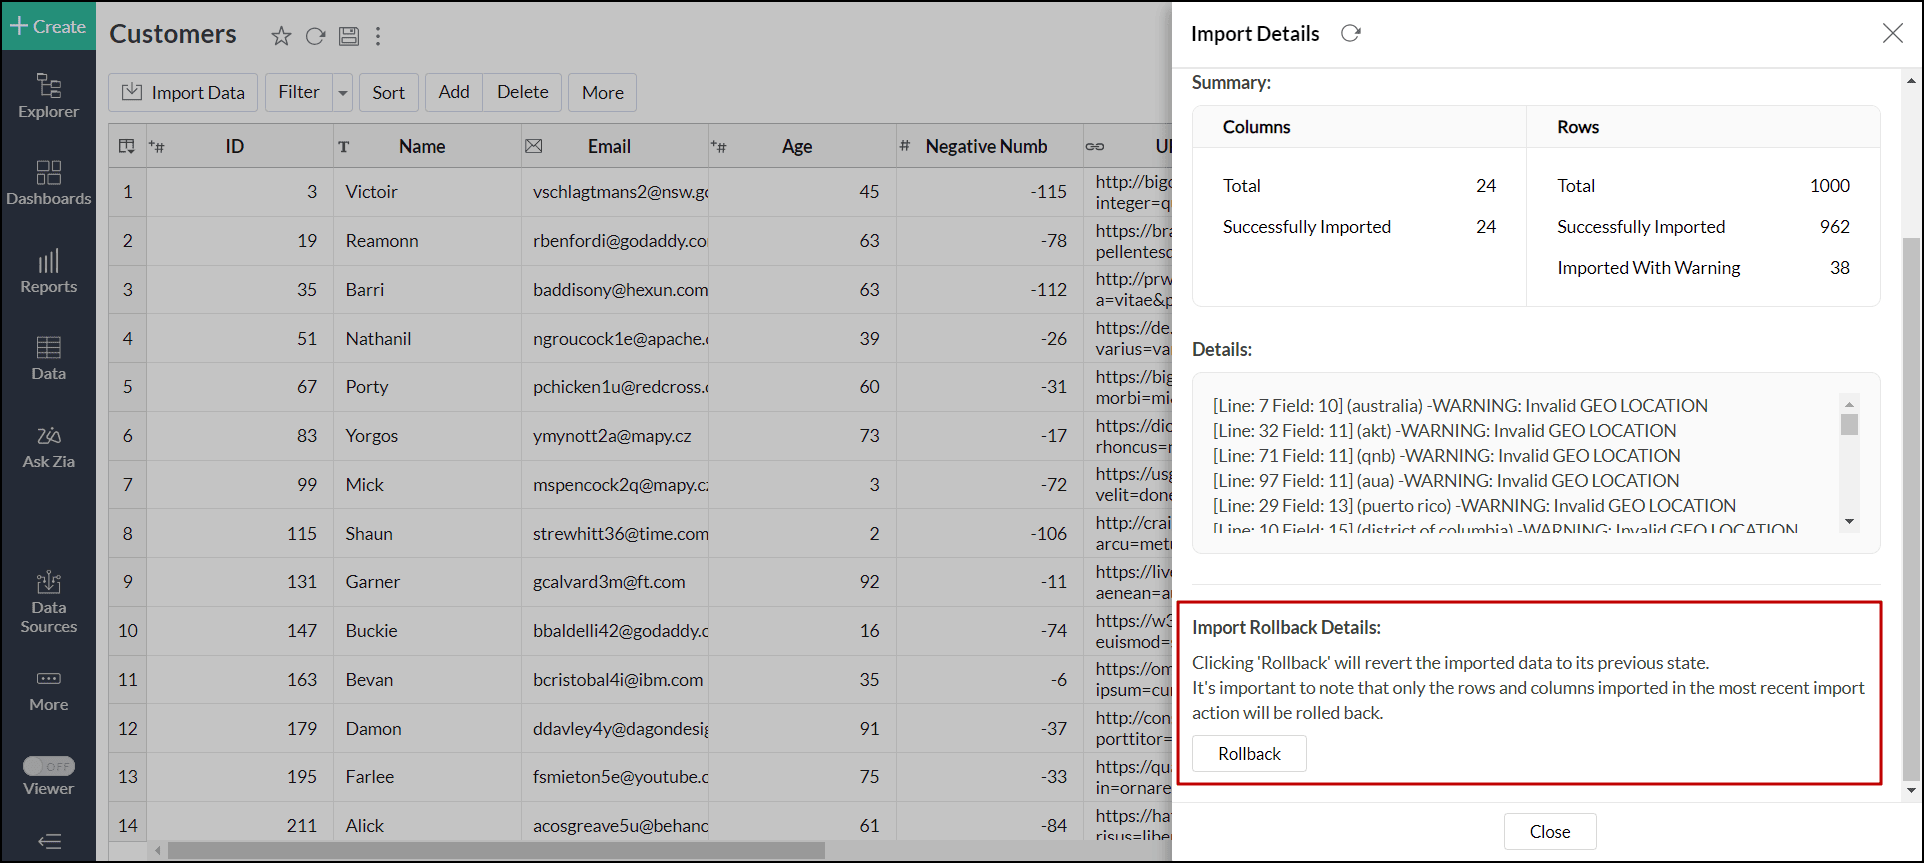
Analytics Plus now includes an import rollback feature, allowing you to revert datasets to a previously stable configuration by undoing any changes made during recent sync cycles. Click here to learn more.

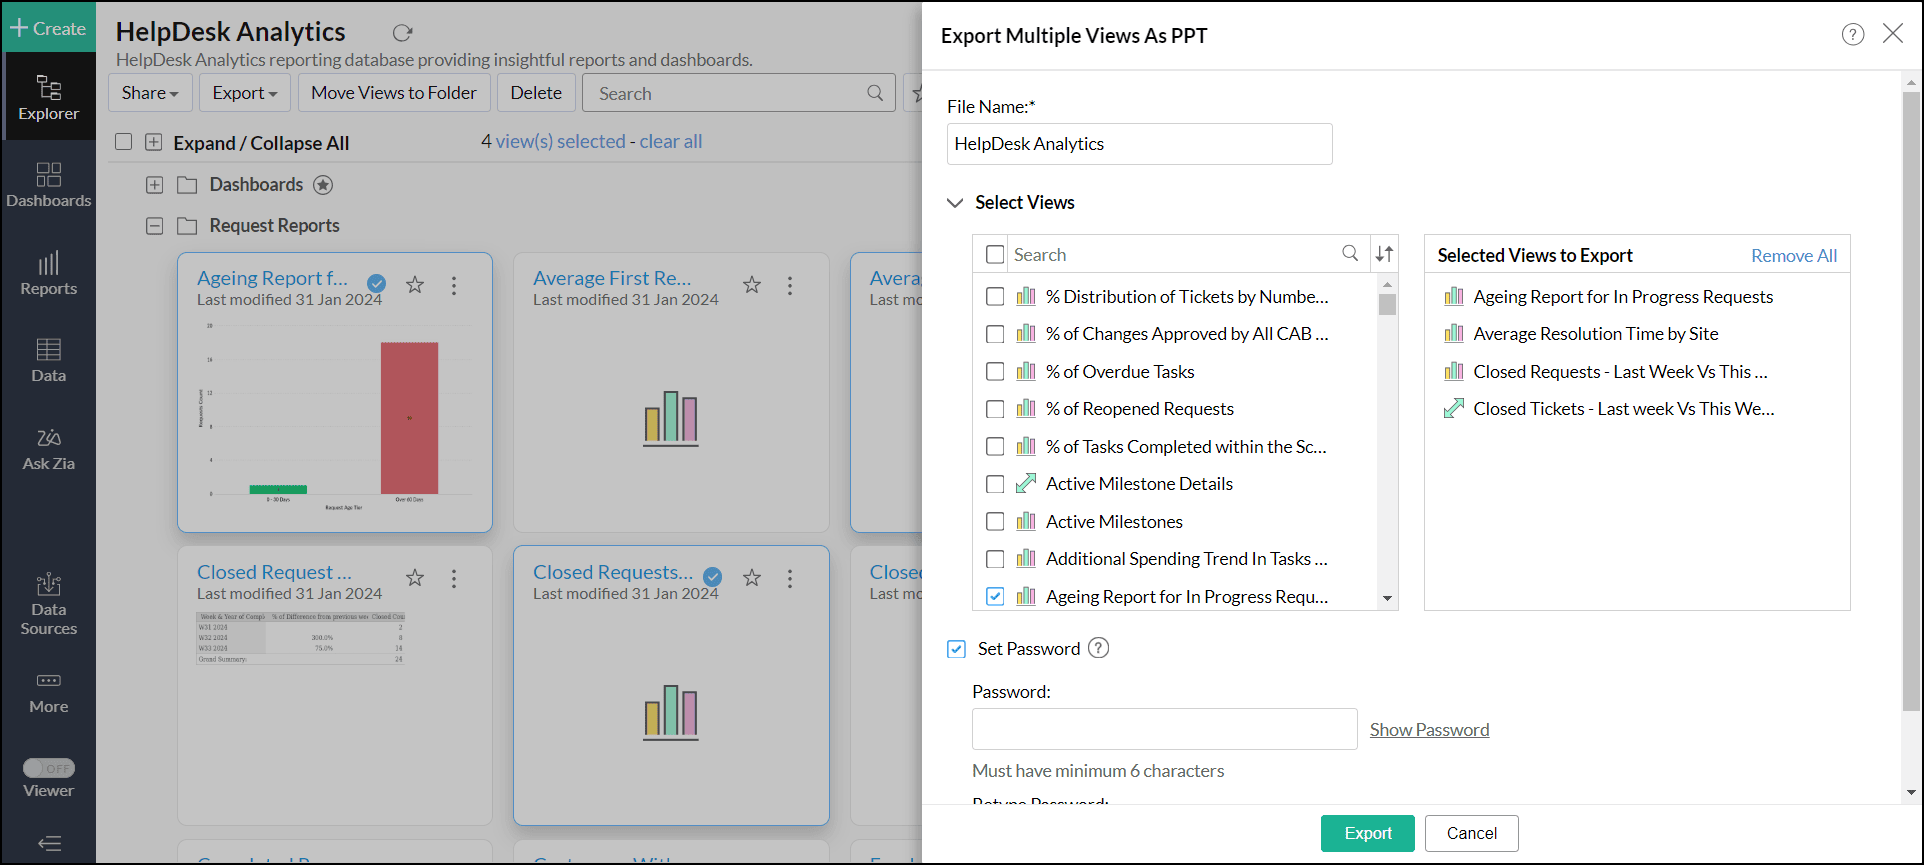
Export multiple views & dashboards as PPT
NewYou can now export multiple reports and dashboards as a Microsoft PowerPoint presentation and secure the file with password protection.
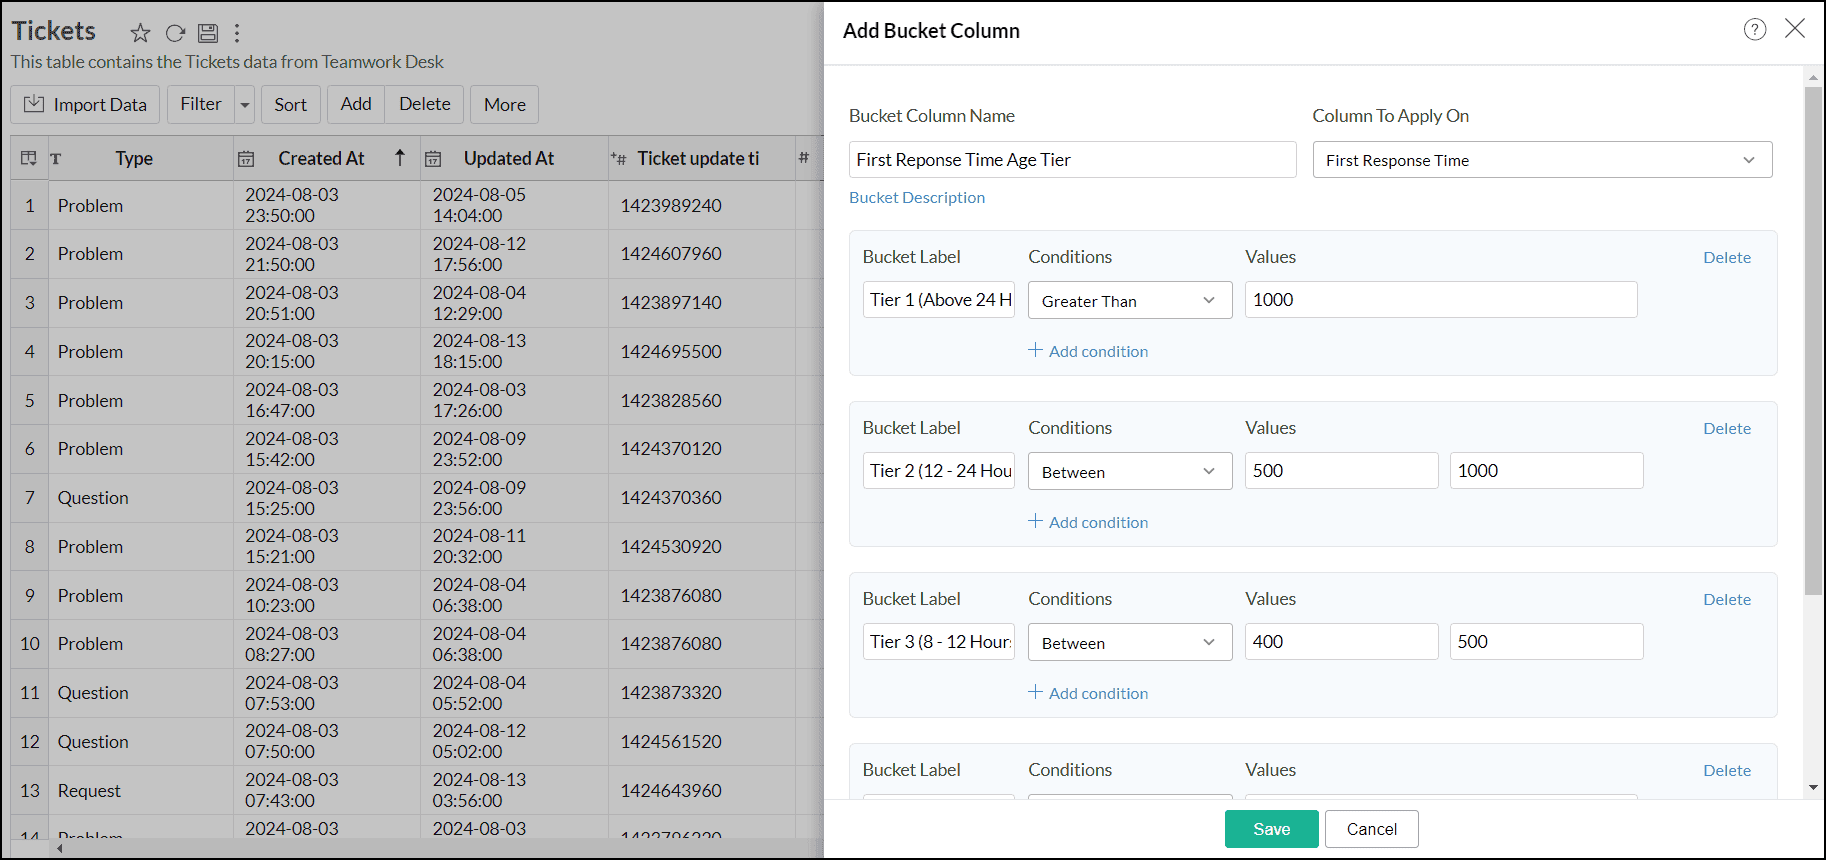
Presenting data bucketing
NewEasily categorize or group data points using the Bucket Columns option in Analytics Plus. This feature allows users to segment data based on a certain numerical range or text. Click here to learn more.
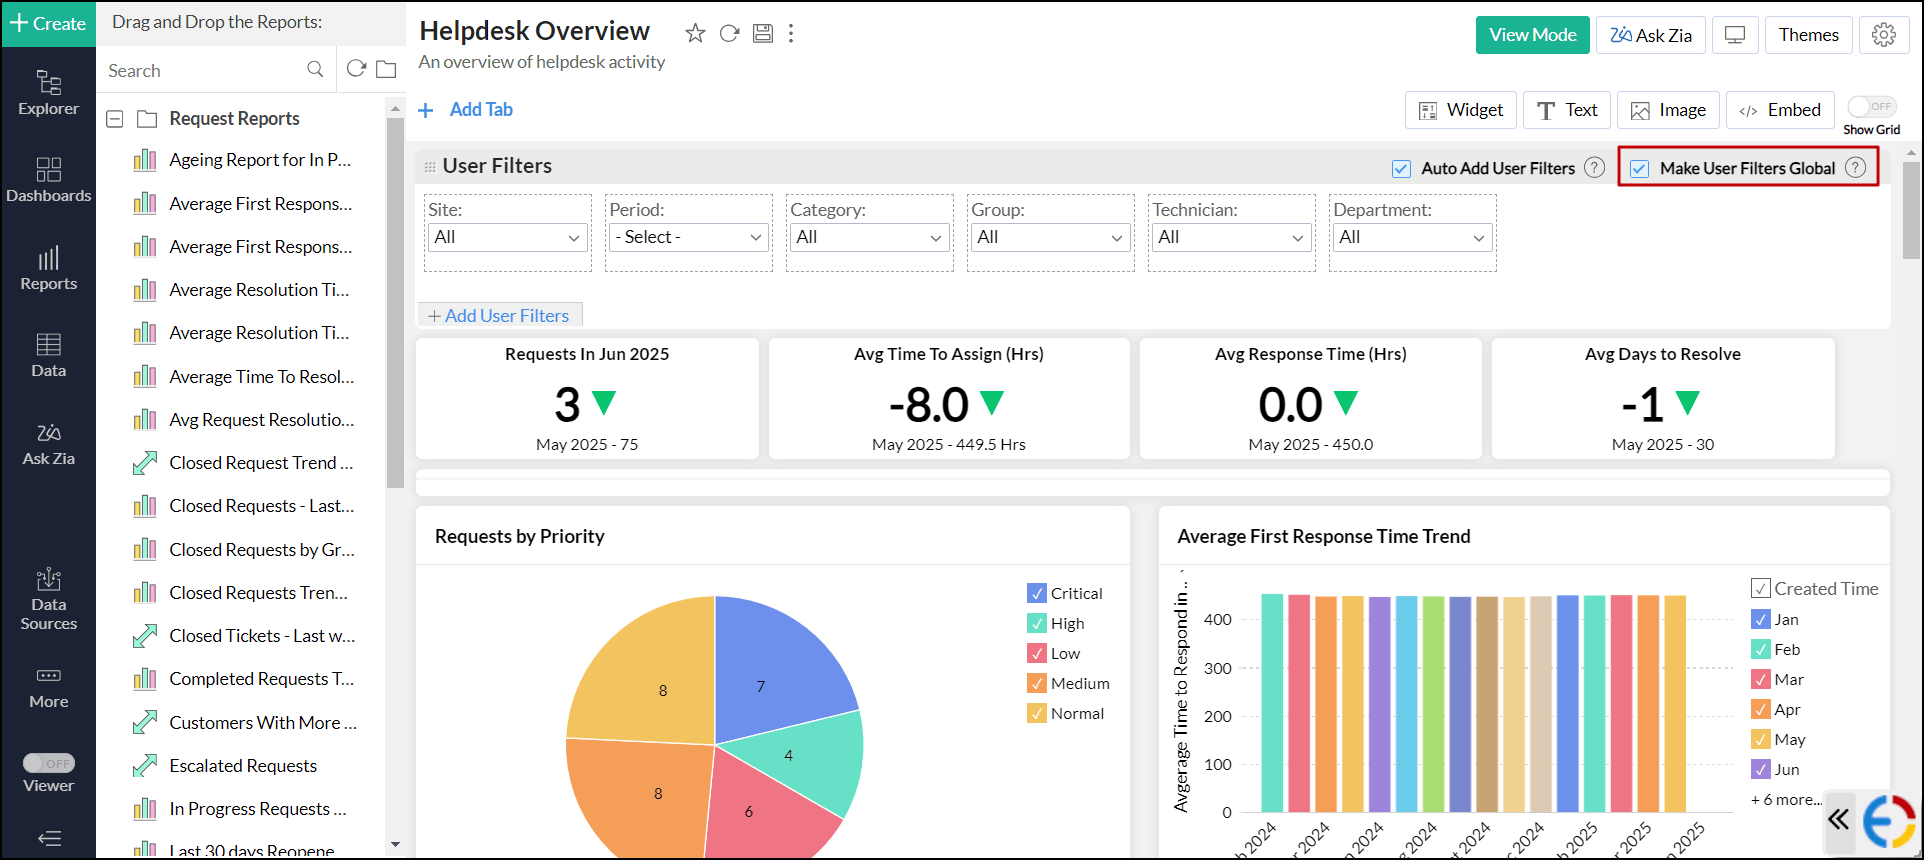
Introducing Global User Filters
NewAnalytics Plus now features a global user filter to filter data across all tabs of a given dashboard. Click here to learn more.
Launching the Drill Through feature in Analytics Plus
NewWith the new Drill Through functionality, you can link two closely related reports, enabling users to navigate between them seamlessly. When users drill down into a report, they can open the related report, providing a more detailed and connected view of their data. Click here to learn more.
Support for two new charts
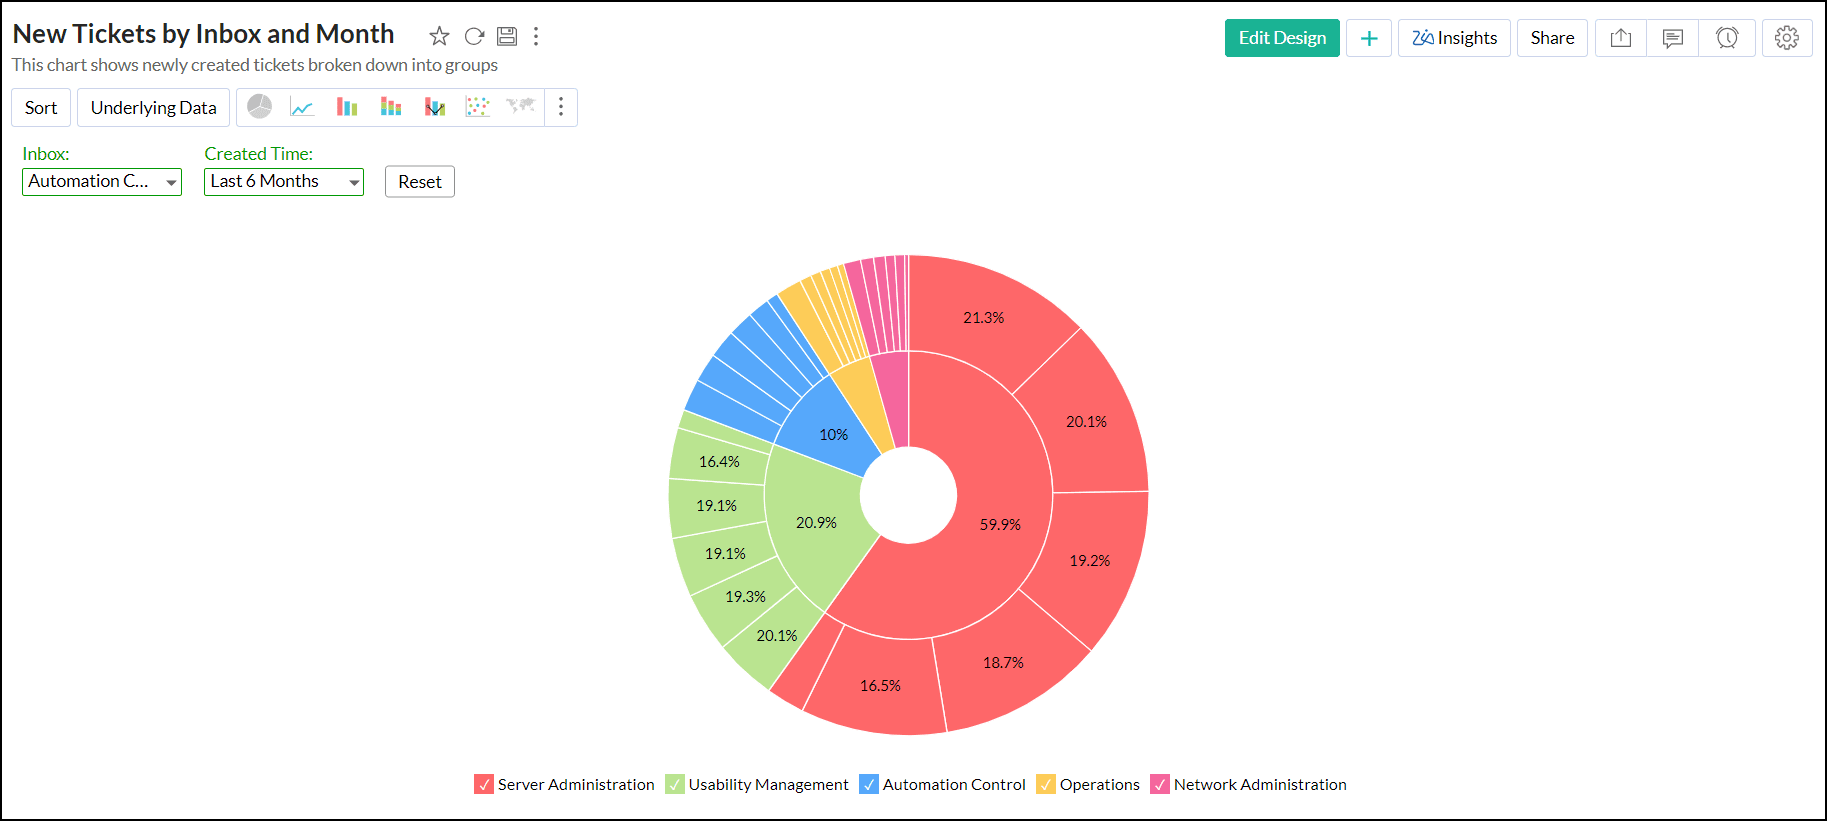
NewSunburst chart
Unlock the power of hierarchical data with our sleek and intuitive Sunburst chart, transforming complexity into clarity. Click here to learn more.

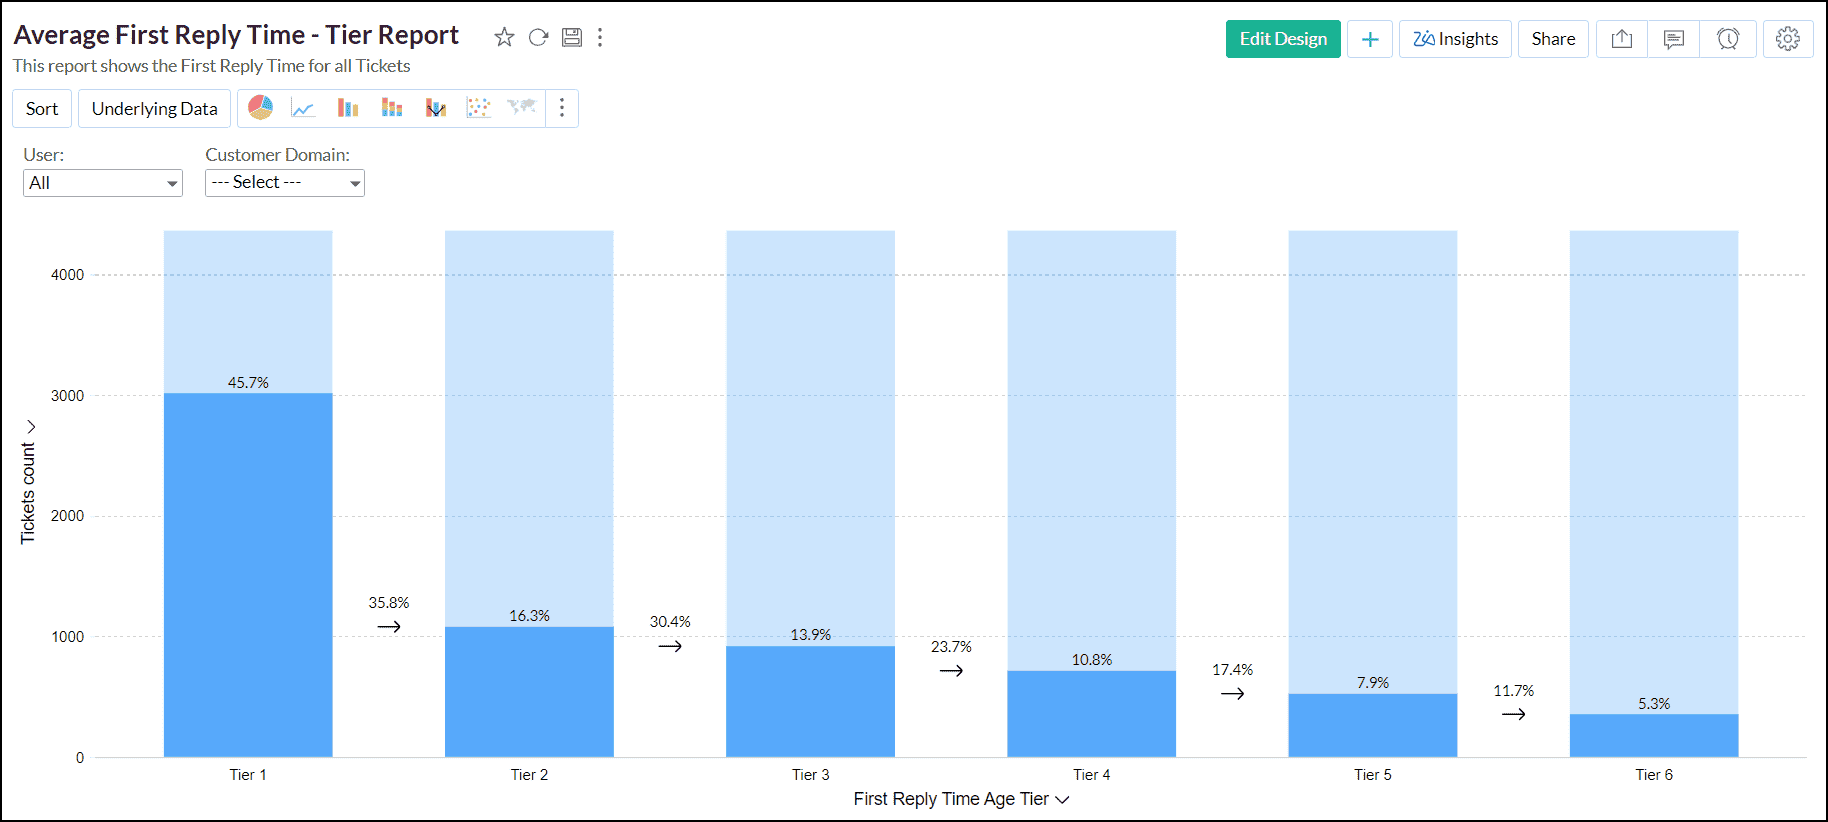
Conversion Bar charts help you effectively track processes by visualizing the percentage of work that moves from one stage to the next. This allows you to monitor conversion rates, making it easier to identify bottlenecks and optimize transitions between stages in a workflow. Click here to learn more.
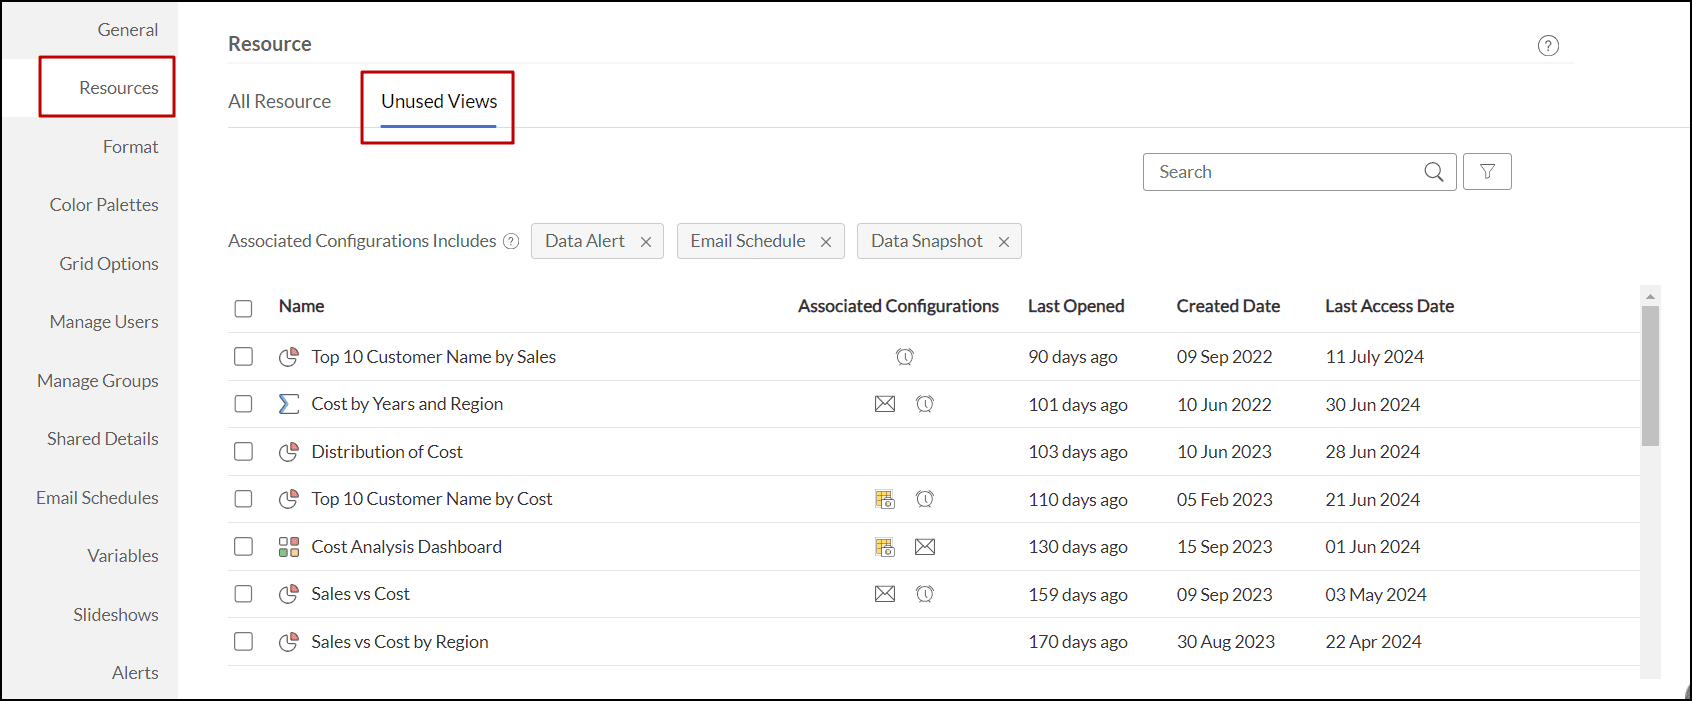
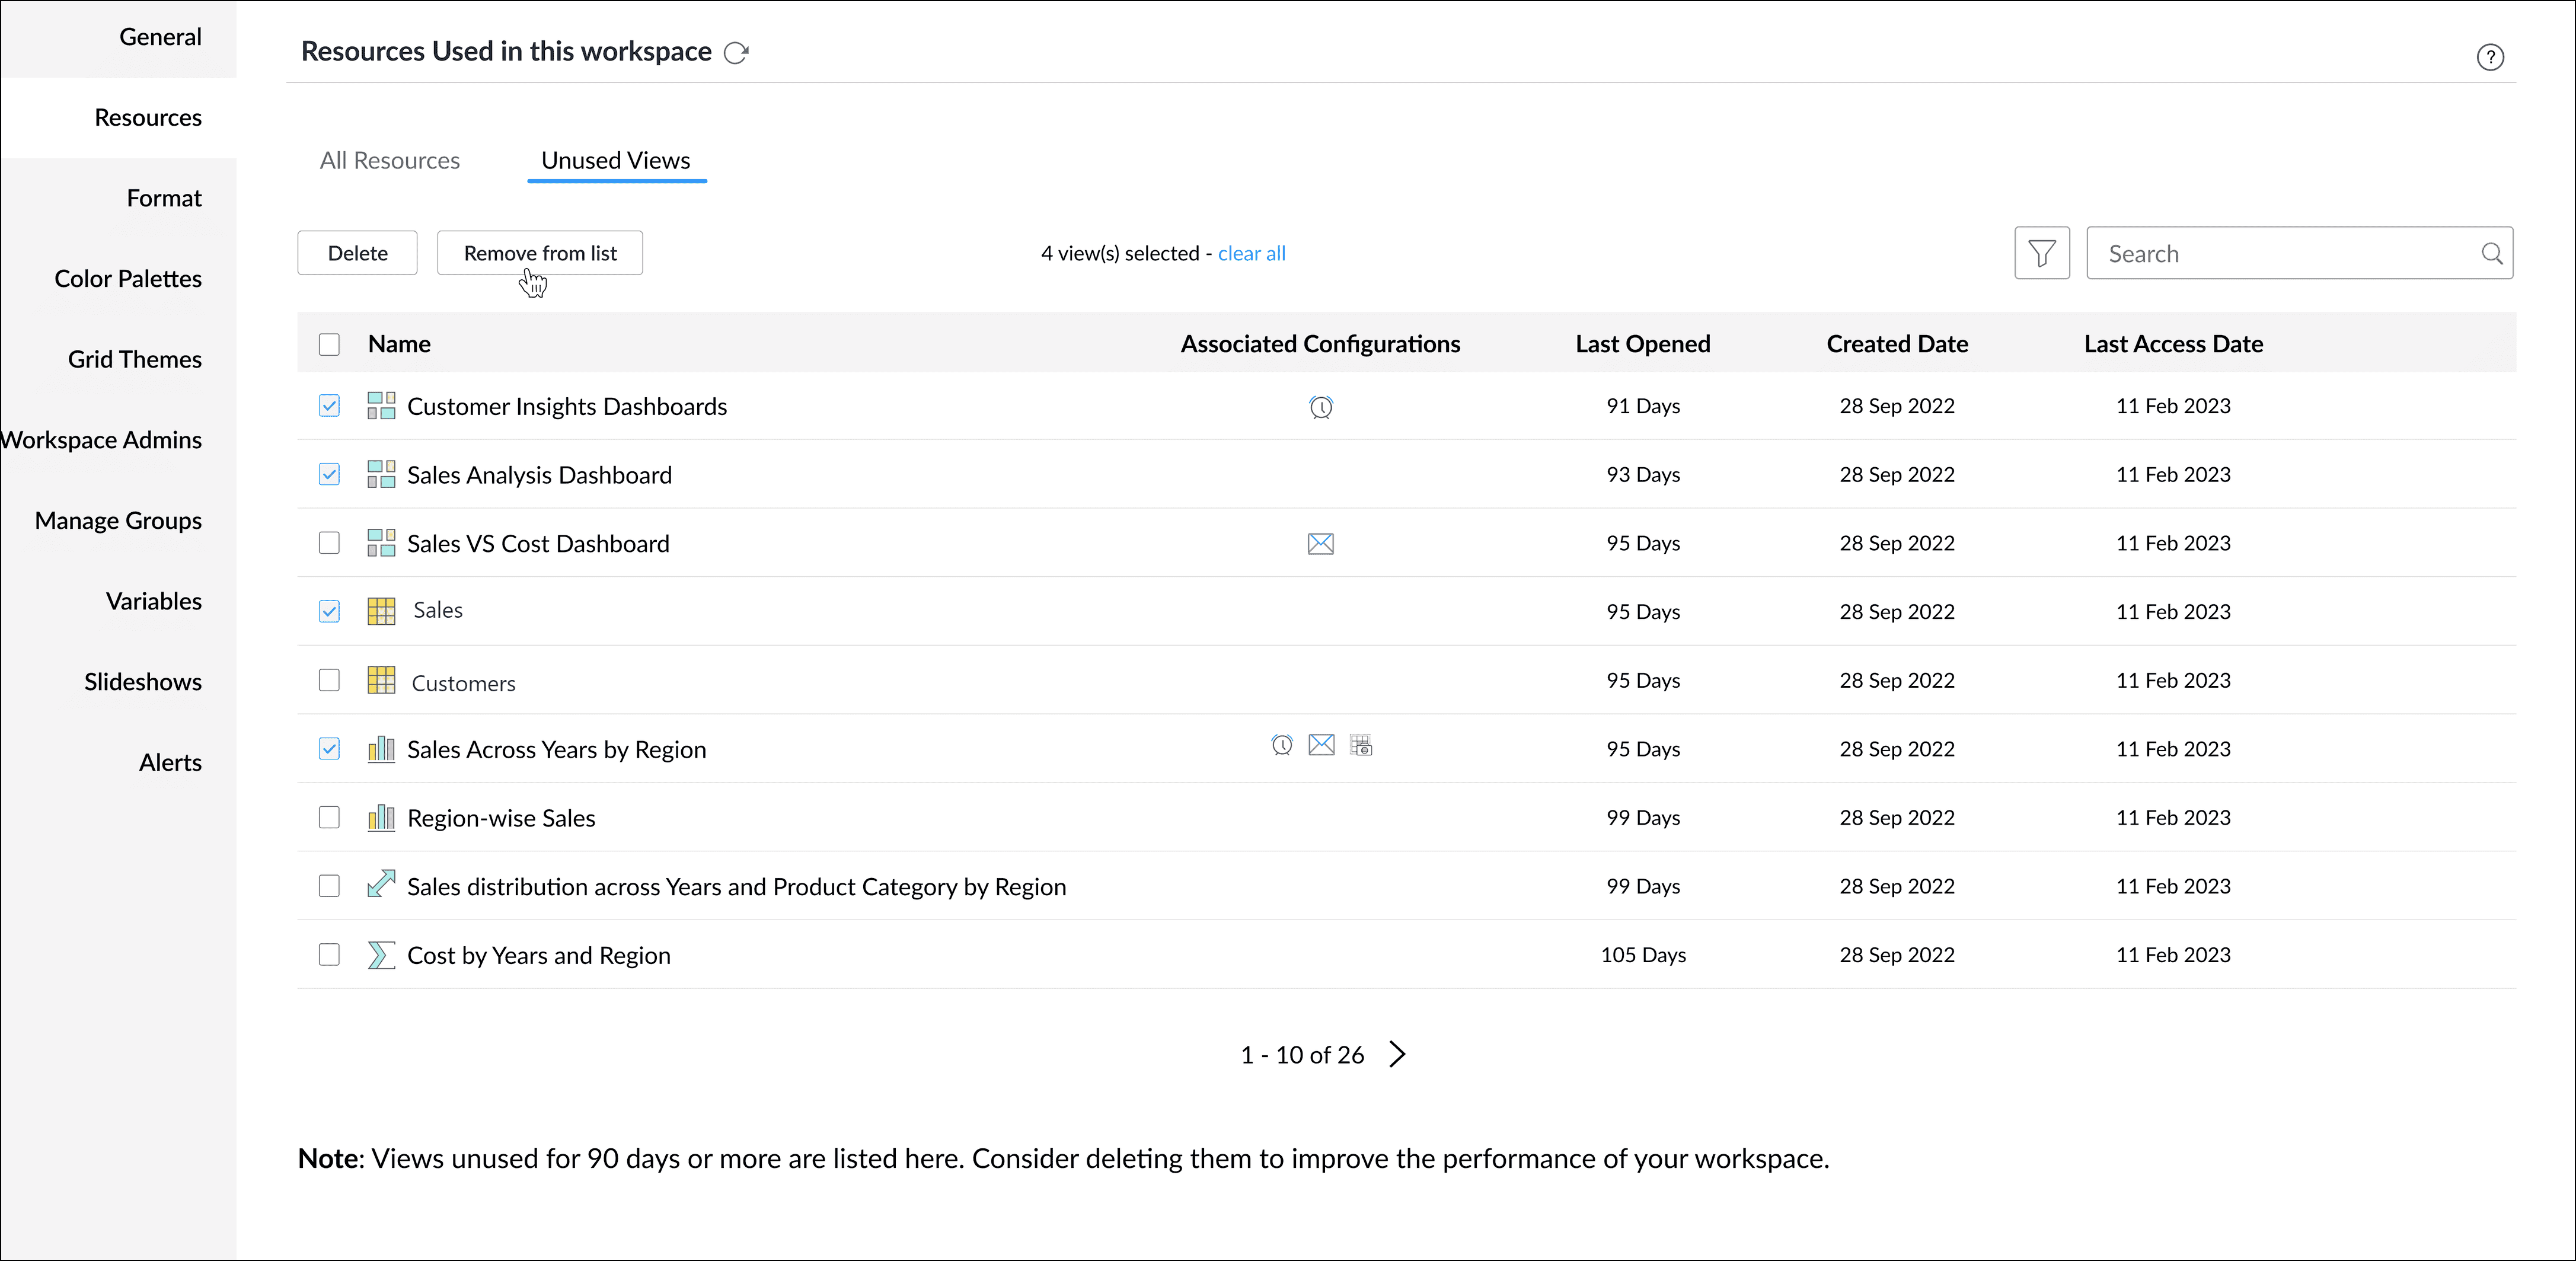
Introducing Unused Views Cleanup
NewAnalytics Plus identifies and compiles a list of views that haven't been accessed in the last 90 days and are not part of any email or alert schedules. Admins can review the list and remove unnecessary views from the workspace, facilitating a clutter-free experience. Click here to learn more.
Announcing the new Right to Left (RTL) user interface
NewAnalytics Plus now supports a right-to-left interface, ideal for languages like Arabic and Egyptian Arabic, and you can easily toggle this feature on or off as needed!
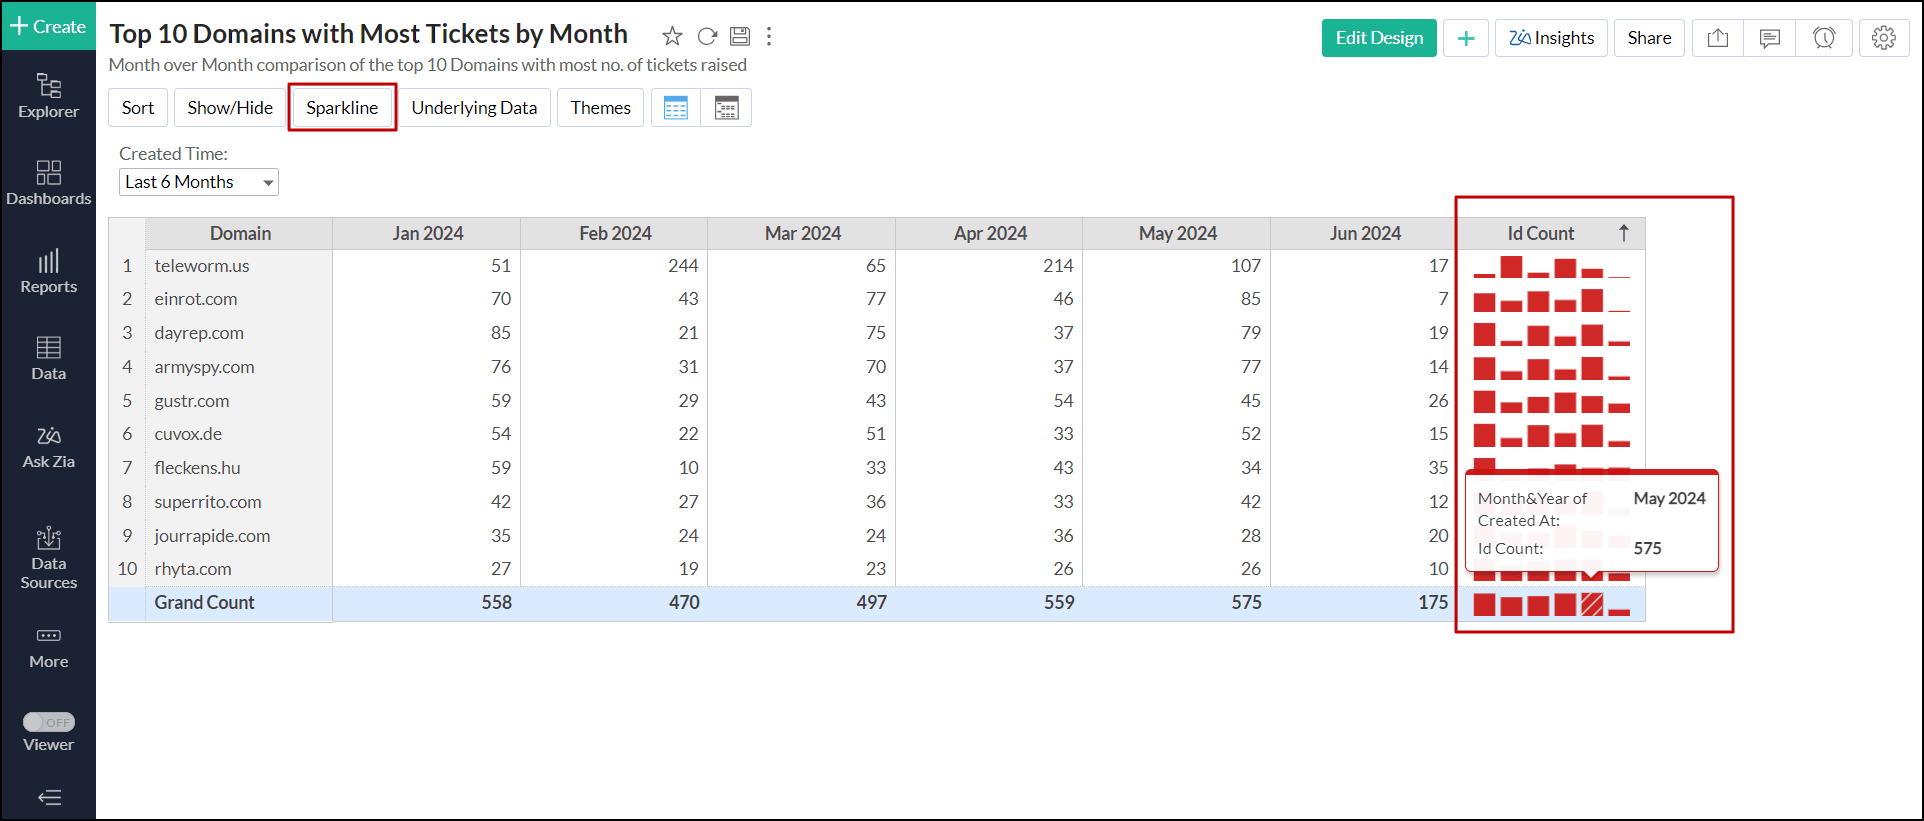
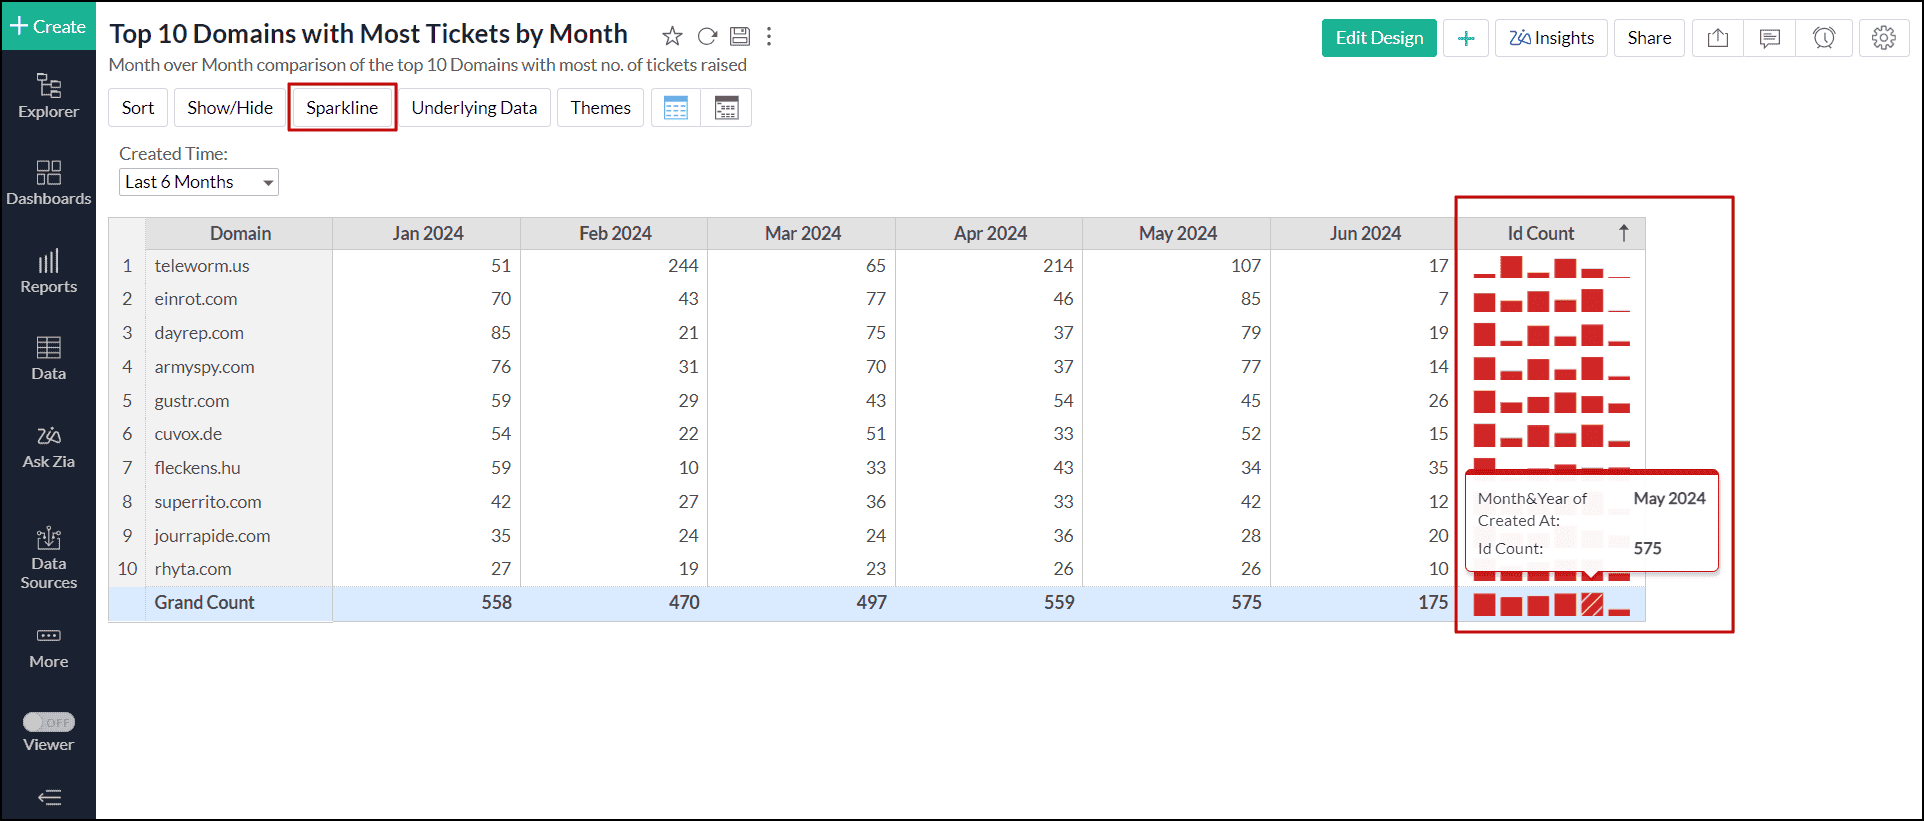
Unveiling Sparkline in pivot views
NewYou can now include sparklines in Pivot reports. This concise chart visualization allows users to visualize the historical trend of the KPI being analyzed. Click here to learn more.
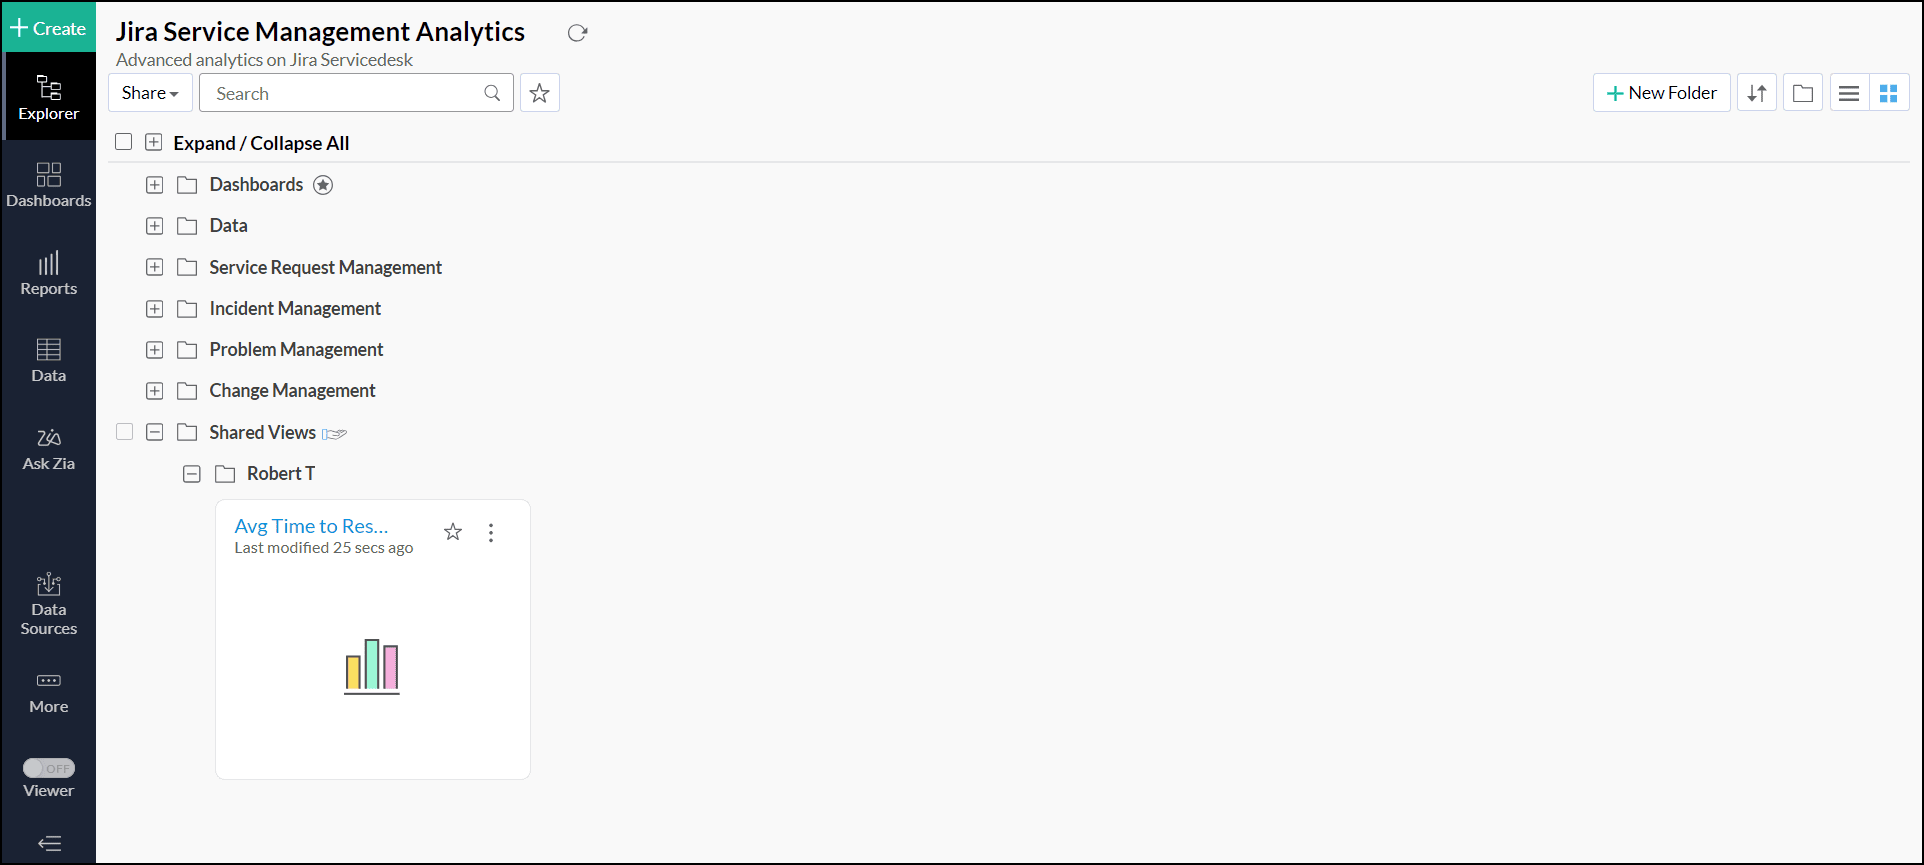
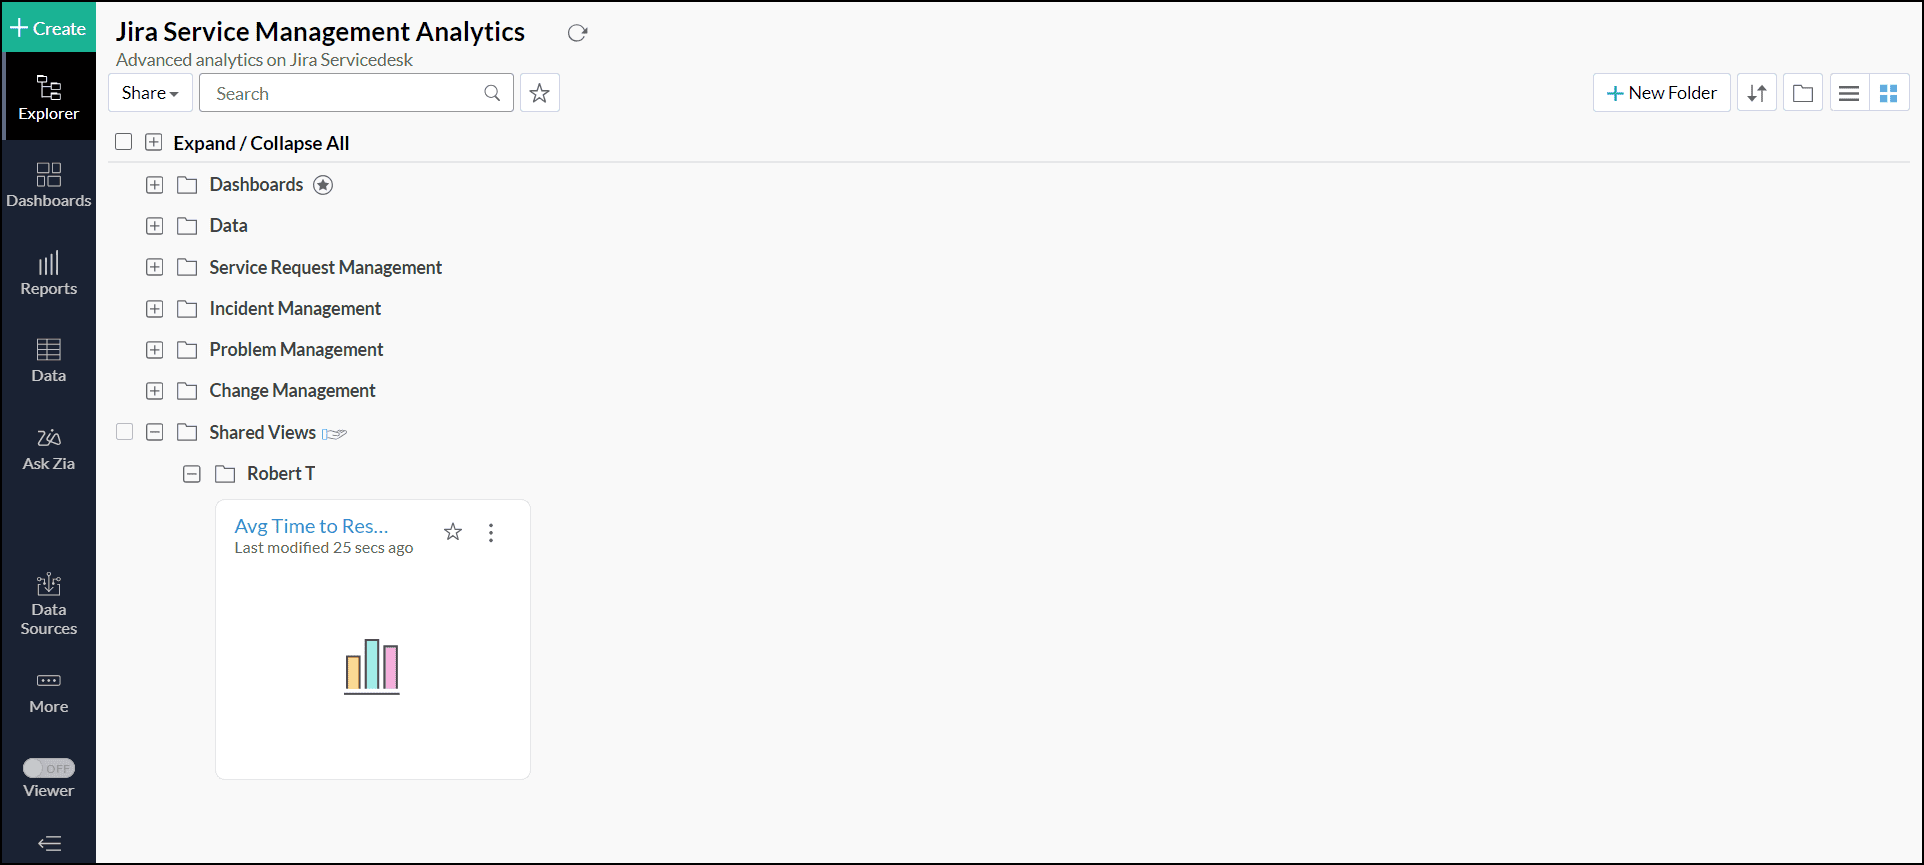
Sharing user-created views with the administrator
EnhancementAnalytics Plus now allows users to share the reports they create with administrators. The shared views will appear in the administrator's Shared Views folder, along with the name of the user who shared the report. Click here to learn more.
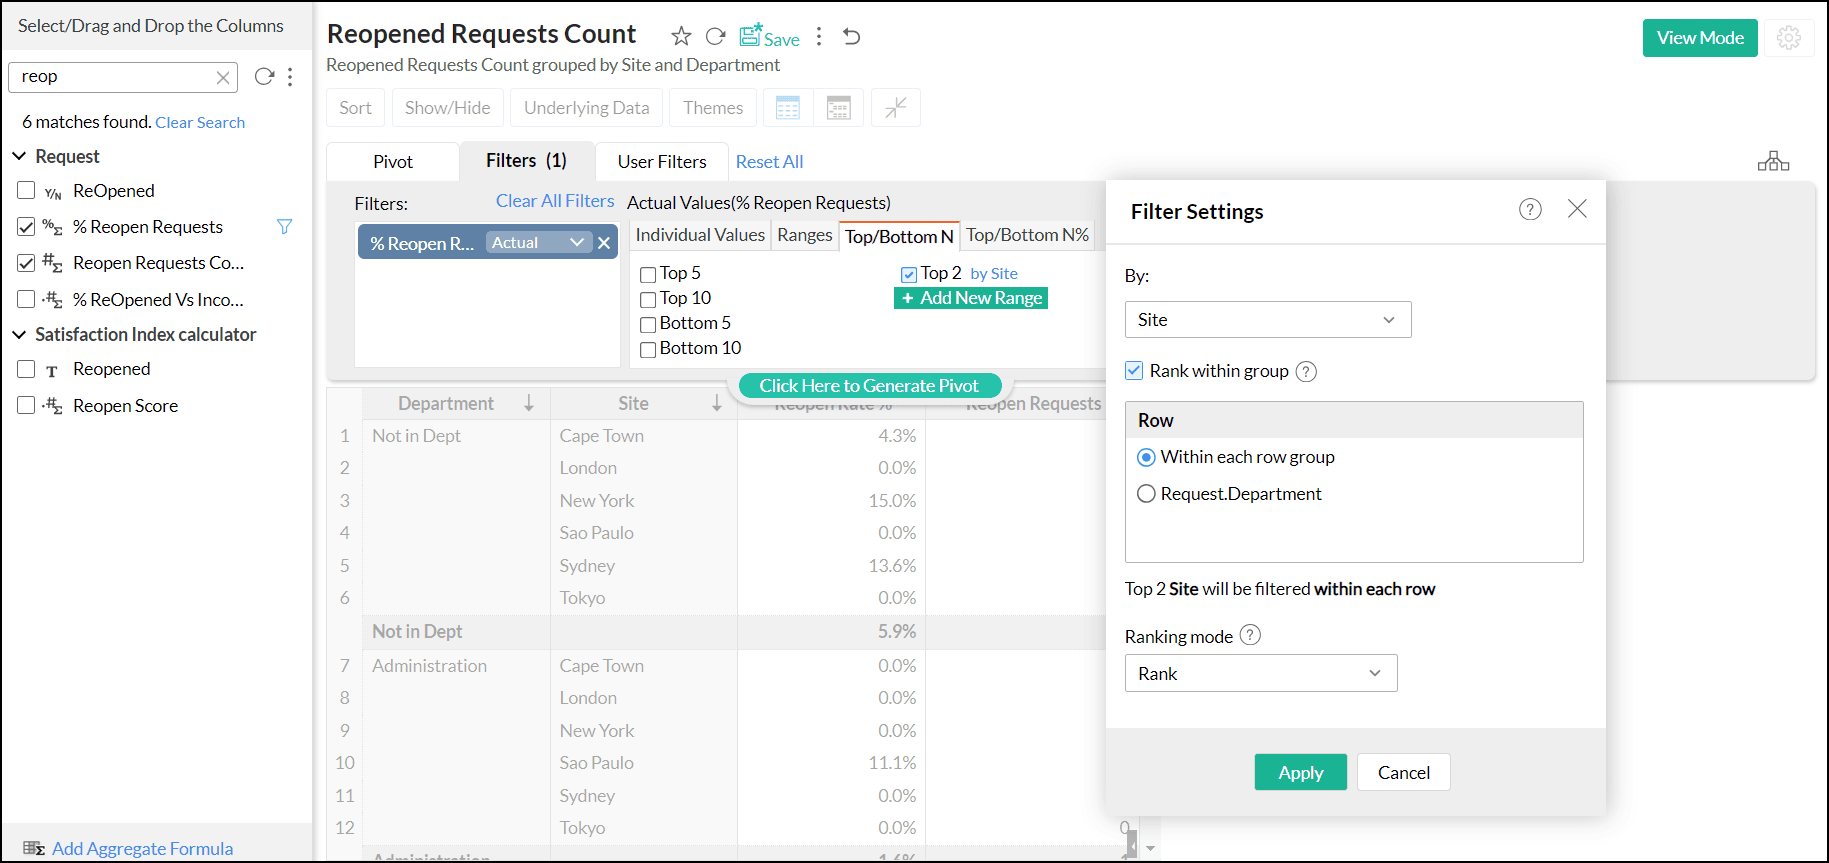
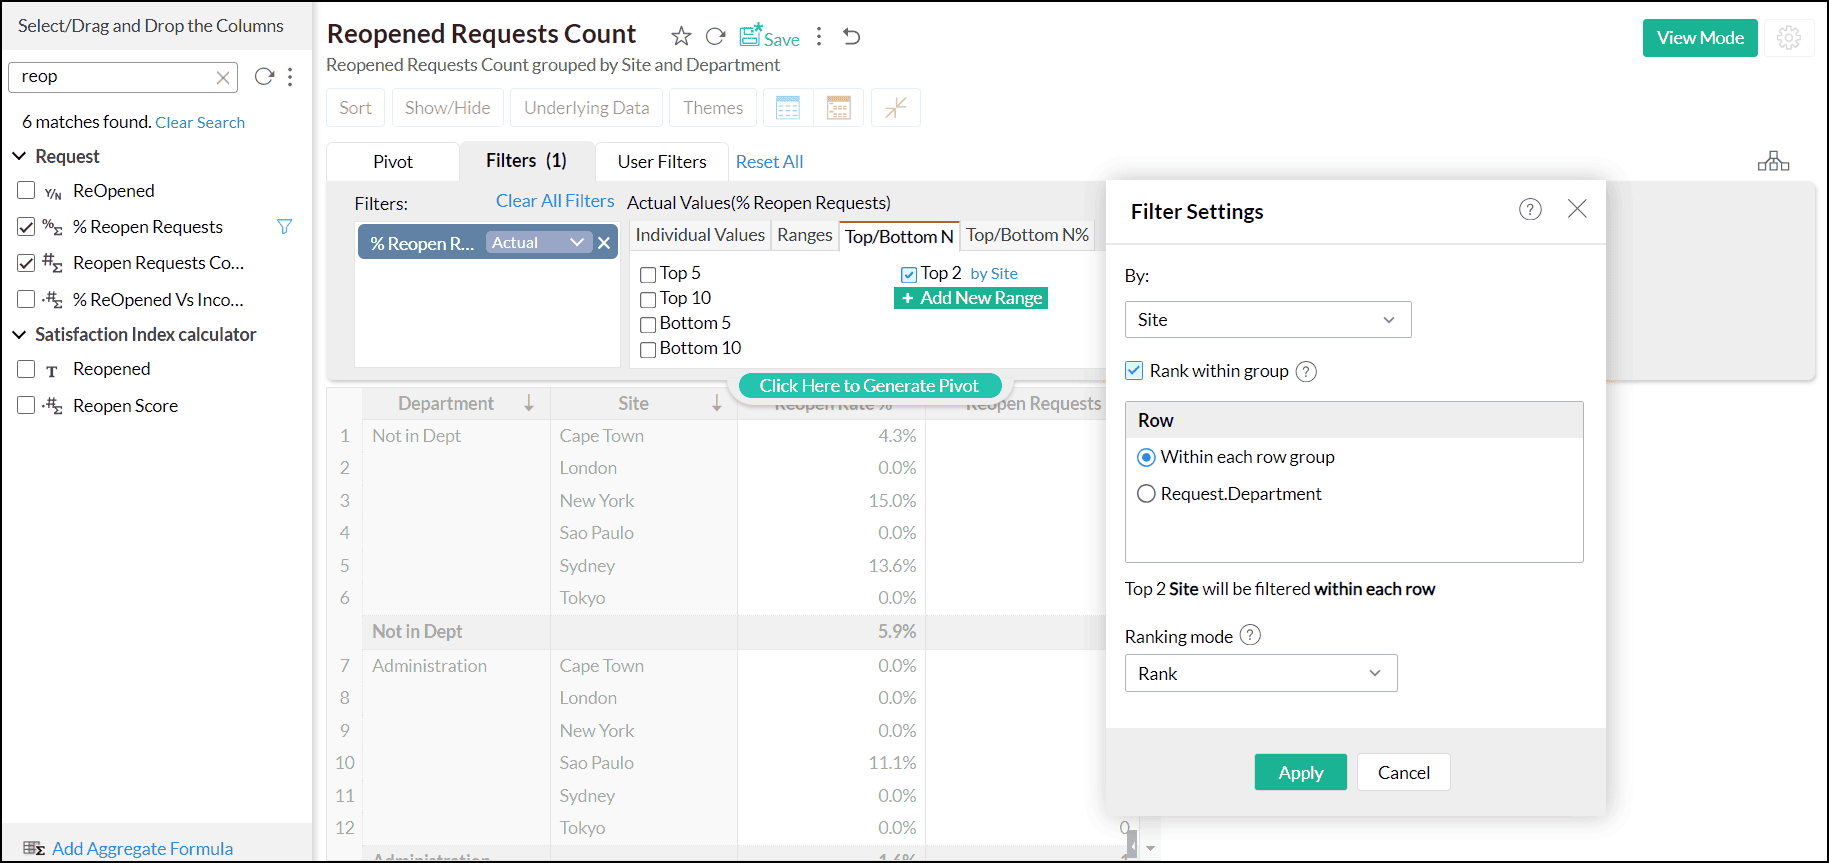
Enhancements to Top/Bottom N rank filters for reports
EnhancementIdentify top and bottom performers across various dimensions. Analytics Plus' ranking feature helps you find the highest and lowest performers within and across data groups without the need for complex formulas. Click here to learn more.
Copy or move views across dashboards
EnhancementAnalytics Plus now allows you to copy and paste views across different dashboards using keyboard shortcuts (Ctrl+C and Ctrl+V). Click here to learn more.
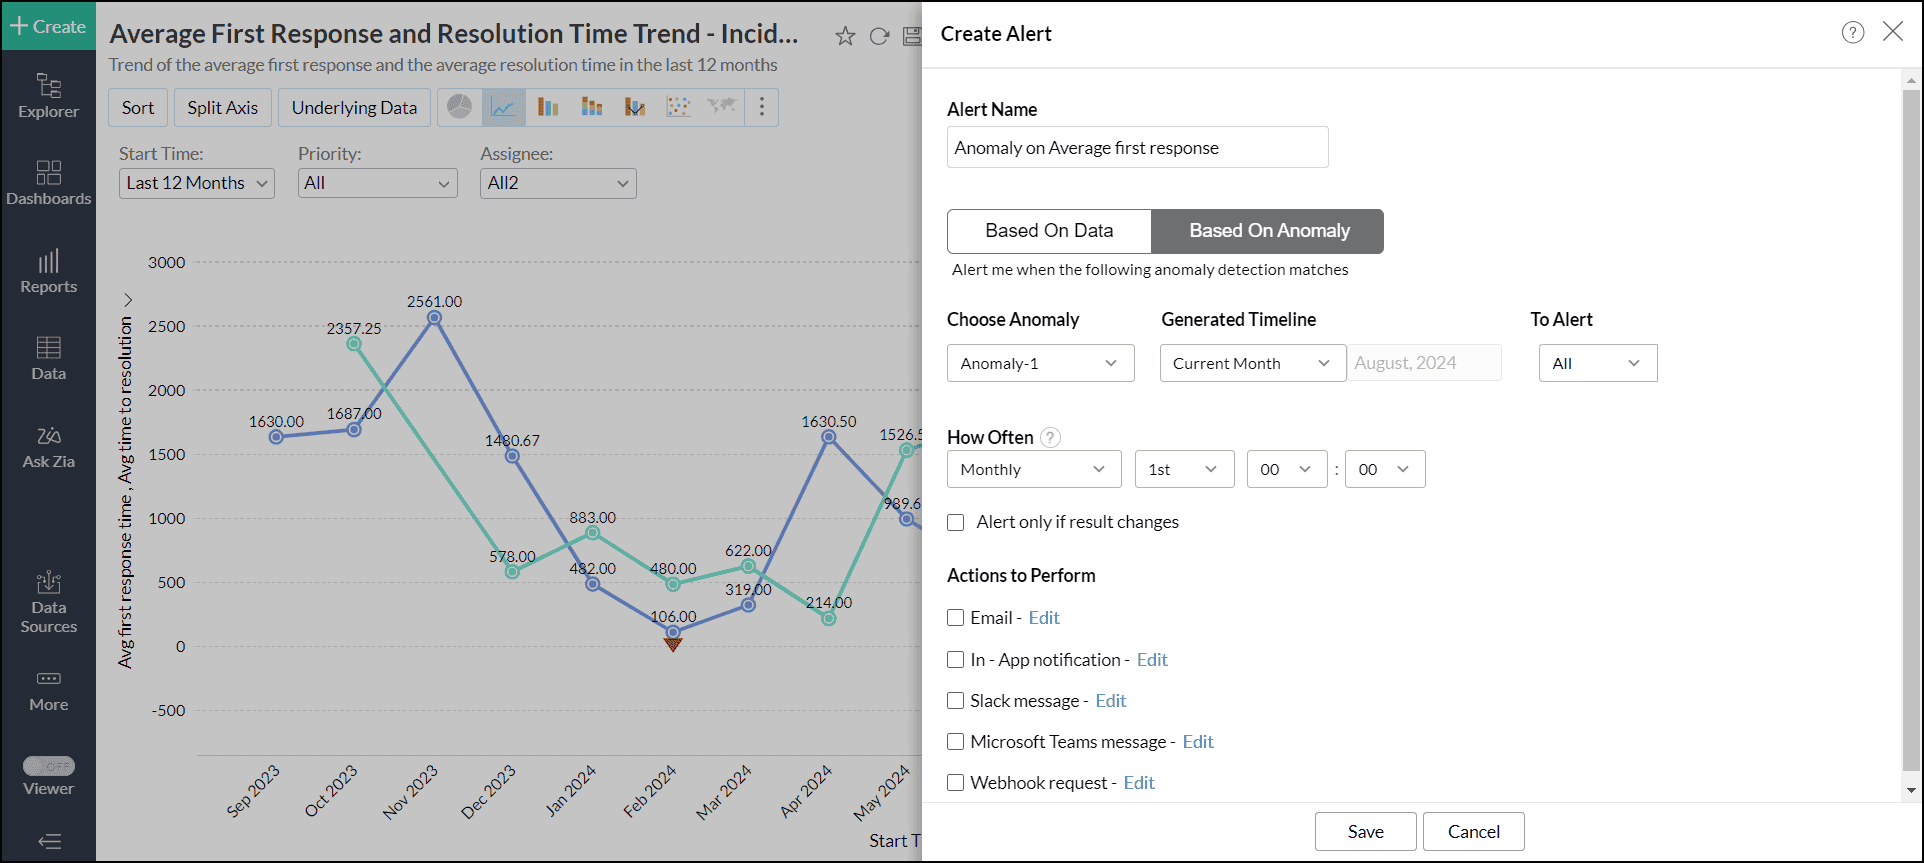
Define alerts based on threshold and anomalies
EnhancementYou can now configure data alerts to receive notifications for anomalies, to detect critical shifts in key business metrics quickly, and address potential problems. Click here to learn more.
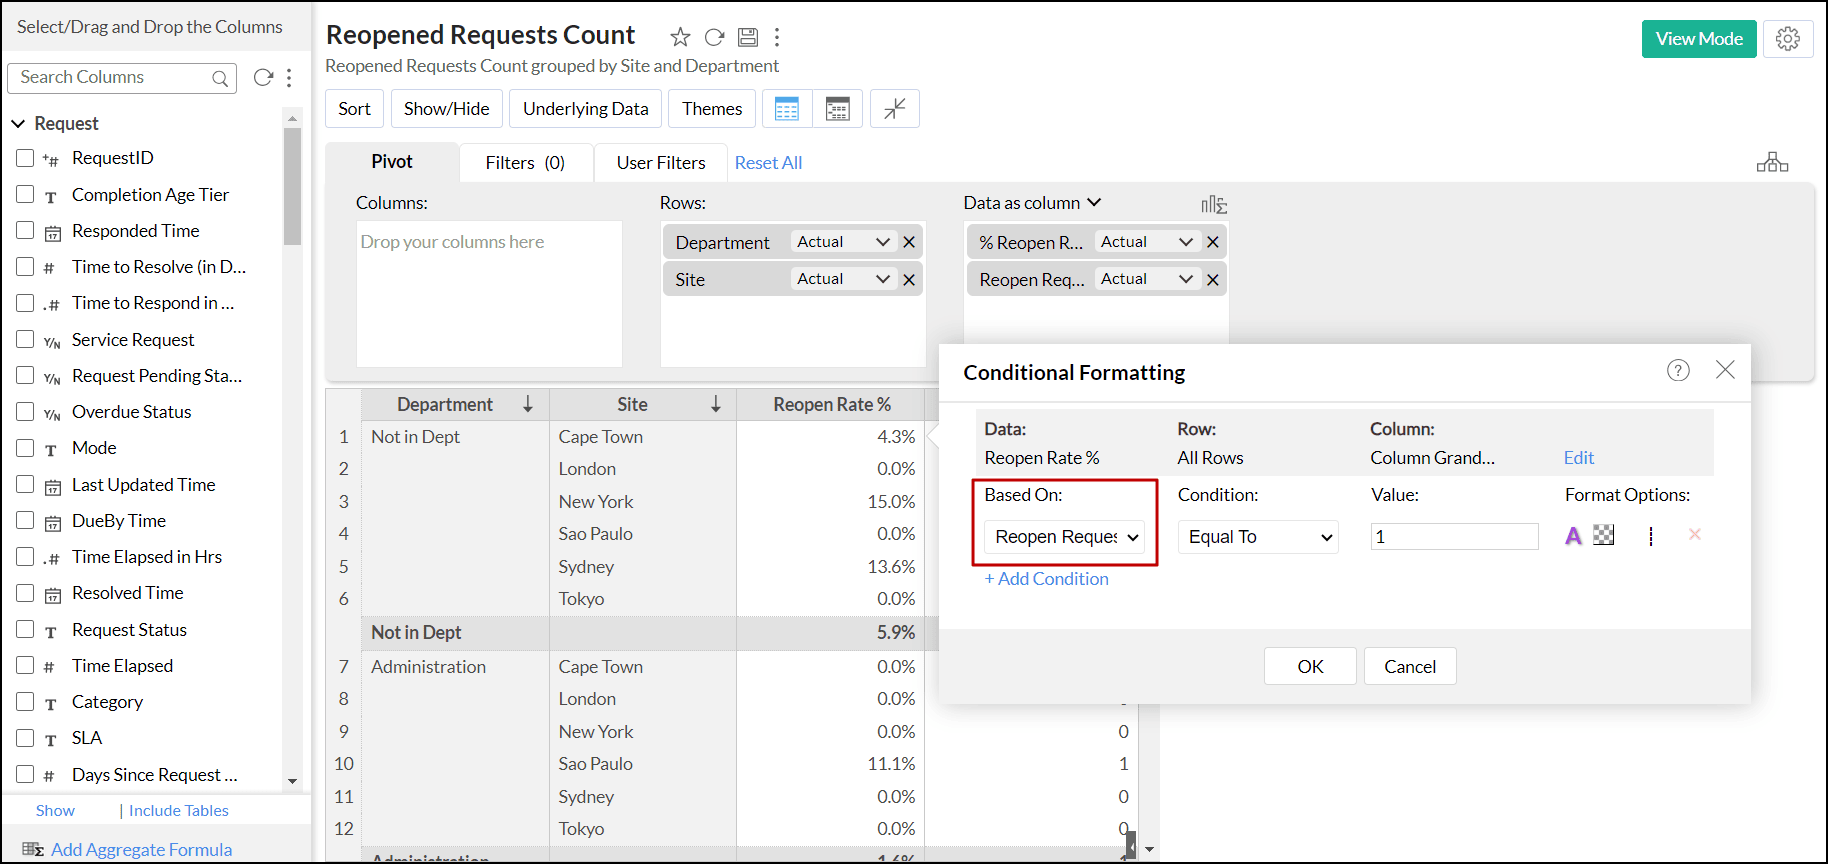
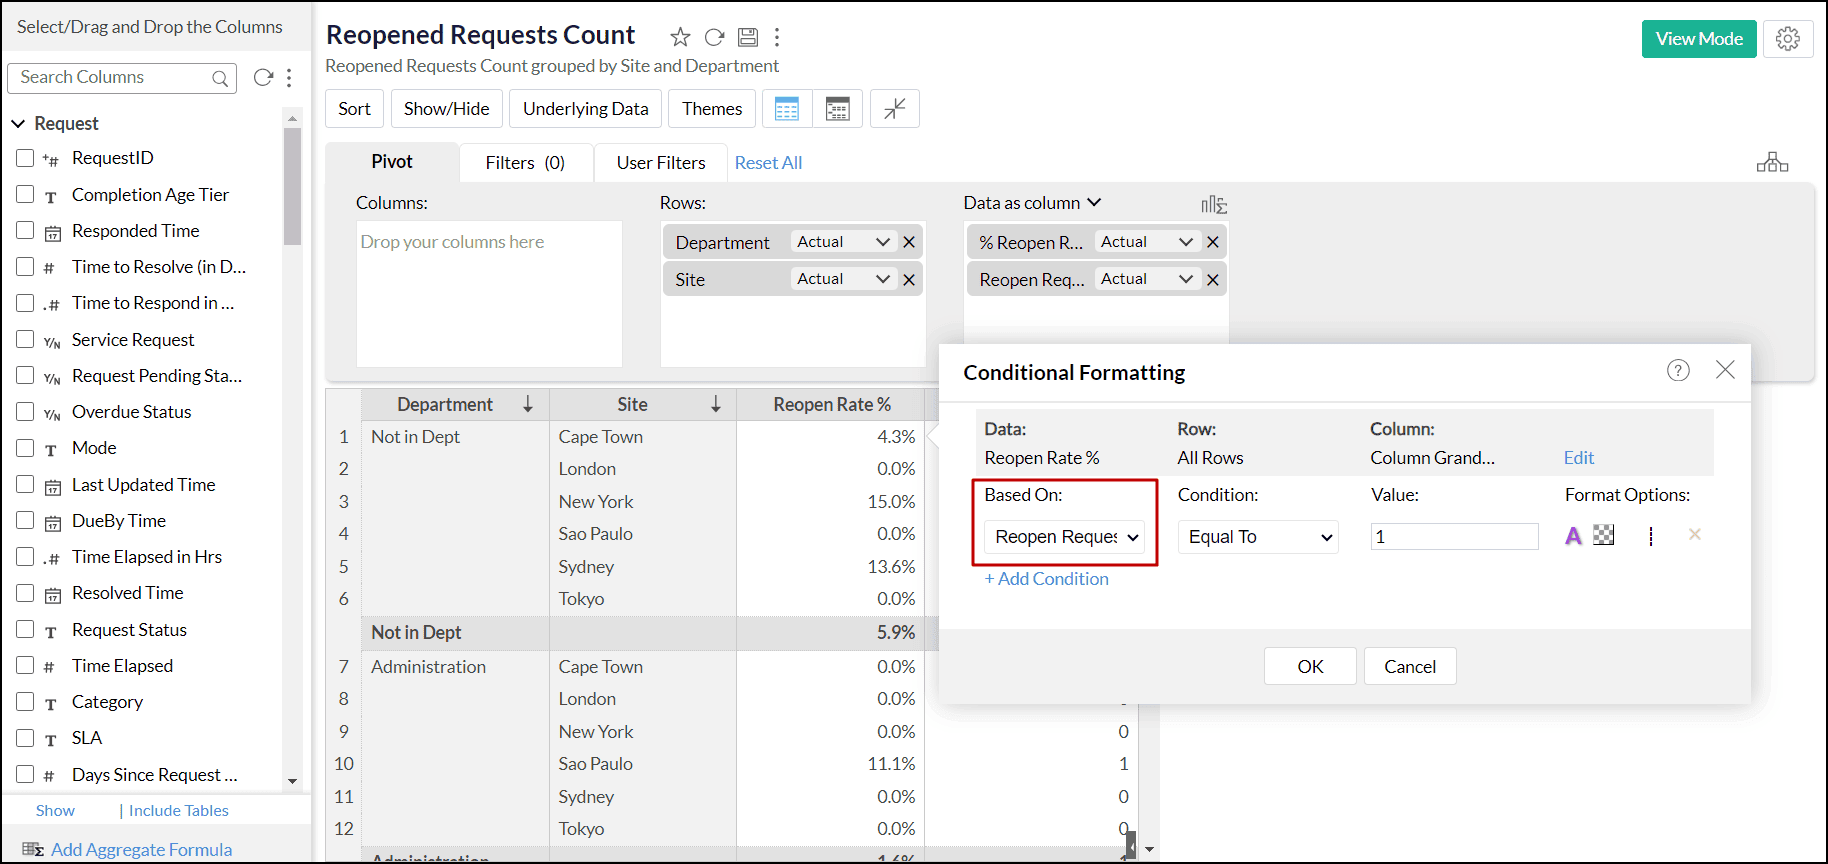
Conditional formatting advancements in Pivot table
EnhancementWith the latest update, you can now apply conditional formatting in pivot reports using values from columns other than the primary column in the configured condition. Click here to learn more.
Inline embed component for dashboards
EnhancementAnalytics Plus now features an inline embed component within the dashboard designer page to add, modify, or delete embed custom HTML code effortlessly. Click here to learn more.
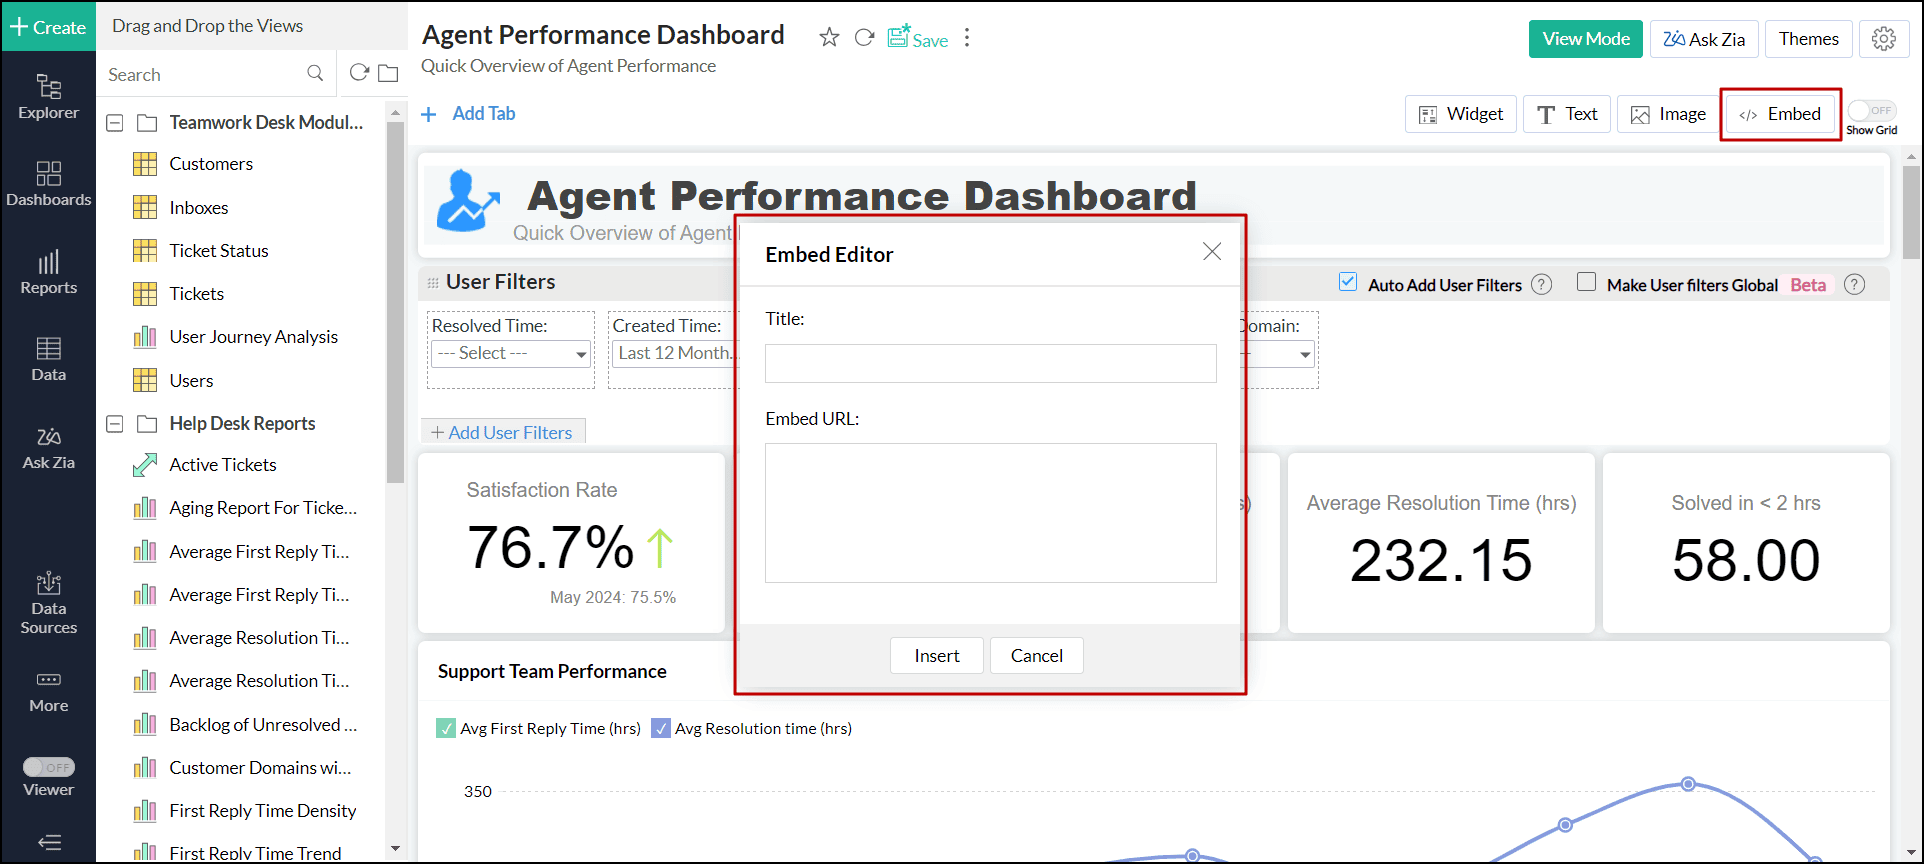
Image and custom icon support in KPI widgets
EnhancementYou can now add images and custom icons to the dashboard widget to provide visual cues about the type of information in the widget without the need for lengthy descriptions. Click here to learn more.

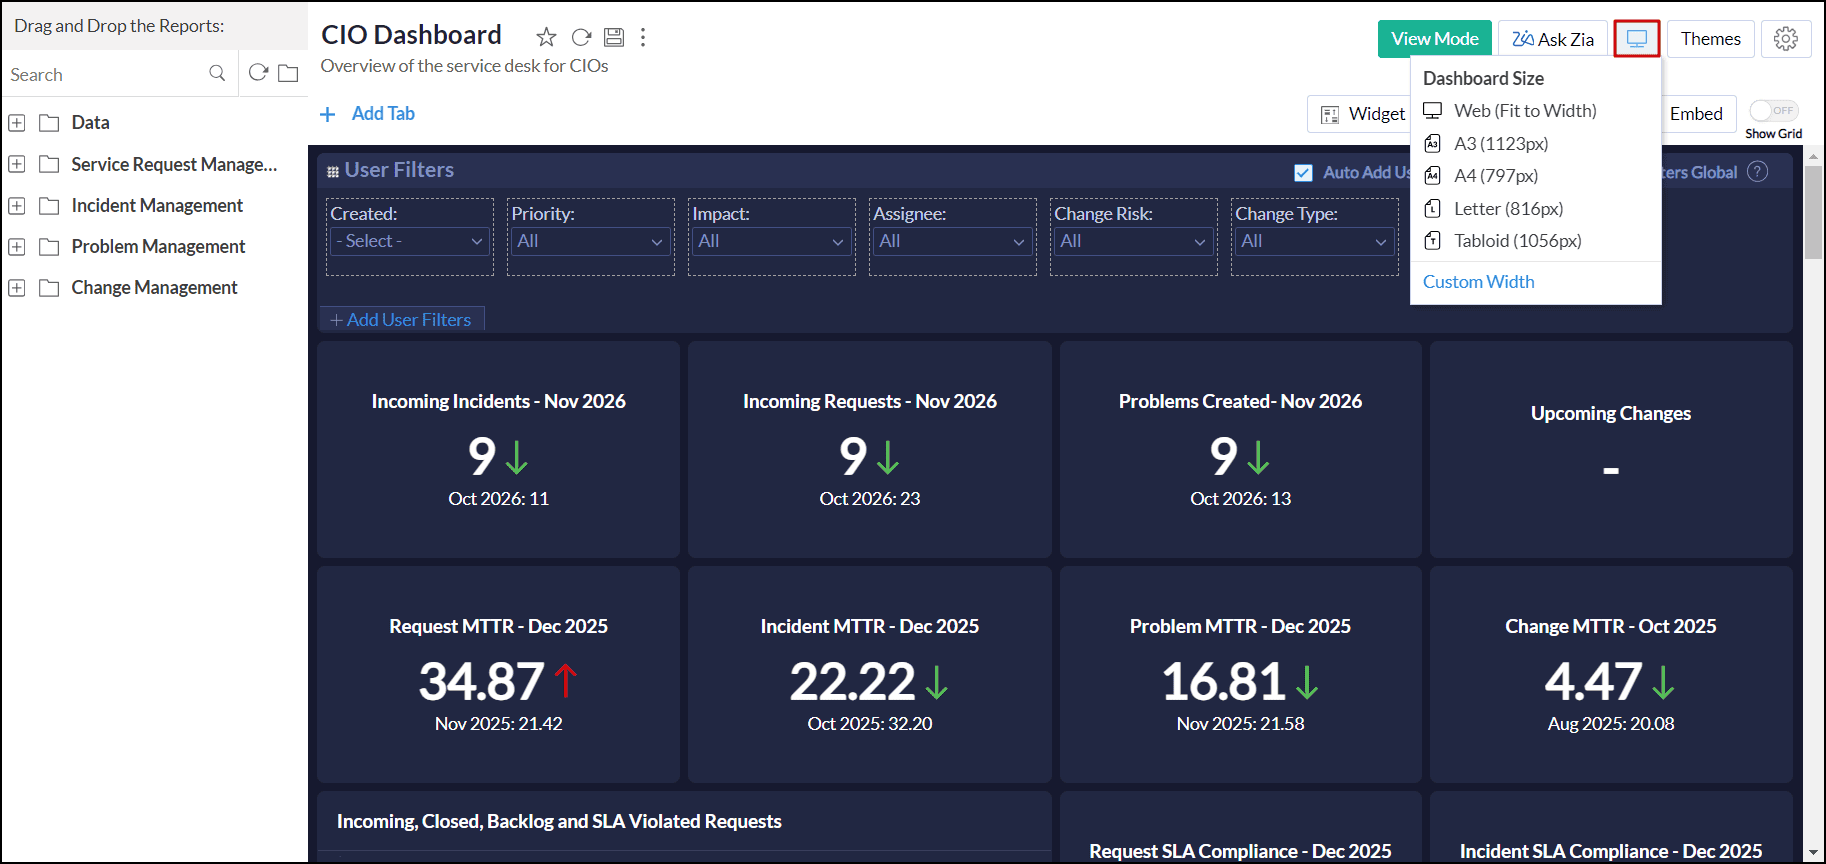
Dashboard layout advancements
EnhancementCustomize your dashboard layout to your preference with Analytics Plus' new resizing options. You can choose from a variety of options, including web, A3, A4, Letter, and Tabloid, or set a custom width to tailor the layout to your needs. Click here to learn more.
Report formula now supports text data type
EnhancementAnalytics Plus now supports the creation of report formulas using the Plain Text data type. Click here to learn more.
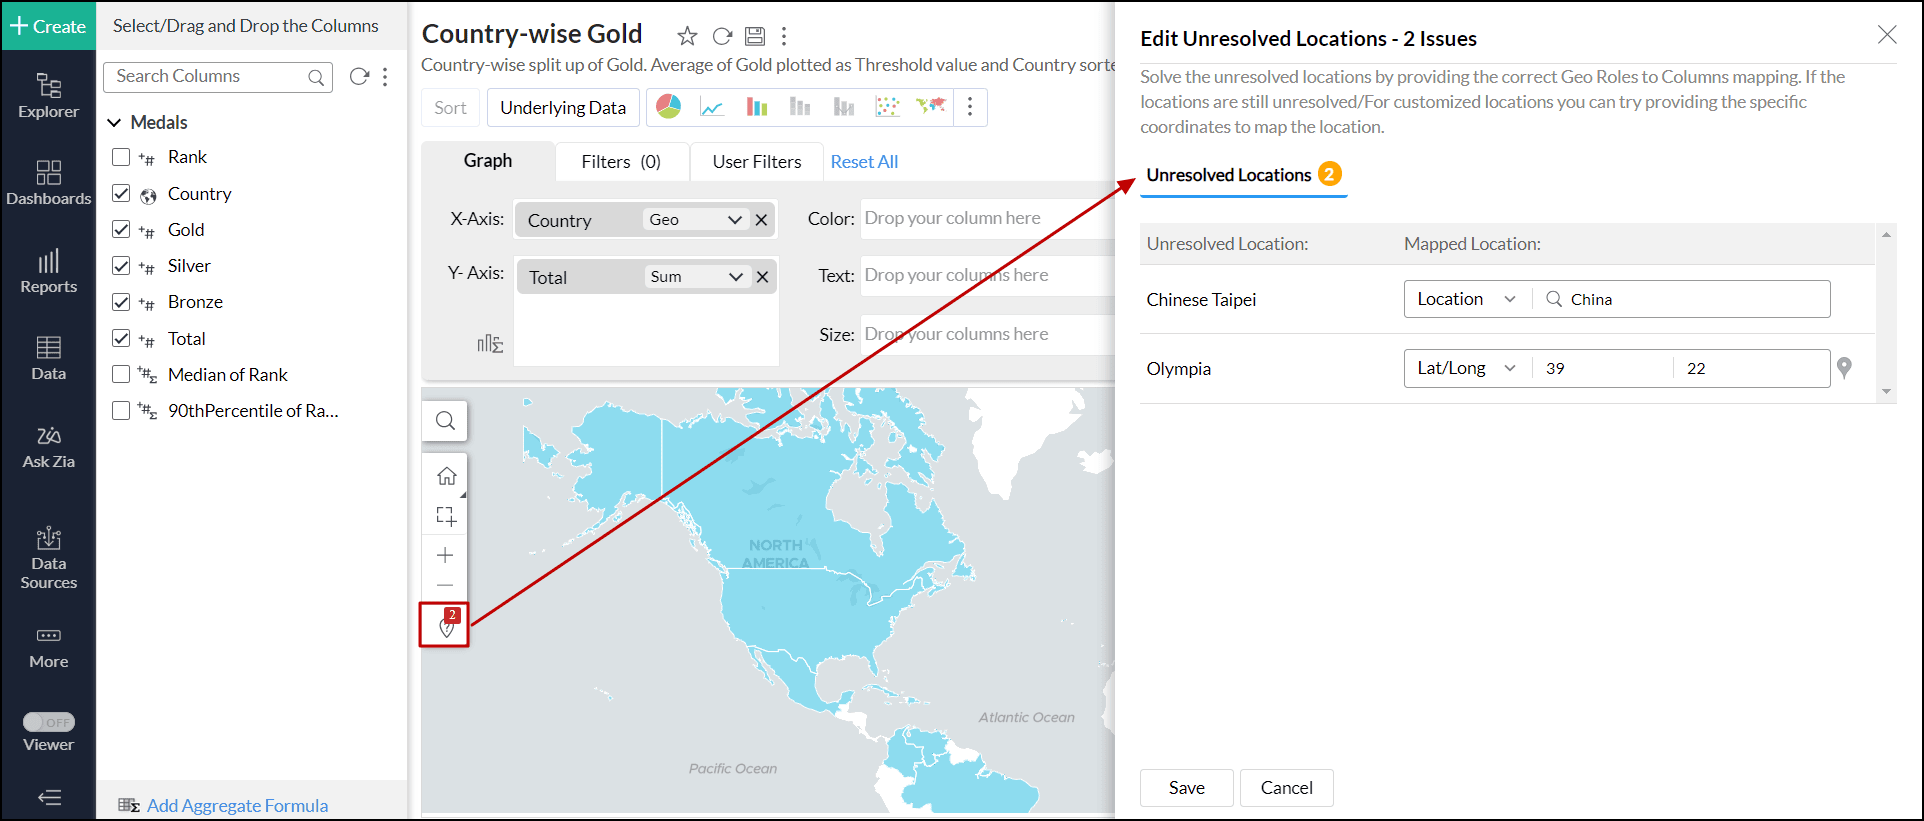
Enhanced geo location picker for Geo Maps
EnhancementAnalytics Plus now simplifies the process of resolving unidentified locations in Geo maps. You can search for the location or enter latitude and longitude information with a single click. Click here to learn more.

Enhancements to Workspace Migration
EnhancementWith the latest enhancements in workspace migration, you can now migrate workspace configurations including Import Schedulers, Users, Groups, Sharing Settings, Alerts, Snapshots, Email Schedules, Slideshows, and Public views.
Announcing support for the Arabic language
EnhancementAnalytics Plus' user interface now supports Arabic language in addition to other languages. Click here to know about the supported languages.
More enhancements
Enhancement- Auto Analysis option is now available under the Create New option within the respective table view to analyze data and create reports/dashboards automatically.
- When importing Excel files, you now have the option to select all the sheets at once, rather than having to choose them individually. Click here to learn more.
- Analytics Plus now allows you to create workspaces that combine both live connect and schedule sync data sources.
July
Build Number: 5500 (Release on: July 23, 2024)
Import data from Atlas Data Federation and Amazon Lightsail
NewIntroducing support for import from the following cloud databases for advanced reporting and analysis.
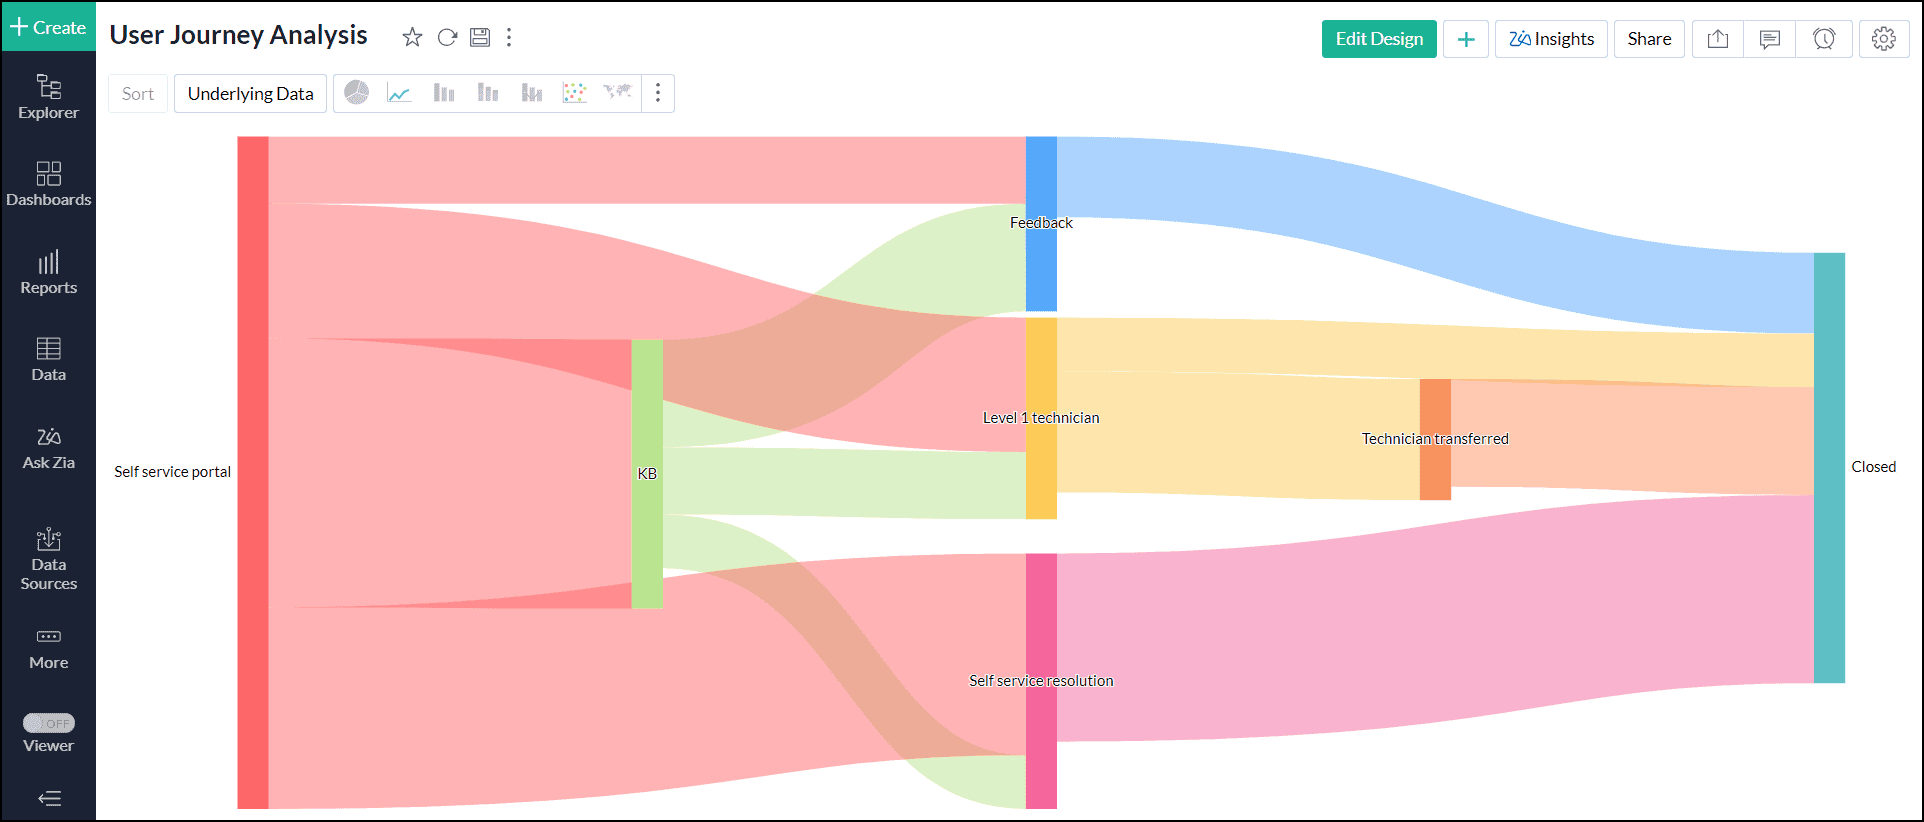
Rolling out workflow charts
NewIntroducing Sankey charts, a new chart type to visualize complex workflows and stages of a process or a procedure. Click here to learn more.
Introducing two new chart types
NewAnalytics Plus introduces support for Race Bar and Race Line charts, providing dynamic, animated visualizations to track changes in data trends over time. Click here to learn more.
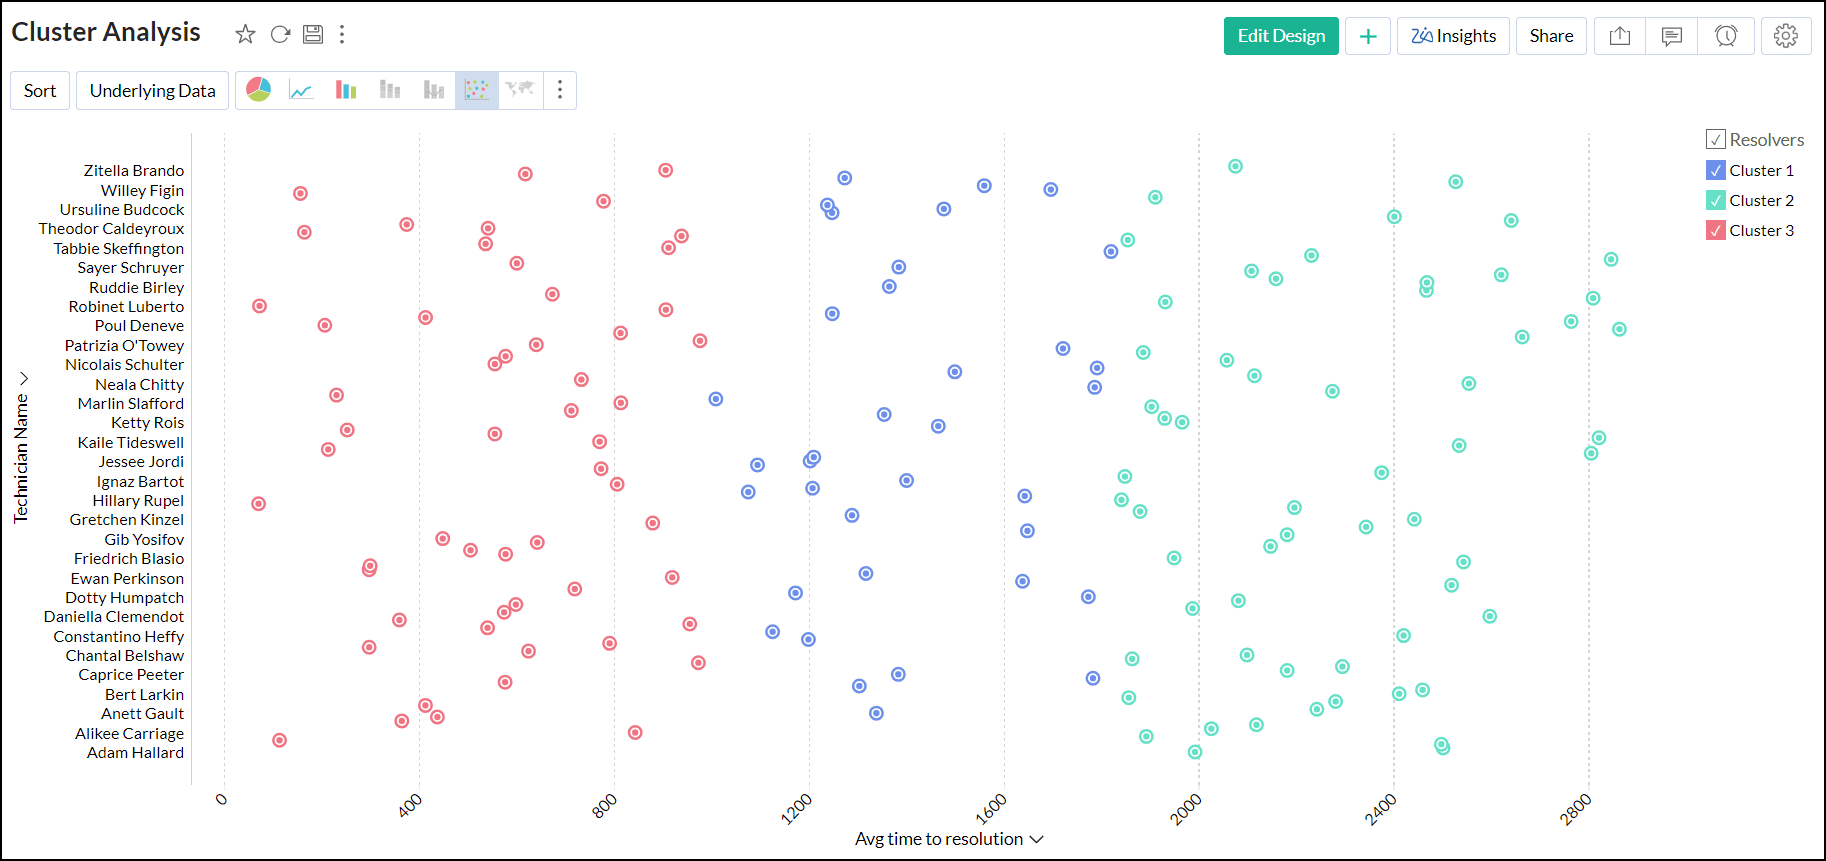
Unveiling cluster analysis
NewCluster analysis allows you to group similar data points based on specific criteria, simplifying large datasets, uncovering hidden structures and relationships, and making the data more understandable and easier to analyze. Click here to learn more.
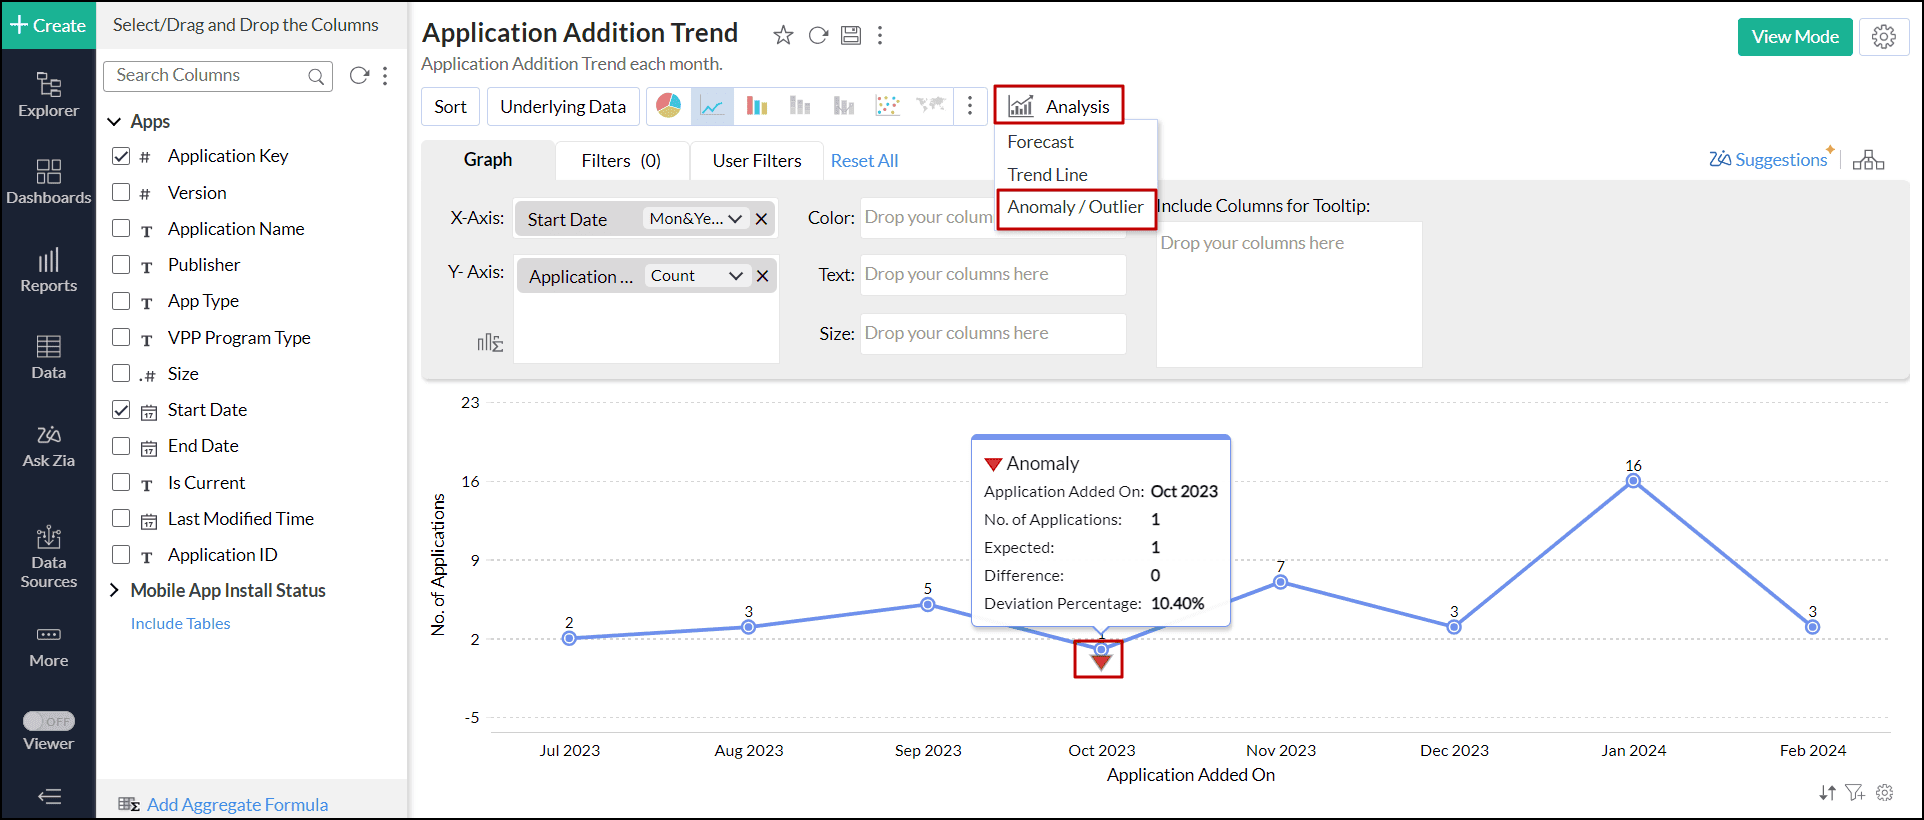
Spot anomalies in charts effortlessly
EnhancementWith Analytics Plus, identifying variations in your data becomes seamless. You can easily detect spikes or dips in metrics when they display a high degree of deviation from the norm. Click here to learn more.
Dashboard Enhancements
Enhancement1. Auto-merging of user filters
When Analytics Plus auto-adds report user filters to the dashboard, filters with the same column name and type will now merge automatically without any manual mapping. Click here to learn more.

2. Inline text editor
Analytics Plus now includes an inline text editor, allowing you to add richly formatted text and images directly within the dashboard editor for a seamless user experience. Click here to learn more.

3. Wrap text
With the new wrap text feature, you can easily prevent text from overflowing into adjacent dashboard components and enhance readability. Click here to learn more.
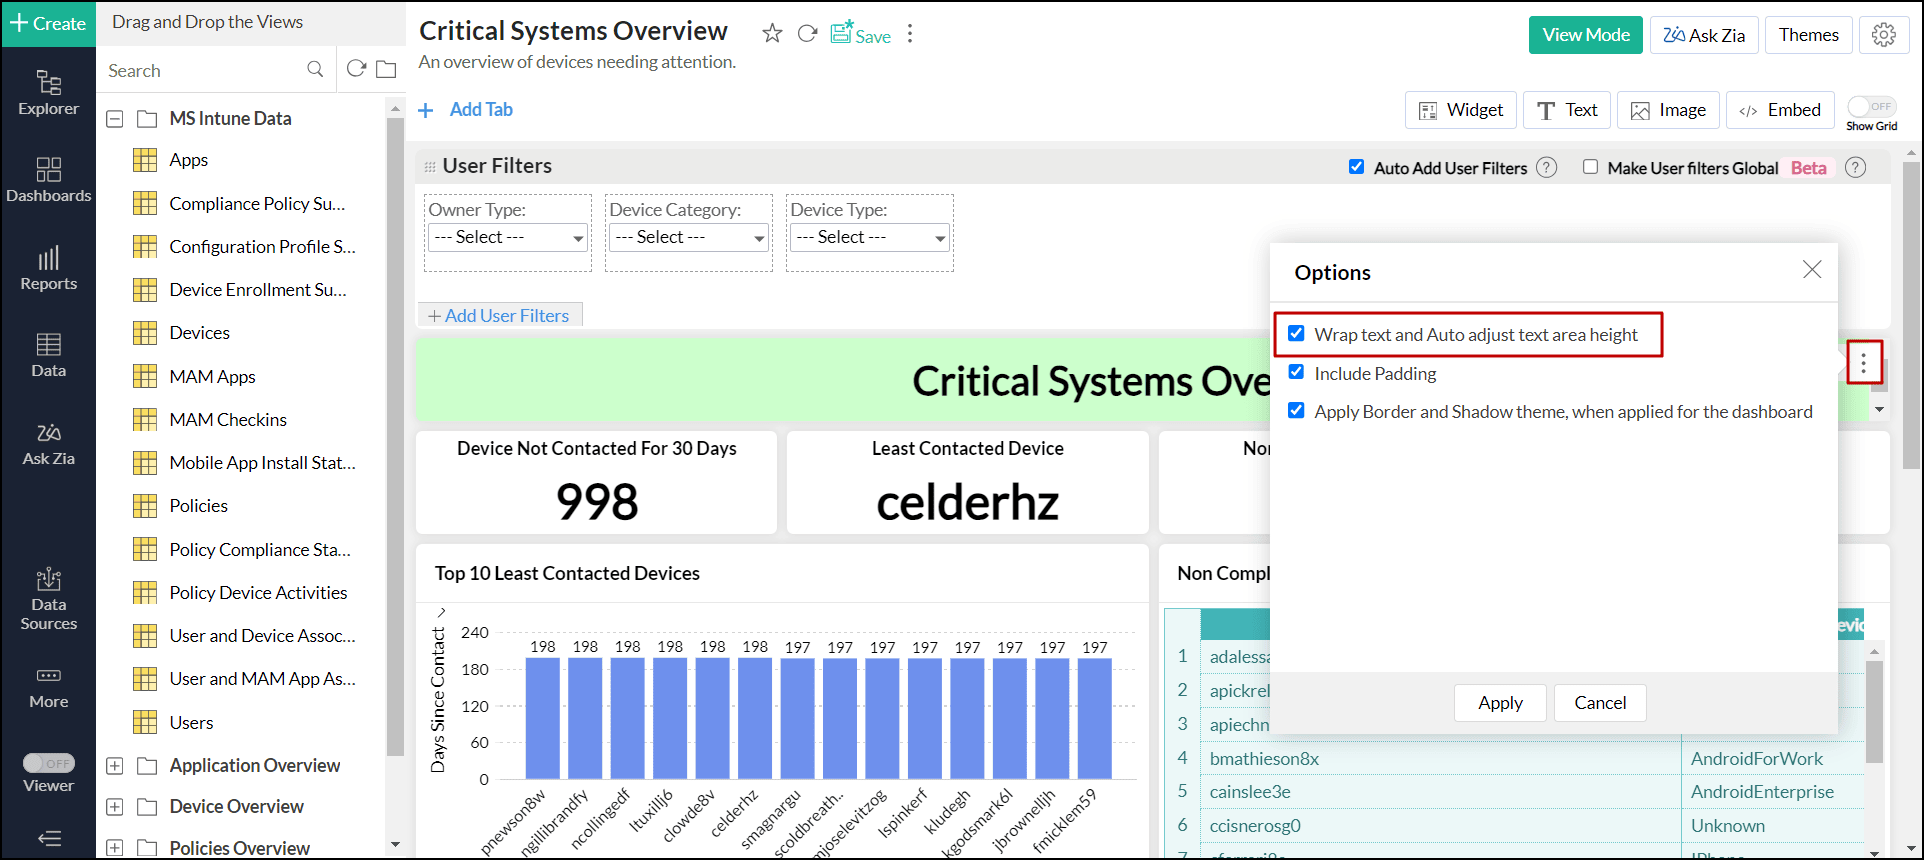
Chart advancements
EnhancementIn charts, the column that serves as a dependent or base column for summarizing values can now be freely moved to any other field in the chart editor.
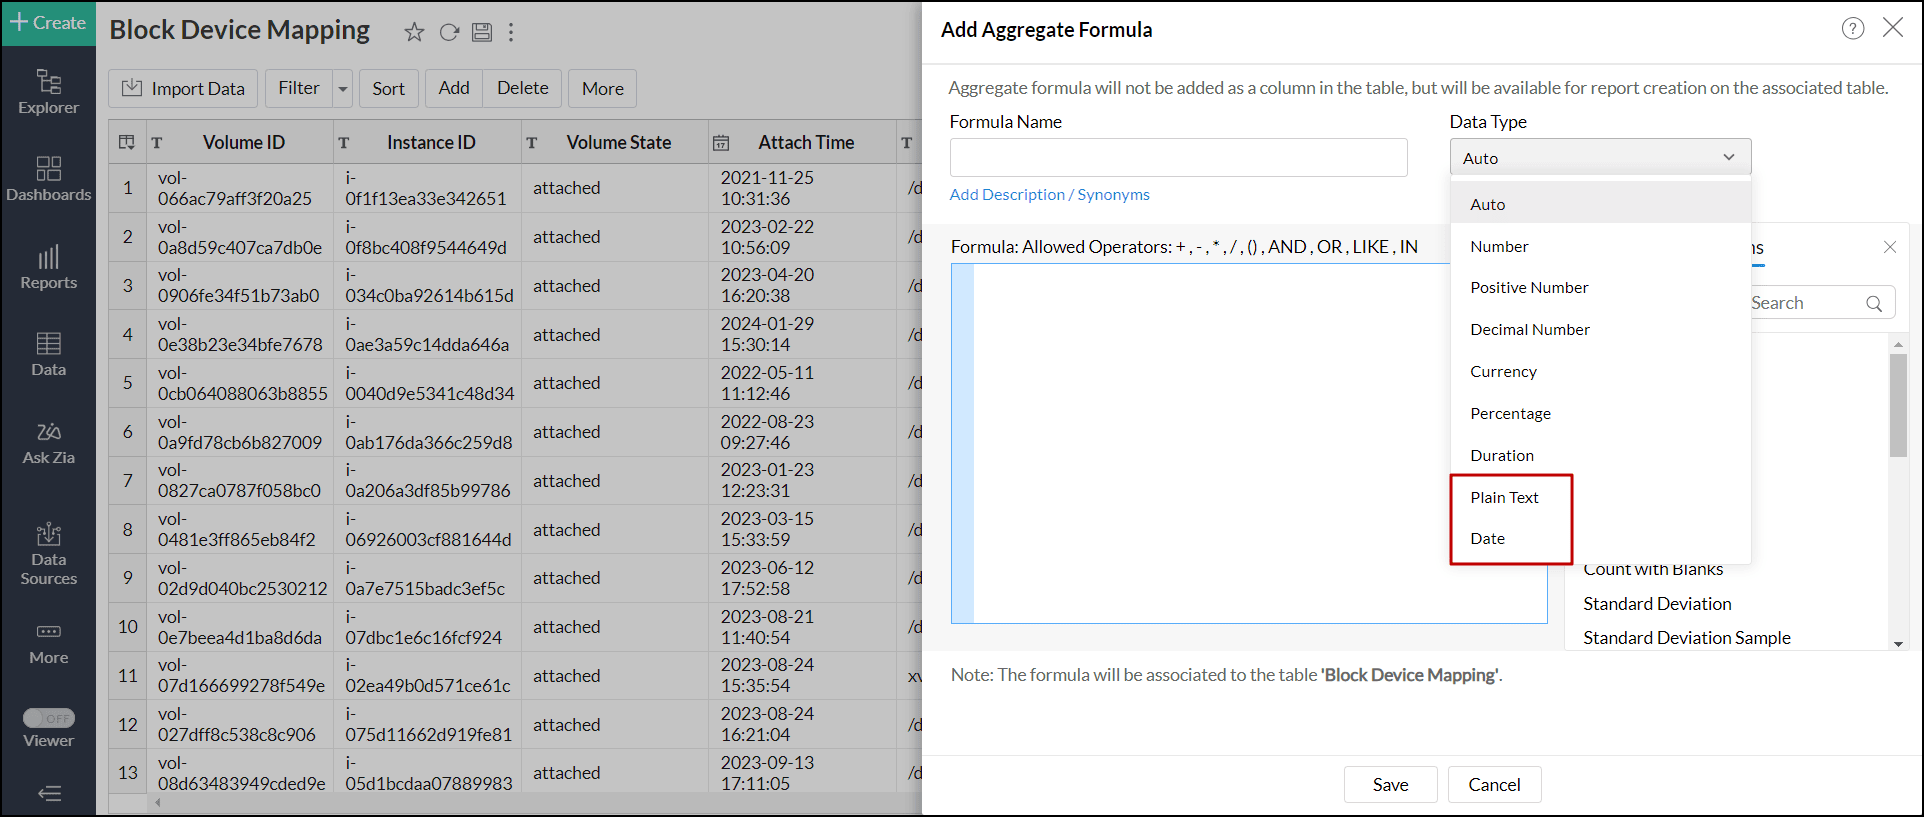
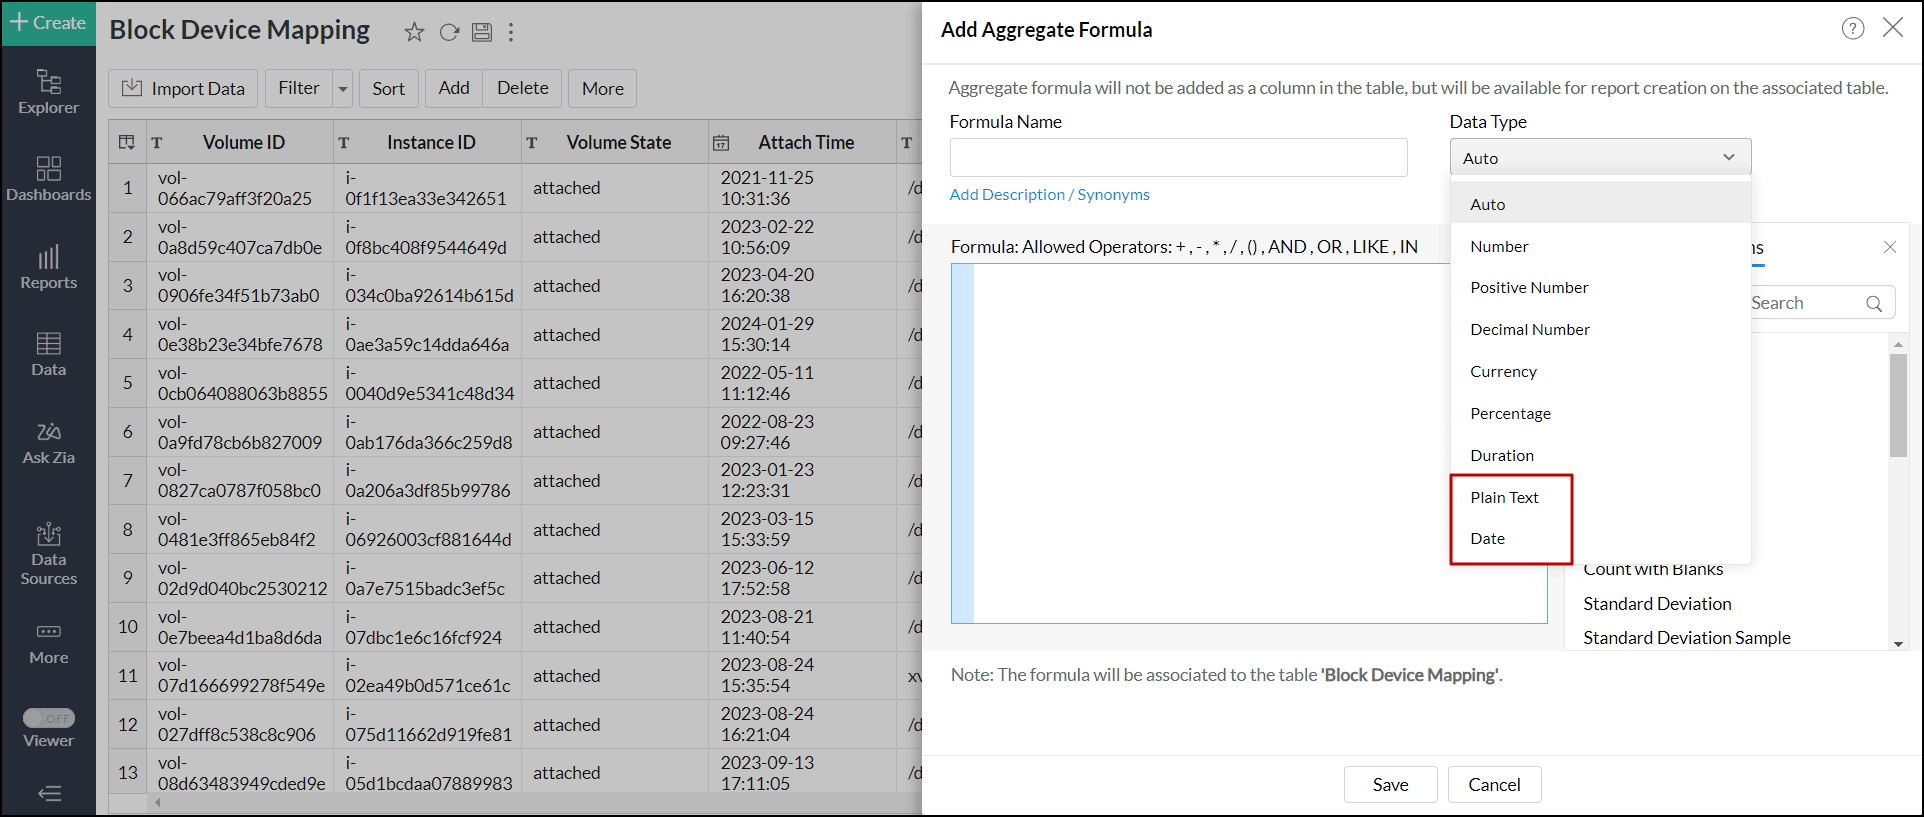
Aggregate formula now supports new data types
EnhancementAnalytics Plus now supports the creation of aggregate formulas using data types like Plain Text and Date. Click here to learn more.
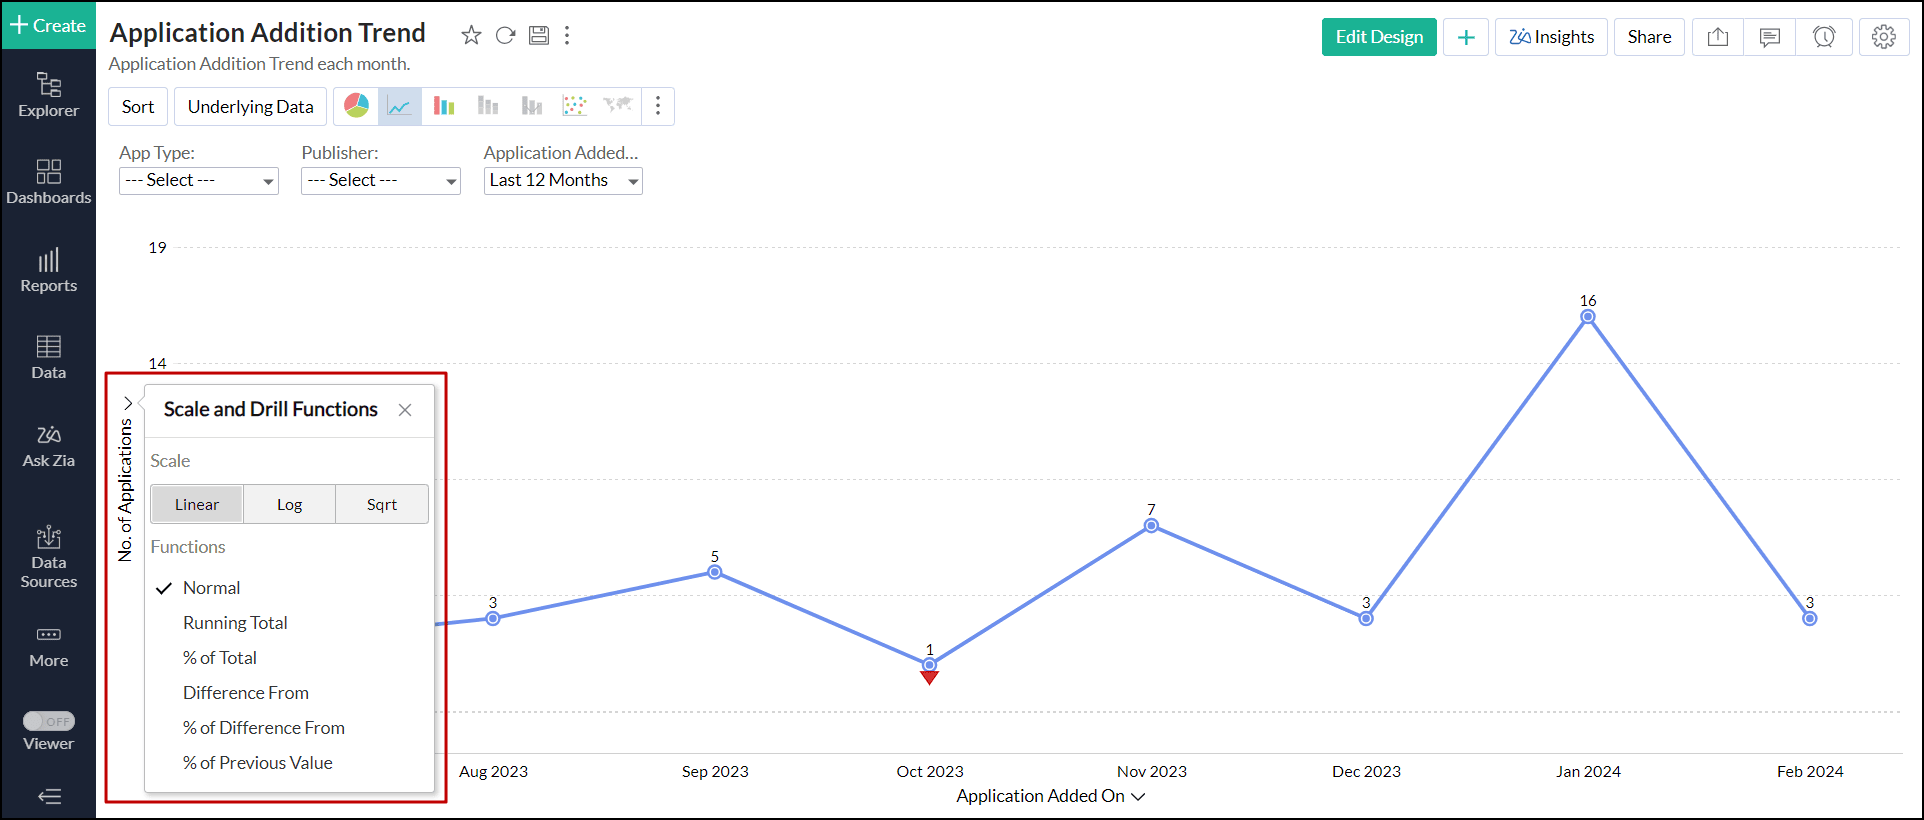
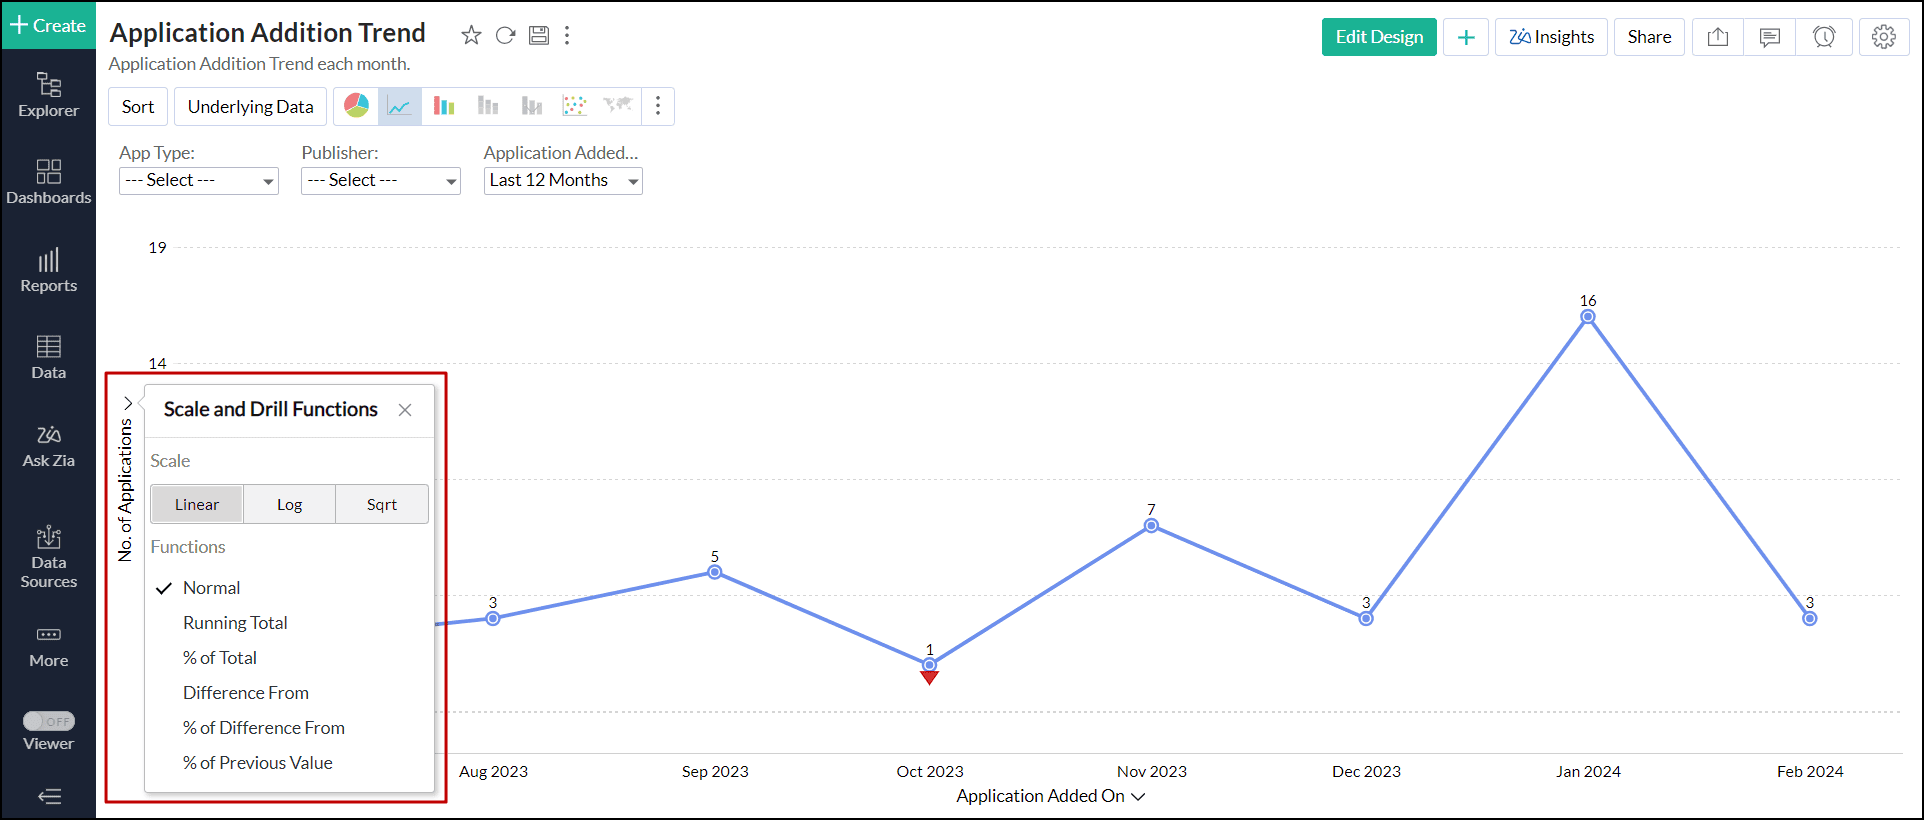
Change scale type and summary functions in real-time
EnhancementDynamically switch scale types and apply advanced summary functions to numeric data columns directly from the chart's view mode. Click the corresponding links to learn more.
Renaming columns in query table
EnhancementIn query tables, you can now rename columns even if they have dependent views or other query tables based on them. Click here to learn more.
Hide vertical lines in pivot table
EnhancementAnalytics Plus now provides an option to hide vertical lines in pivot tables, enhancing the readability and clarity of reports for a more insightful data analysis experience. Click here to learn more.

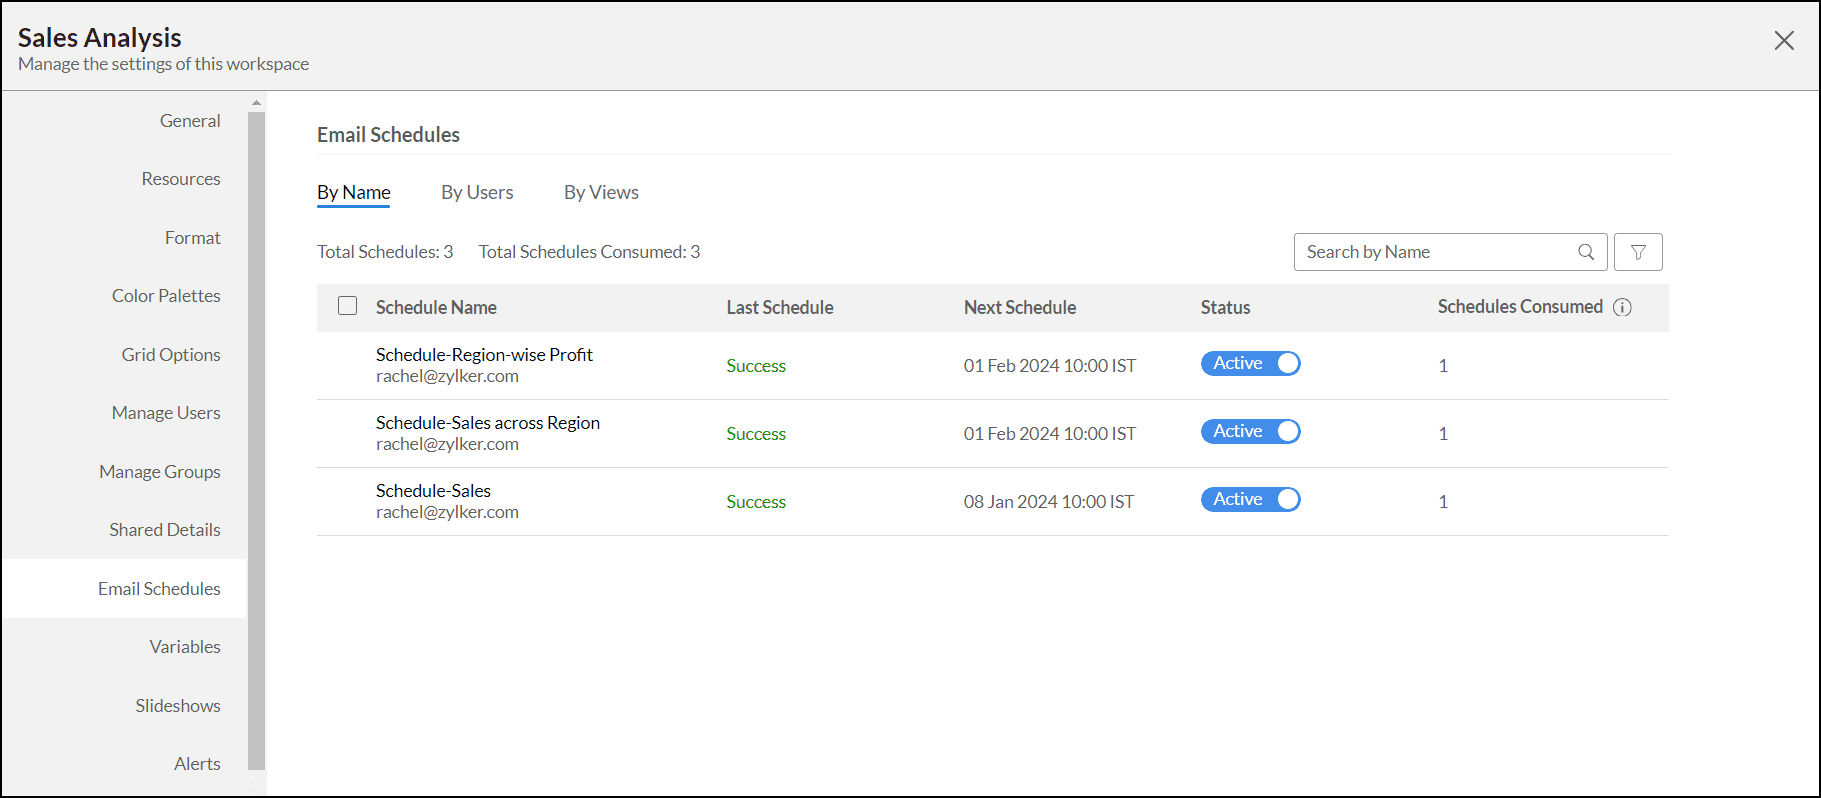
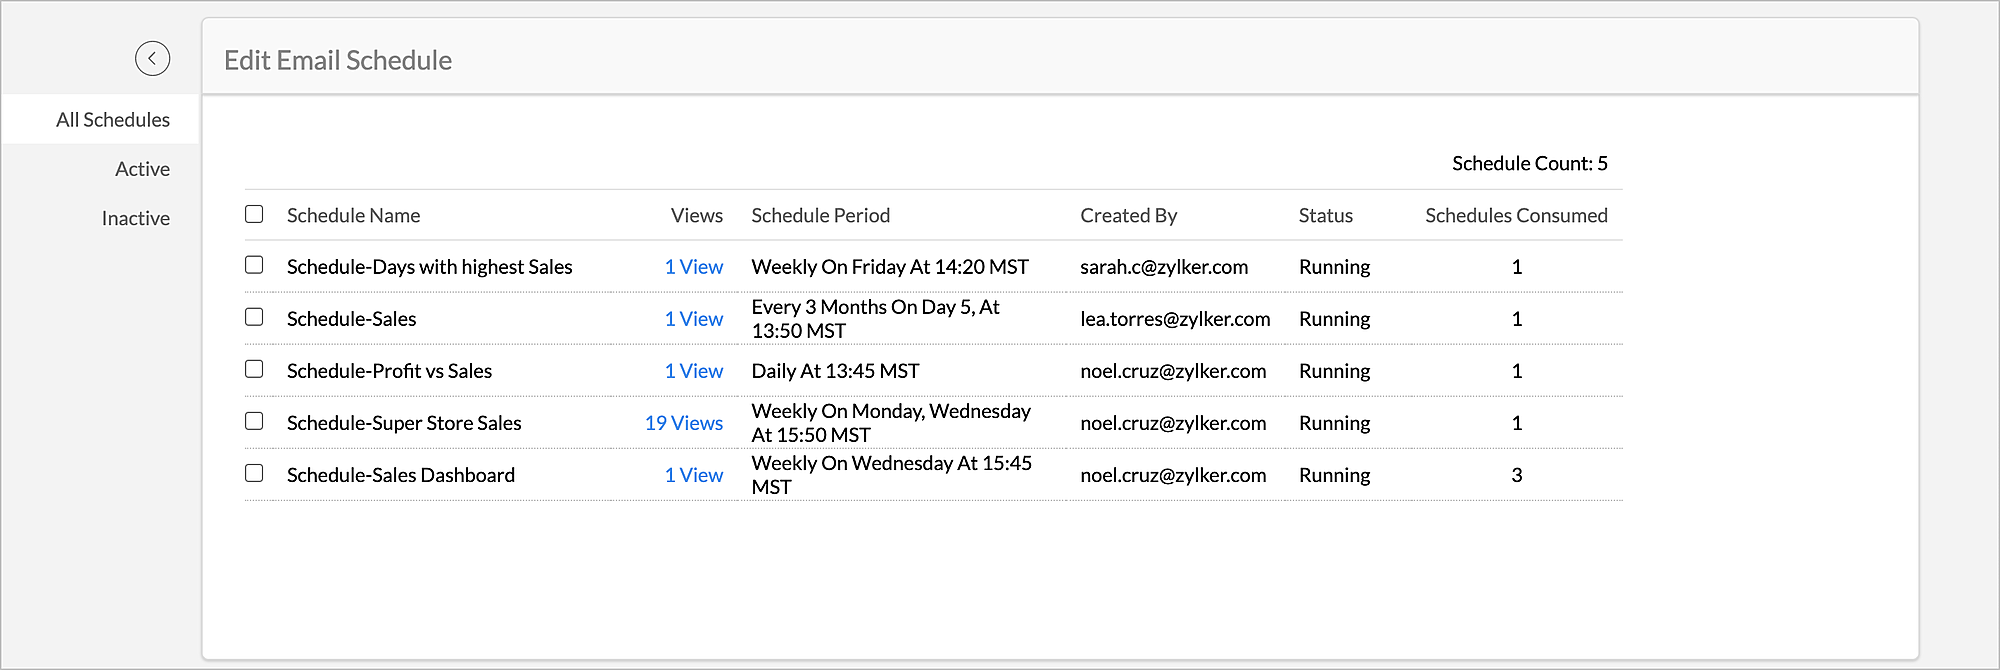
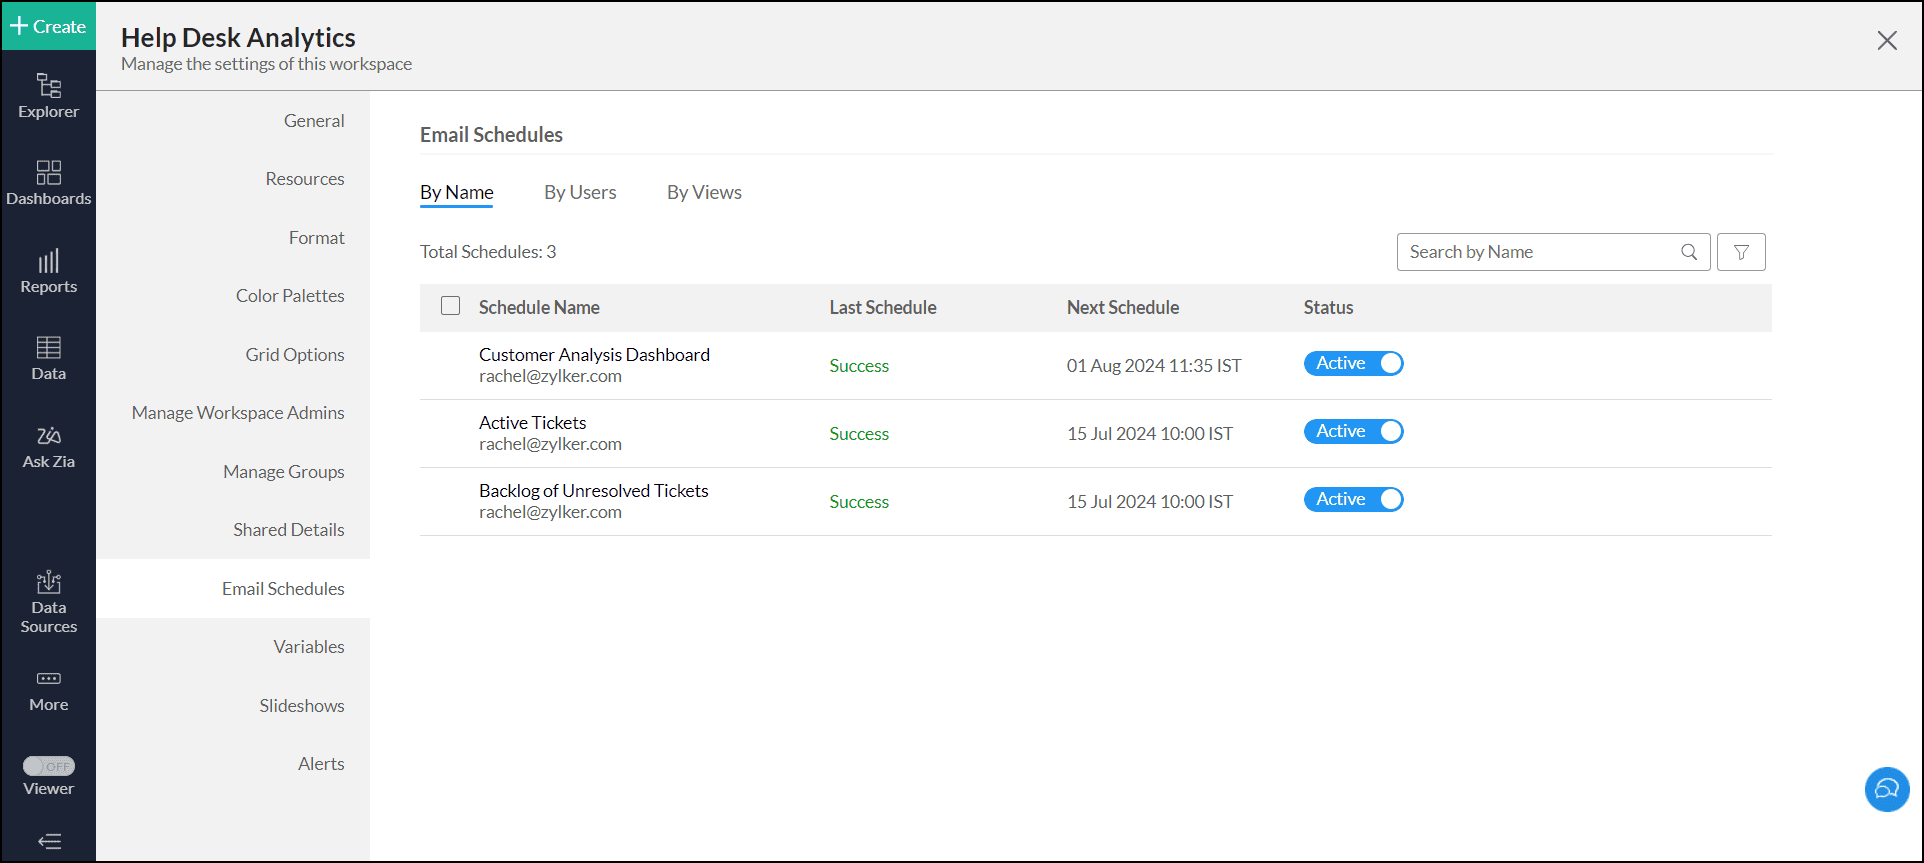
Enhancements in managing email schedule
EnhancementYou can now easily oversee and manage all email schedules for the workspace from one location. Analytics Plus offers simplified email schedule management by centralizing all the controls within the workspace settings page. Click here to learn more.
Currency formatting enhancement for Formula Column and Aggregate Formula
EnhancementWhen you create a formula column or aggregate formula column over a column that is marked as a currency data type, the newly created formula column inherits the same data type (currency) automatically. Click here to learn more.
Introducing Live Connect support for HSQL local database
EnhancementAnalytics Plus now allows you to connect live with HyperSQL(HSQL) local database. Click here to learn more.
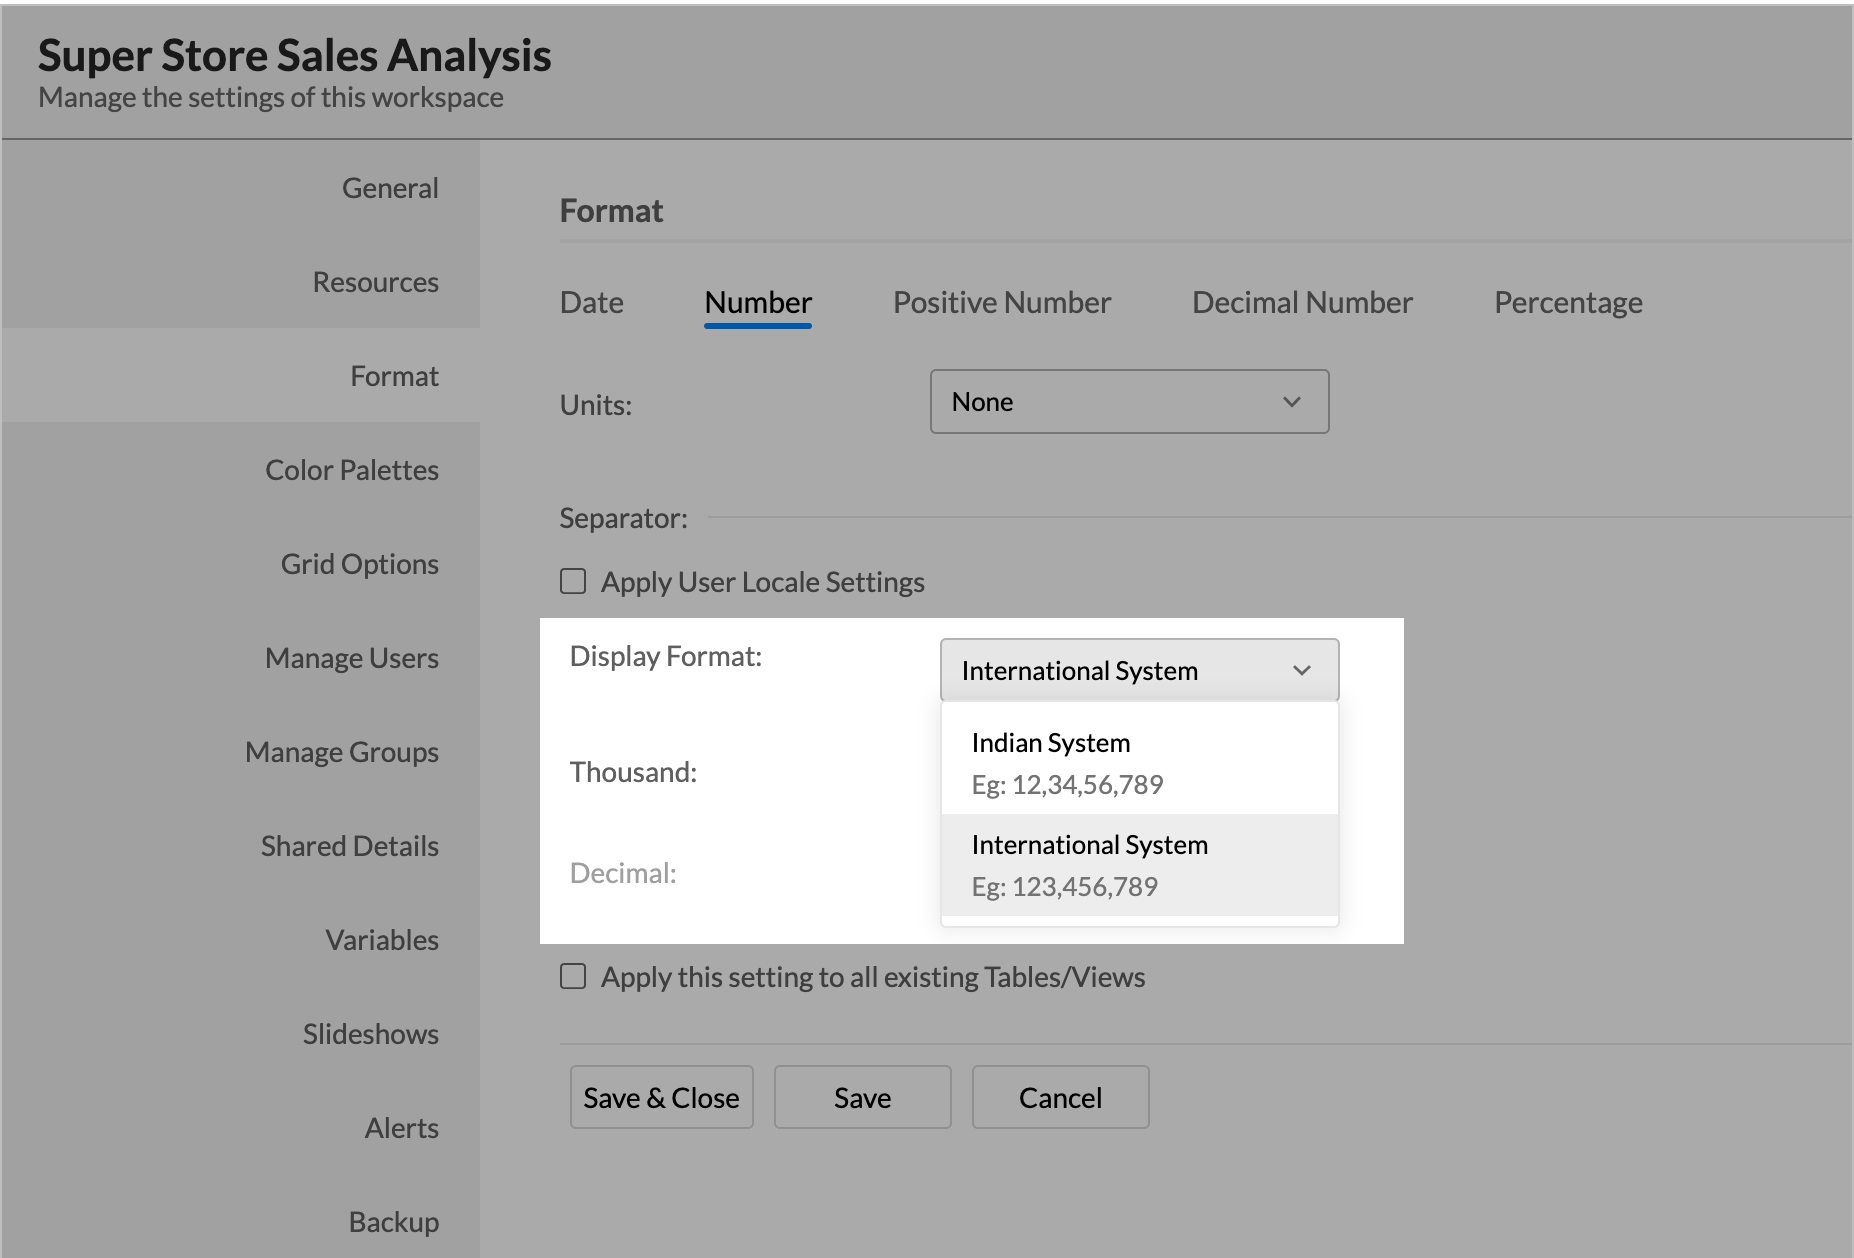
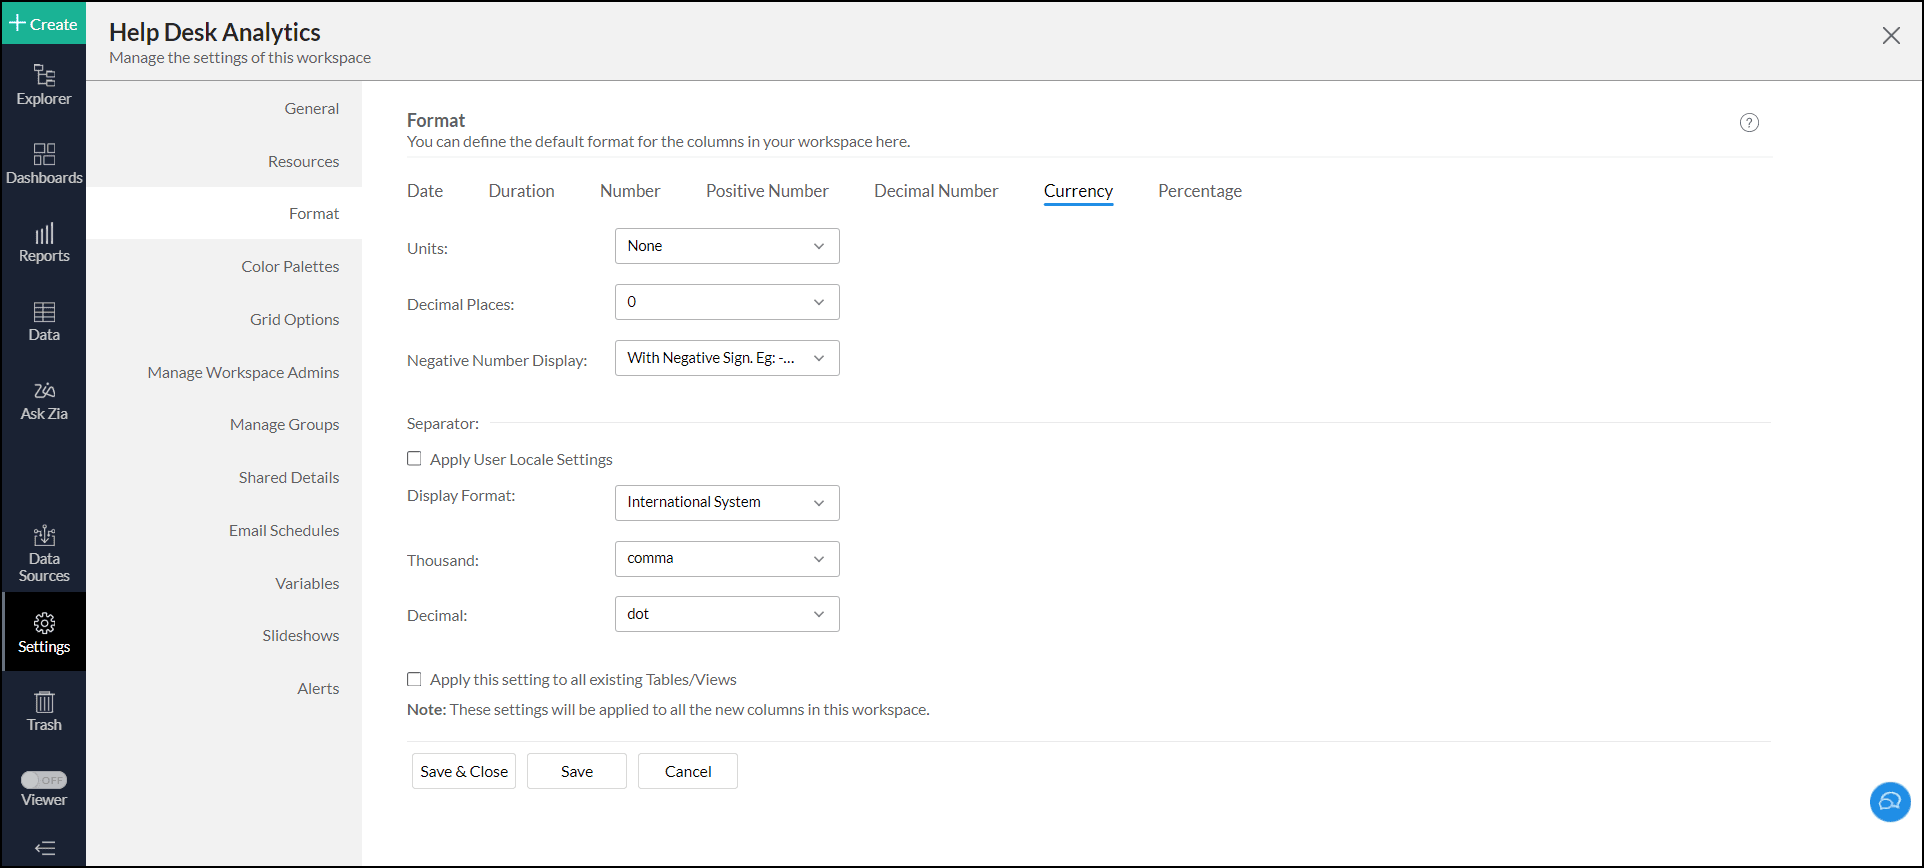
Workspace Level Currency Formatting
EnhancementYou can now have a unified and consistent currency format across all reports and dashboards. Analytics Plus allows you to configure and modify the display format of currency data types directly from the workspace settings. Click here to learn more.
Key update regarding OpManager Integration
EnhancementTo set up a new OpManager integration in Analytics Plus build 5500, users need OpManager Manager build 126000 or higher. Existing OpManager integrations with build 126000 or lower will remain functional in Analytics Plus build 5500. However, future versions of Analytics Plus (above build 5500) will only be compatible with OpManager Manager build 126000 or higher for both existing and new integrations.
Analytics Plus versions older than 5500, remain compatible with OpManager versions below 126000.
June
Build Number: 5420 (Release on: June 25, 2024)
Launching out-of-box analytics for RMM Central Integration
NewAdvanced analytics for RMM Central empowers IT teams with real-time insights to enhance system reliability, optimize performance, bolster security defenses, and improve overall business efficiency and productivity. Click here to learn more.
June
Build Number: 5410 (Release on: June 04, 2024)
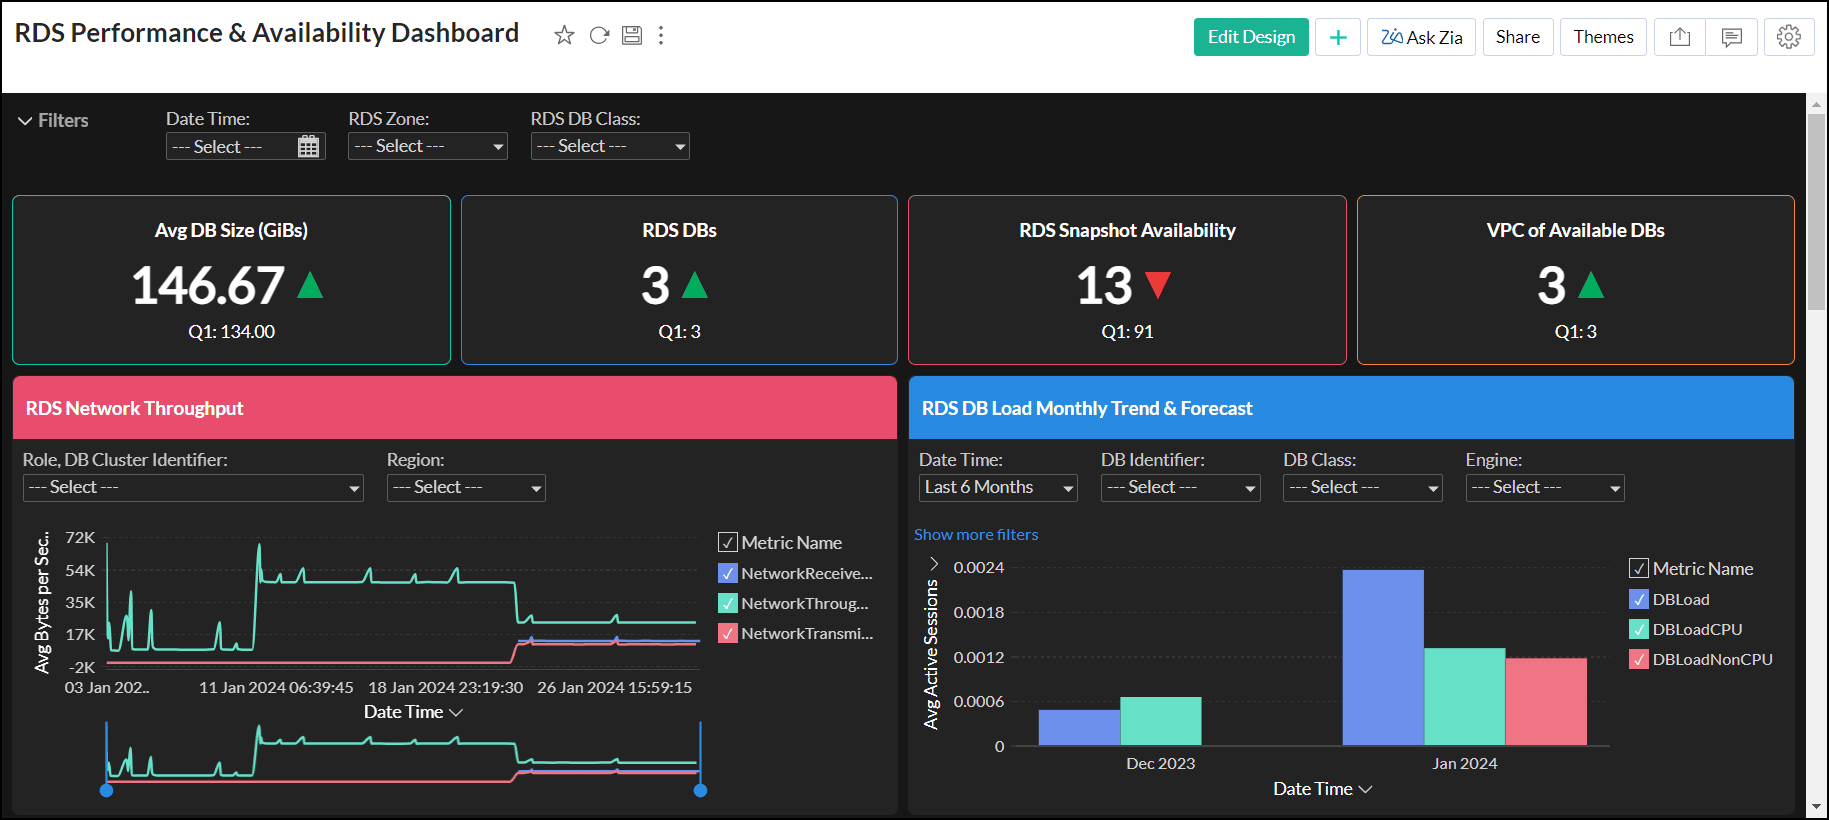
Introducing out-of-box analytics for Amazon CloudWatch
NewIntroducing advanced analytics for Amazon CloudWatch, which enables you to collect, visualize, and monitor all your Amazon Web Service resources across different regions in a unified window. Click here to learn more.
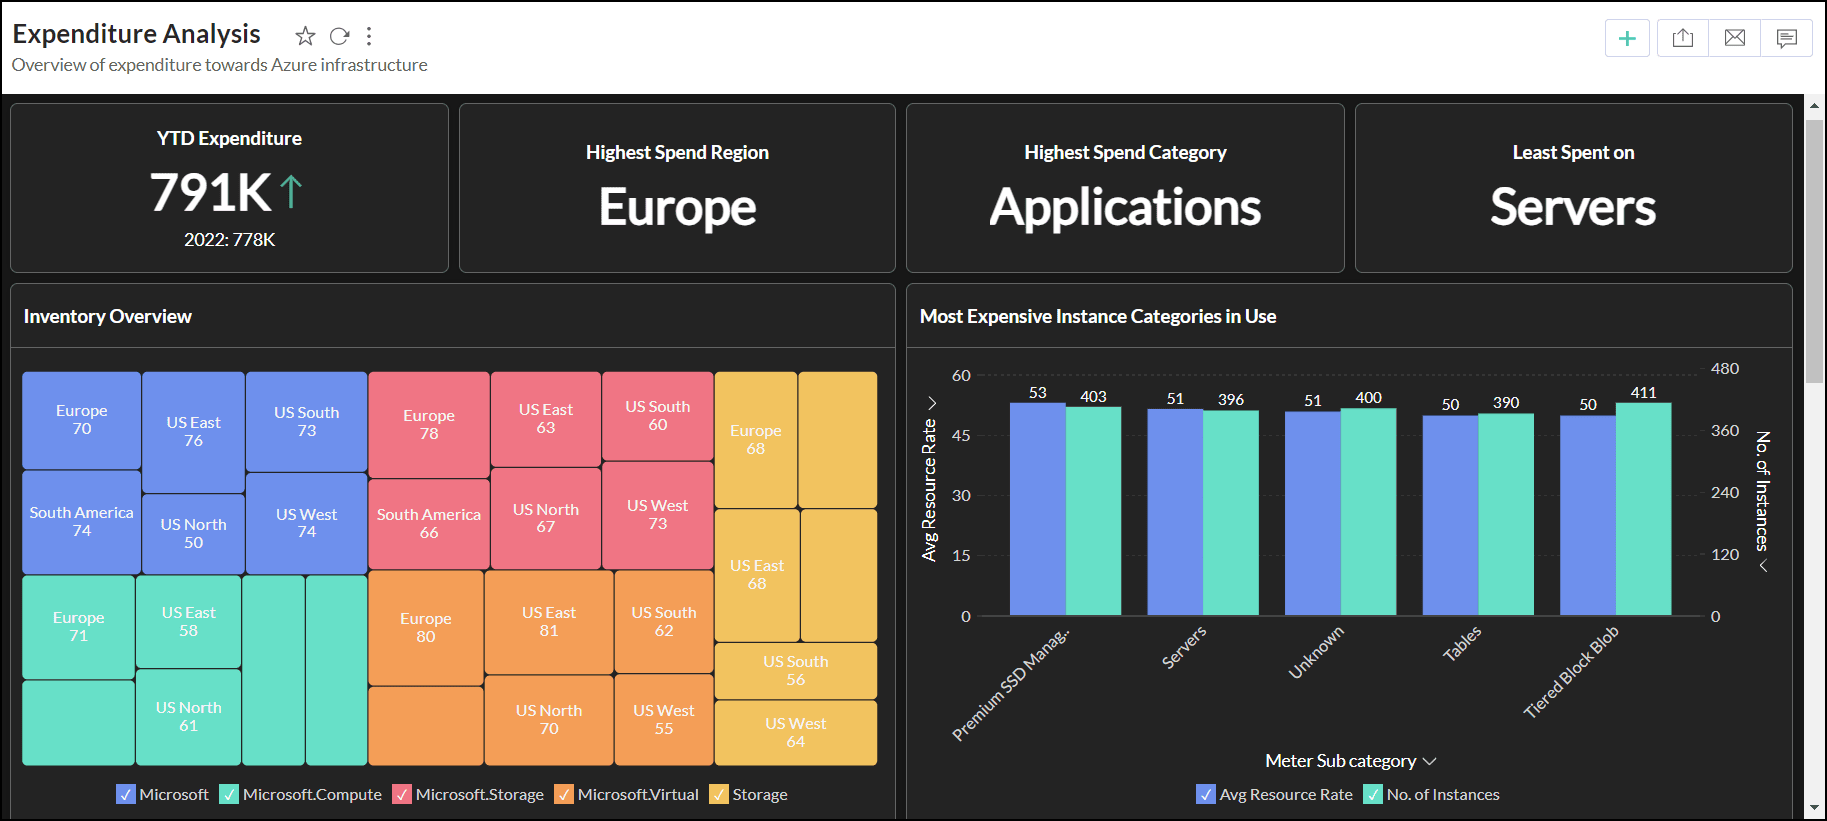
Advanced analytics for Azure Cost and Usage
NewLaunching the advanced analytics connector for Azure Cost and Usage to analyze and identify cost drivers and anomalies in your Azure subscription. This helps in optimizing and maximizing resource usage. Click here to learn more.
Unveiling Smartsheet Integration
NewAnalytics Plus integrates with Smartsheet, allowing you to efficiently manage risks and track the key project metrics to scale up operational efficiency. Click here to learn more.
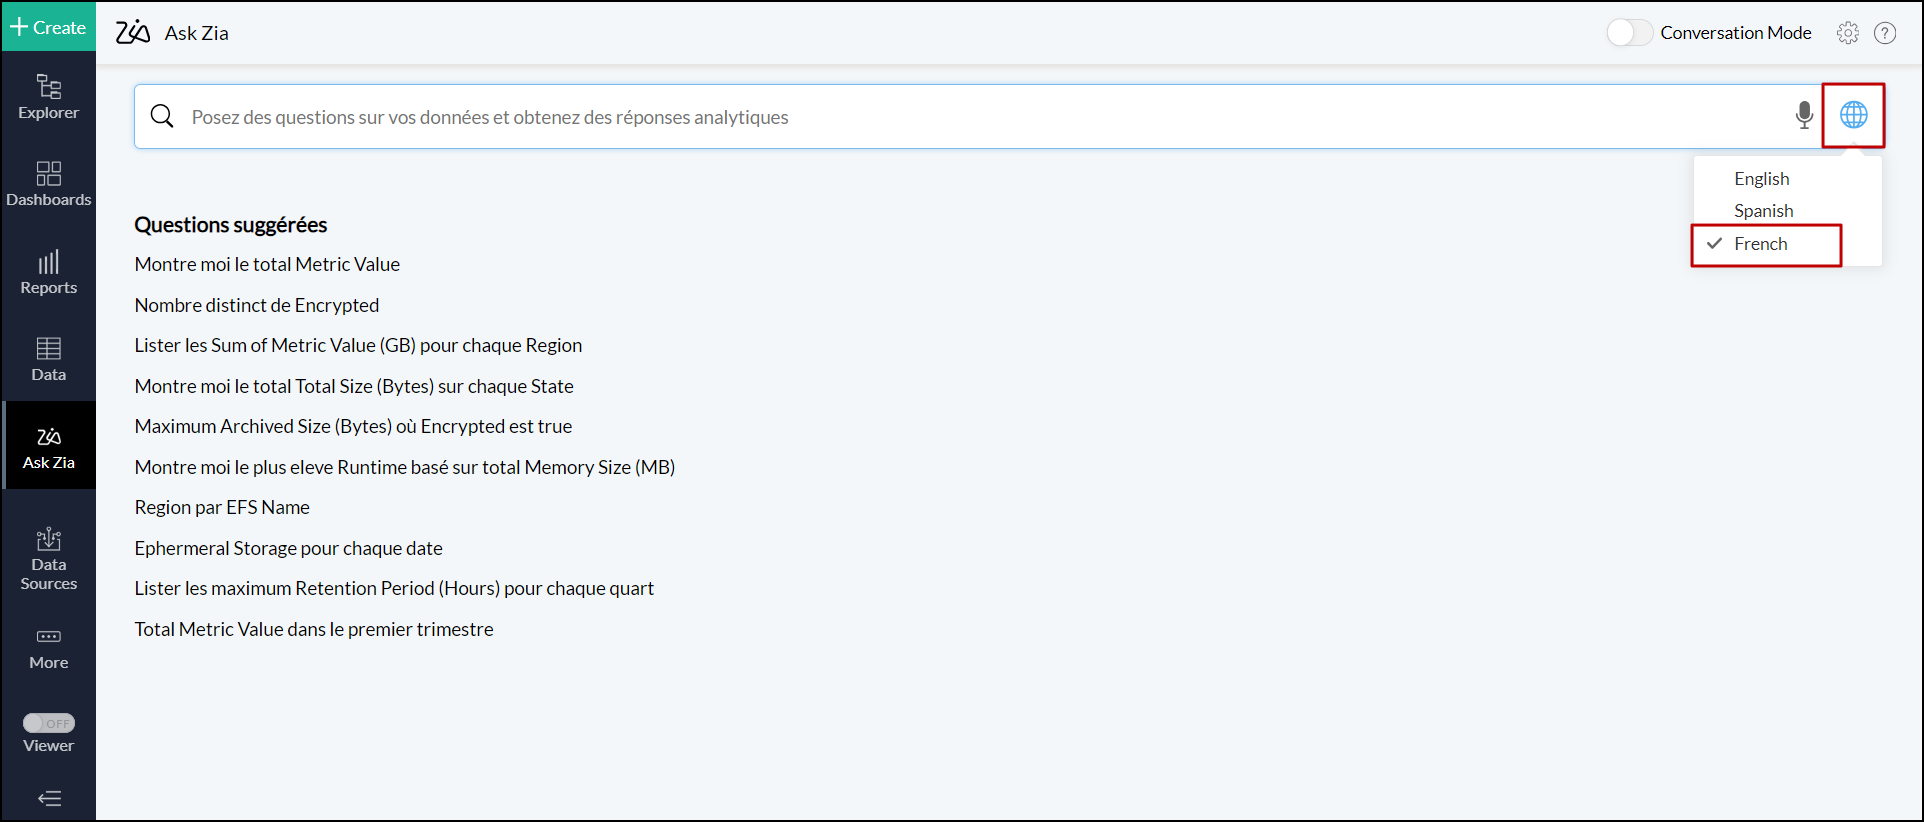
Interact with Ask Zia in French (Beta)
EnhancementYou can now engage in conversations with Ask Zia in French (Beta) language. Click here to learn more.
Issues fixed
Issues fixed- A critical security vulnerability that allows unauthorized access to run or expose the local files in the web servers has been identified and fixed.
- A vulnerability that facilitates the execution of malicious SQL statements leading to the retrieval of sensitive content from the database is now fixed.
May
Build Number: 5400 (Release on: May 13, 2024)
Commenting in Analytics Plus' Dashboards app
NewThe Dashboards app for Analytics Plus now supports commenting. You can easily collaborate with your team and make decisions on the go. It also comes with a variety of interactive options, such as tagging other users to grab attention, liking the messages, attaching files, and much more. Click here to learn more.
Show missing values in Charts
EnhancementThe Show Missing Values option is now supported in Heat Map reports. On enabling this option, Analytics Plus assigns a color to the missing values to create a complete visualization without any white or blank spaces. Click here to learn more.
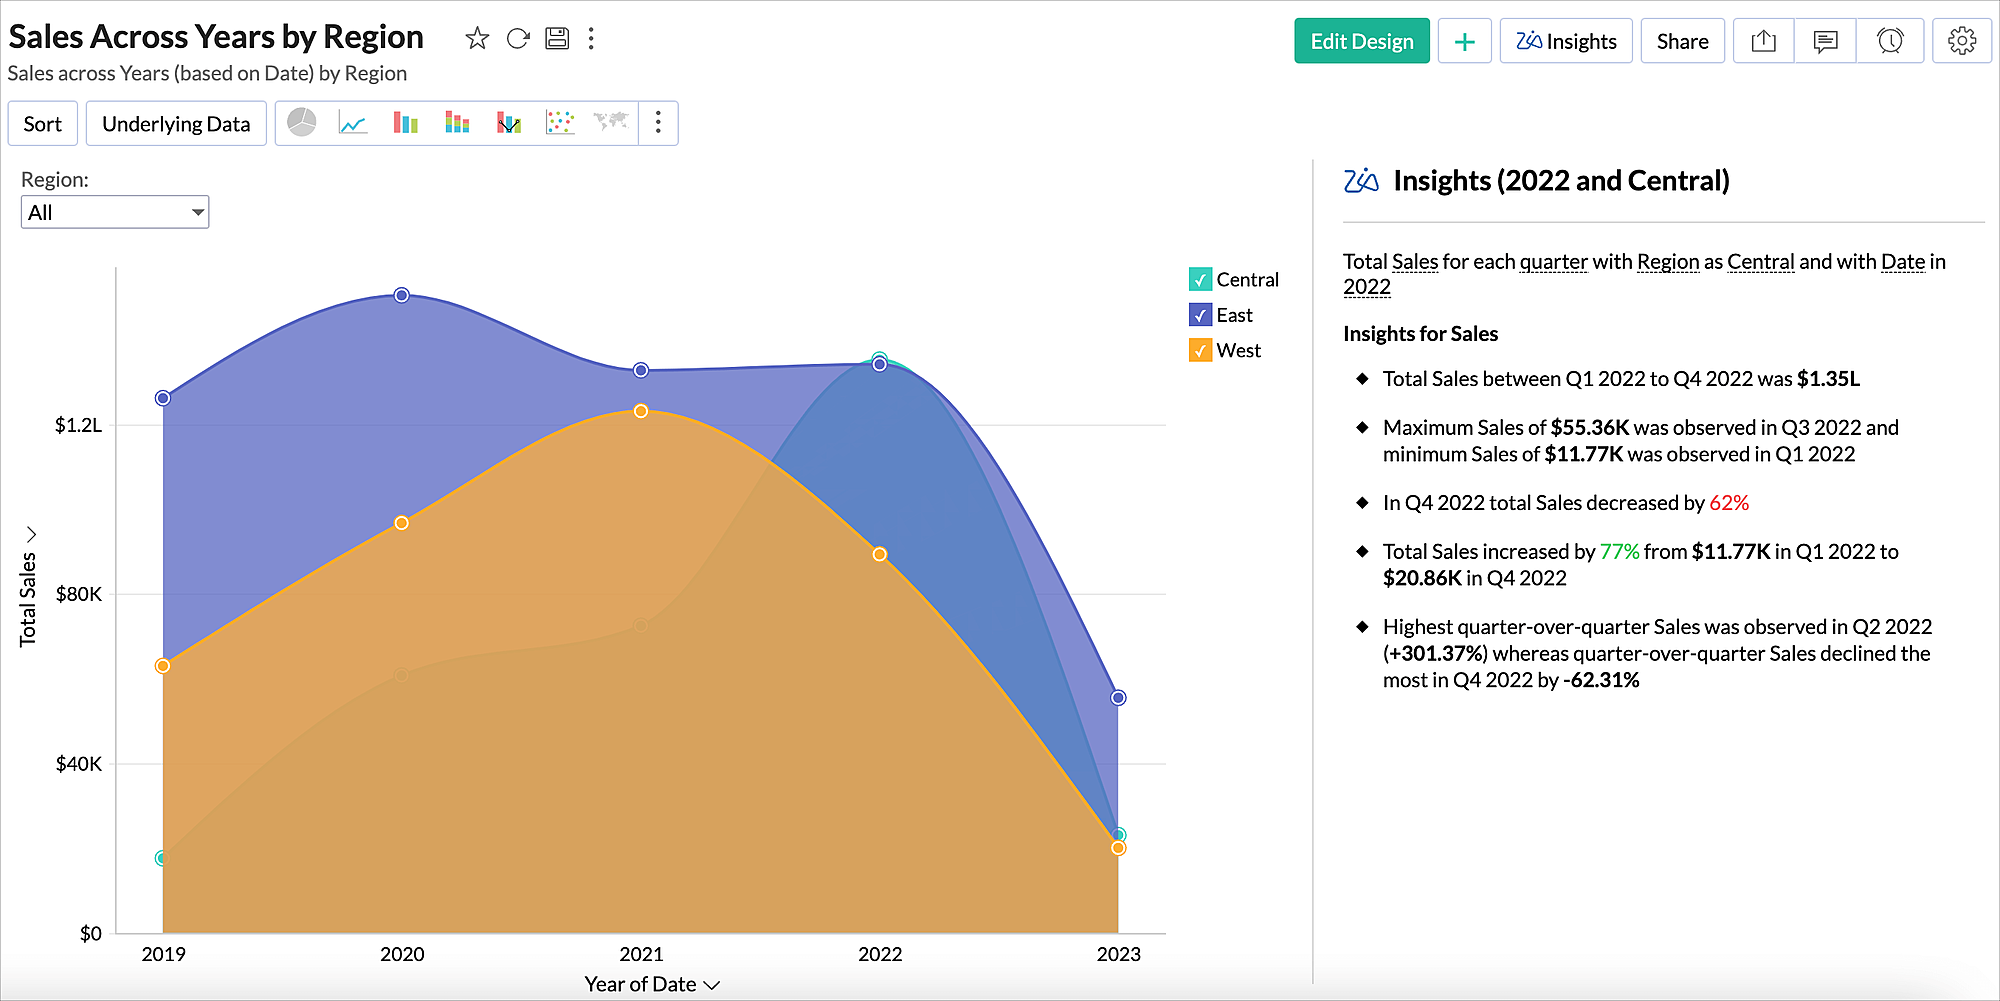
Get dynamic insights from Zia based on the legend filters
EnhancementZia insights now display insights dynamically based on the selection made in the legend. Click here to learn more.
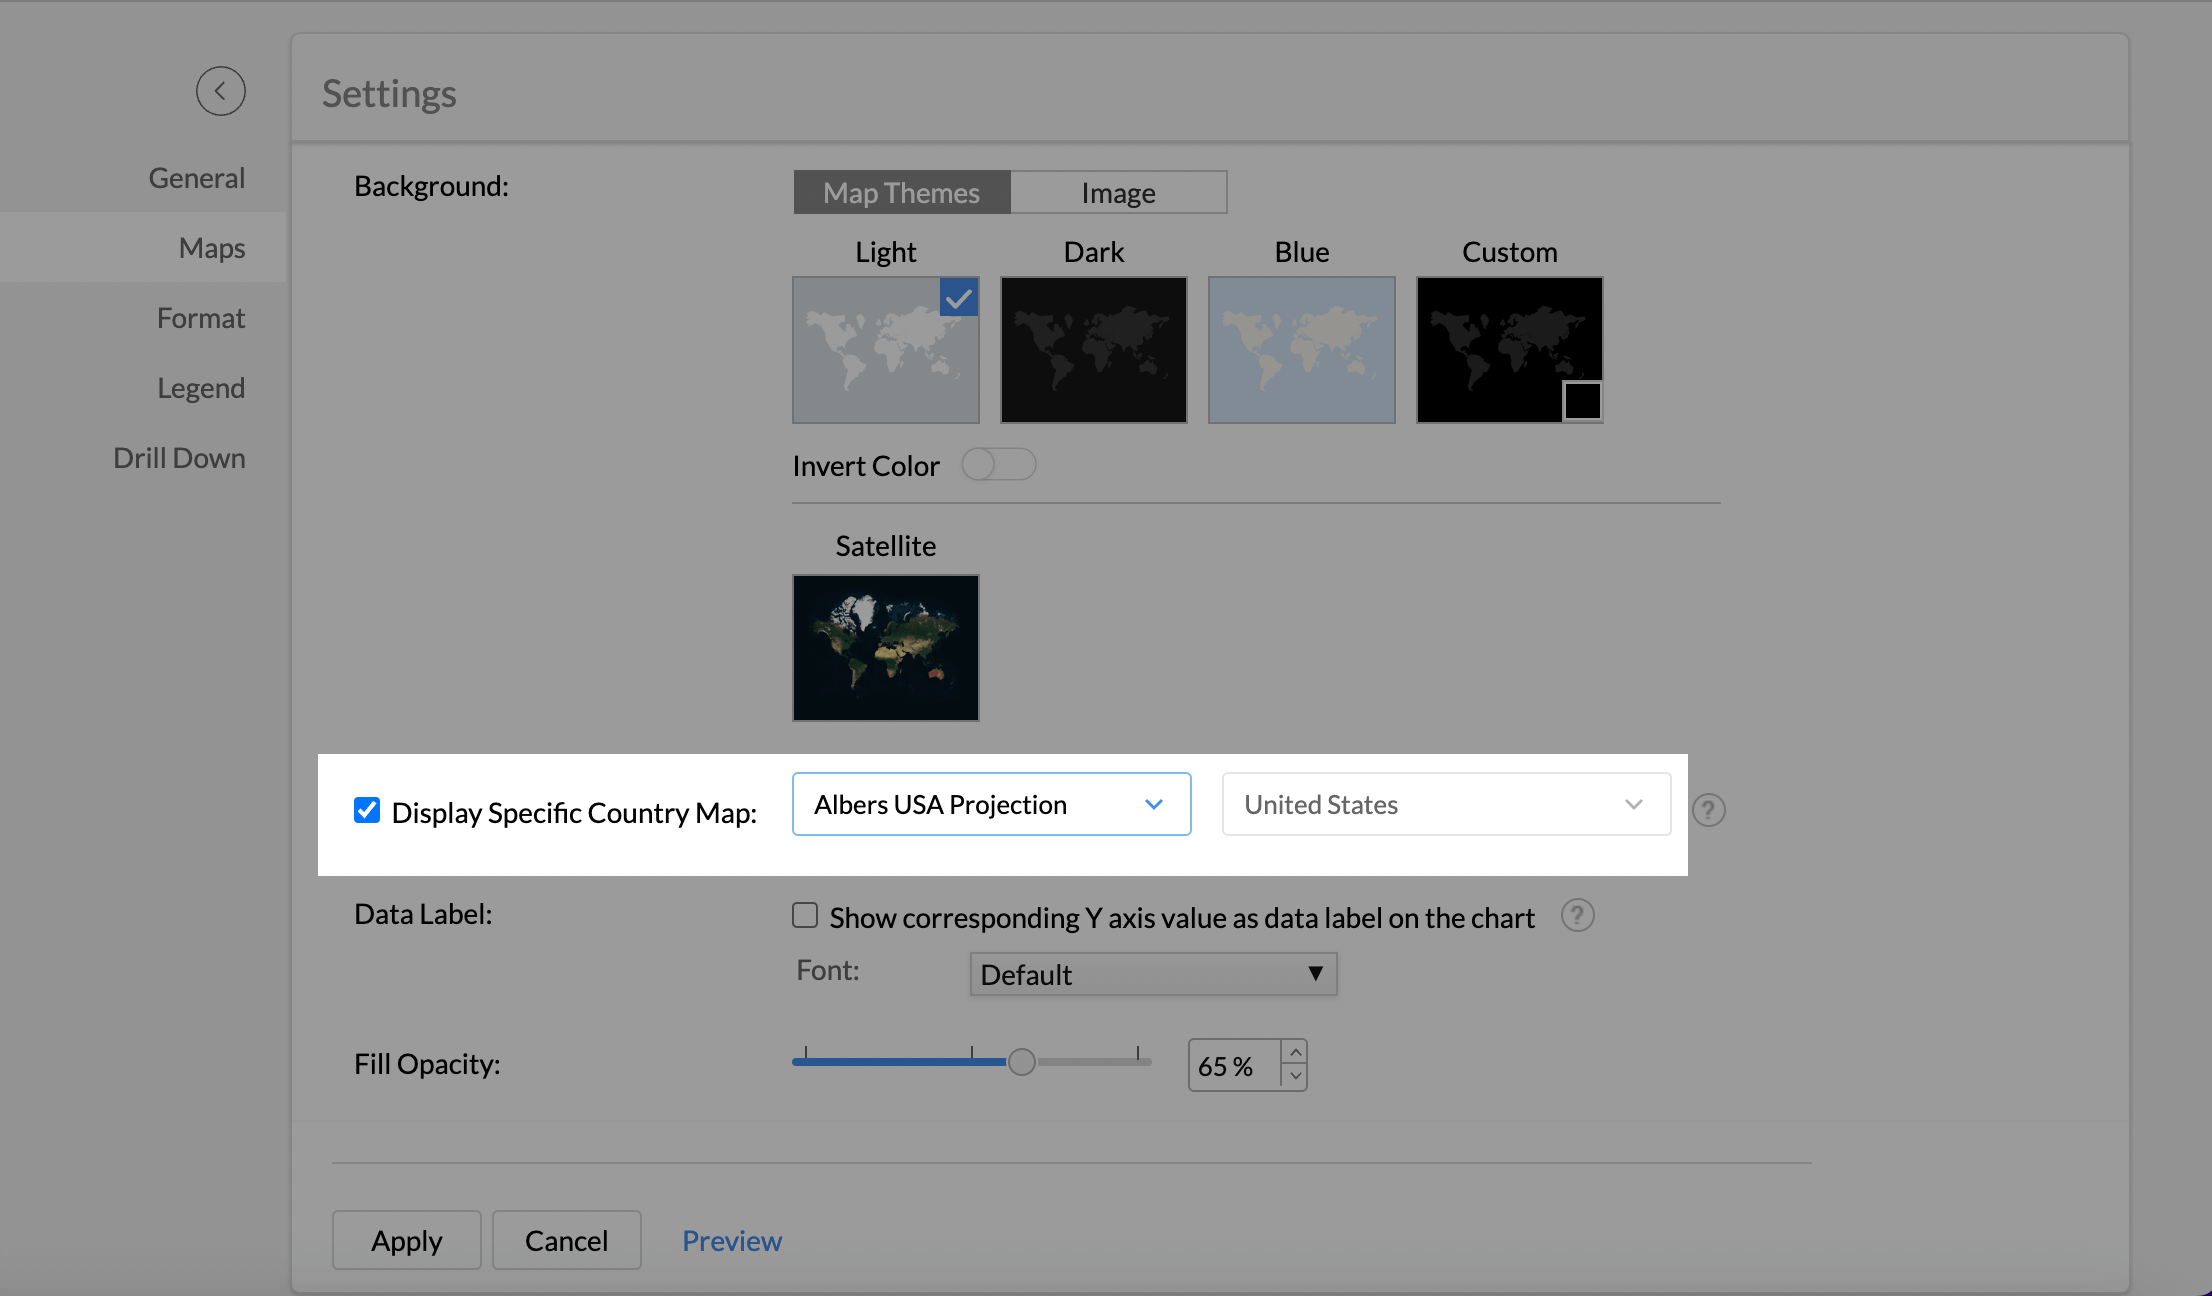
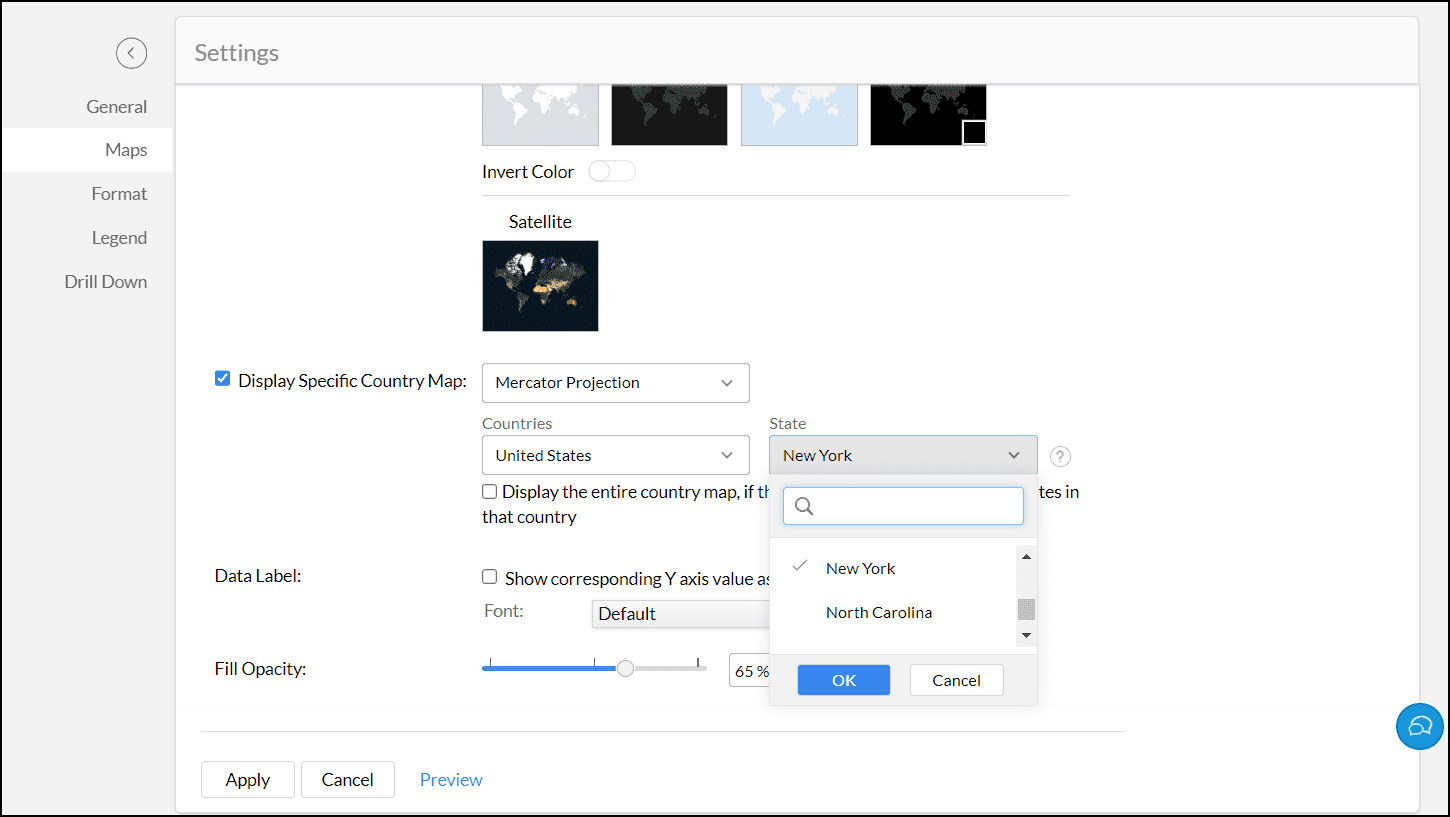
Visualize state-specific charts in Geo maps
EnhancementThe geo maps offer support for both country-level and state-level layouts. Click here to learn more.
Display forecasts on KPI widgets
EnhancementAnalytics Plus now lets you present forecasted values on dashboard widgets. Click here to learn more.

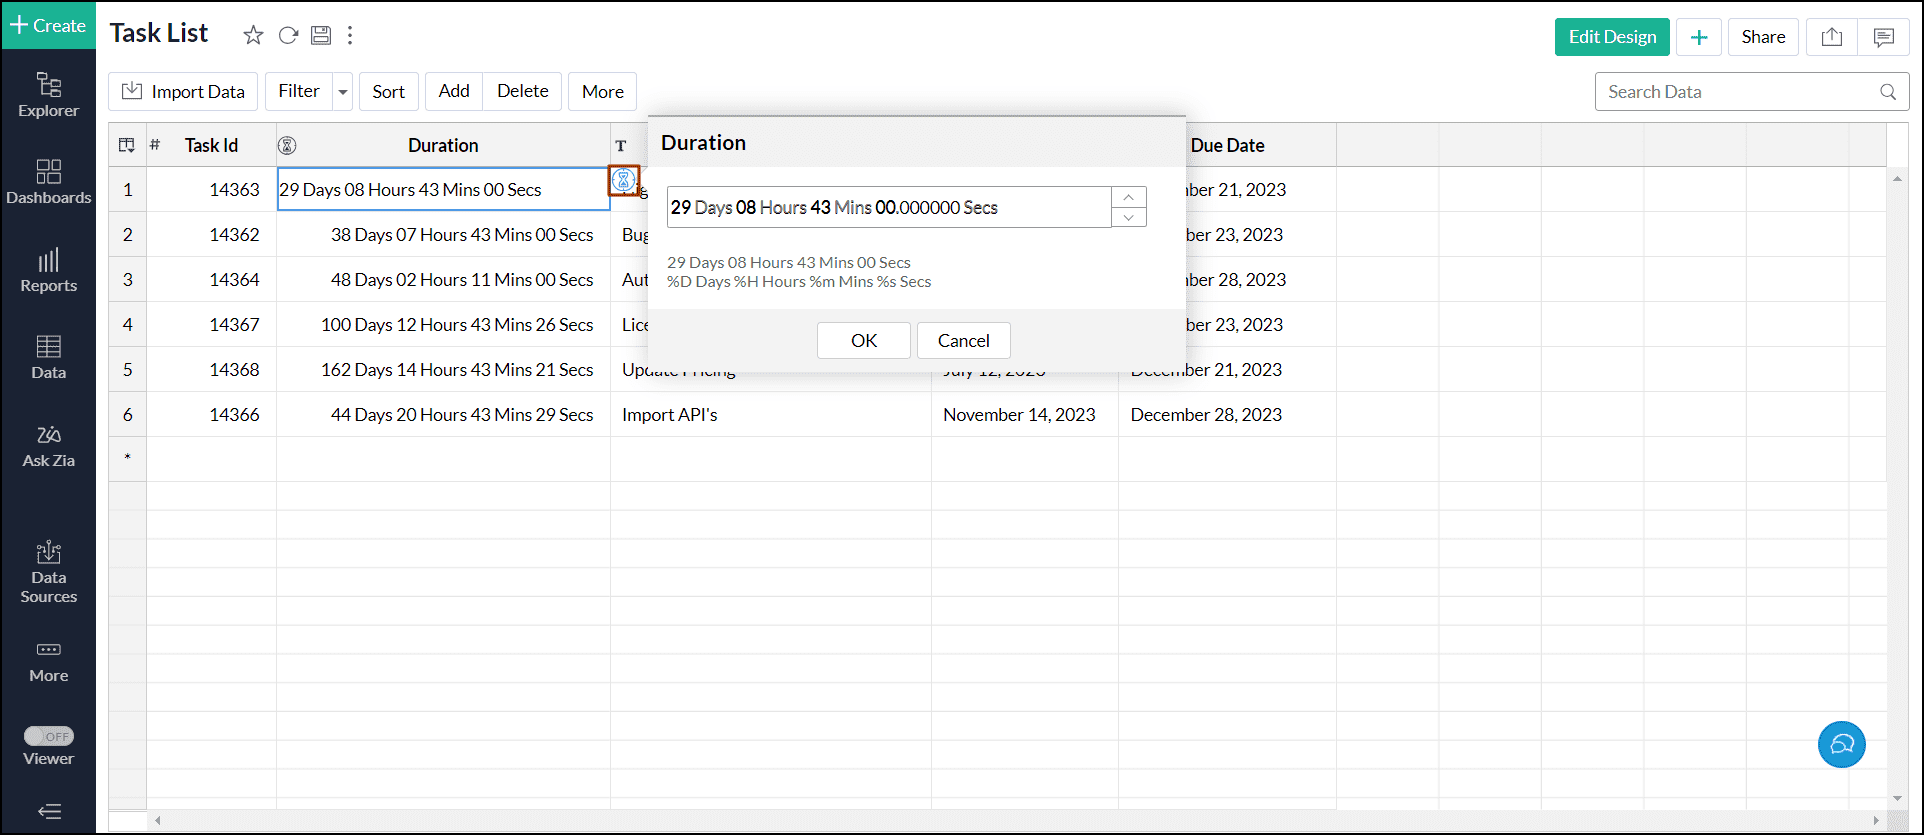
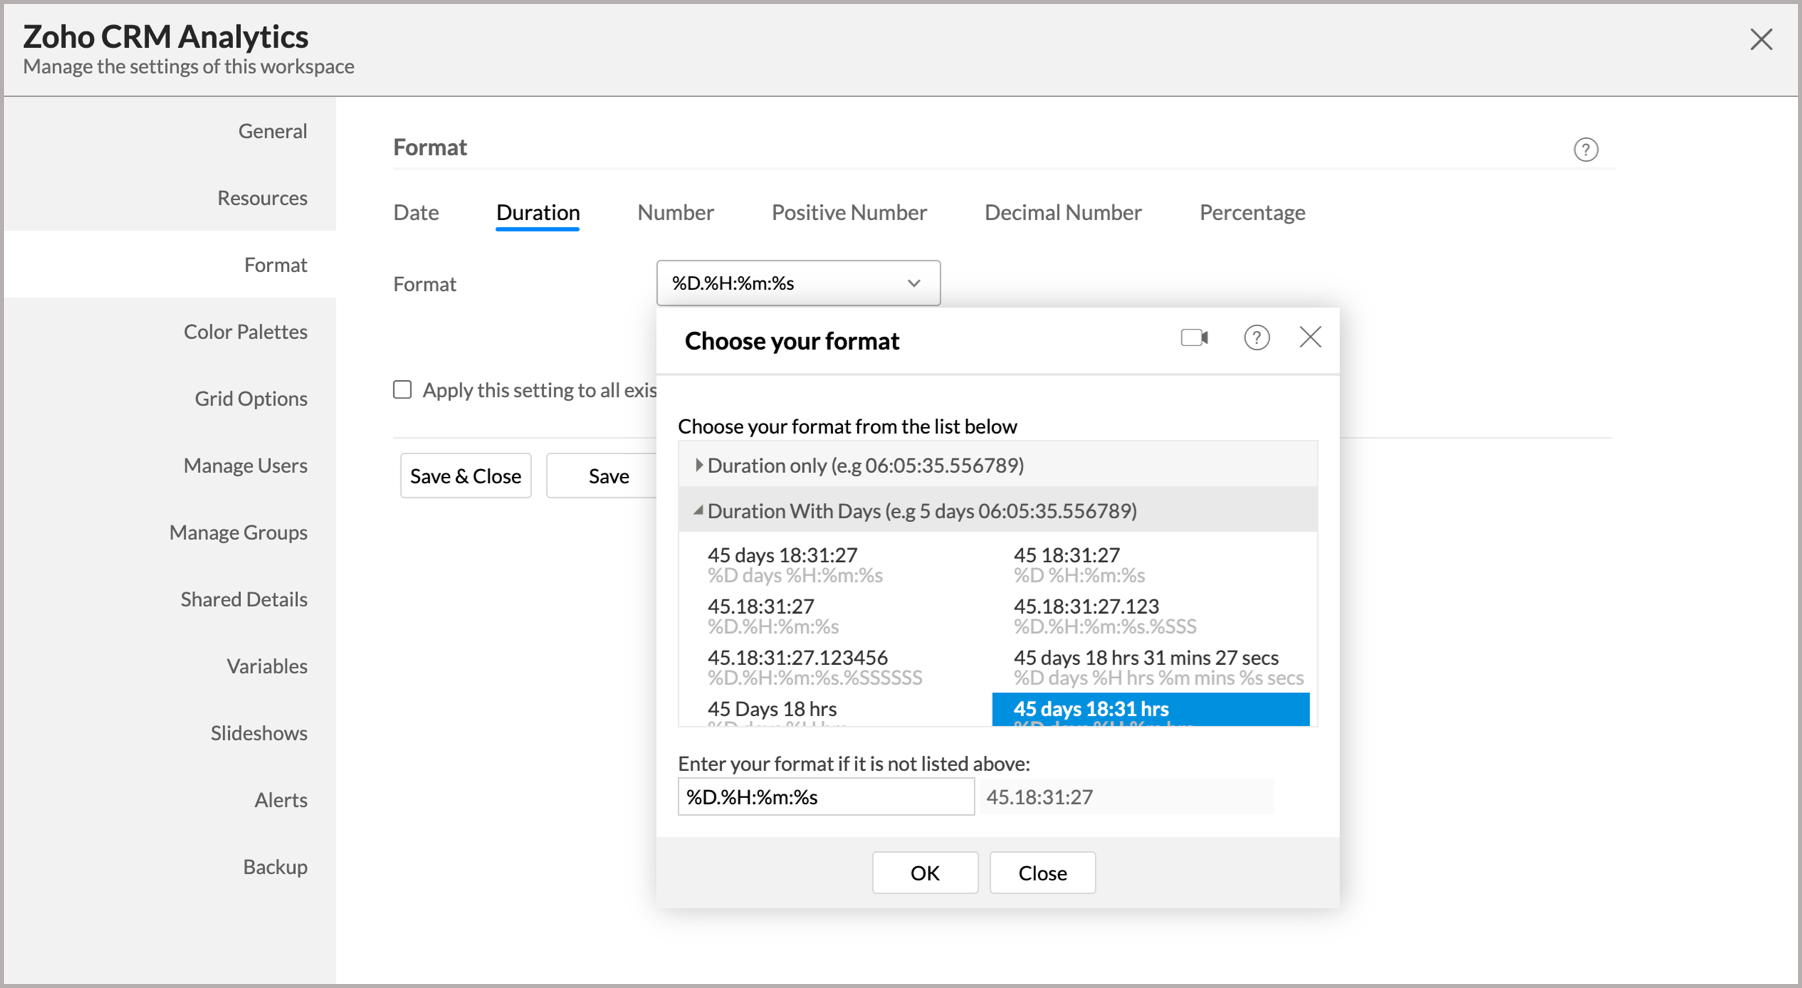
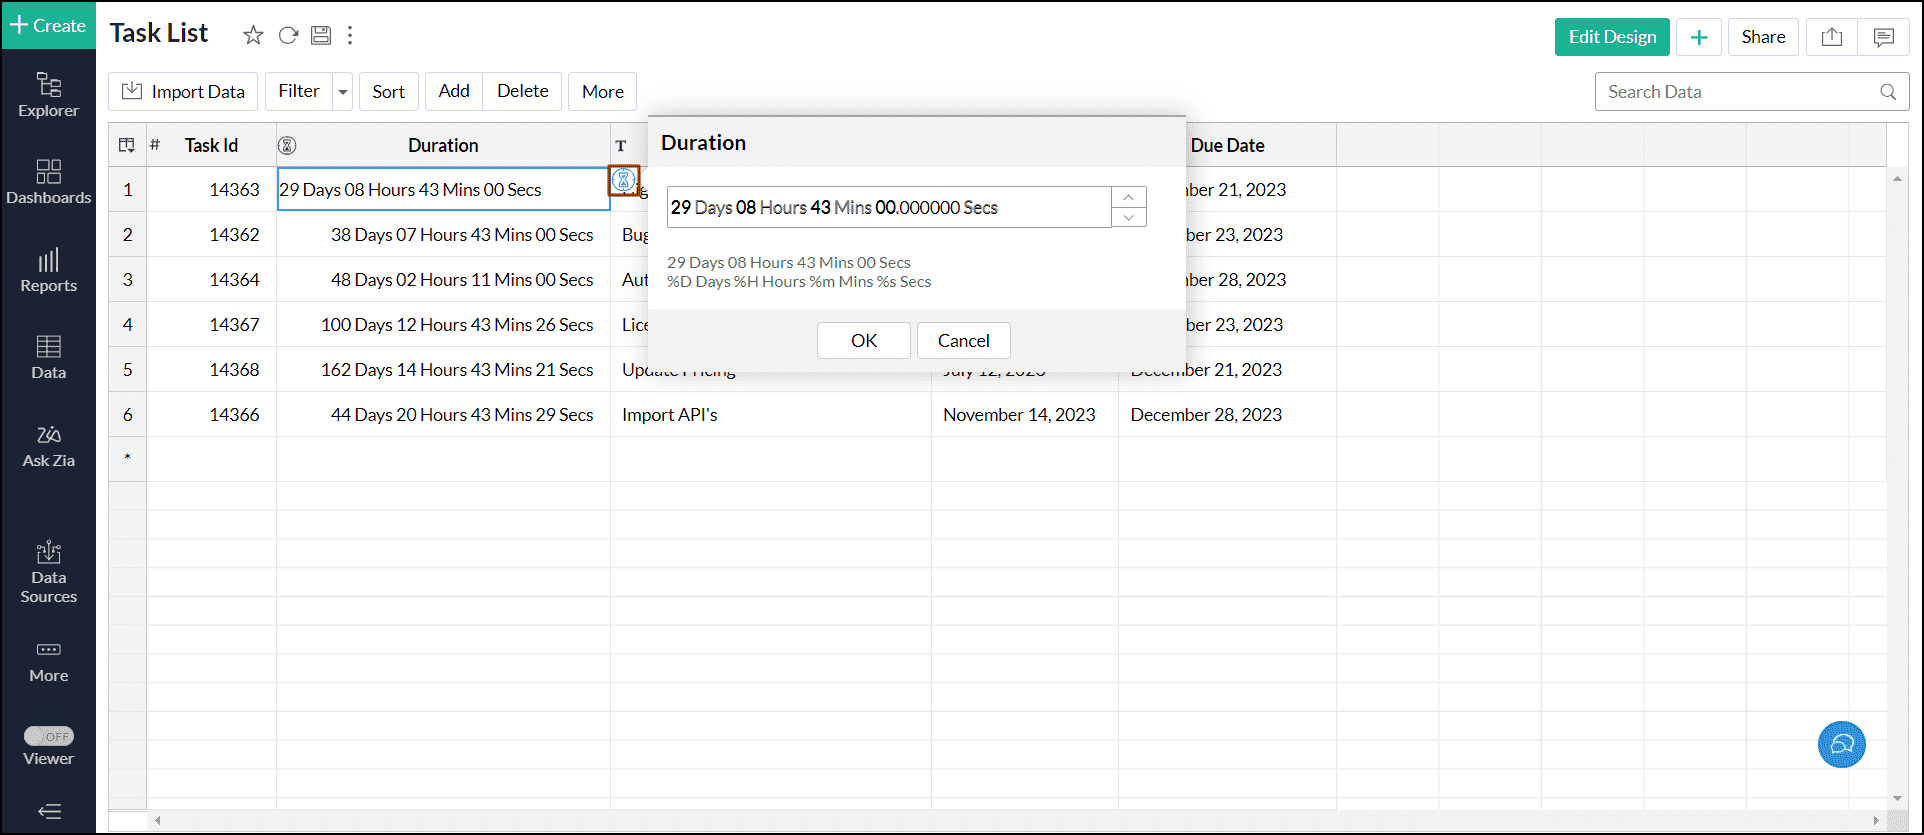
Introducing Duration format to represent time intervals
EnhancementIn addition to being able to represent time values as whole numbers, Analytics Plus now allows you to display time intervals in a more readable format using the Duration data type. Click here to learn more.
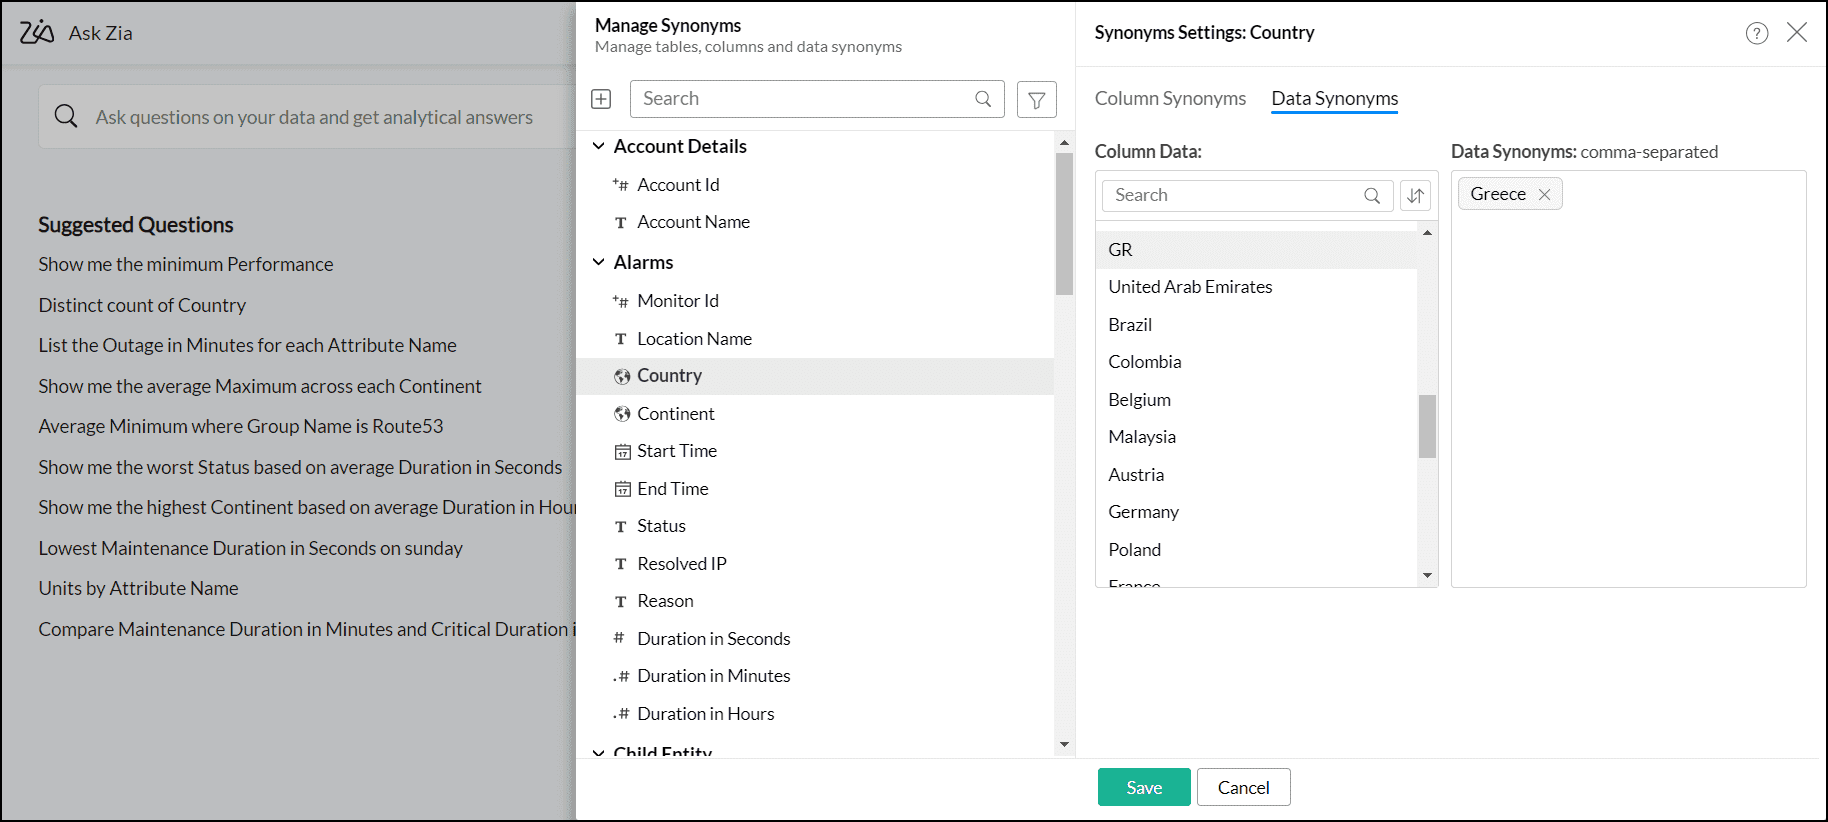
Data Synonyms for Ask Zia
EnhancementNo more struggling to remember specific data values when asking questions - Ask Zia's synonyms support is now available for values in the data tables. You can now specify other terms or synonyms for row-level values in each column of your data table. Click here to learn more.
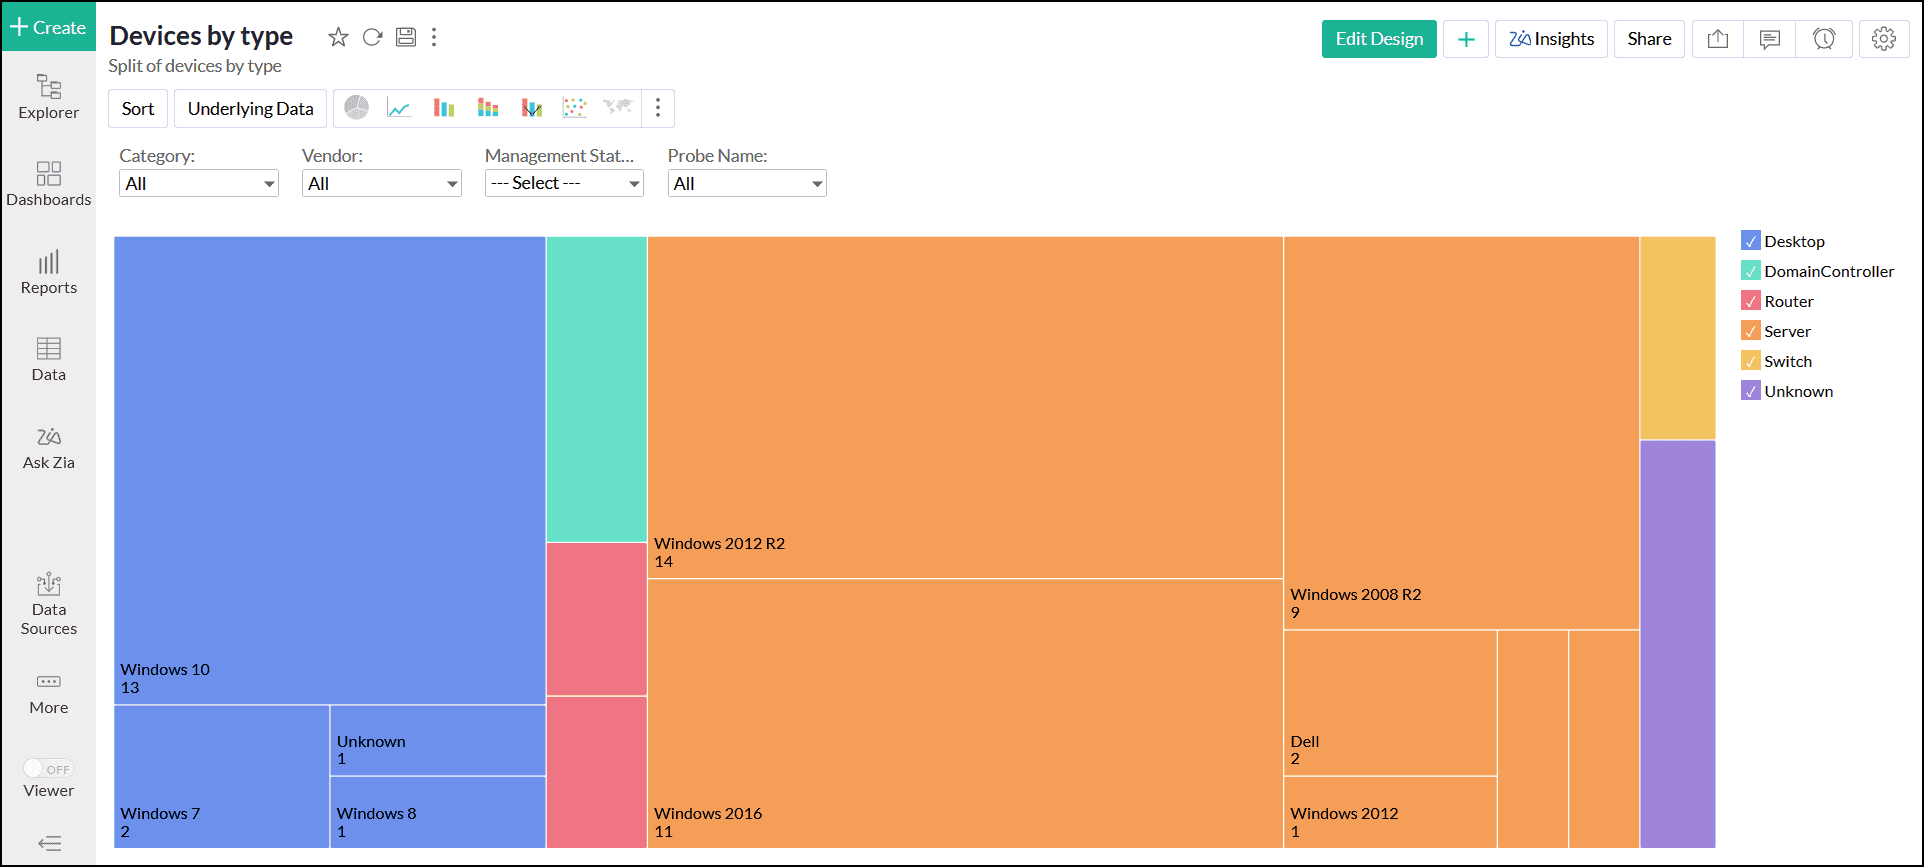
Introducing a new chart type - Treemap
NewAnalytics Plus now supports Treemap visualization on charts to explore your data hierarchically and uncover trends with precision. Click here to learn more.

Chart Styling Enhancements
EnhancementElevate your data visualization with the following enhancements in charts that align with current global design trends: A brand-new default color palette, captivating area chart gradient effects, stylized markers for scatter, line, area, and web charts, dotted gridlines, and clutter-free view with the removal of the Y-axis line. Click here to learn more.
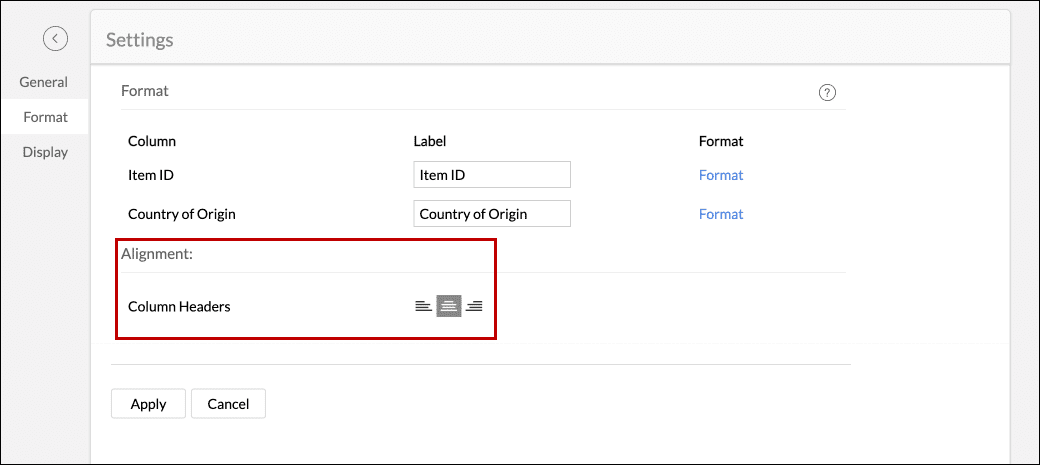
Enhancements in pivot view
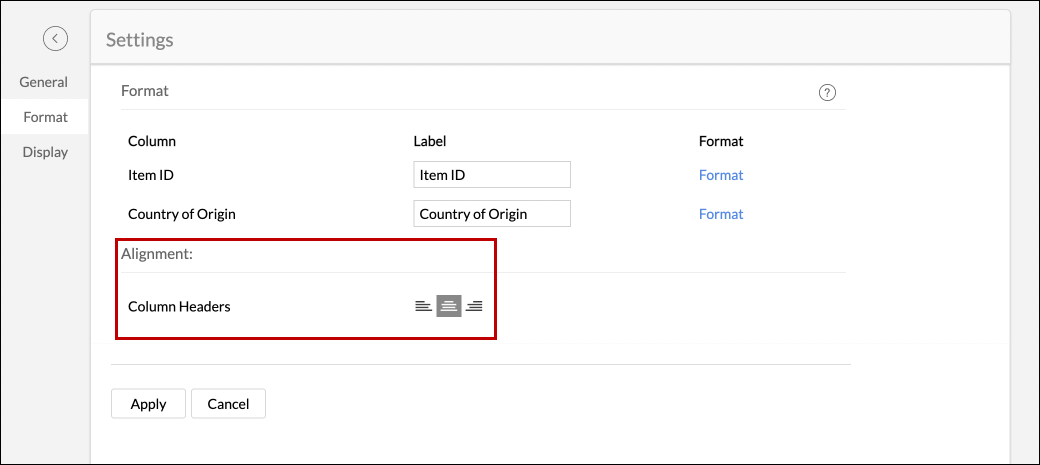
Enhancement1. Column header alignment
Analytics Plus enables you to change the alignment of the column header in the Pivot view. Click here to know more.
2. Show/Hide rows
Analytics Plus allows you to Show or Hide totals even when the data are added in Data as row format. Click here to learn more.
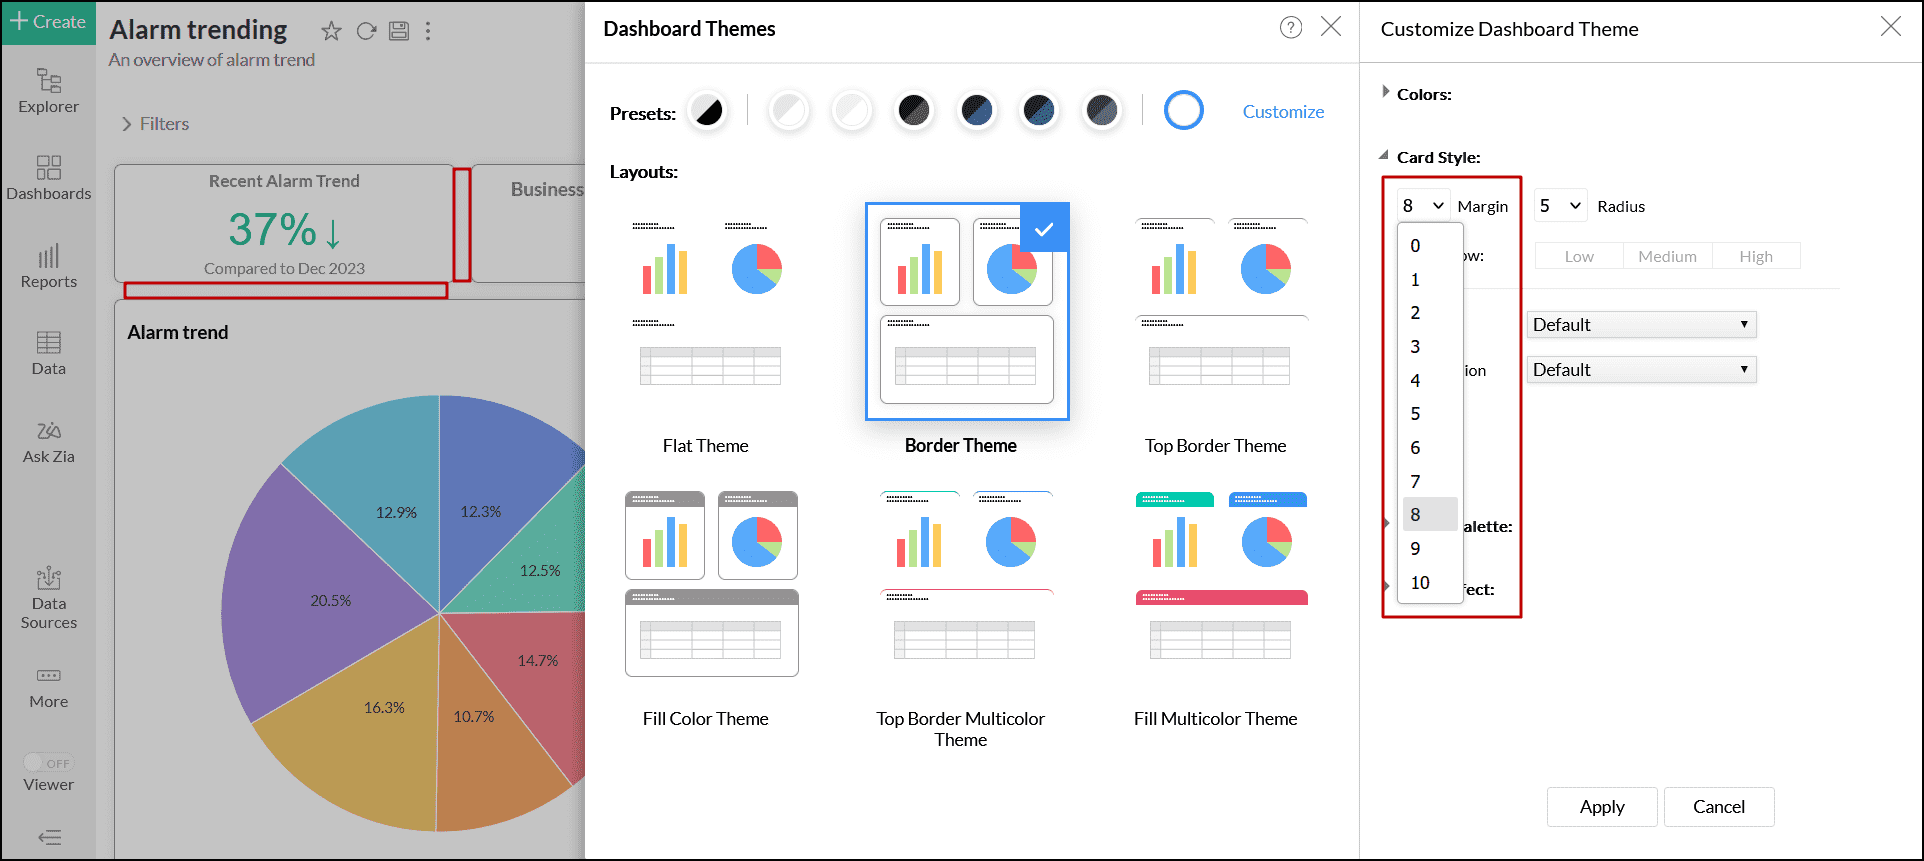
Dashboard advancements
Enhancement1. Move views across tabs
Analytics Plus now lets you move views across the dashboard tabs. Click here to learn more.
2. Set margin between cards
In the dashboard custom theme, you can now set a desired, or no margin/spacing between views. Click here to learn more.
Introducing Live Connect support for additional databases
EnhancementAnalytics Plus now offers Live Connect support for the Denodo and IBM Informix local databases. Click the corresponding links to learn more.
April
Build Number: 5360 (Release on: April 04, 2024)
Introducing out-of-box analytics for AWS infrastructure usage
NewAdvanced analytics for AWS infrastructure usage allows you to get deeper insights on resource usage and its cost to optimize usage economically. Click here to learn more.

Launching advanced analytics for AppDynamics
NewAnalytics Plus seamlessly integrates with AppDynamics and empowers you with real-time insights of your application performance to get in-depth visibility of key performance indicators and optimize them. Click here to learn more.
Import data from Parquet files
EnhancementAnalytics Plus now lets you import data from Parquet files stored in local drives, web URLs, and any FTP servers. Click the corresponding links to learn more.
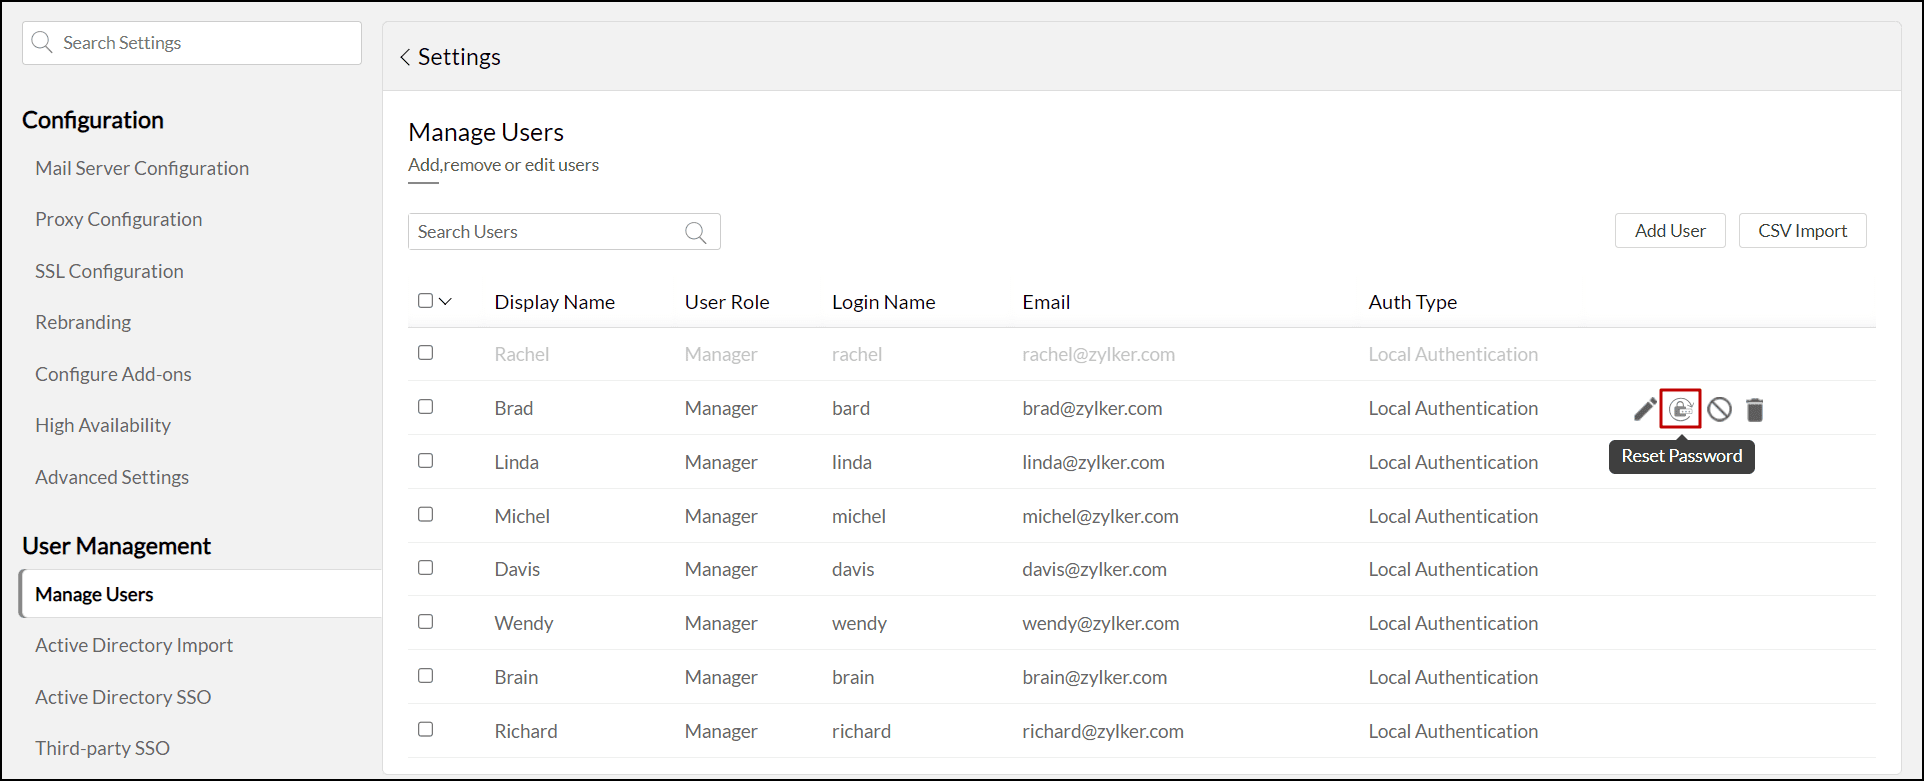
Enhancement to User management
EnhancementAnalytics Plus administrator can now help other users reset their password by creating a temporary one-time password. Click here to learn more.
Mar
Build Number: 5350 (Release on: March 12, 2024)
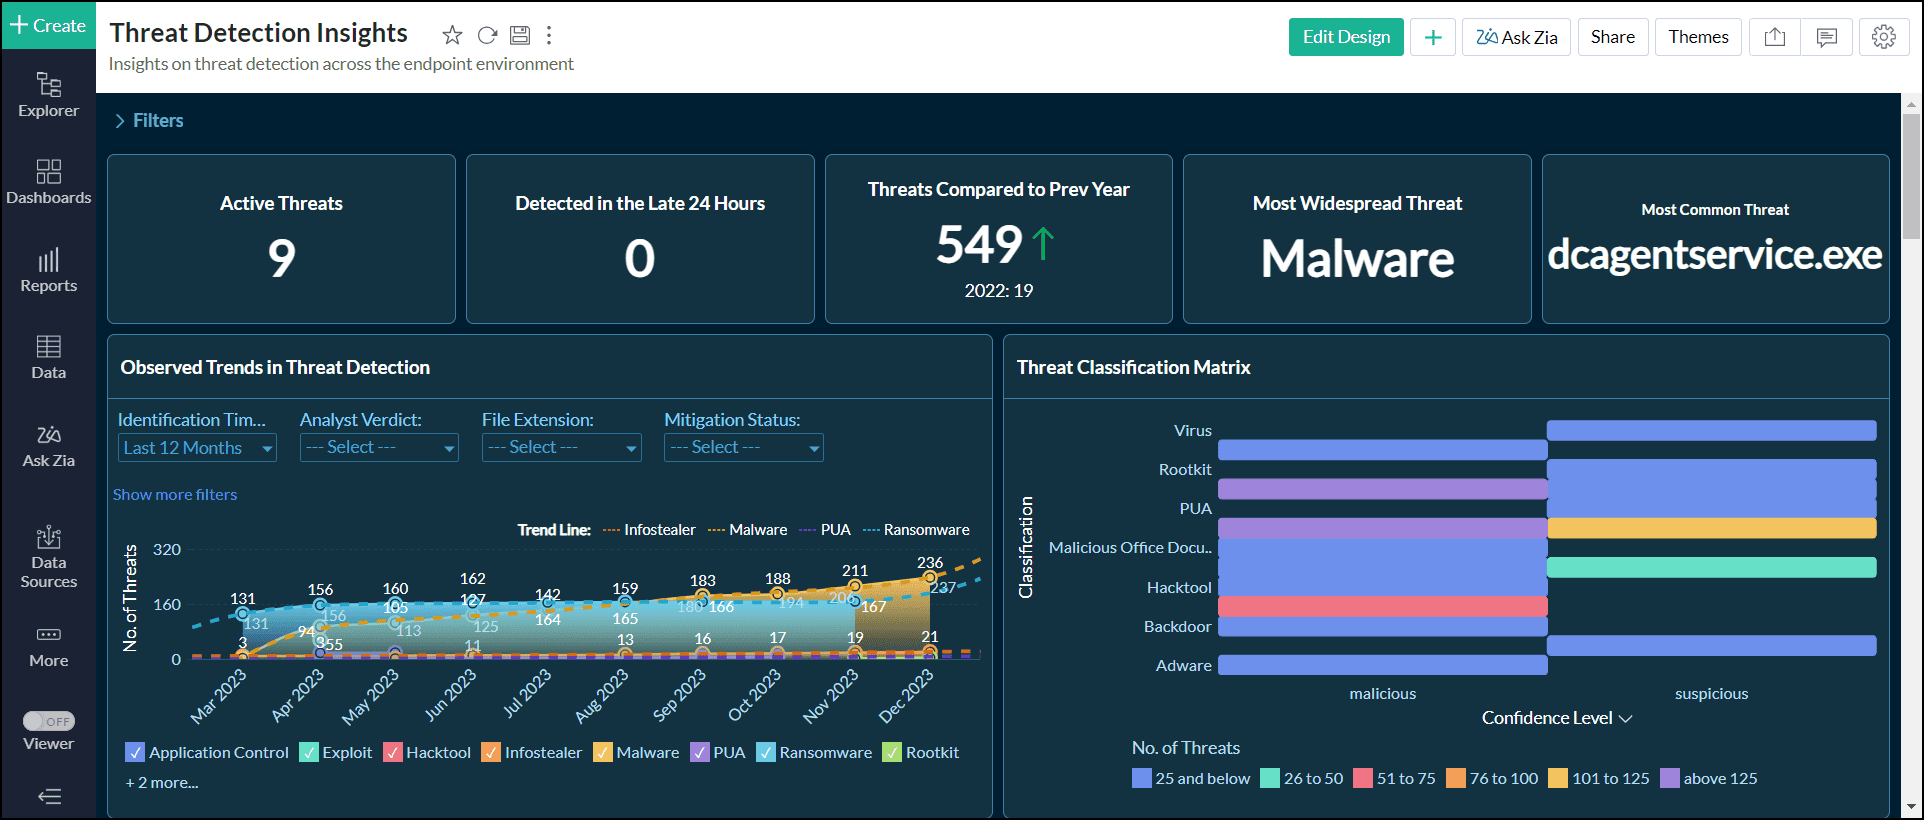
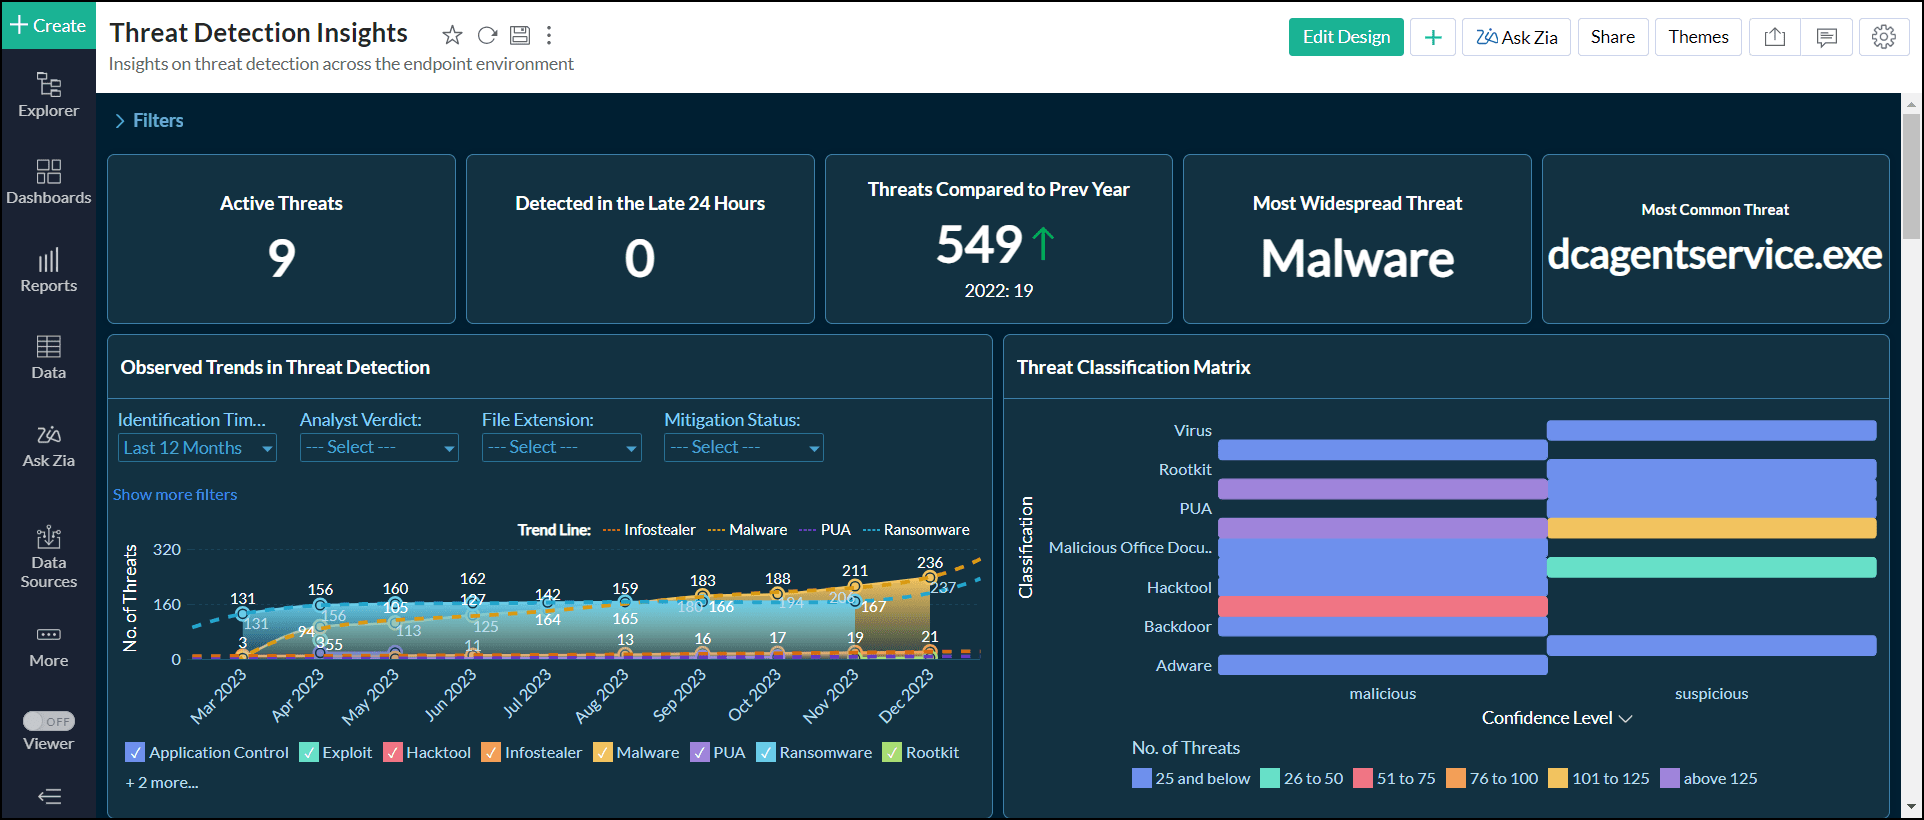
Launching out-of-box analytics for SentinelOne
NewAdvanced analytics for SentinelOne offers insightful reports on threat detection to help IT teams defend against threats and secure the environment efficiently. Click here to learn more.
Unveiling support for import from new local databases
NewAnalytics Plus now lets you import data from the following local databases:
Feb
Build Number: 5340 (Release on: February 22, 2024)
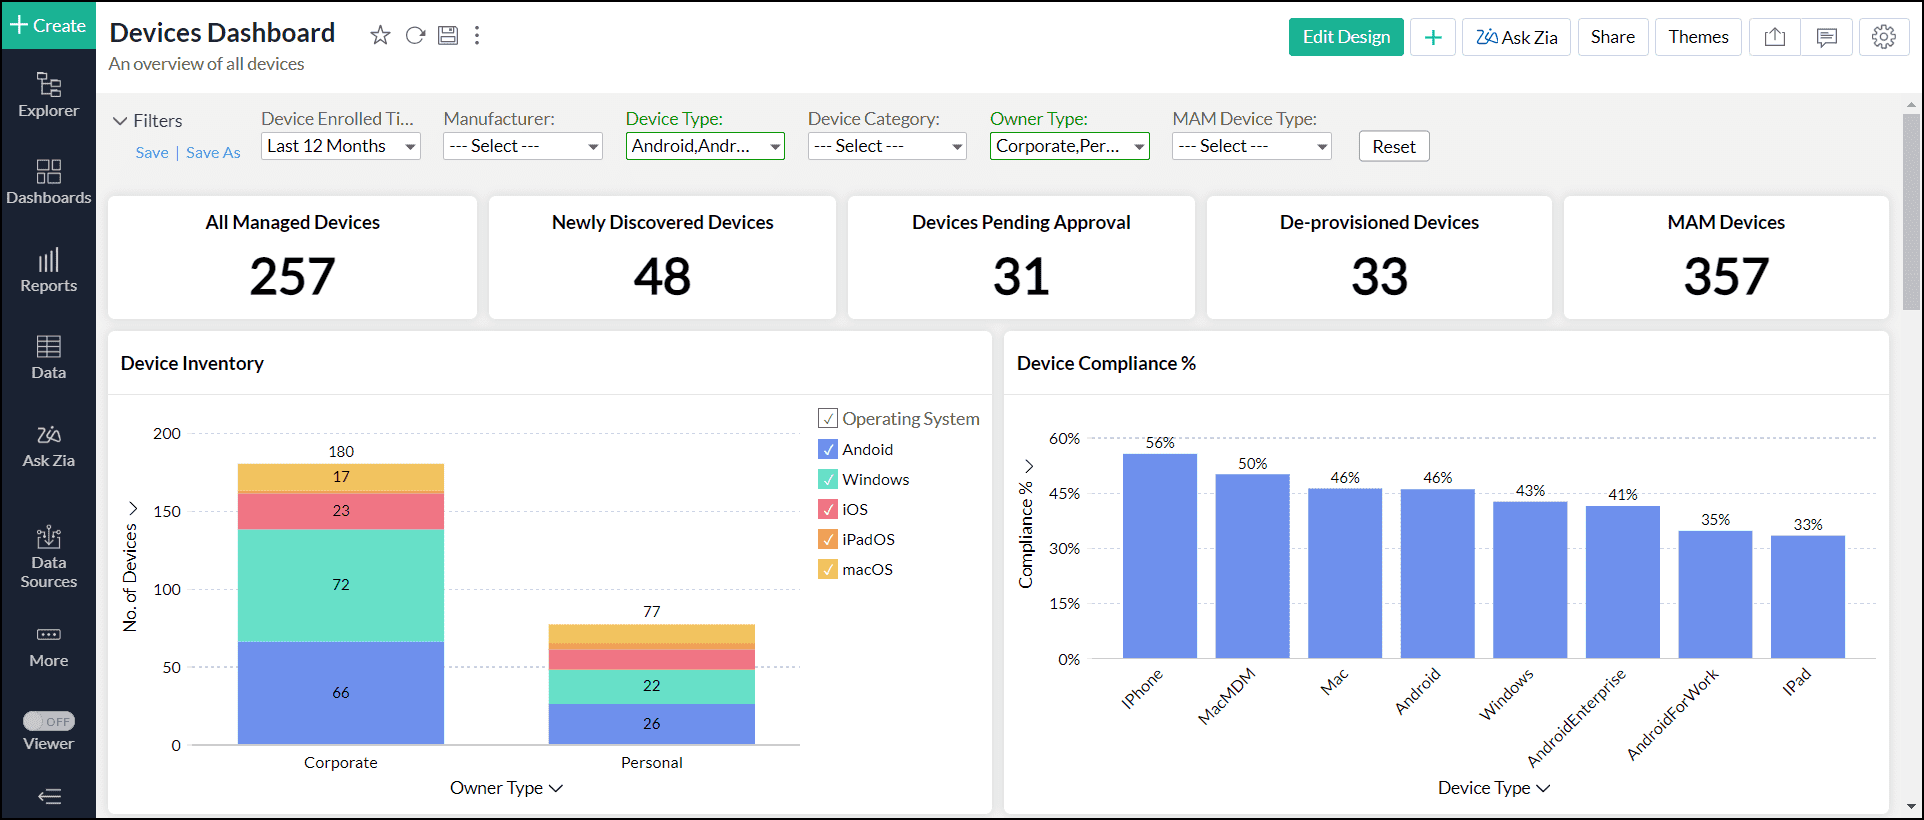
Introducing advanced analytics for Microsoft Intune
NewMicrosoft Intune advanced analytics offers data-driven insights about all your managed devices to help your IT team proactively detect and resolve endpoint issues, measure the end-user experience, and thereby improve the overall productivity of users. Click here to learn more.

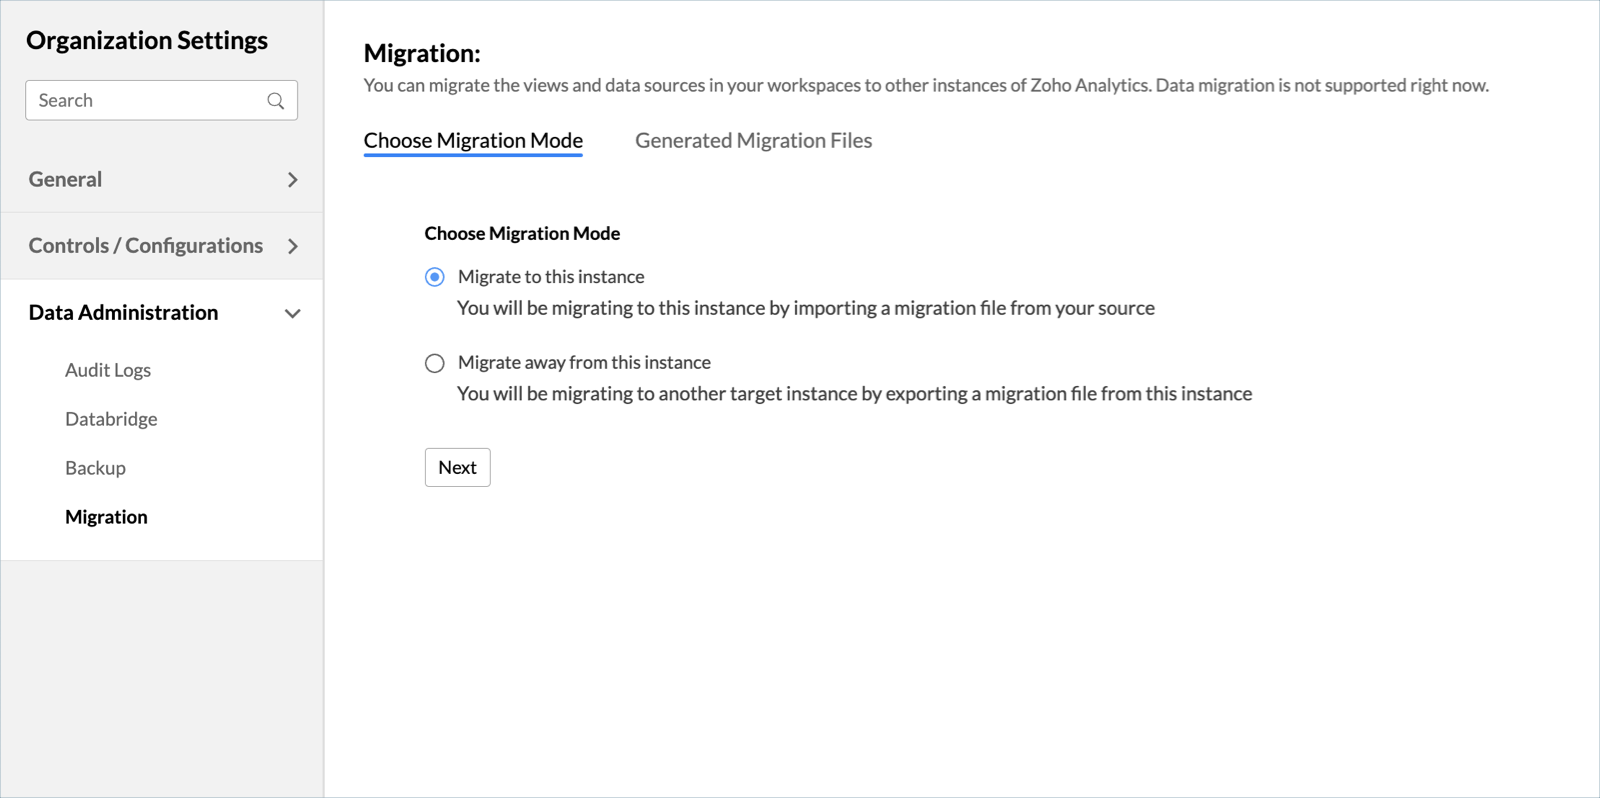
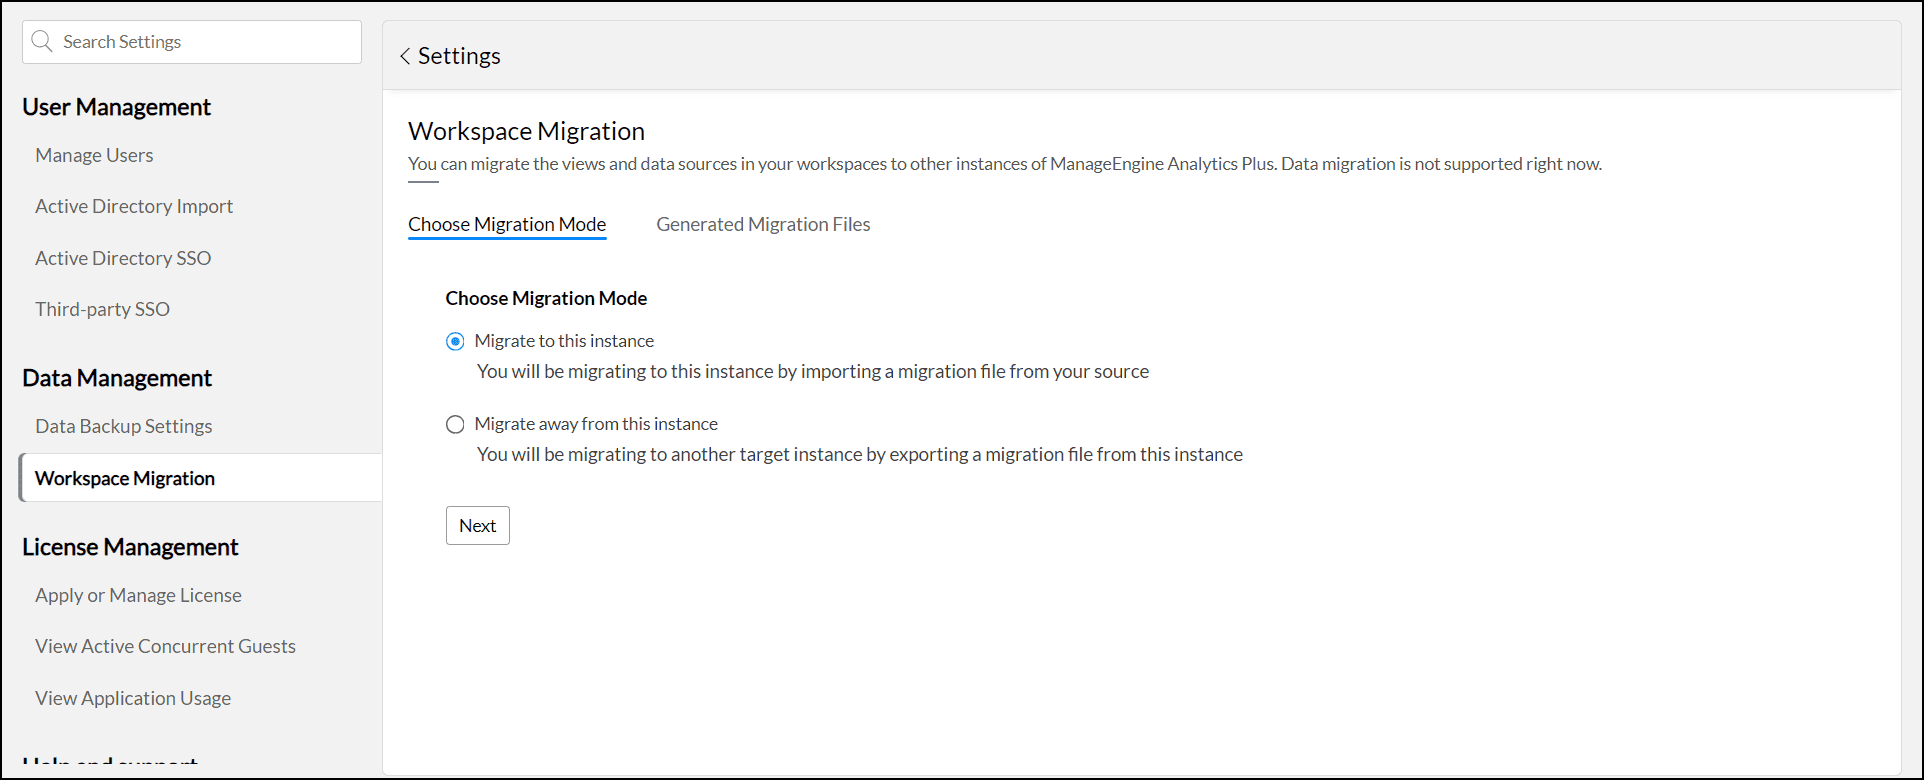
Migrate workspaces easily
NewYou can now easily migrate the blueprint of your entire workspace between different Analytics Plus on-premise accounts or from on-premises to cloud and vice-versa. Click here to learn more.
Jan
Build Number: 5330 (Release on: January 17, 2024)
Introducing out-of-box analytics for SolarWinds
NewAnalytics Plus integrates with SolarWinds to import Network, System, Database, and Application management data effortlessly and create intuitive reports and dashboards for analysis. Click here to learn more.

Advanced analytics for Dynatrace
NewLaunching advanced analytics for Dynatrace to empower you with deep analytical capabilities of your operational and business data to make data-driven decisions and improve business processes. Click here to learn more.

Import data from the Actian Ingres local database
NewYou can now import data from the Actian Ingres local database into Analytics Plus for advanced reporting and analysis. Click here to learn more.
2023
Dec
Build Number: 5320 (Release on: December 18, 2023)
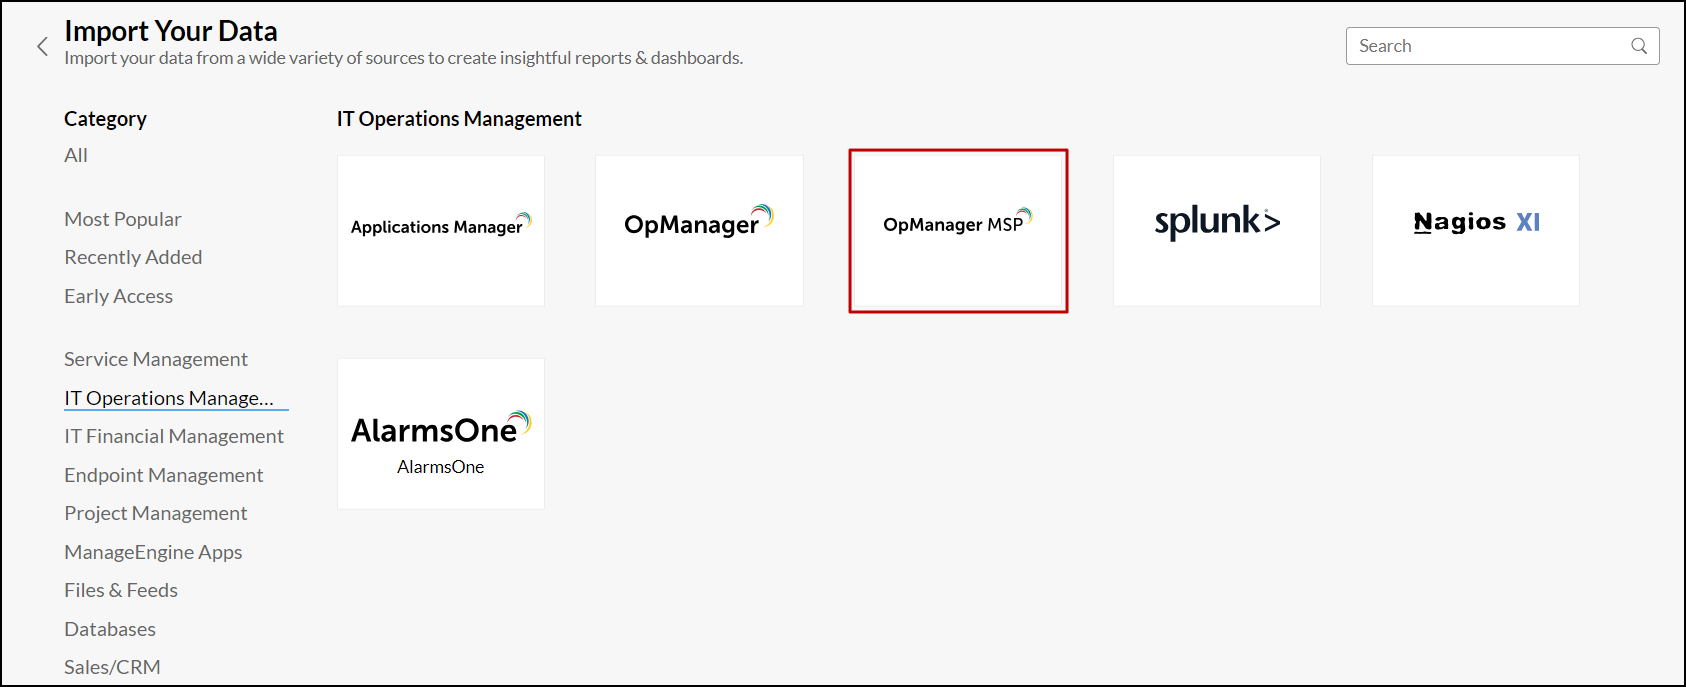
Launching advanced analytics for OpManager MSP
NewIntroducing out-of-box reports and dashboards for OpManager MSP to gain complete visibility of your alarms, business views, inventory, performance data, and much more. Click here to learn more.
Introducing Georgian language support
NewAnalytics Plus' user interface now supports the Georgian language in addition to other languages. Click here to know about the supported languages.
Dec
Build Number: 5310 (Release on: December 06, 2023)
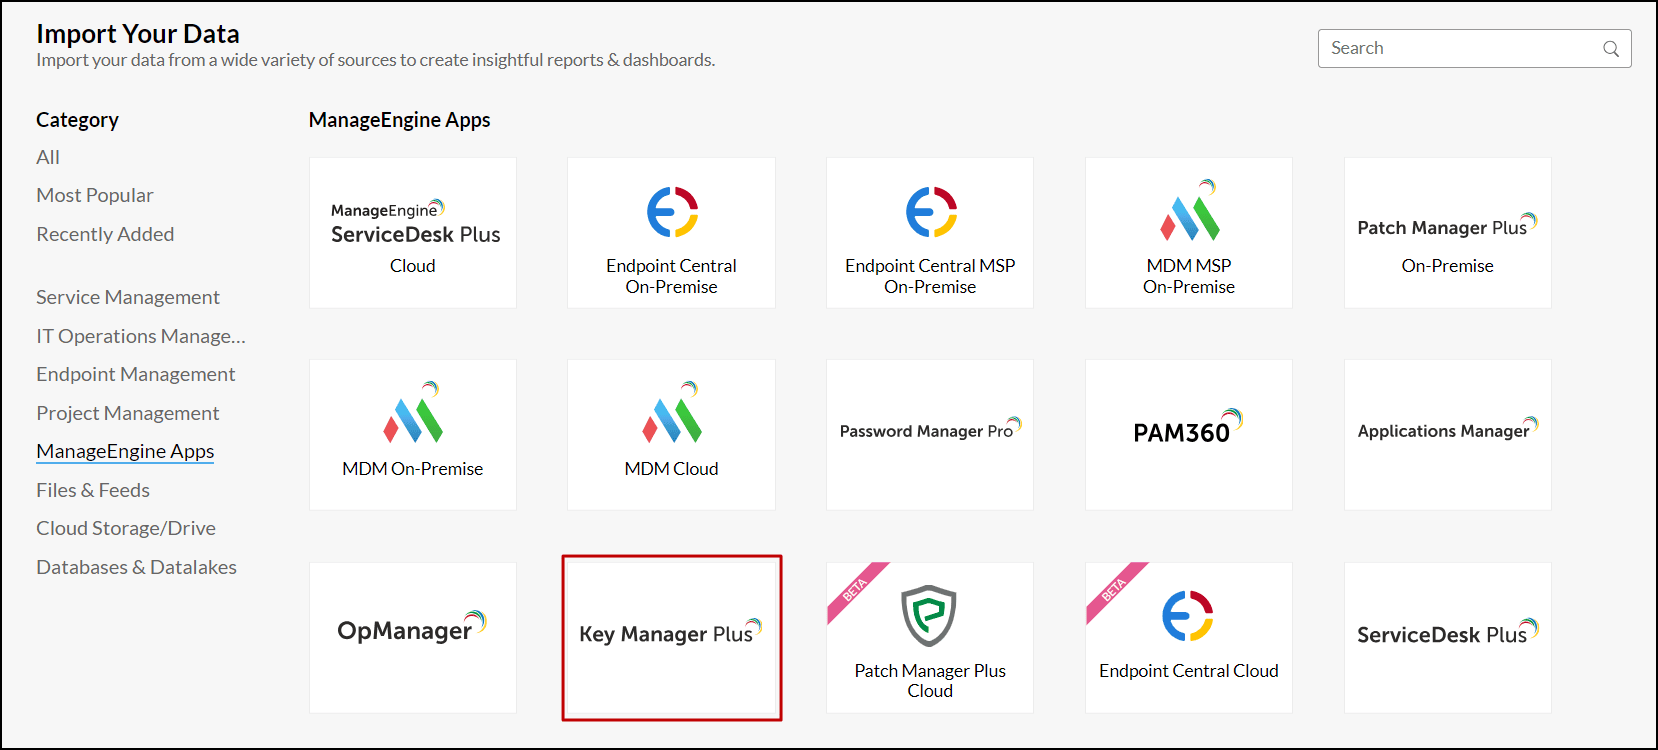
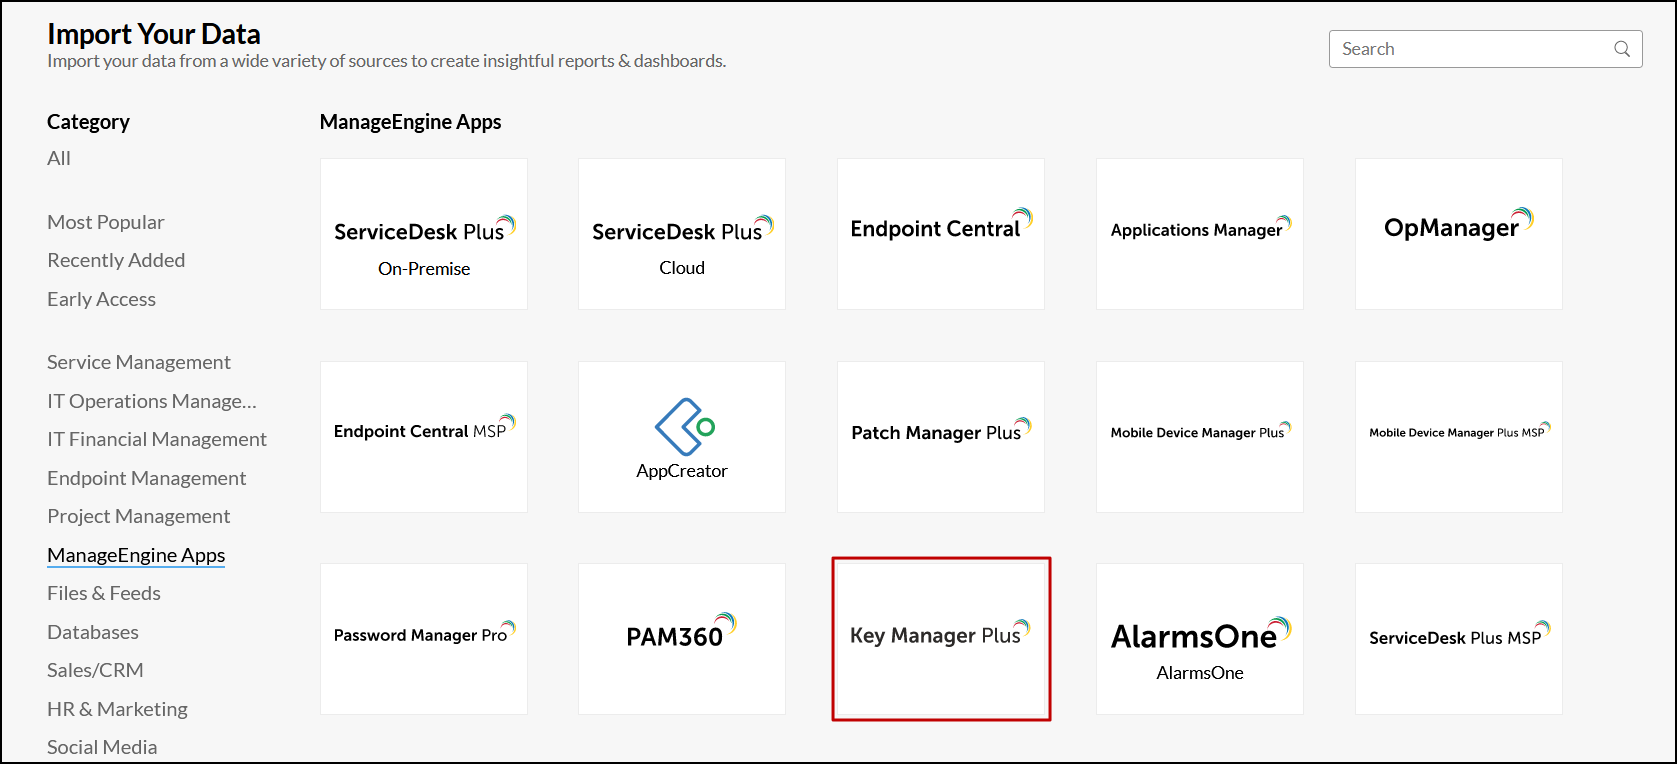
Unveiling out-of-box analytics for Key Manager Plus
NewAnalytics Plus seamlessly integrates with Key Manager Plus, allows administrators to get in-depth insights into their SSH key and SSL management practices. Click here to learn more.
Introducing advanced analytics for Apache Derby local database
NewYou can now import data from Apache Derby local database into Analytics Plus for advanced reporting and analysis. Click here to learn more.
Issues fixed
Issues fixed- A Cross-Site Scripting (XSS) vulnerability within the add-on request mechanism, which users utilize to request add-on installations from administrators, has been discovered and fixed.
- A vulnerability that allowed unauthorized access to the images uploaded to dashboards and data snapshot images has been identified and fixed.
- A vulnerability enabling the upload of large files to the Analytics Plus server by exploiting the file upload process used for actions such as updating the product license, rebranding the logo, and importing users via CSV files has been fixed. This vulnerability was identified as a potential DDoS risk, capable of rendering the application inaccessible when large files are uploaded.
Nov
Build Number: 5301 (Release on: November 06, 2023)
Issues fixed
Issues fixedThe upgrade issue faced when using Analytics Plus in high availability mode is now fixed.
Oct
Build Number: 5300 (Release on: October 16, 2023)
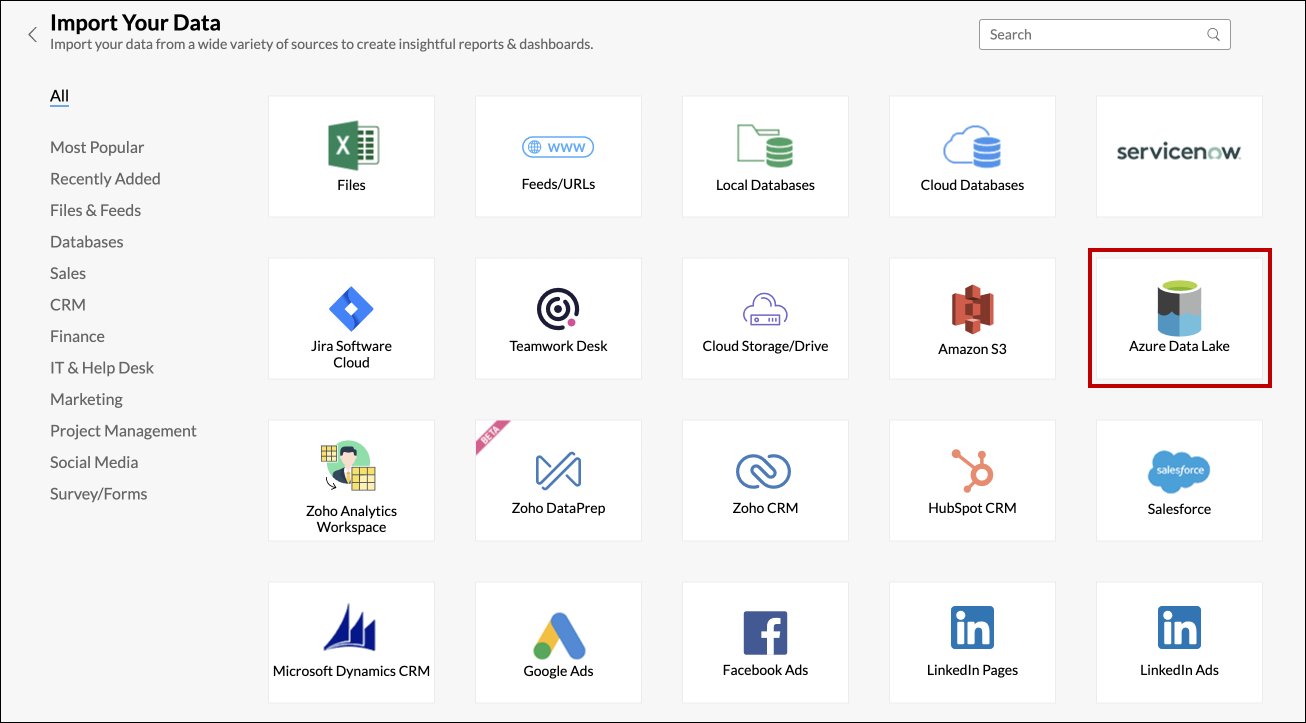
Import Data from Azure Data Lake
NewAnalytics Plus now supports data import from three types of storage in Azure Data Lake: containers, file shares, and tables. Click here to learn more.
Import Data from SharePoint
NewAnalytics Plus has extended its support to import data from Microsoft SharePoint. Click here to learn more.
Follow-up Questions in Ask Zia
EnhancementAsk Zia now auto suggests follow-up questions based on your current question. This is supported in both normal and conversation mode. This allows you to easily construct questions to get reports over your data instantly.
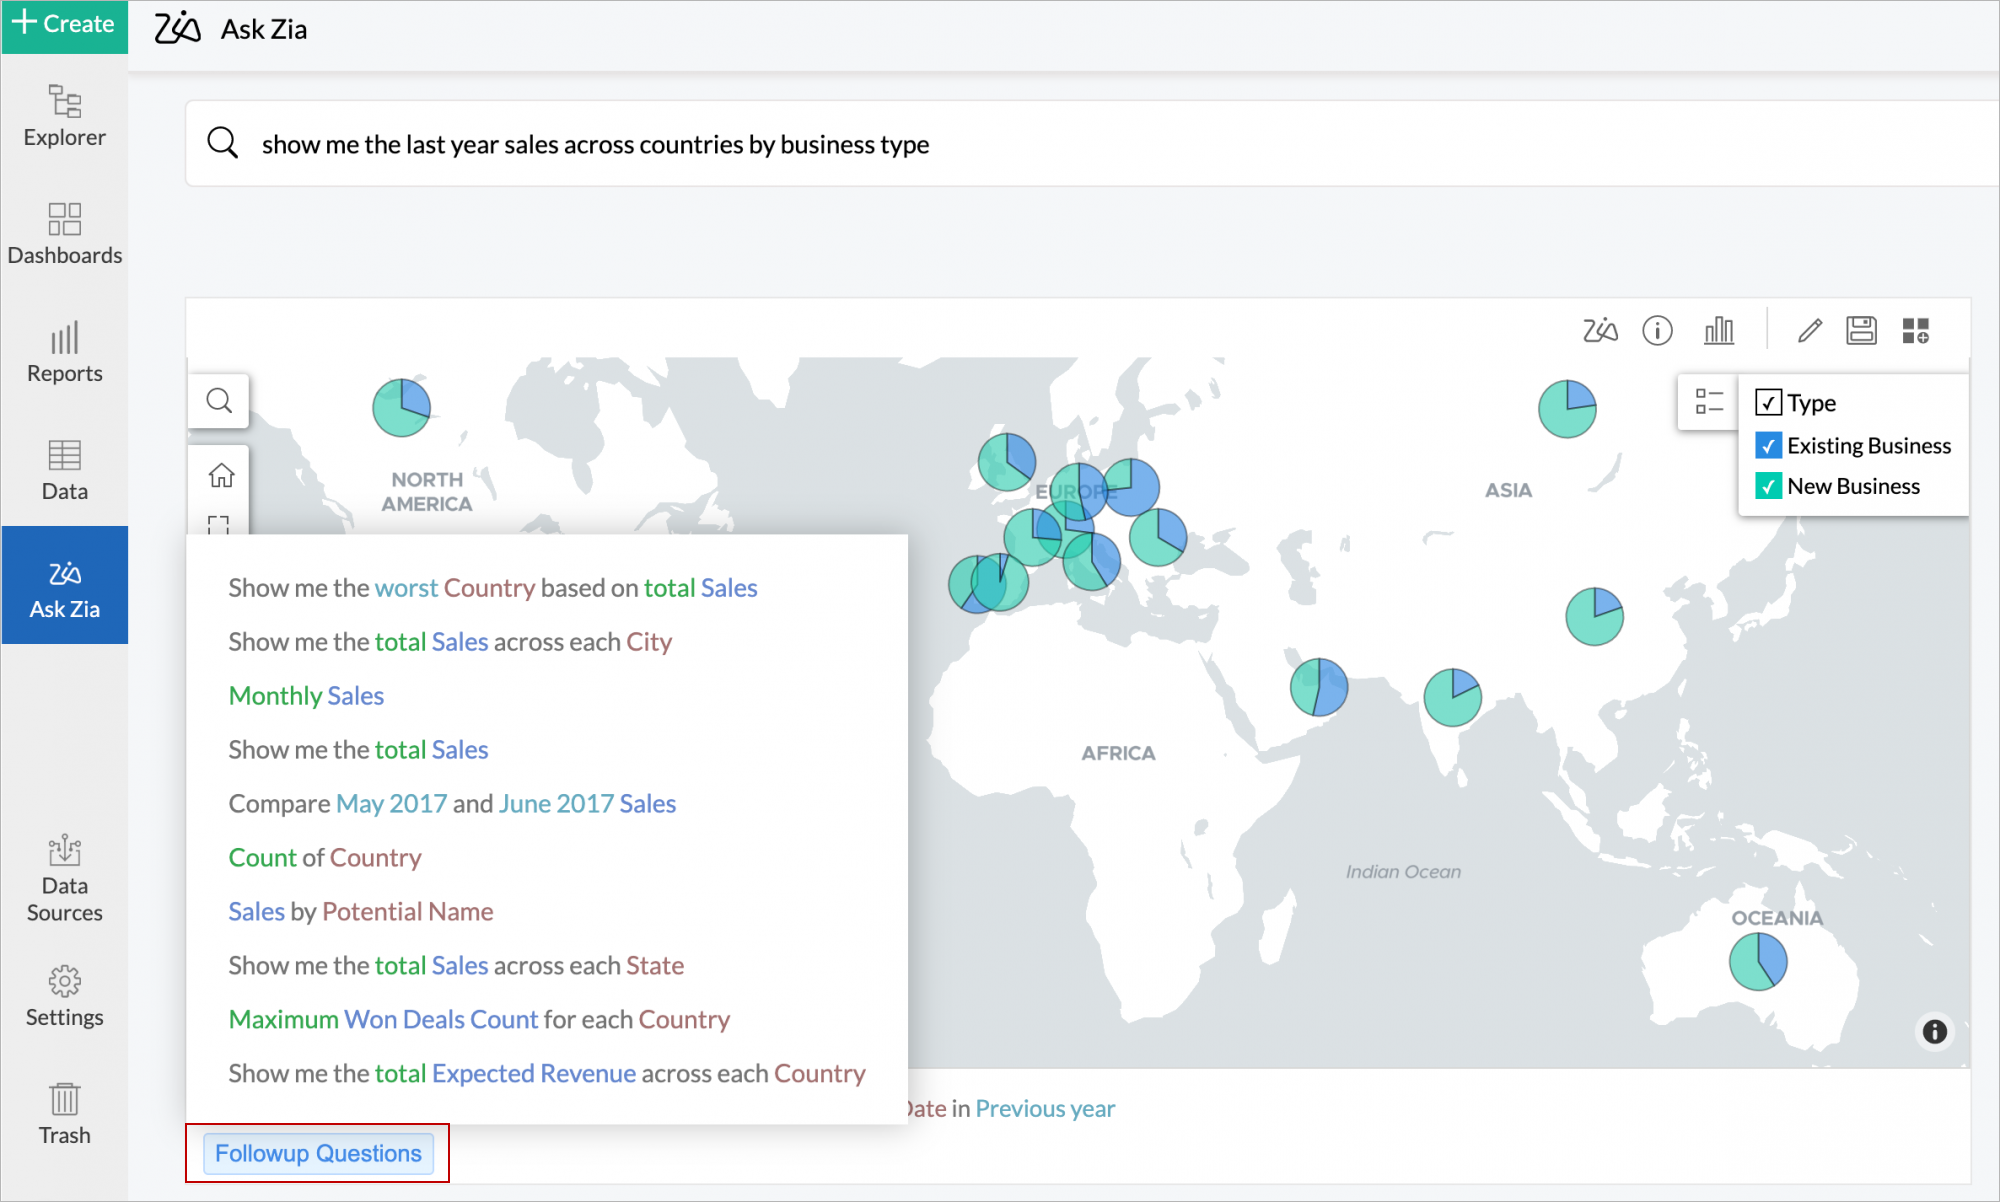
Click here to learn more on this.
Embed Ask Zia in Intranet Applications
Enhancement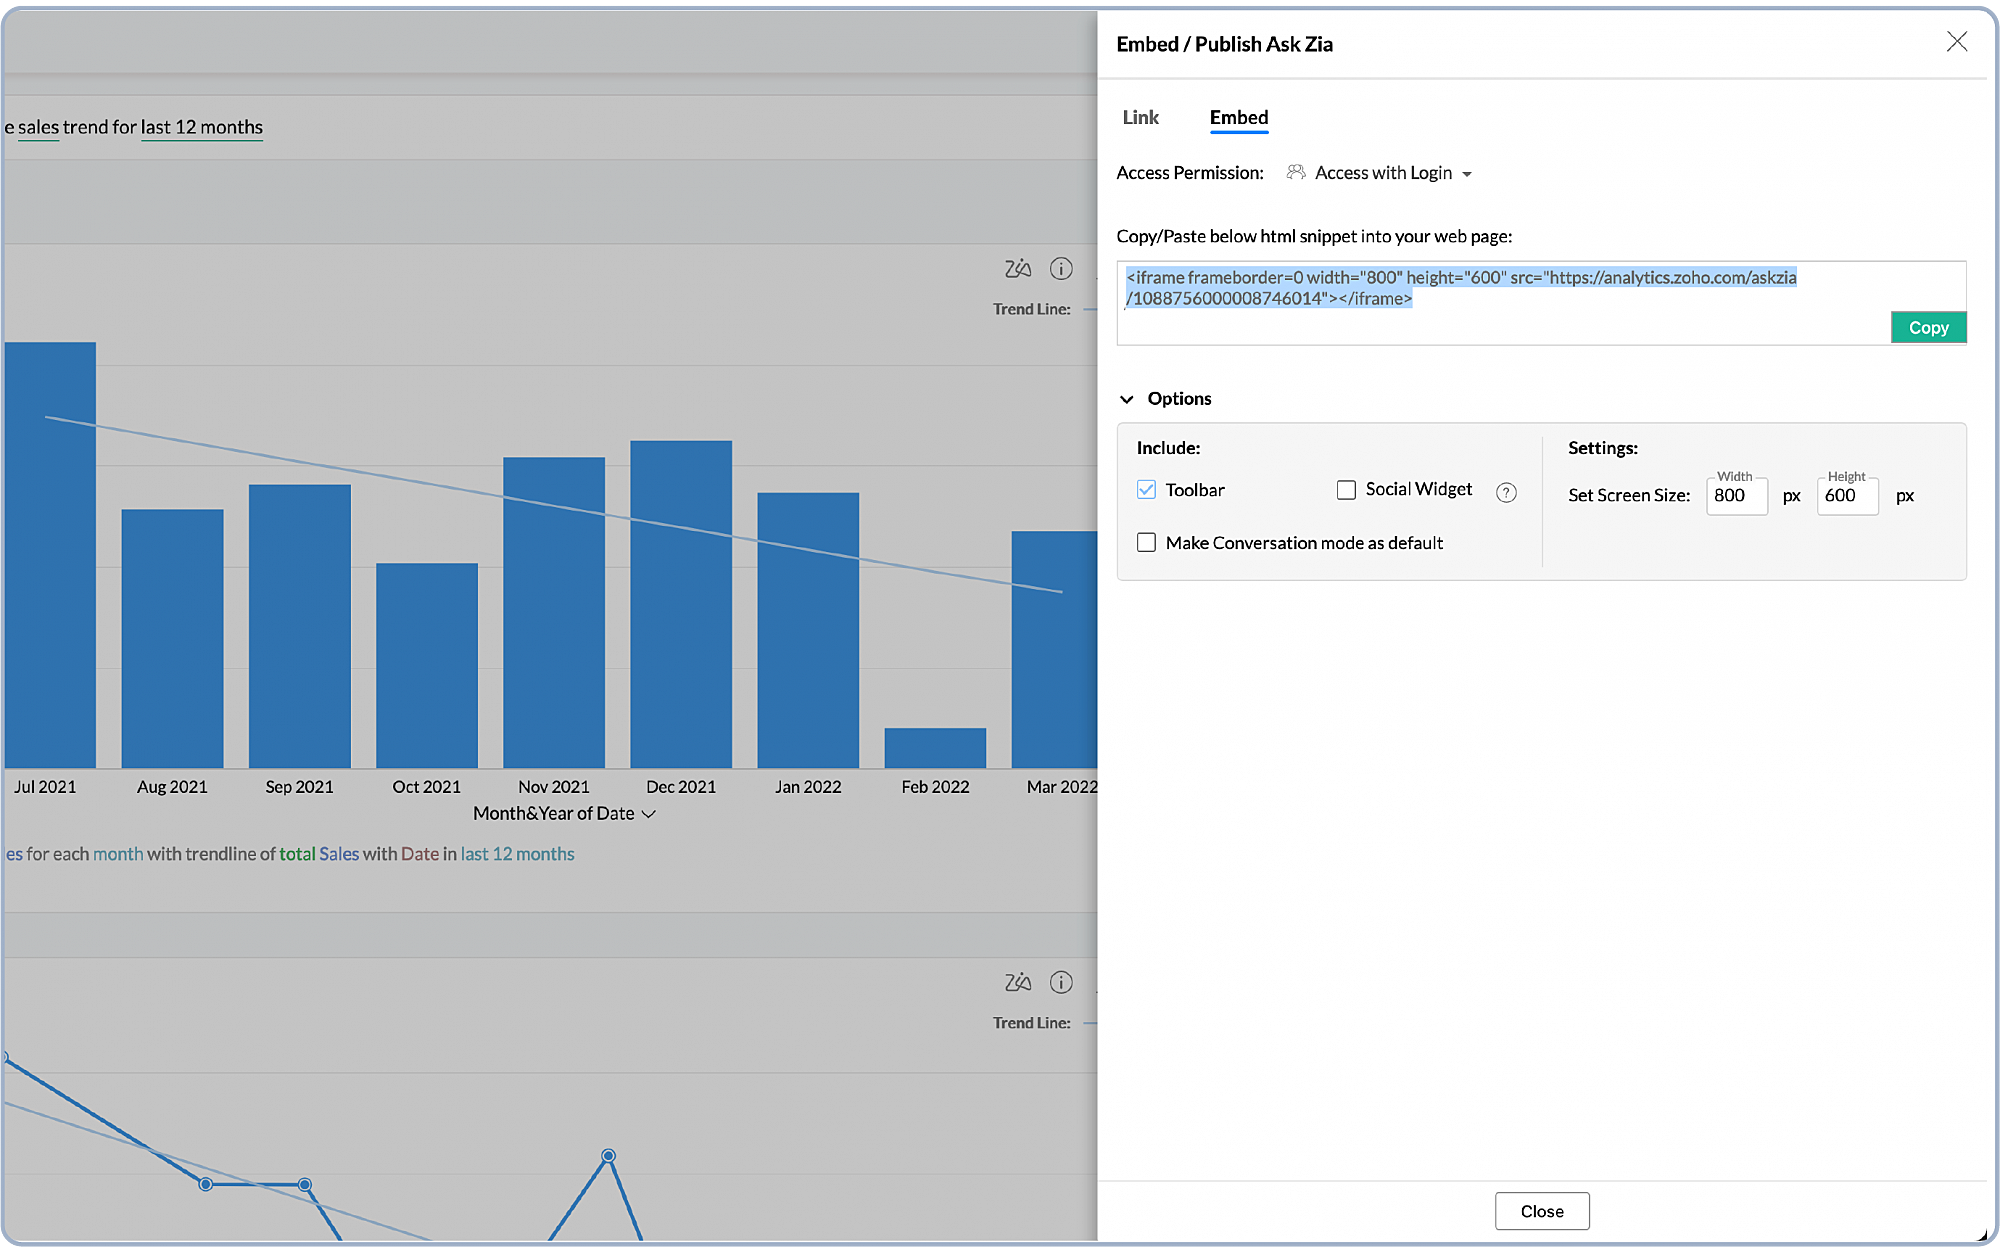
You can now embed Ask Zia within your application screens. This allows you to use Zia in other IT applications that you use in your daily operations. Click here to learn more.
Hide Empty Columns in Report
Enhancement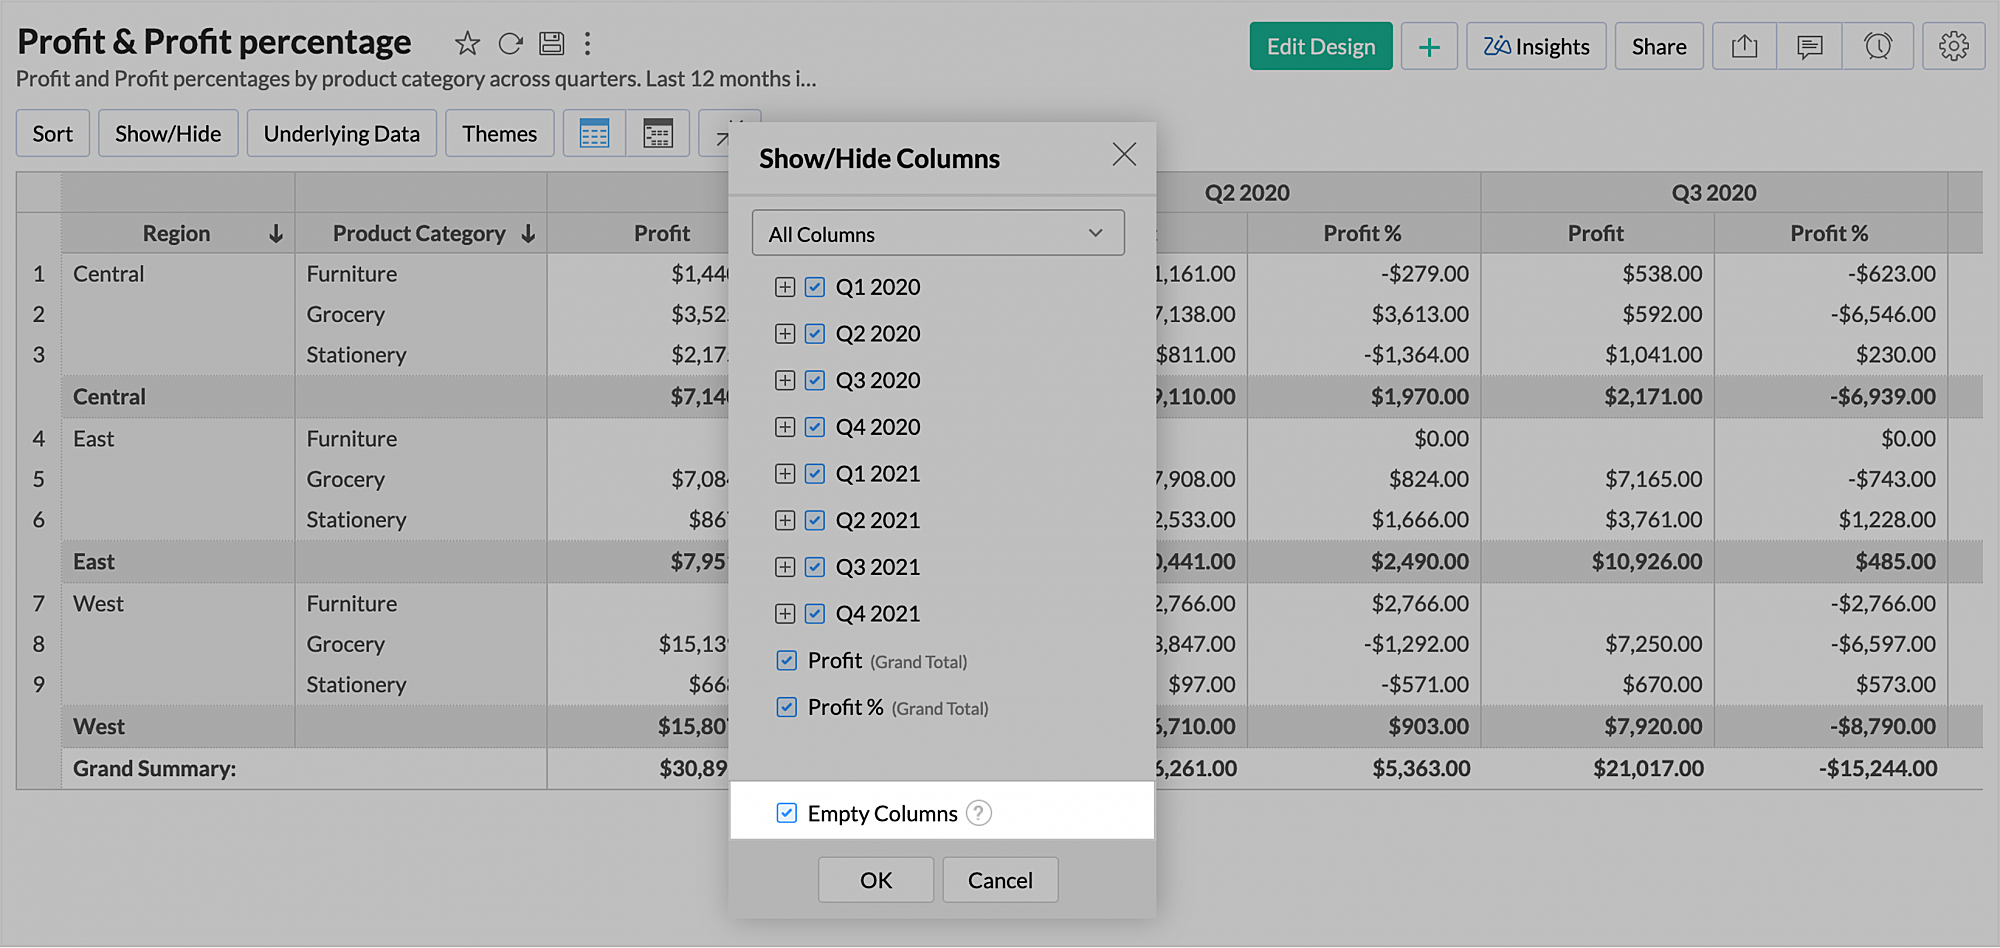
Analytics Plus now allows you to hide empty columns in Pivot and Summary Views. This enhances the look of your reports as only relevant data gets displayed.
Click here to learn more.
Export with Watermark
Enhancement
Now you can include Watermarks to reports and dashboards, while exporting them as PDF.
Click here to learn more.
Trend Line support for Color Chart
Enhancement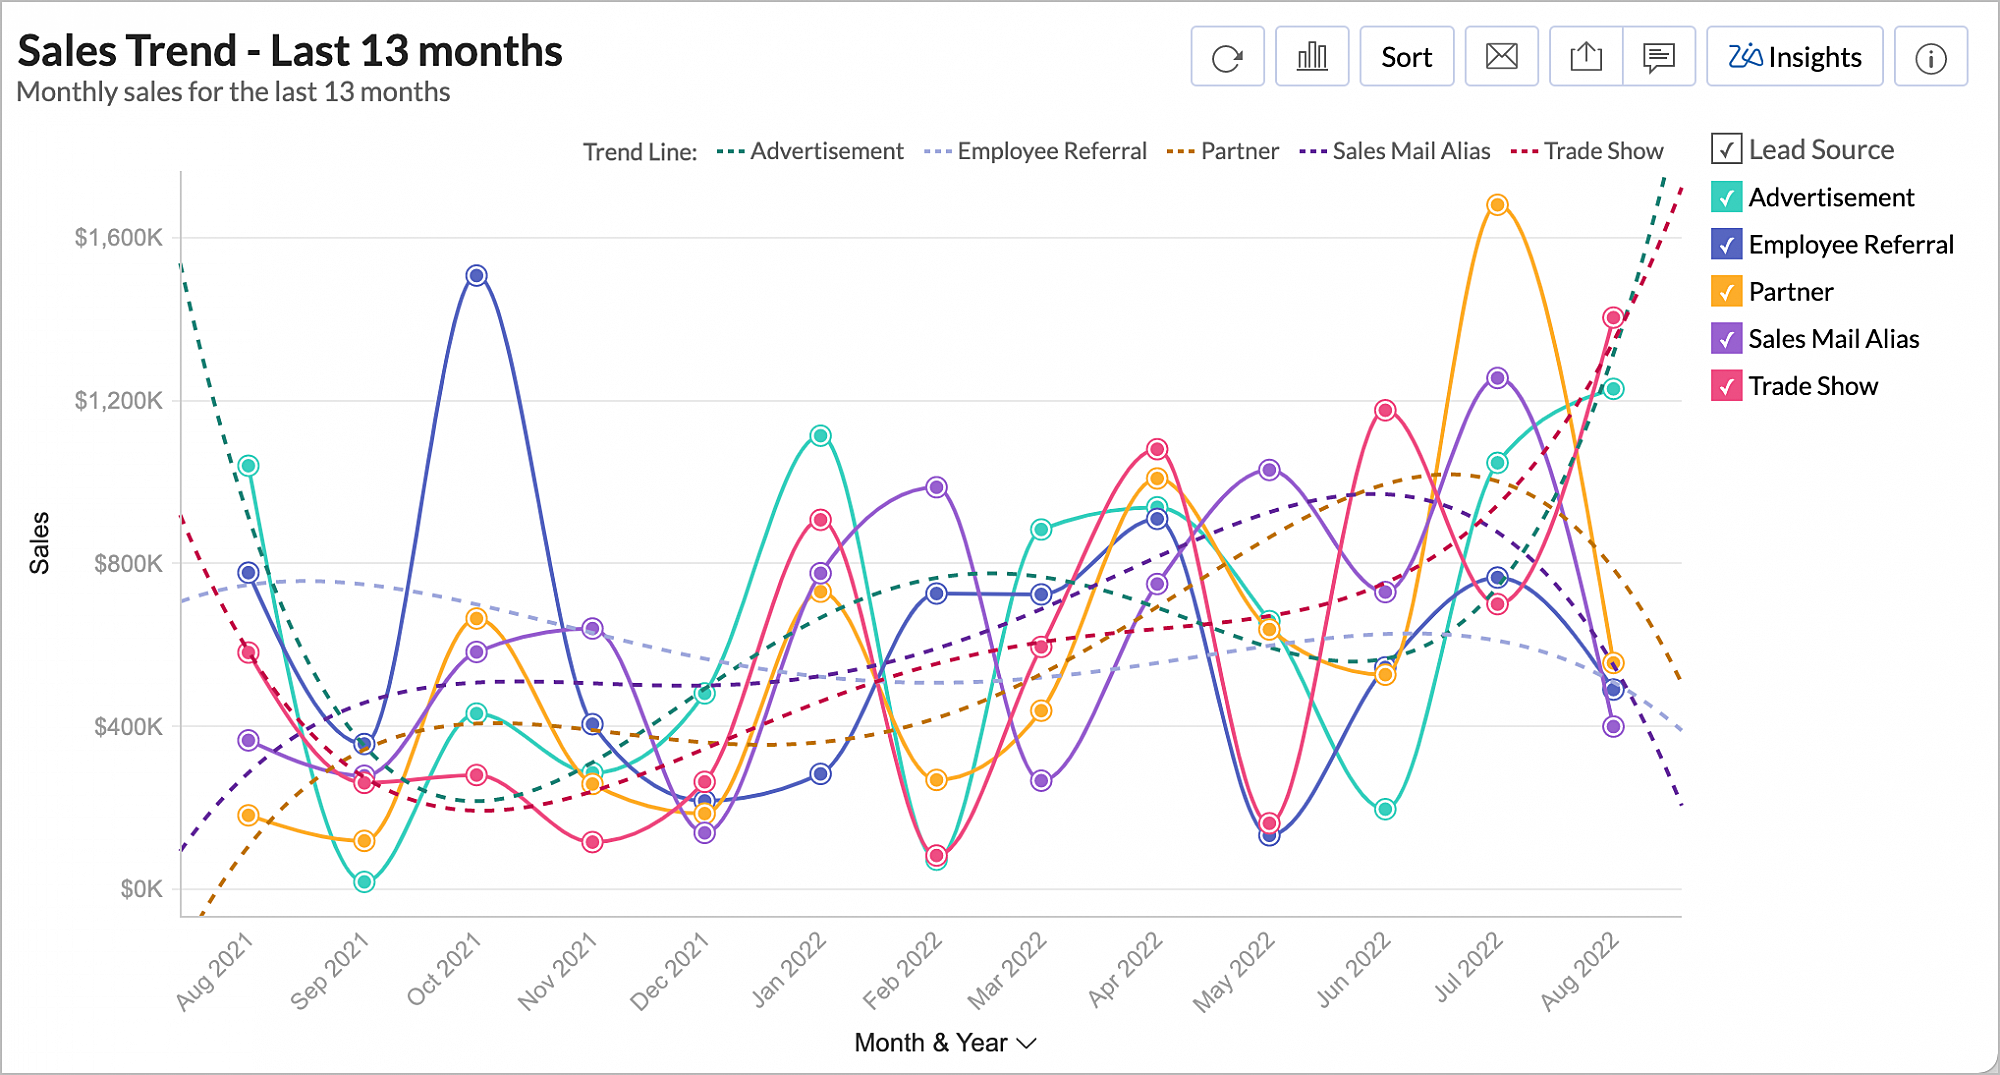
From now on, you can predict the trend line for columns used in the color shelf of the report builder.
Click here to learn more.
Query Table Creation
EnhancementThe following changes have been done in Query Table.
User Interface RevampedQuery Table's user interface has been revamped to improve the user experience. Now, the query editor will still be in focus when you insert the functions and columns by clicking from the list.
New FunctionsSupport for the following new functions are added.
- To Percentage - Converts the data type of the column to percentage.
- To Currency - Converts the data type of the column to currency
- To Decision Box - Converts the data type of the column to decision box
- To Positive Number - Converts the data type of the column to positive number

Compact column width for Tabular reports
Enhancement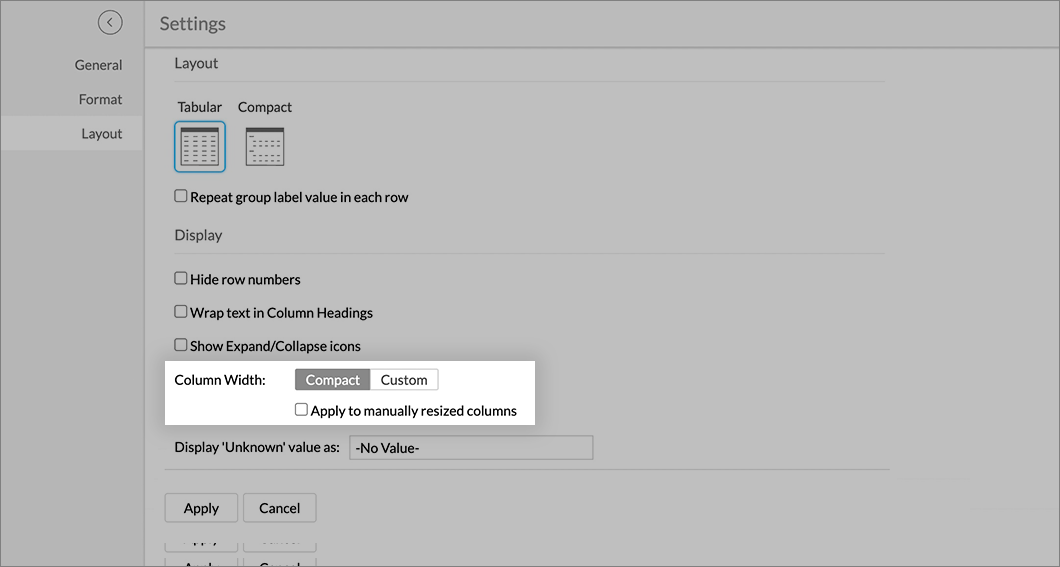
A new option to set compact width is added for Pivot View and Summary View. This option tightly packs the columns in the report, thereby helping to save horizontal space and improve readability without the need to scroll sideways.
Click here to learn more.
Time Slicer as Timeline Filters for Dashboards
EnhancementAnalytics Plus now supports Time Slicer as Timeline filter. This provides dynamic filtering ability with a different section for each date element such as Year, Quarter, Month, Week, Date and Hour. This enables you to easily select the period for filtering the dashboard. The Time Slicer supports an infinite date range for filtering the dashboard.
Click here to learn more.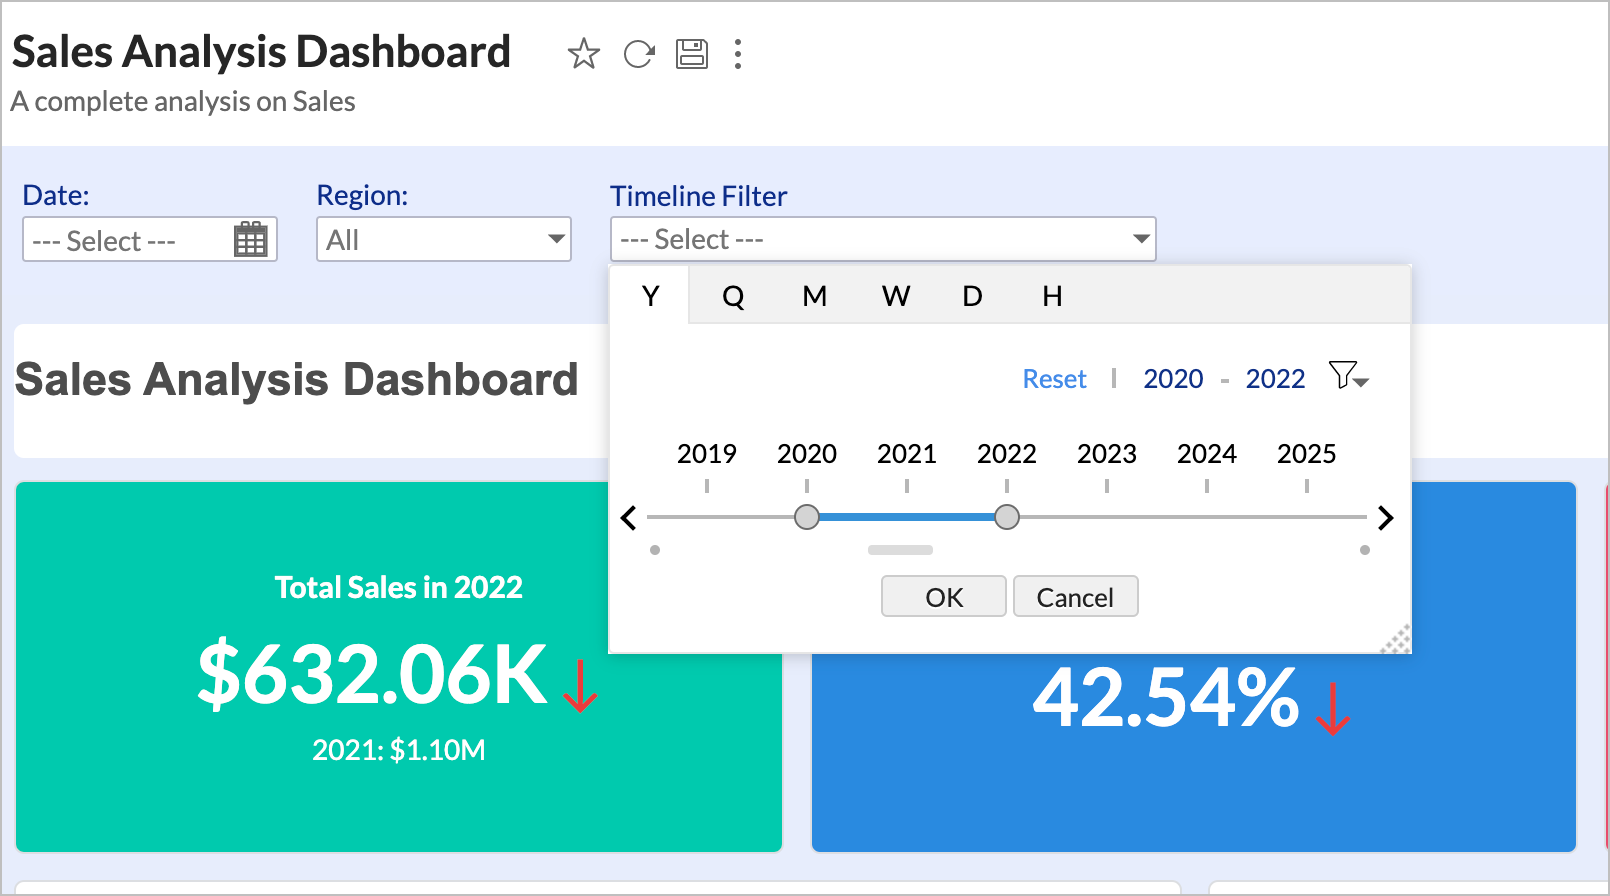
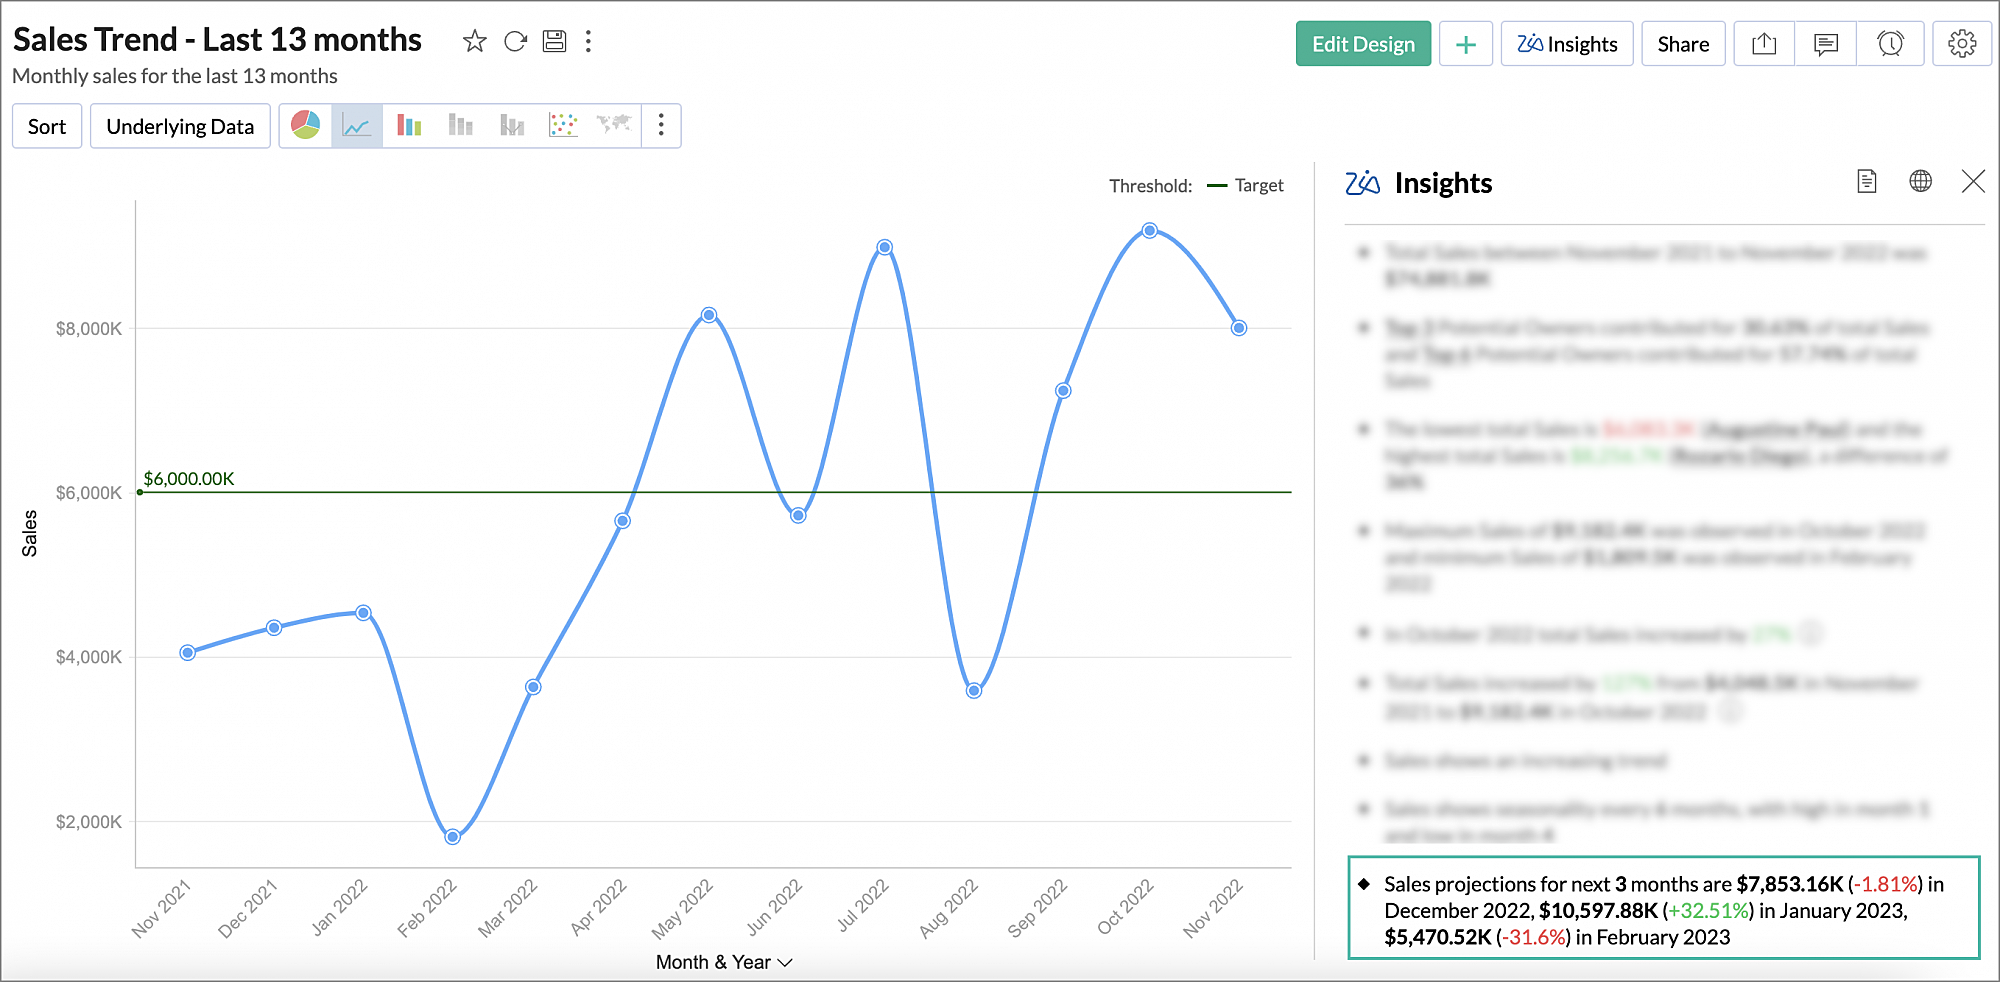
Zia Insights Predicts Future
EnhancementZia Insights can now predict the future outcomes based on data. Predictive narration is included in medium and high verbosity narratives.
Click here to learn more.

Enhancements for Tabular View
EnhancementTabular View has been enhanced with the following features.
Format Tabular View as Table
We've enhanced the Tabular View appearance by formatting it as a table. From now, Tabular View will display only rows and columns with data and remove the empty grid cells that don't apply to the report.
Support for Relative Period in User Filter
Date based User Filter in Tabular View now supports filtering by Relative period.
Click here to learn more on Tabular View.
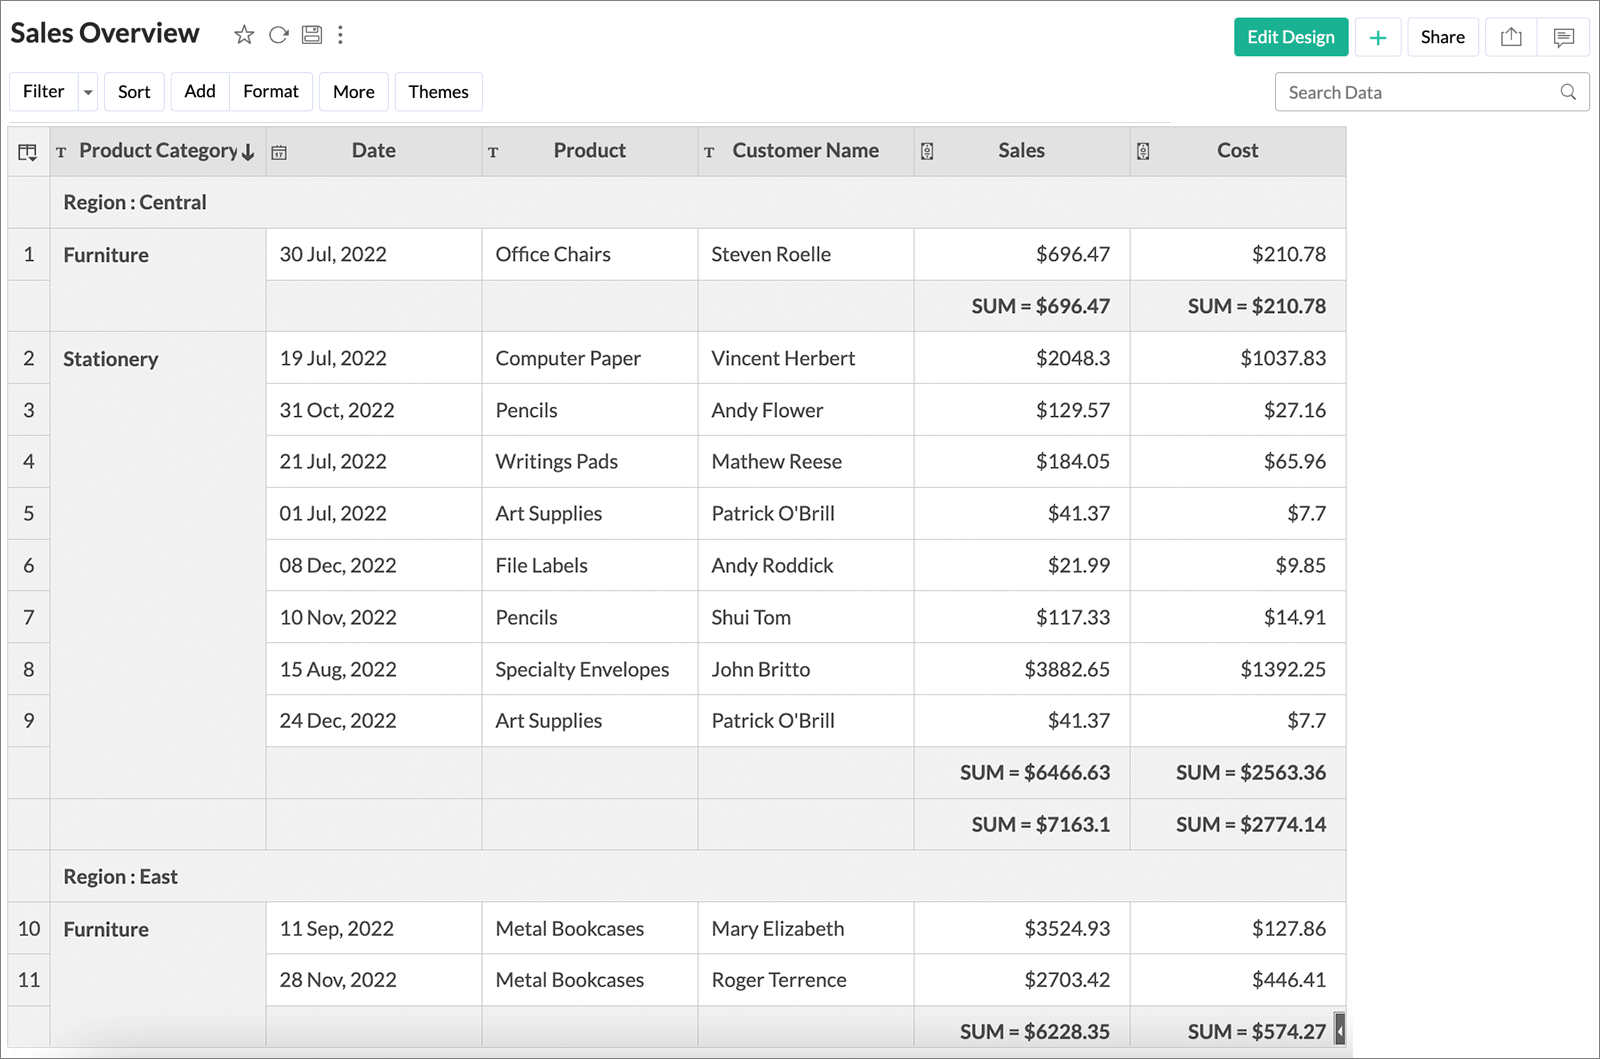
Enhancements in Geo Visualization
EnhancementGeo Visualization now supports the following data types.
- Imports Latitude & Longitude - Imports Latitude & Longitude data in DMS (Degrees, Minutes, and Seconds) format.
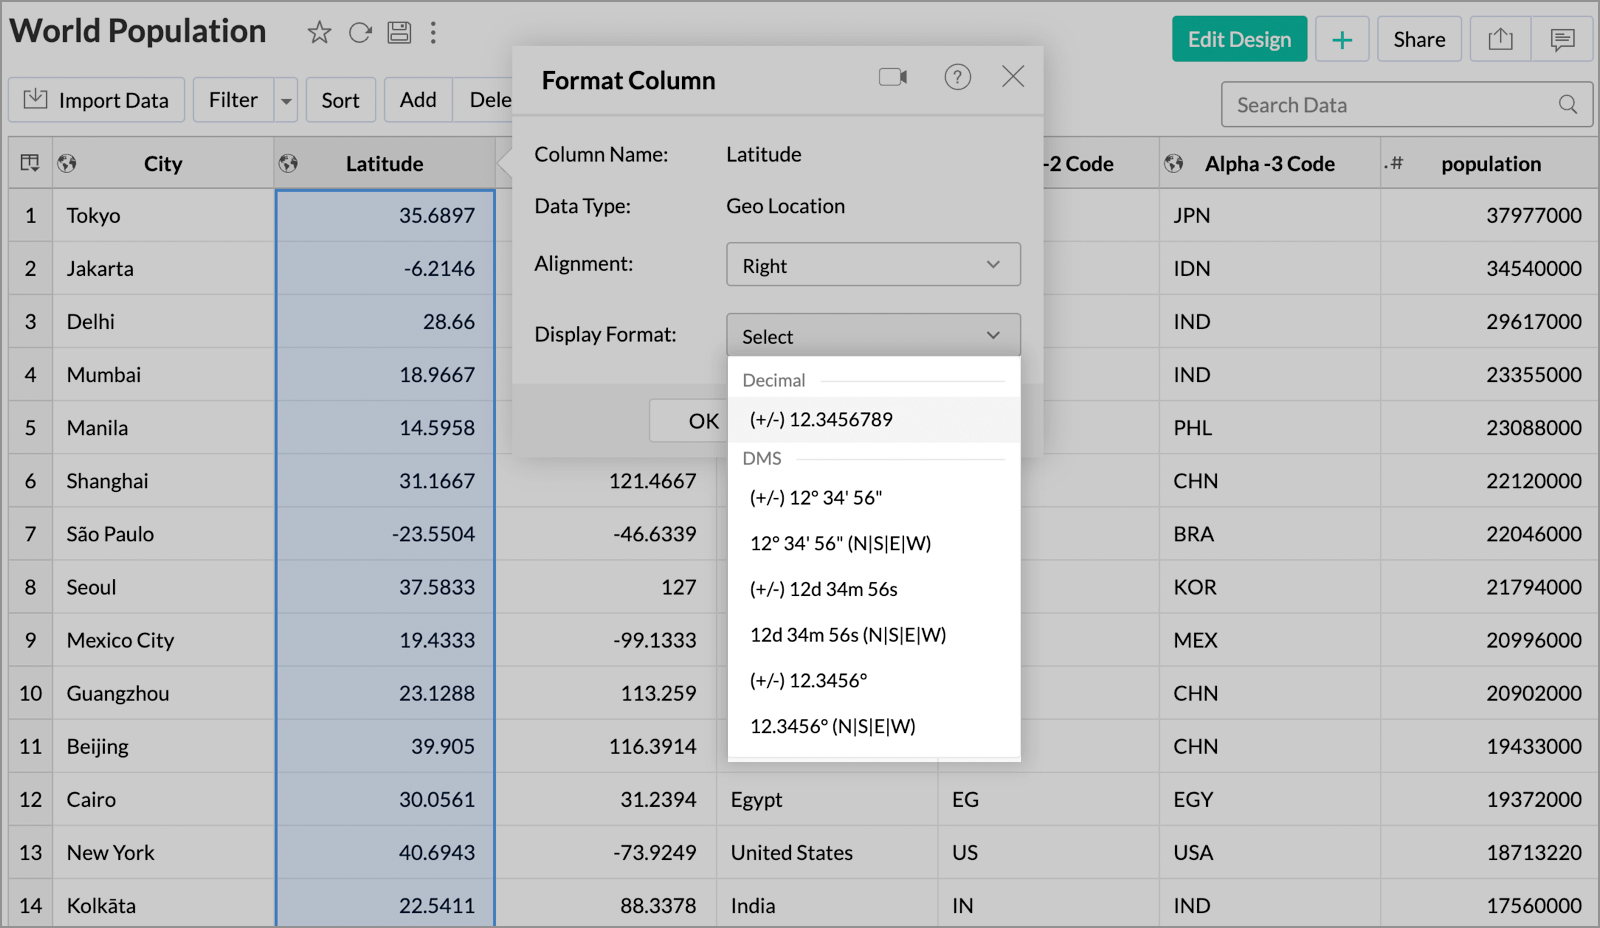
- Identifies Alpha Codes as Geo Data - Identifies the Alpha 2 and Alpha 3 Codes for Country (US and USA as United States of America) and State (NY as New York) as Geo data.
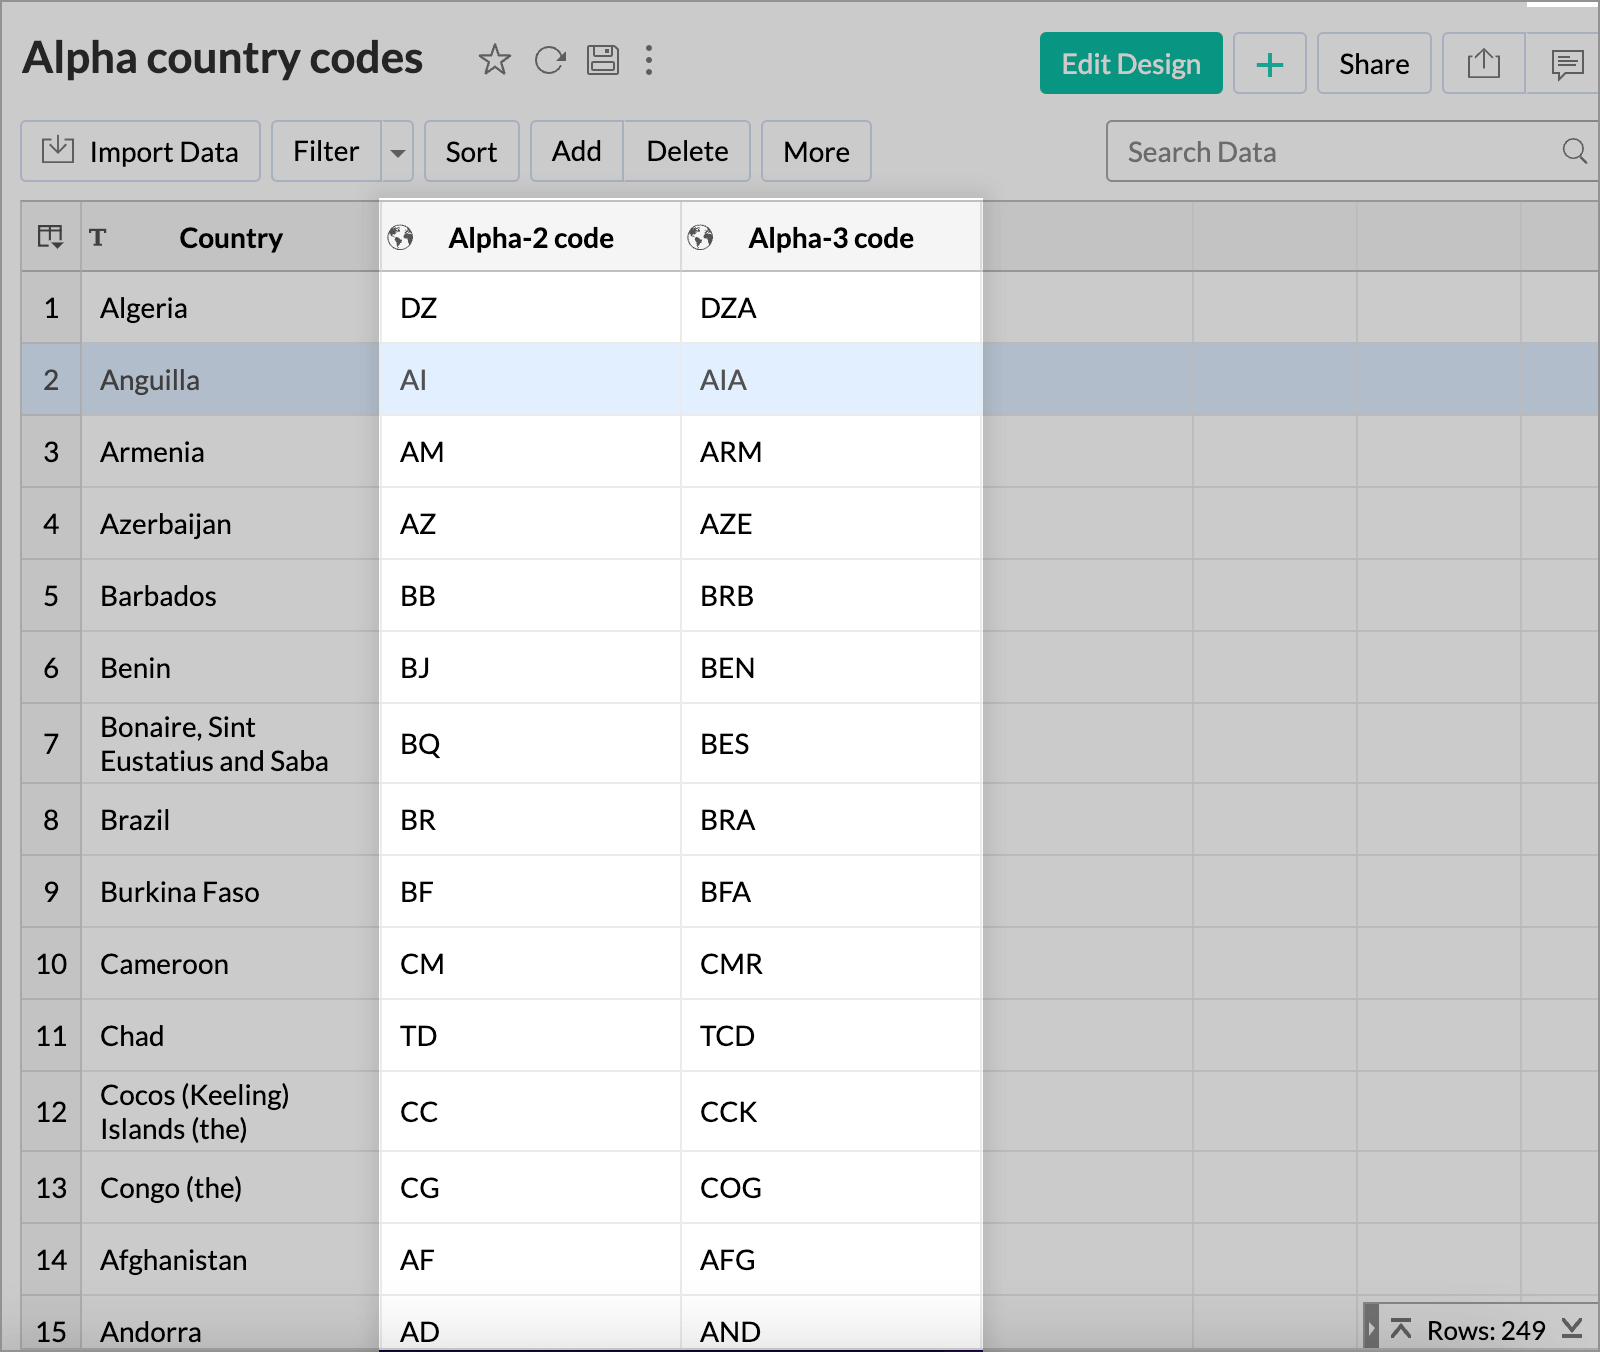
Click here to learn more about Geo Visualization.
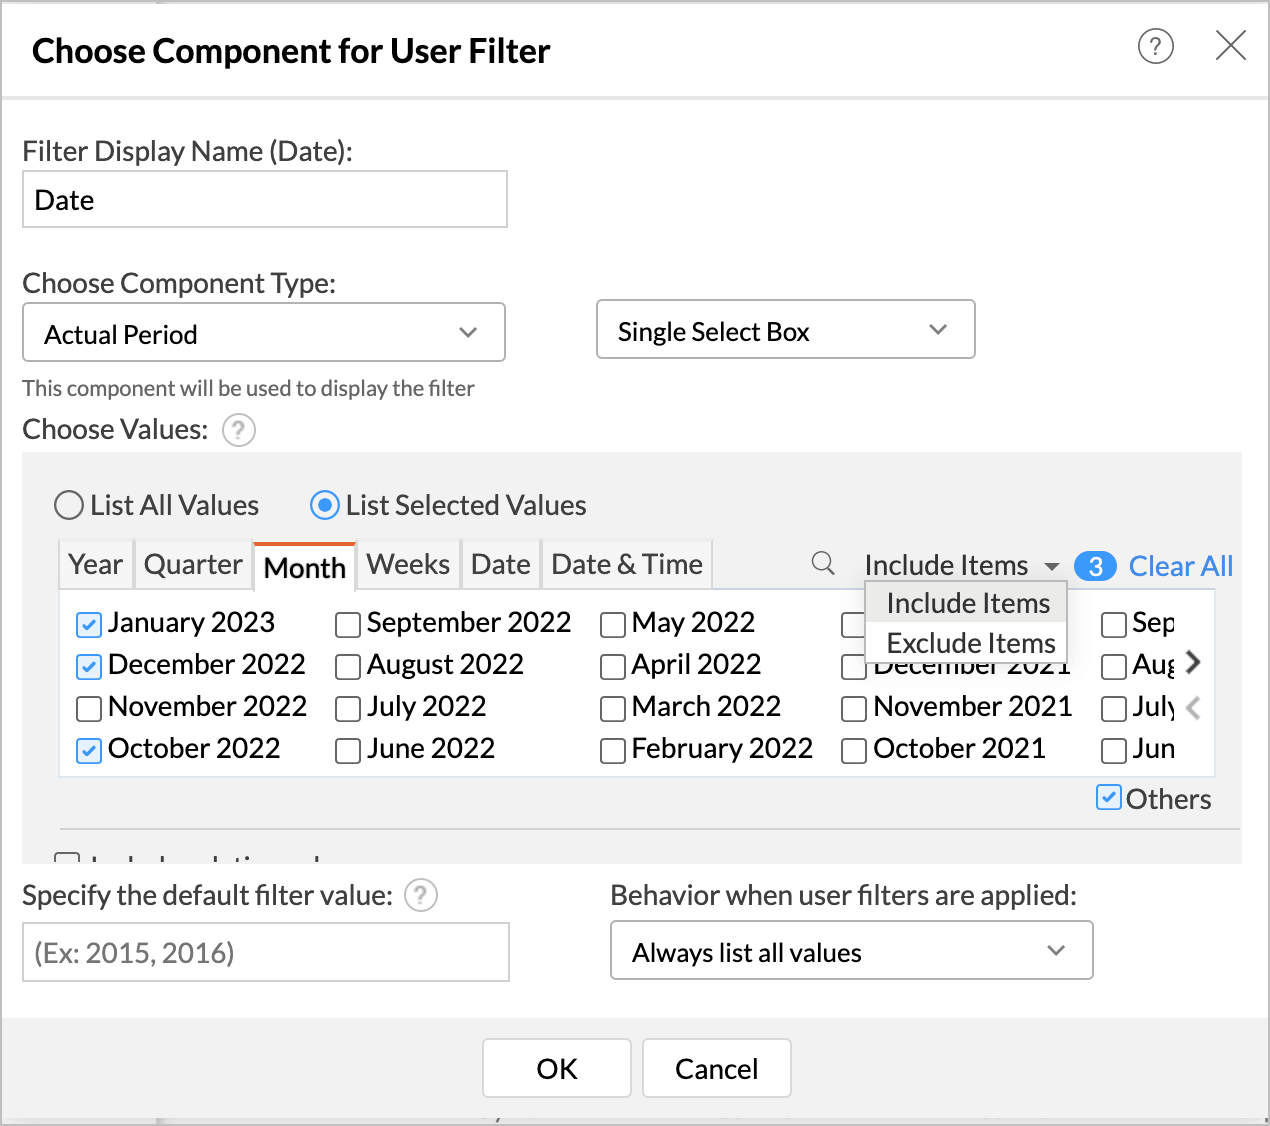
Support to Include/exclude User Filter Values
EnhancementUser filters for all reports now allow you to include or exclude selected items from the user filter values. So far you could only include items but not exclude.
Click here to learn more about User Filters.
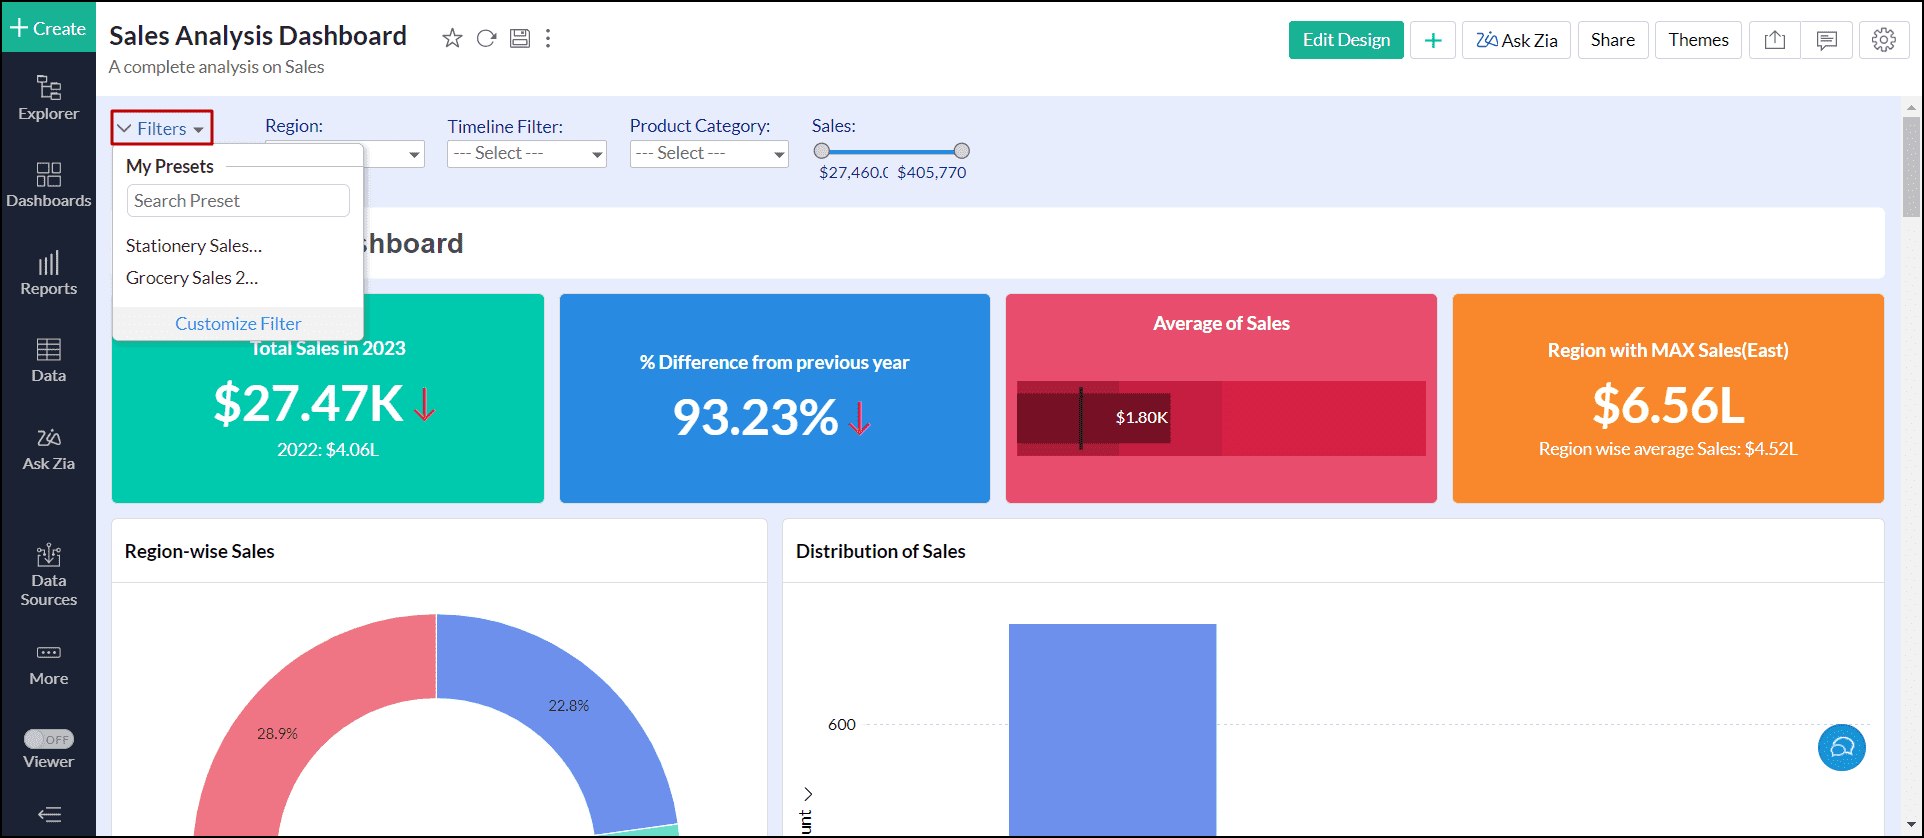
Preset User Filters for Dashboards
NewNow you can define and save preset filters for your dashboard by using user filter combos. This eliminates the mundane task of clicking and selecting values from multiple user filters every time3�4and you can setup multiple preset filters, too!
Click here to learn more about Preset Filters.
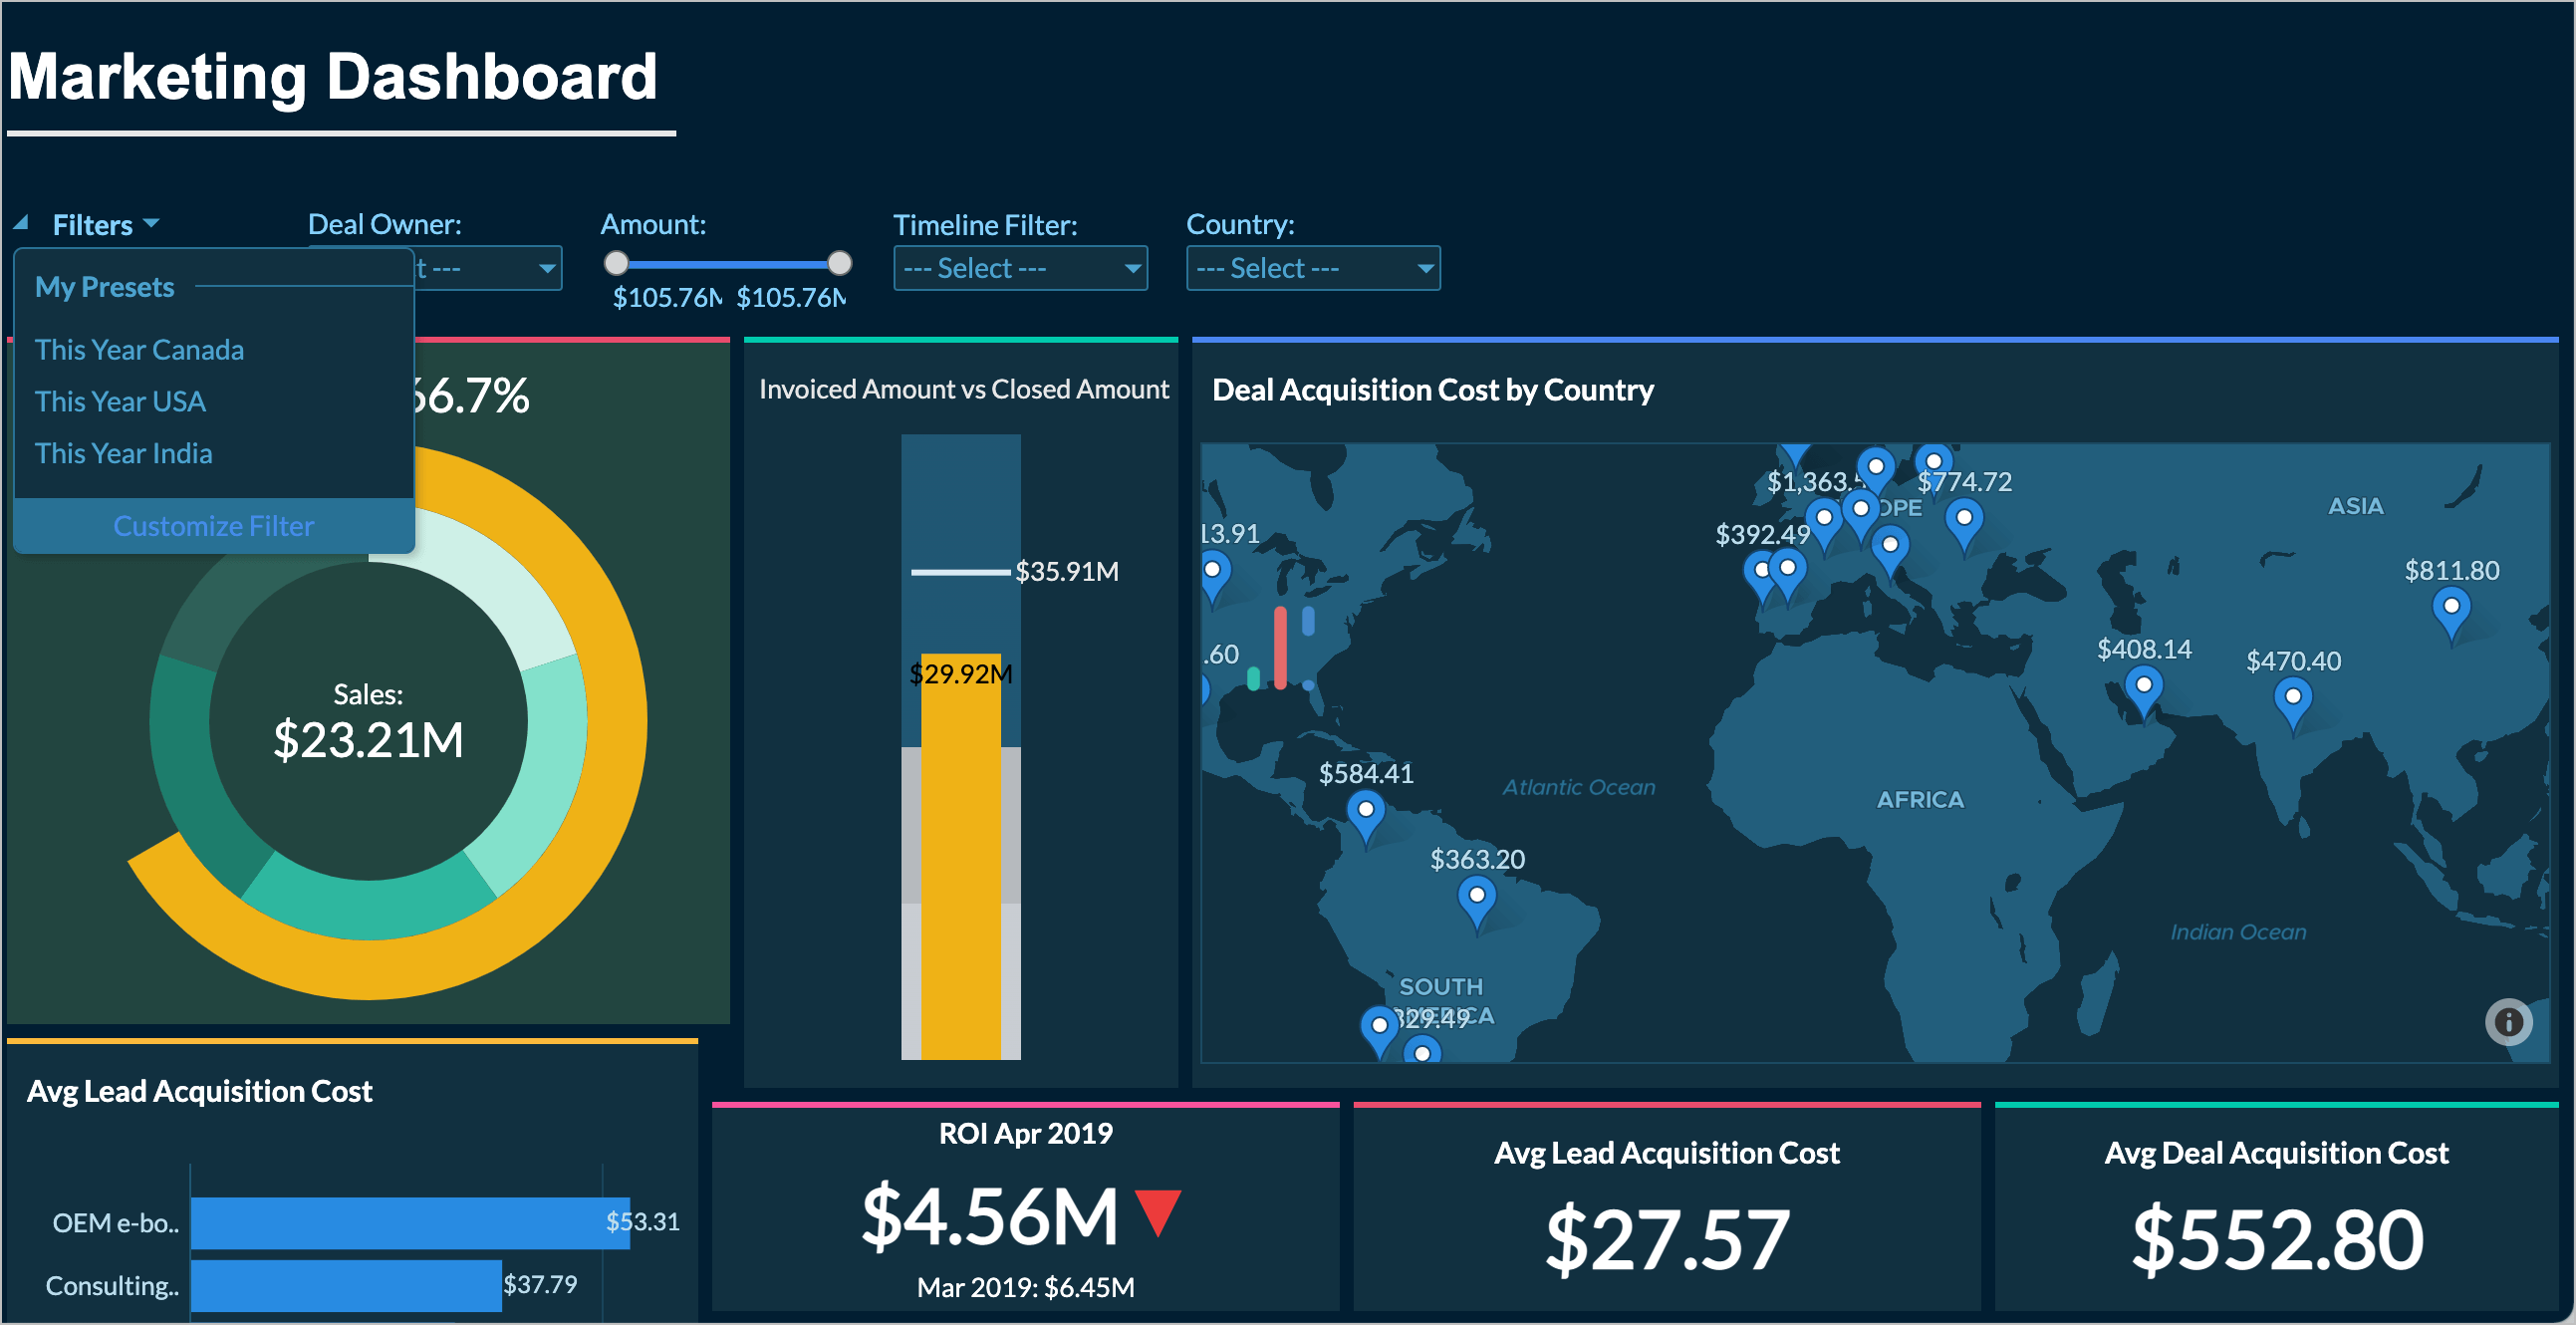
Image Support for KPI Widgets
NewWe now support displaying images as part of your KPI widgets on your dashboard.
Adding images for your KPIs helps viewers grasp information quickly. They also enhance the appearance of your dashboards.
Click here to learn more about KPI with Image.
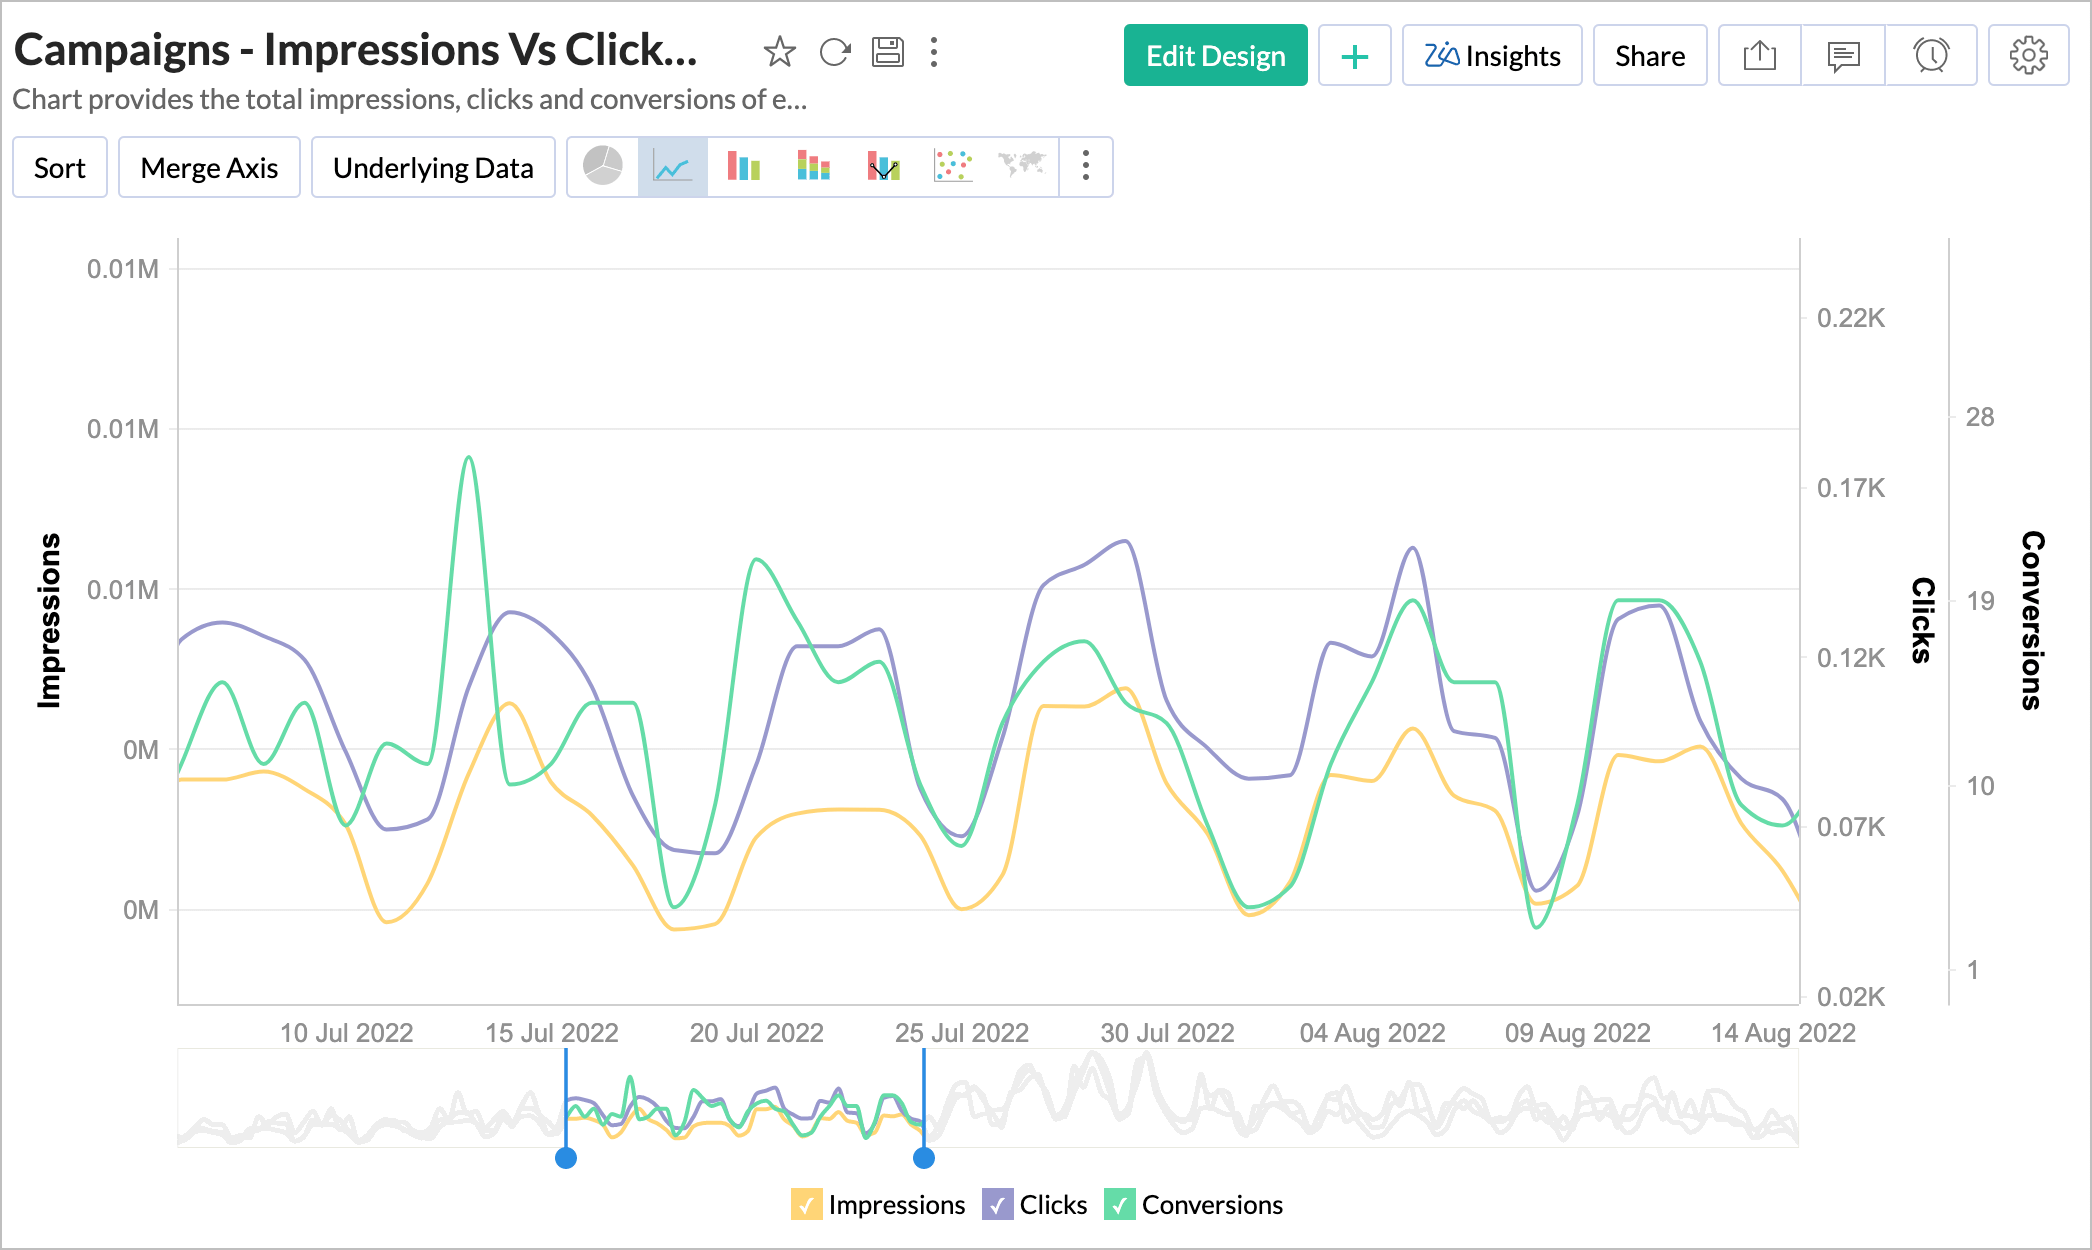
Overview Effect for Charts
NewTo visualize reports with large data sets, Analytics Plus has enhanced charts with new interactive options: the overview and scroll bar effects. These enable you to plot large data on a chart to get a clear picture of the peaks and troughs in your data.
The overview effect adds an overall preview chart (also known as an overview chart) to the bottom of a chart. It allows you to select a region to focus on a particular data range on the chart, for more in-depth analysis.
Dynamic and more interactive scroll charts can now be used to replace filters, which are traditionally used in reports with large data sets. This enables you to easily compare data by moving the slider or scroll bar.
Click here to learn more about the overview and scroll bar effects.

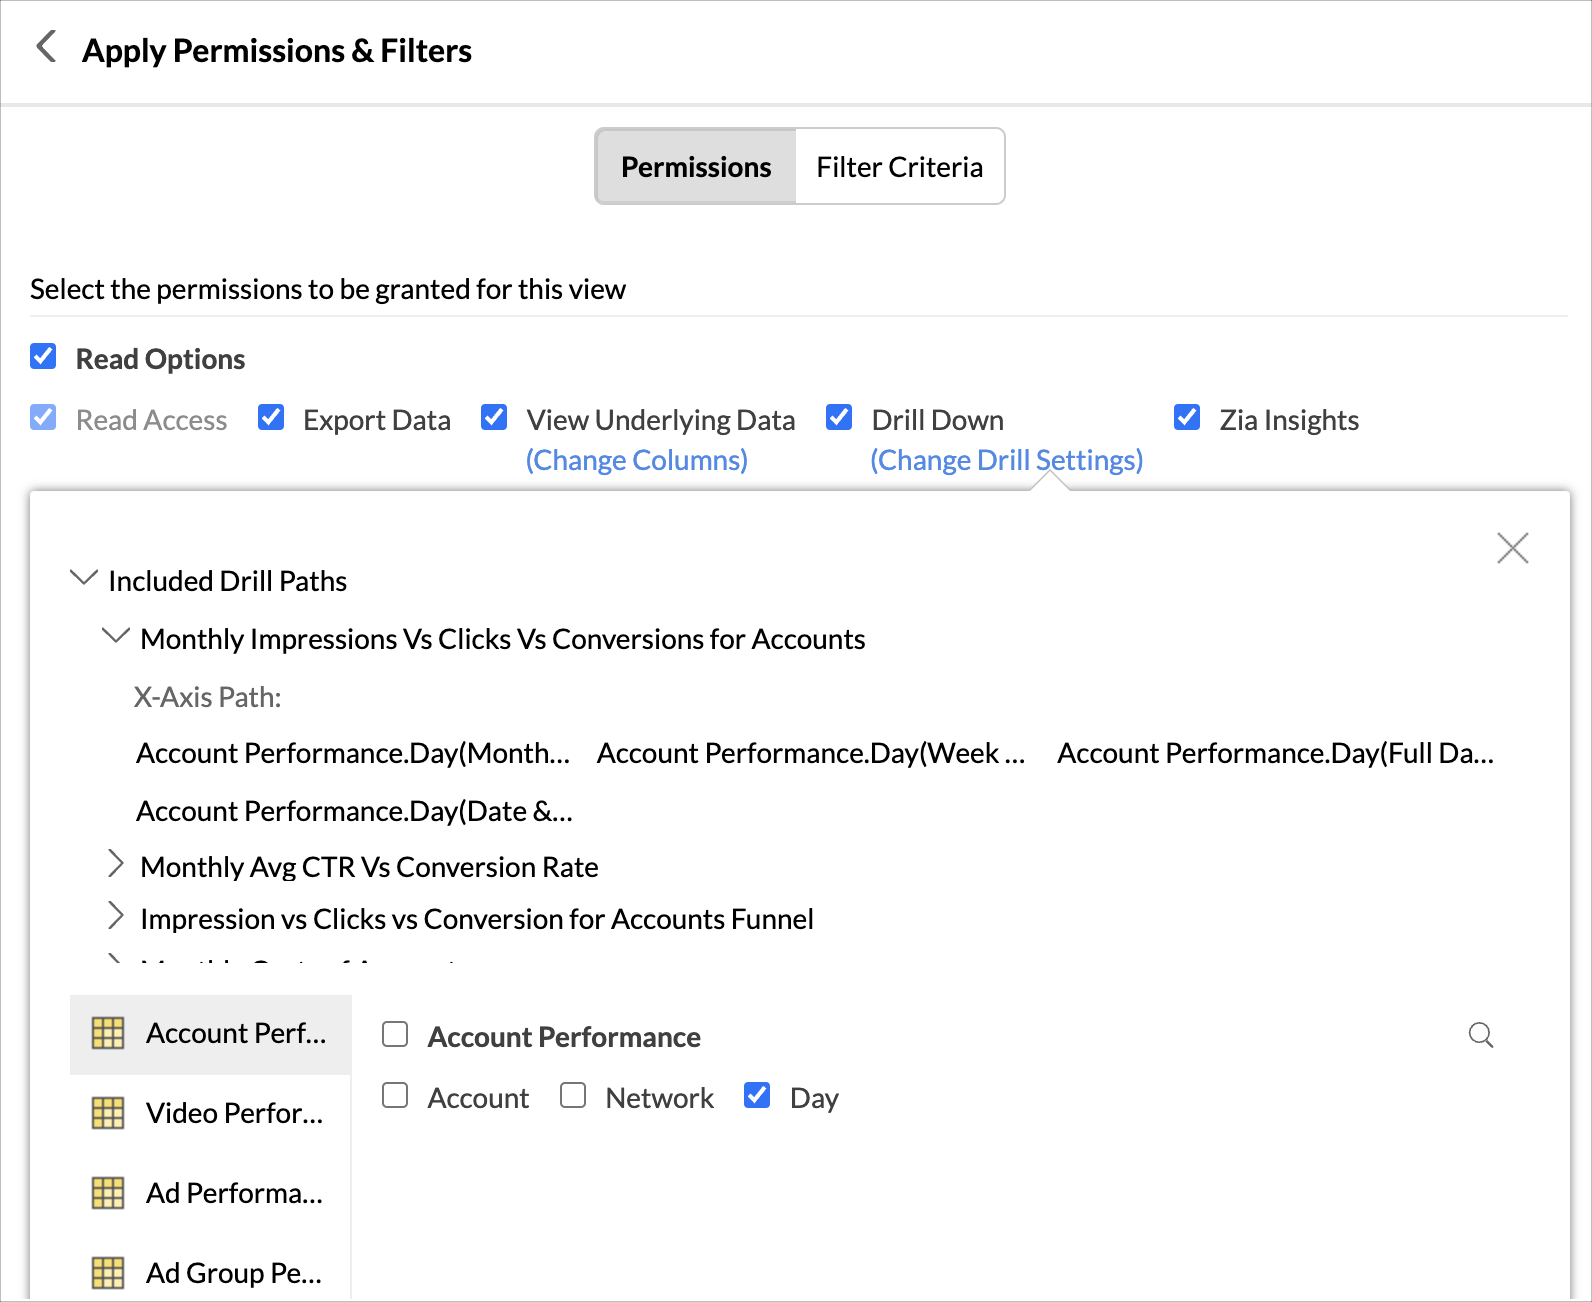
Share Permission enhancement - Drill down path in Dashboards
EnhancementThe Share permission in Dashboards is enhanced by listing the Drill Paths for all the reports used in the dashboard.
Click here to learn more.
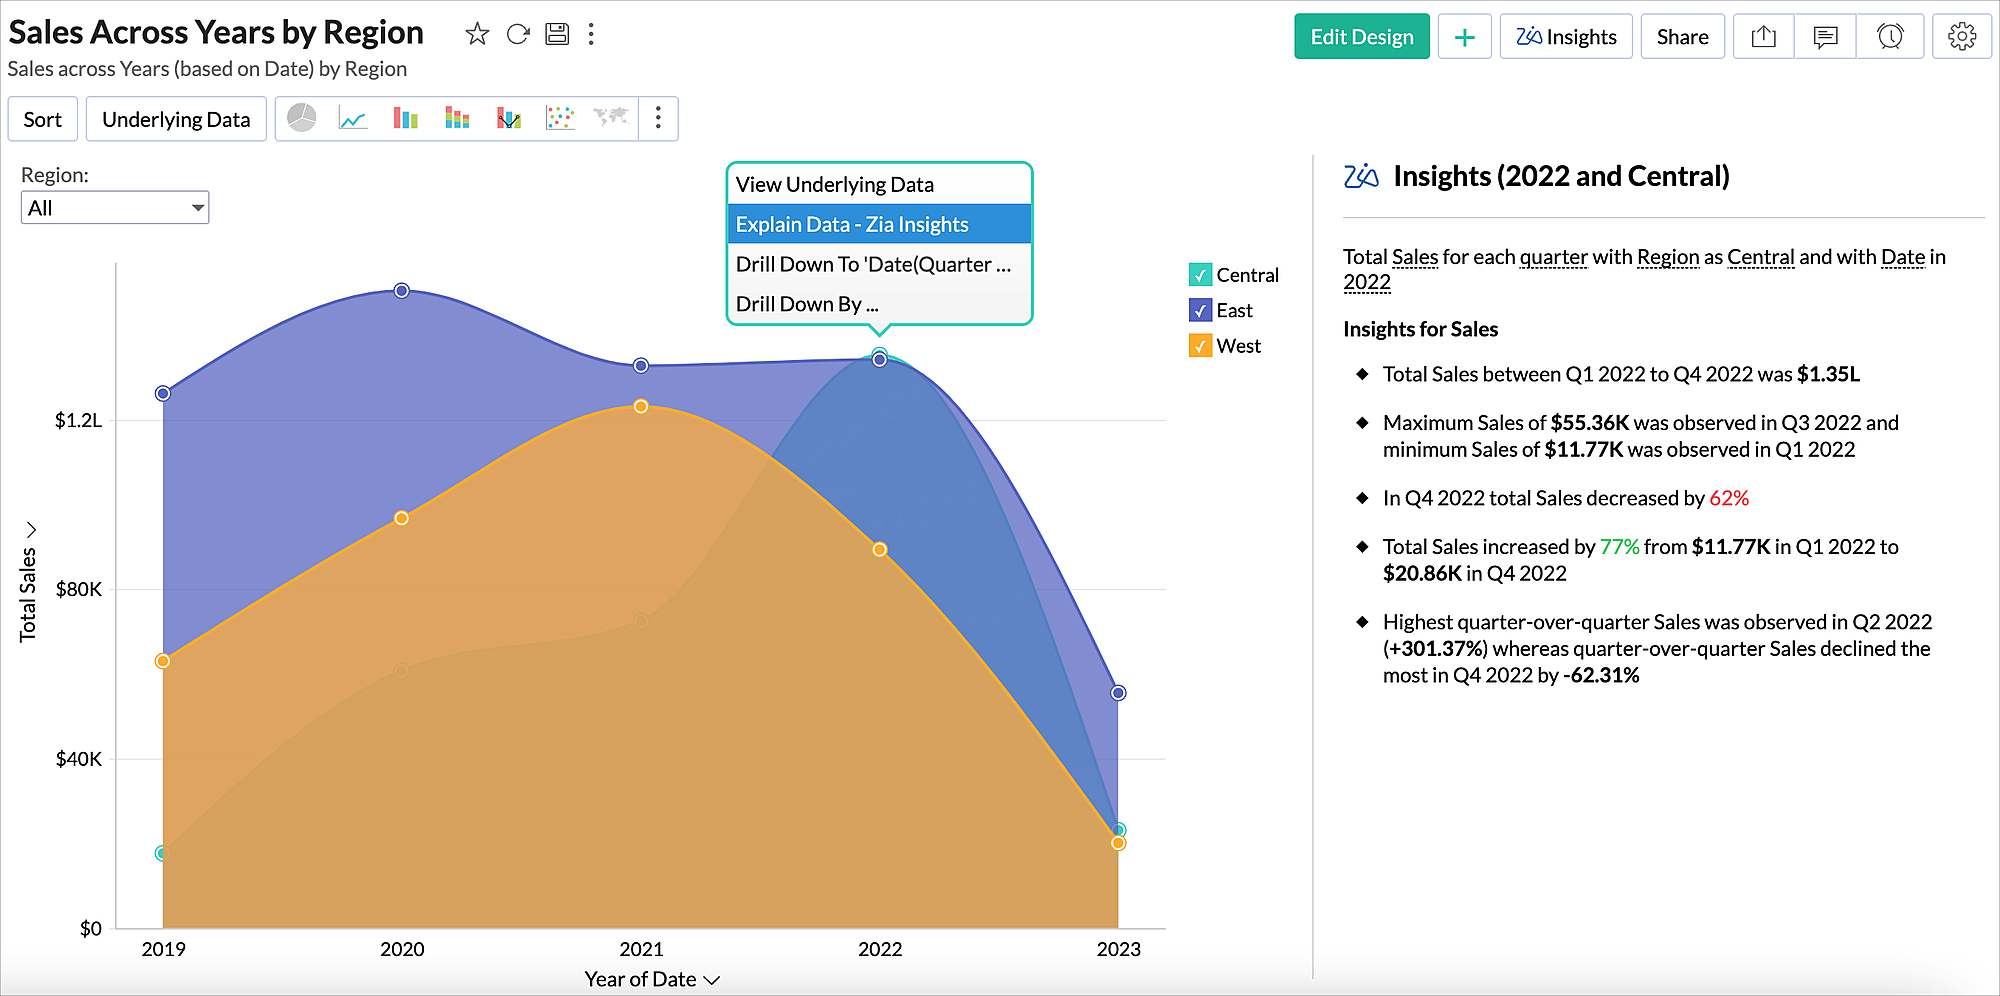
Explain Data - Zia Insights
EnhancementThe Explain Data - Zia Insights feature provides information related to the selected data point in the report. This helps in identifying significant changes or anomalies in the data.
Click here to learn more.
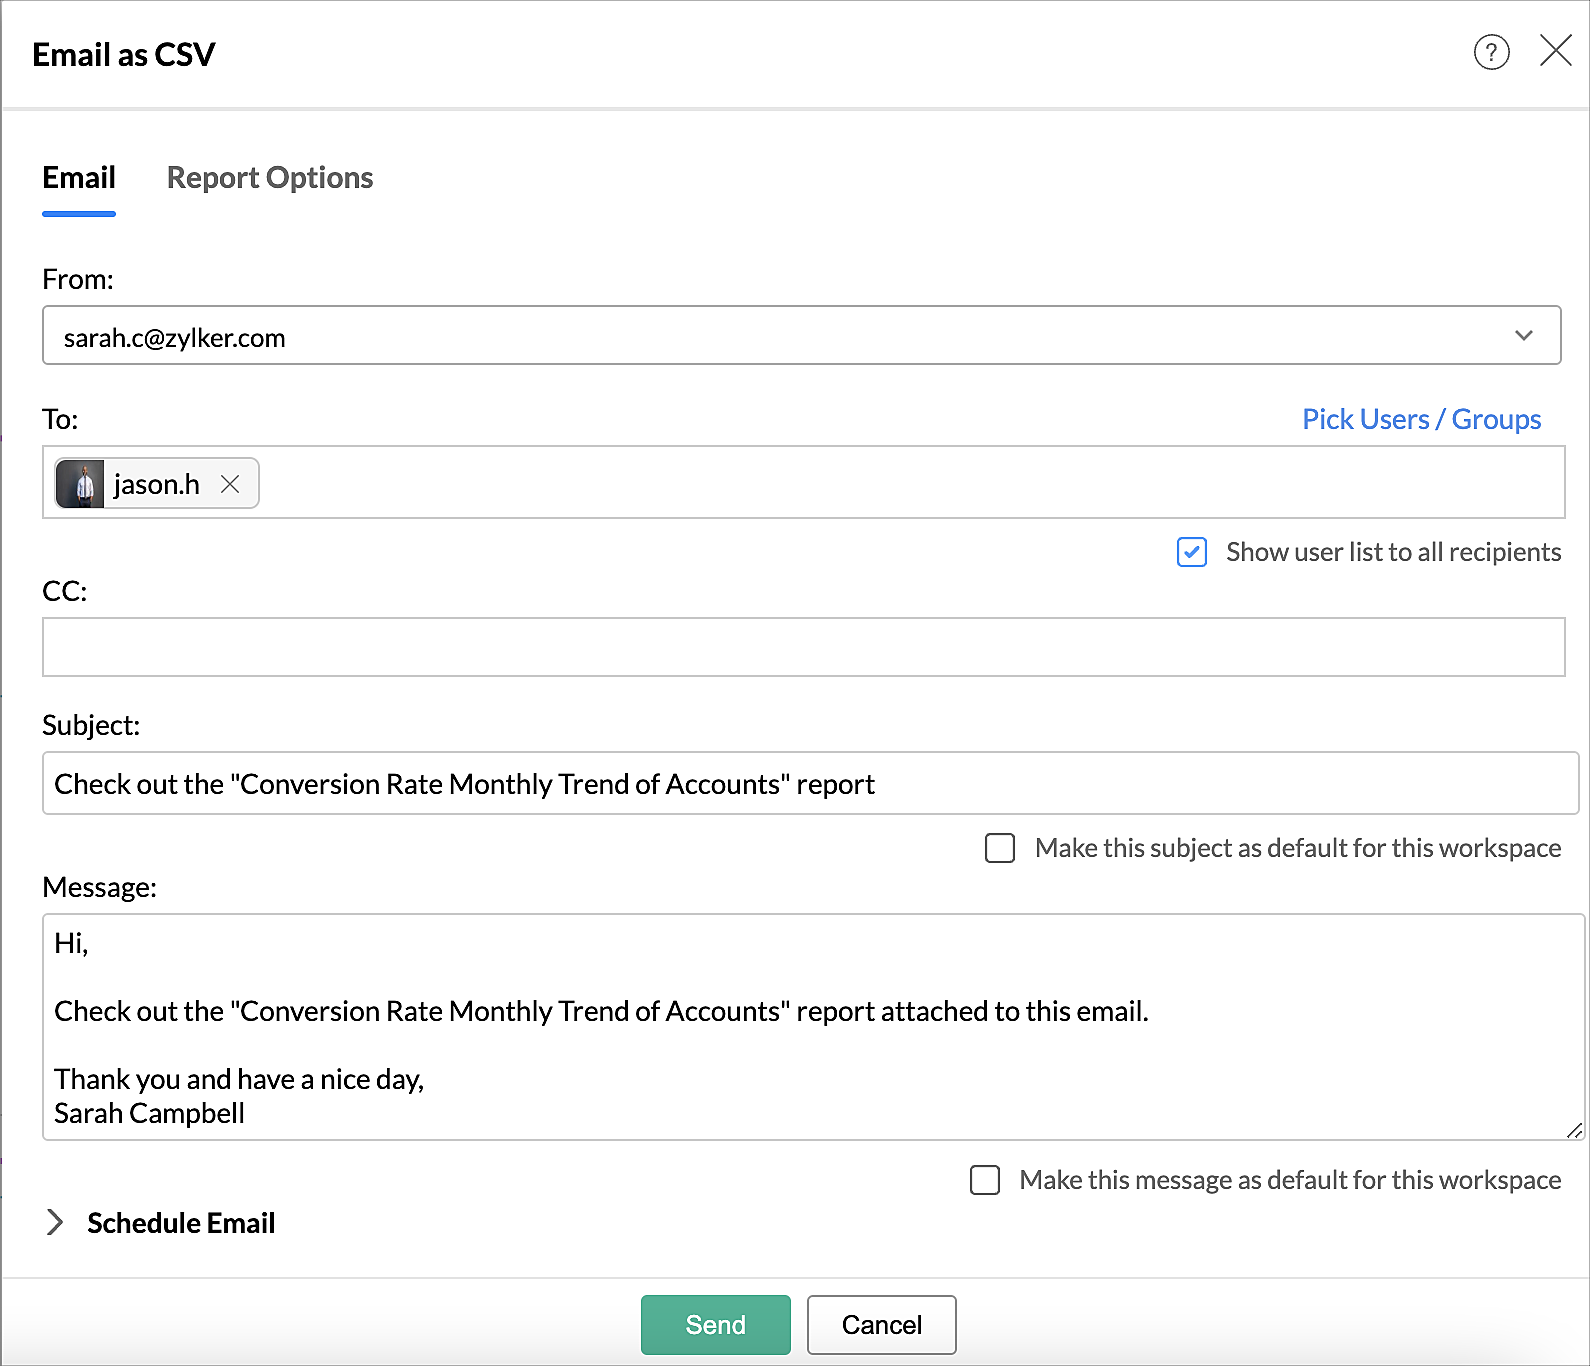
Emailing Views - CC Support
EnhancementAnalytics Plus now supports cc (carbon copy) functionality while emailing views. This helps to keep your team members, clients, partners in the loop without making them the primary recipient.
Click here to learn more.
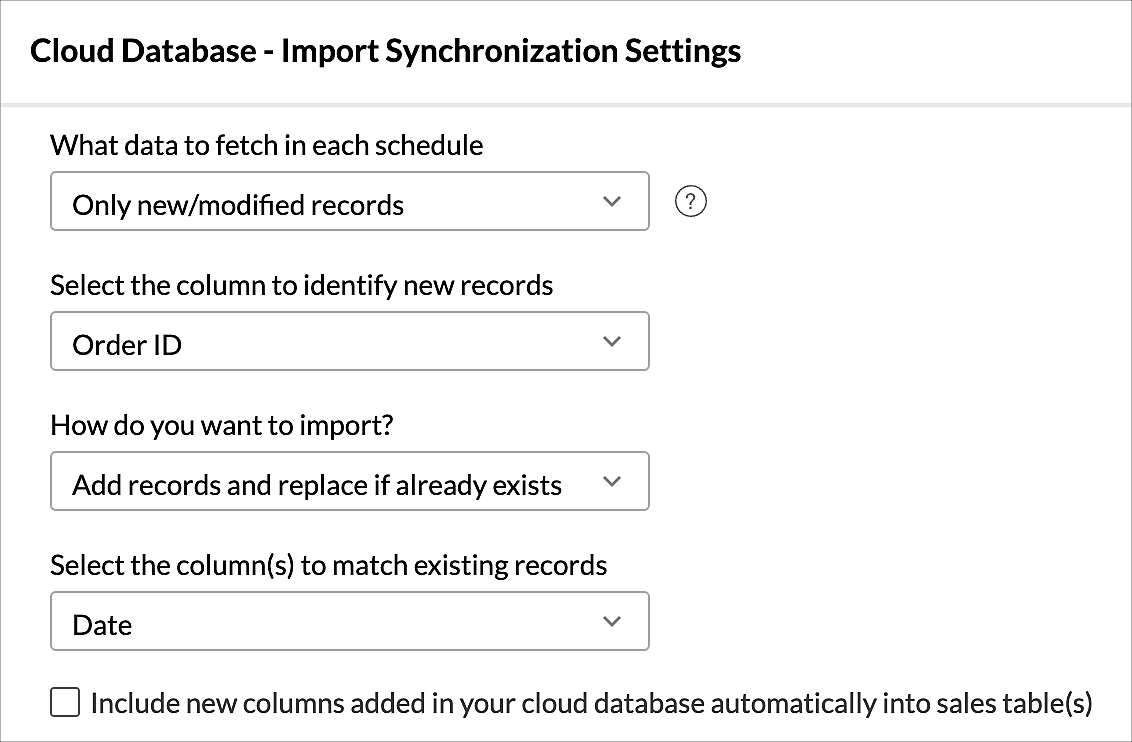
Incremental Fetch for Databases
NewWith the incremental fetch for databases, you can import only the newly added records in the databases to Analytics Plus without fetching the entire dataset during each sync cycle. This could be beneficial while working with large datasets and saves time.
Click here to learn more.
Notify admins on import failures
EnhancementOn continuous import failures, you can now choose to notify the Analytics Plus account admin and all the workspace admins via email. Click here to learn more.

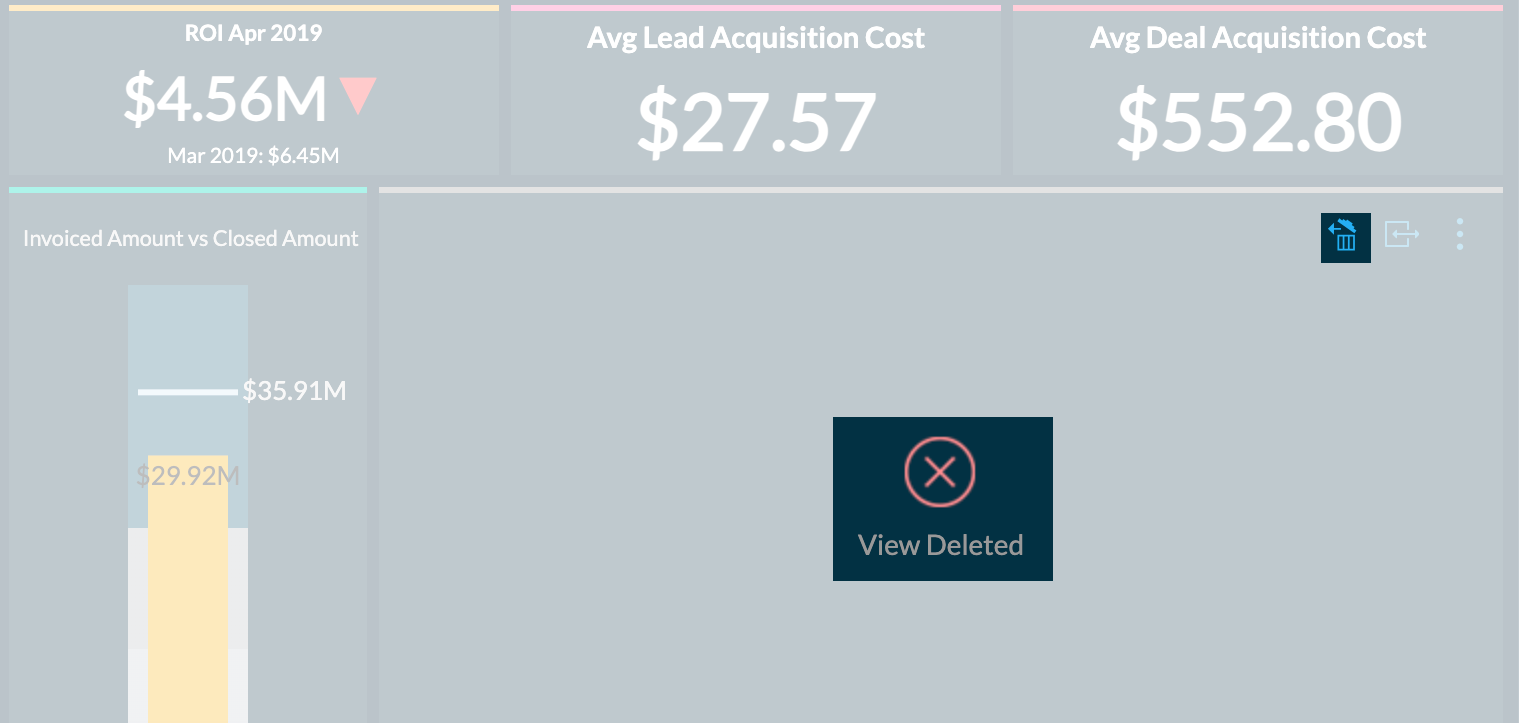
Restore Deleted Views from the Dashboard
EnhancementWe have enhanced the ways to handle deleted views from Dashboard. In case a view present as part of a dashboard is deleted, you can now choose to restore or remove it from the dashboard.
Click here to learn more.
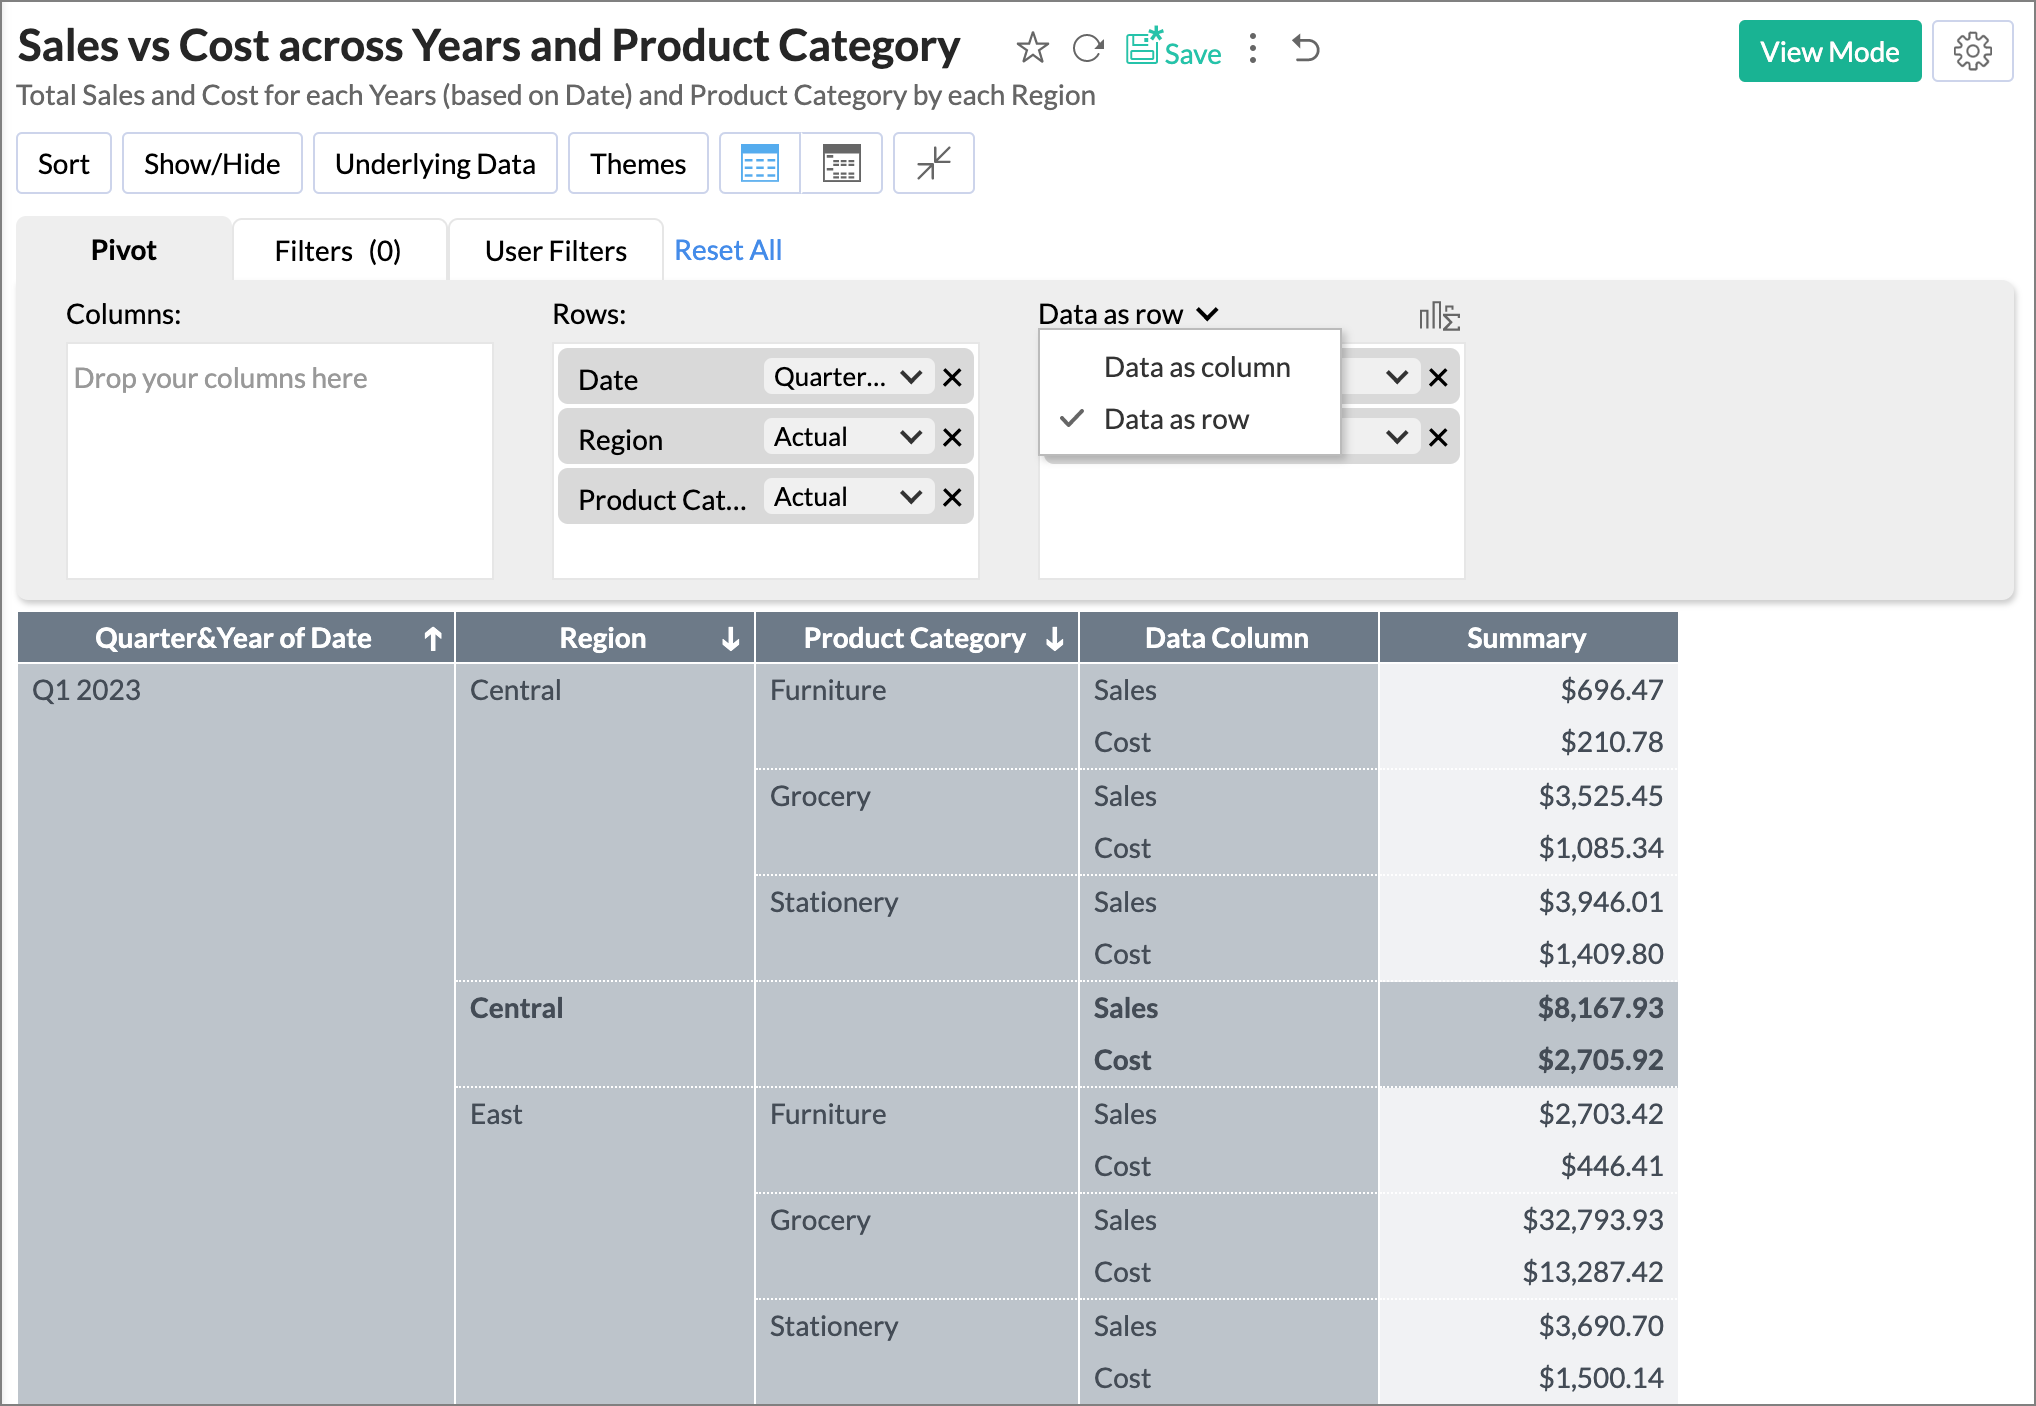
Display Aggregate Data as Row in Pivot View
NewAnalytics Plus now allows you to add aggregate Data either as Rows or as Columns. This opens the possibility to layout the pivot in two different formats, and to get a clear presentation of your data.
Click here to learn more.
Add Ask Zia-generated Reports to Dashboard
EnhancementAs you know, you can have natural language conversations with our AI Assistant Zia and get reports instantly. You can now drag and drop these Ask Zia generated reports into dashboards with ease.
Click here to learn more.
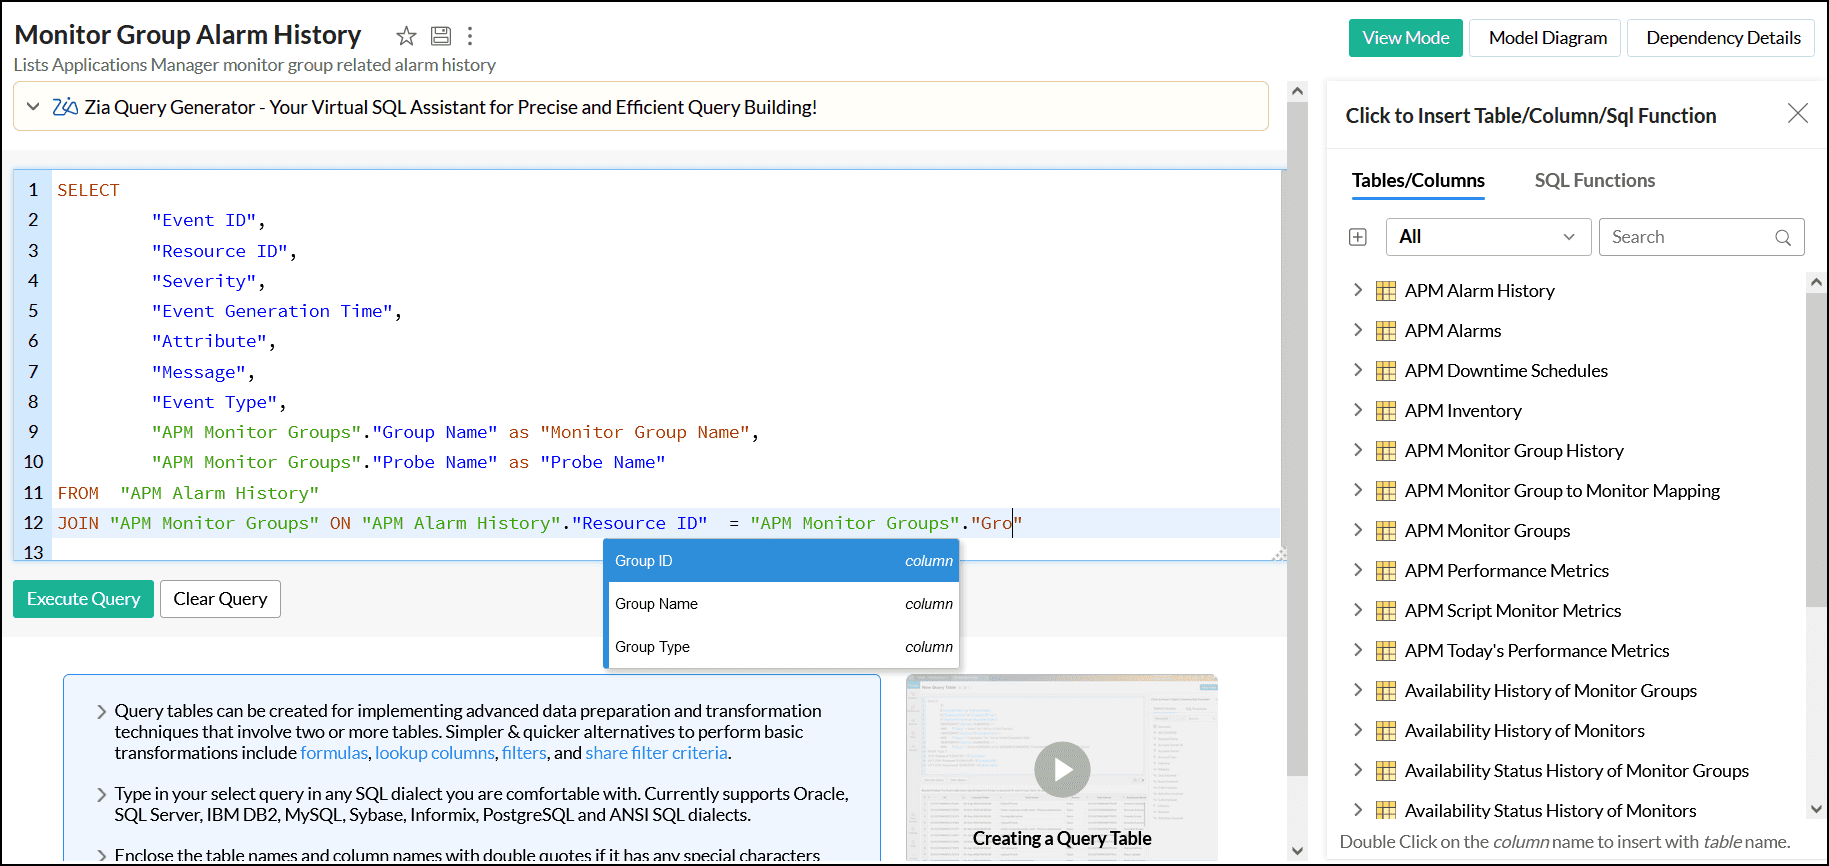
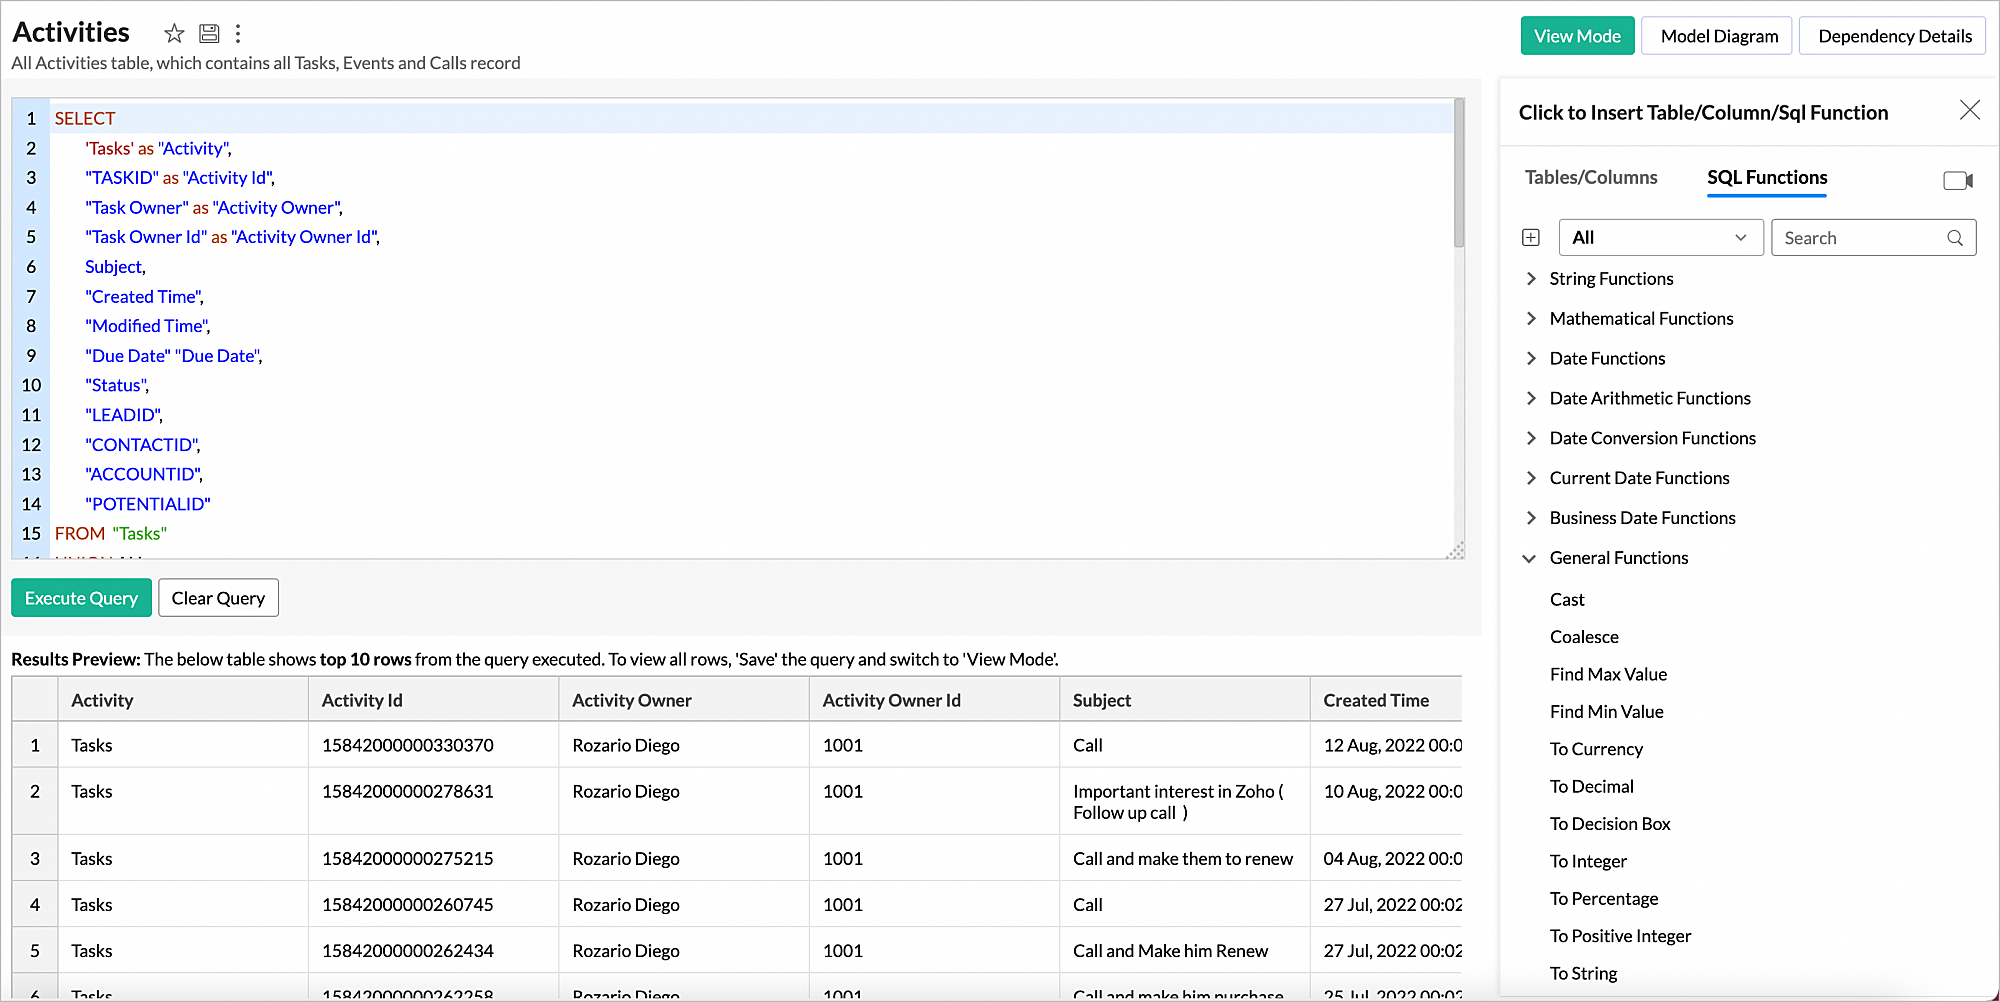
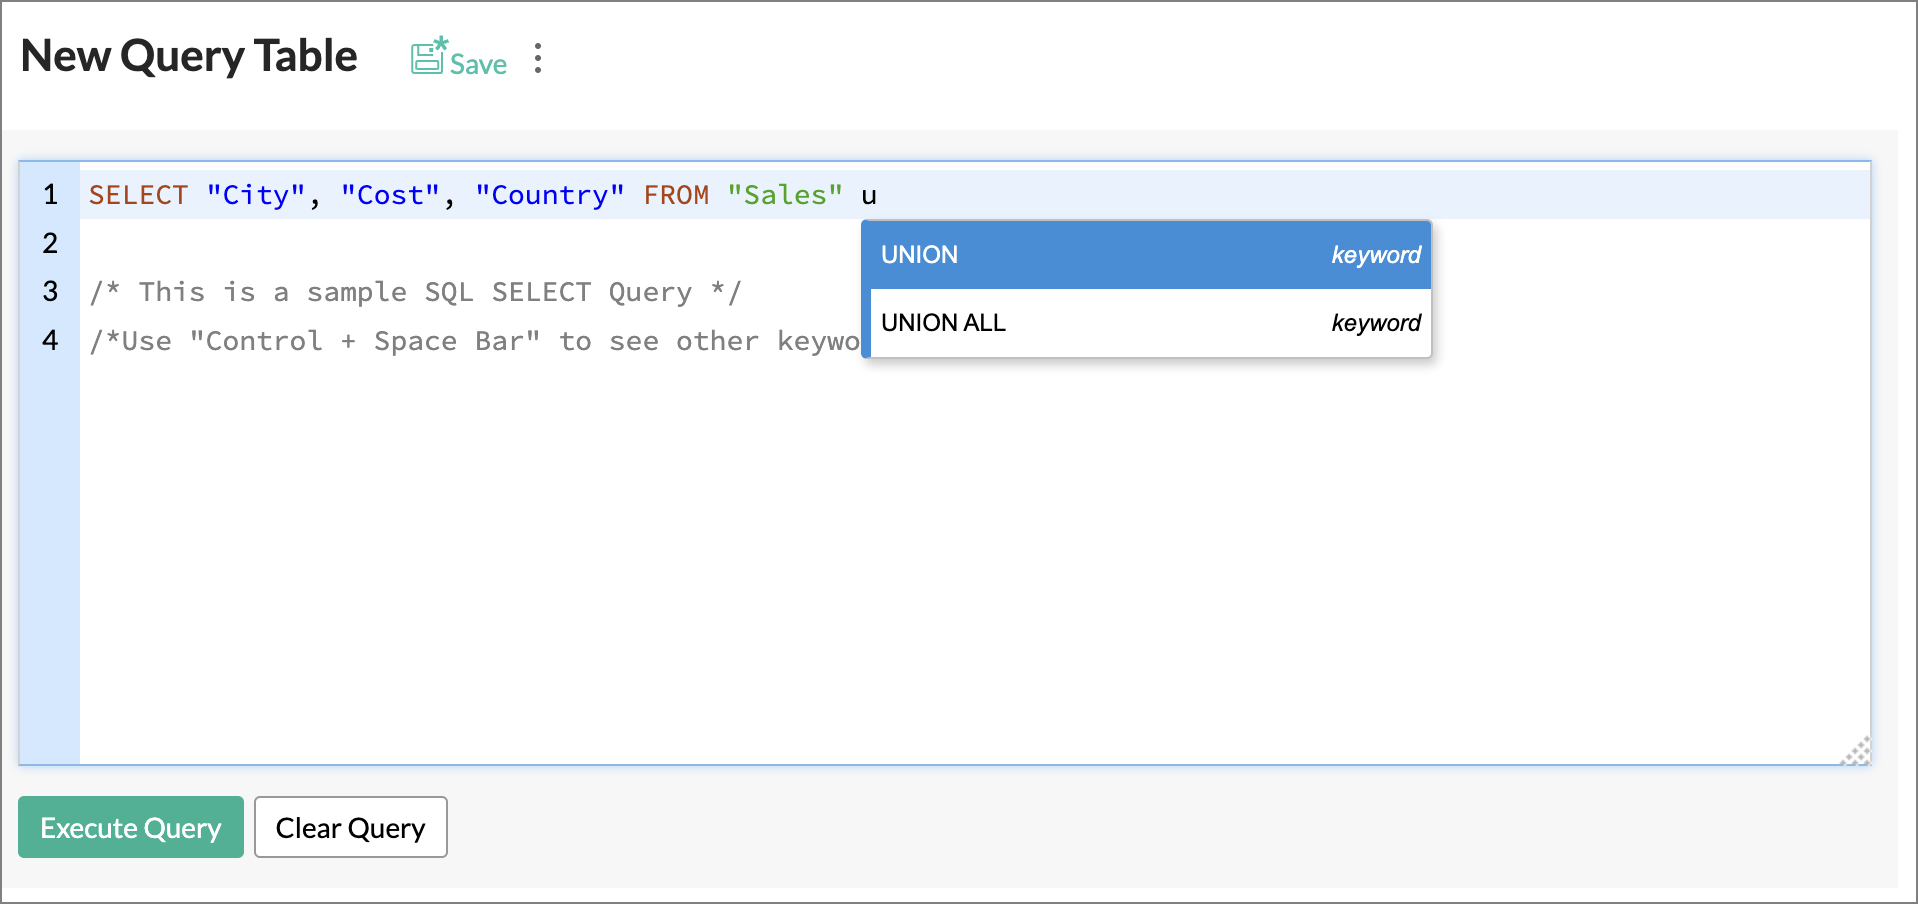
SQL Query Syntax Suggestions
EnhancementCreating query table is now made easier with SQL Query Syntax suggestions. Analytics Plus provides suggestions for keywords, table & column names as you type your query.
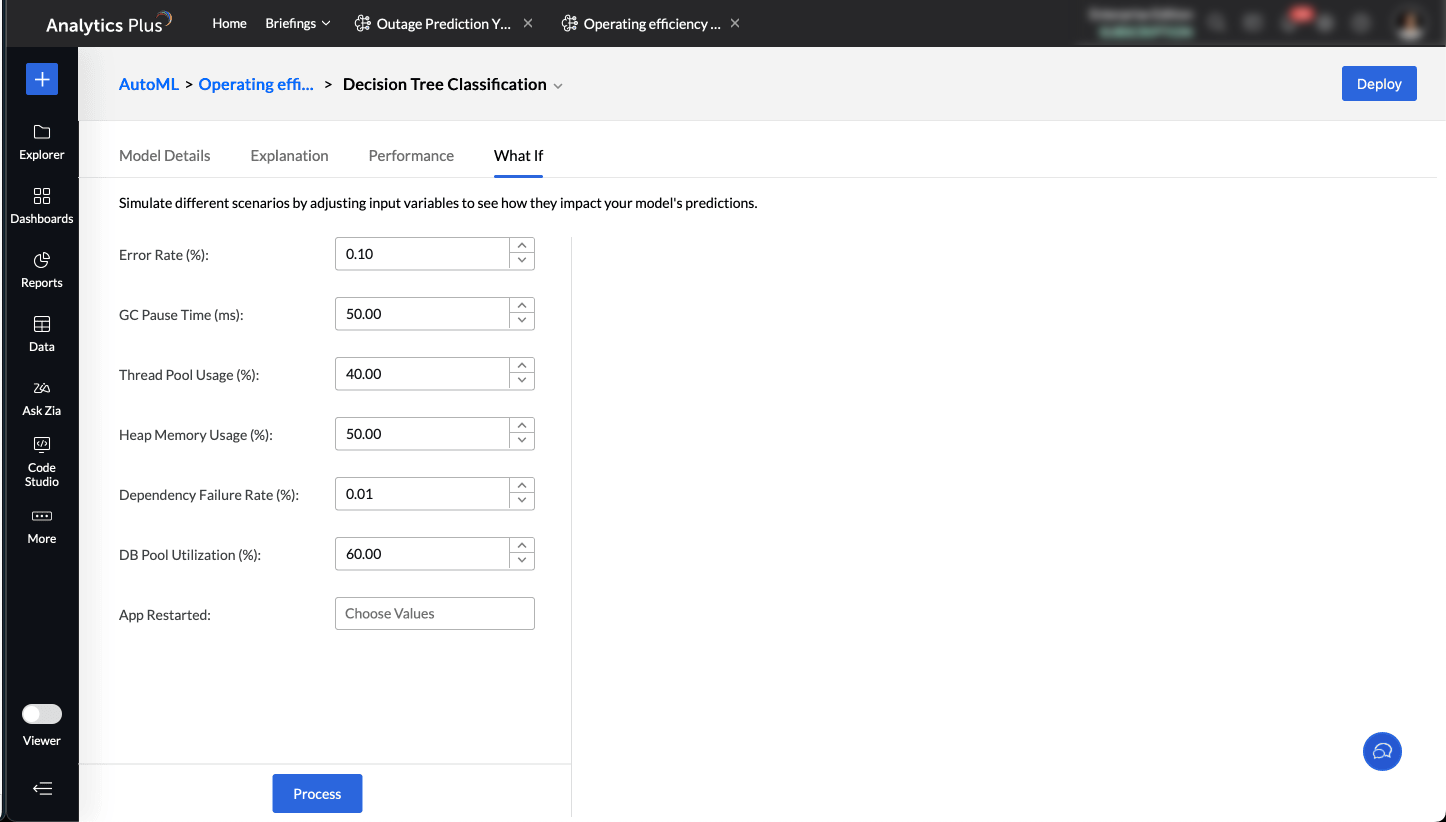
What-If Analysis over Forecast data
EnhancementNow, Analytics Plus allows you to apply What-If Analysis specifically to forecasted data alone, rather than applying it to the entire report as before. This update provides more focused and targeted capabilities for conducting What-If Analysis in Analytics Plus. Click here to learn more.
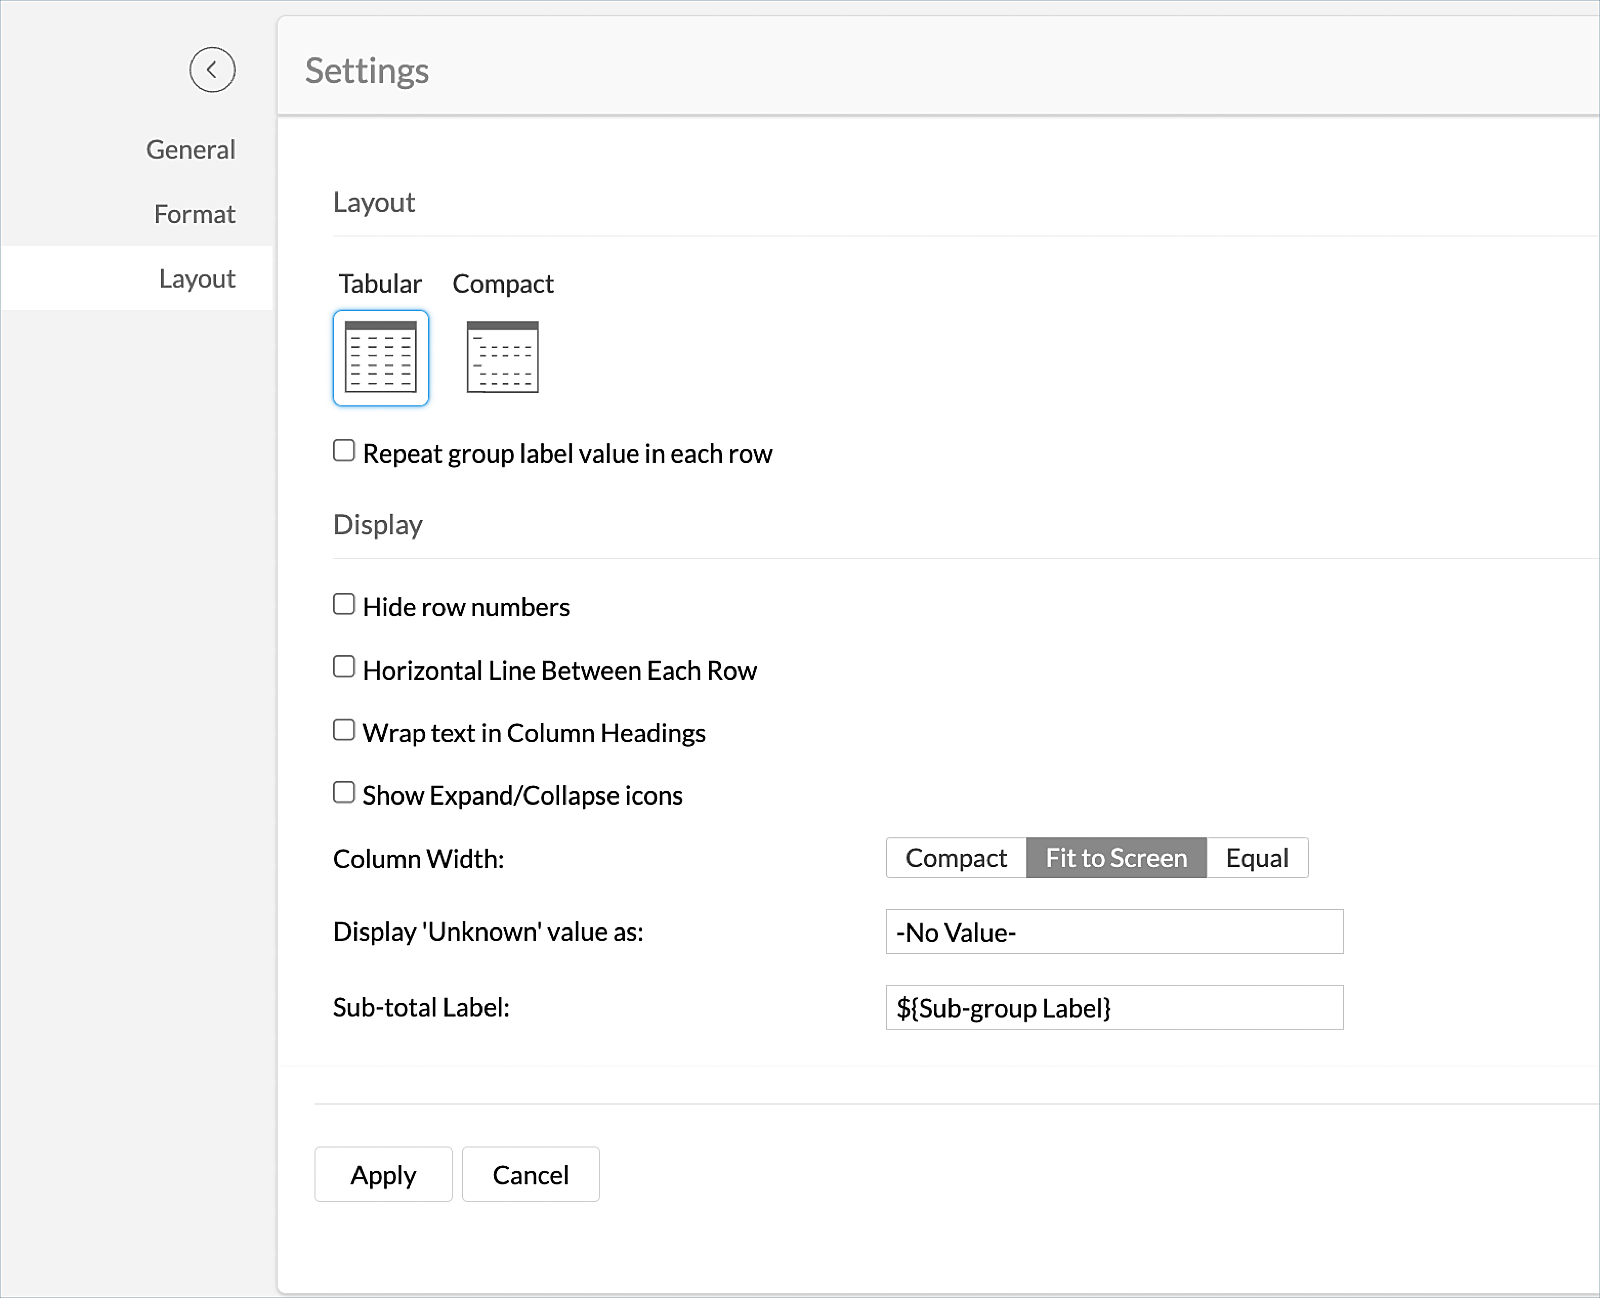
Pivot View
New- A new option Fit to screen is added to Pivot view and Summary view. This option adjusts the column width to fit the table across the entire screen. Click here to learn more.
- A new option is added to customize the Sub-total Label. You can add a prefix or suffix to the Sub-total Label or you can modify the label as needed. Click here to learn more.
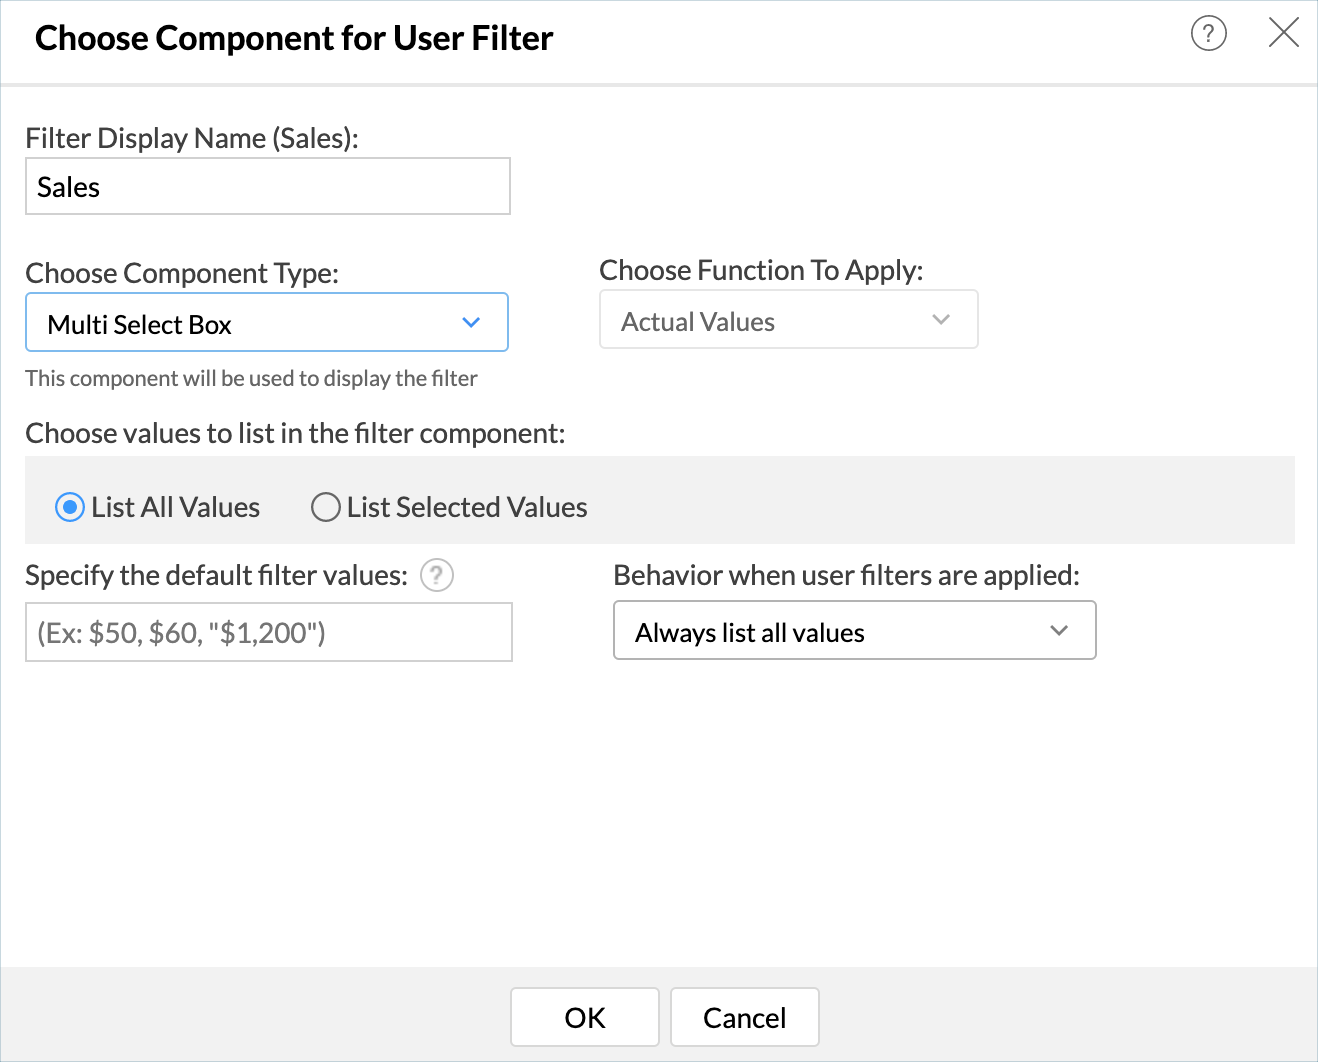
Numeric User Filter
EnhancementUser filter for numeric columns now provides List All Values option. In this enhancement, any new value added will be automatically added to the filter value.
Click here to learn more.
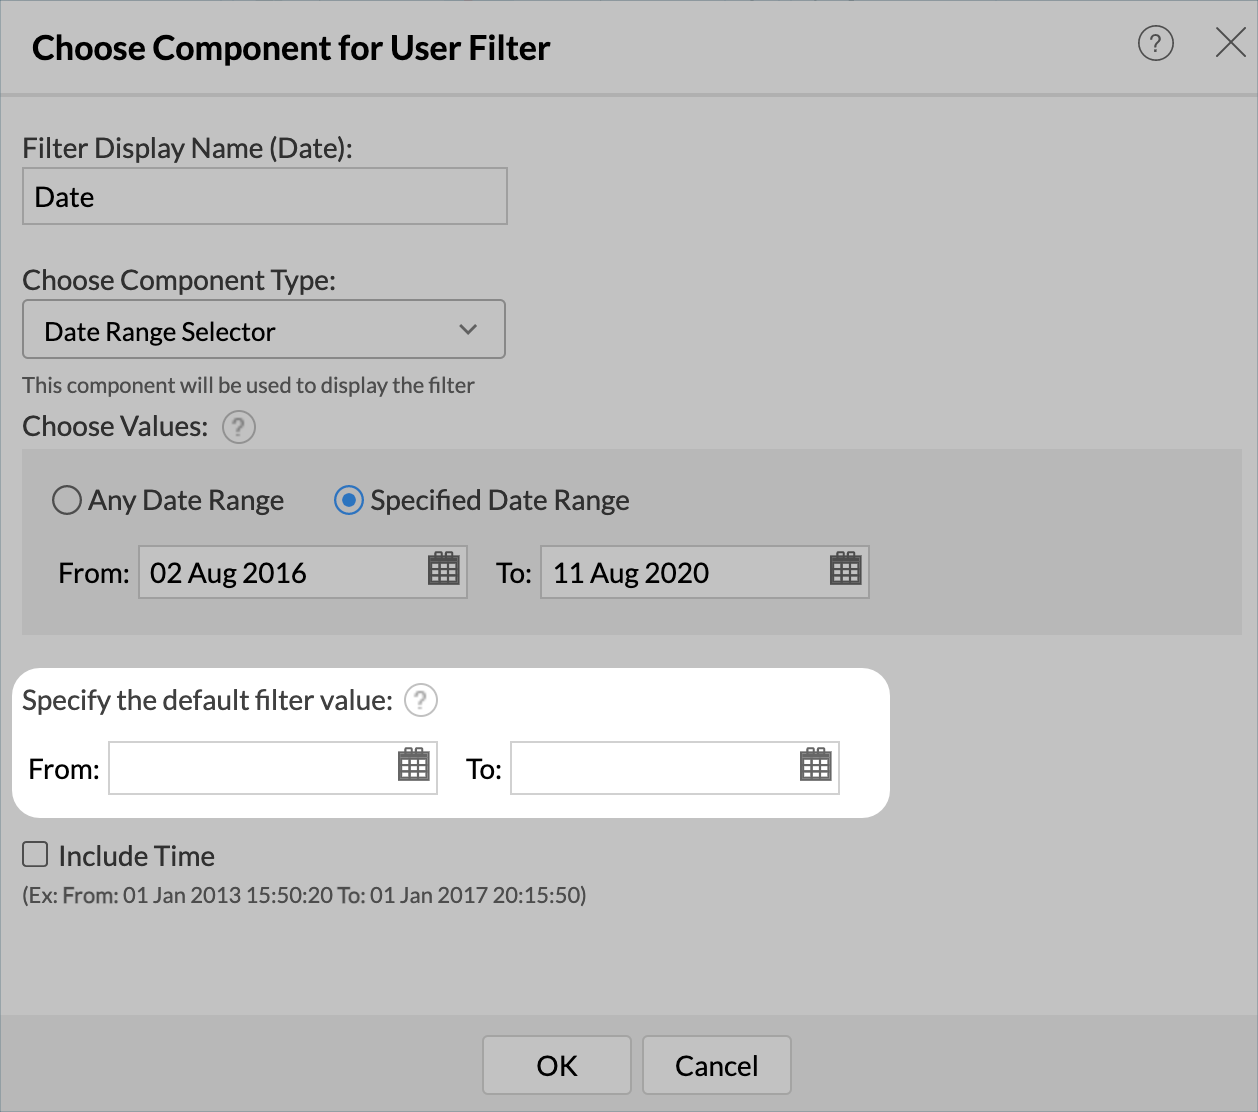
Date User Filter
EnhancementUser filter for actual date period now allows you to set a default filter value that should be applied to the reports. Previously, this option was available for seasonal and relative periods. Click here to learn more.
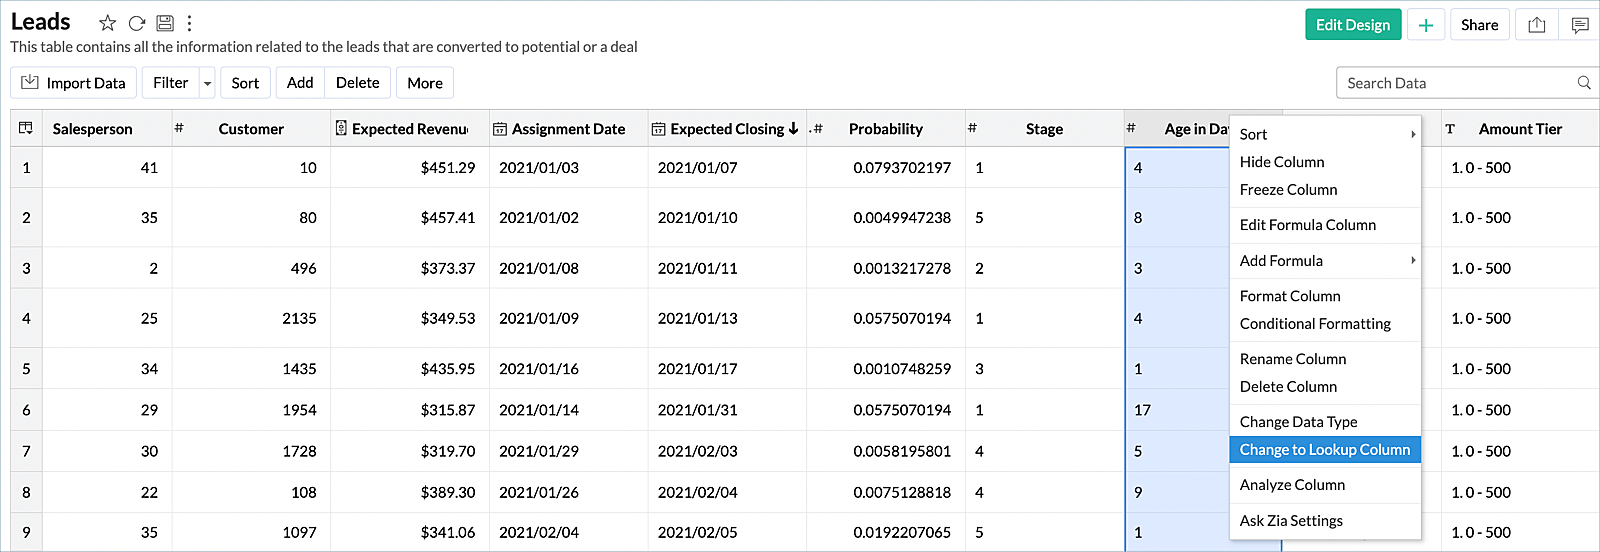
Formula based Lookup Column
EnhancementYou can now configure a formula column to be a lookup column. Click here to learn more.
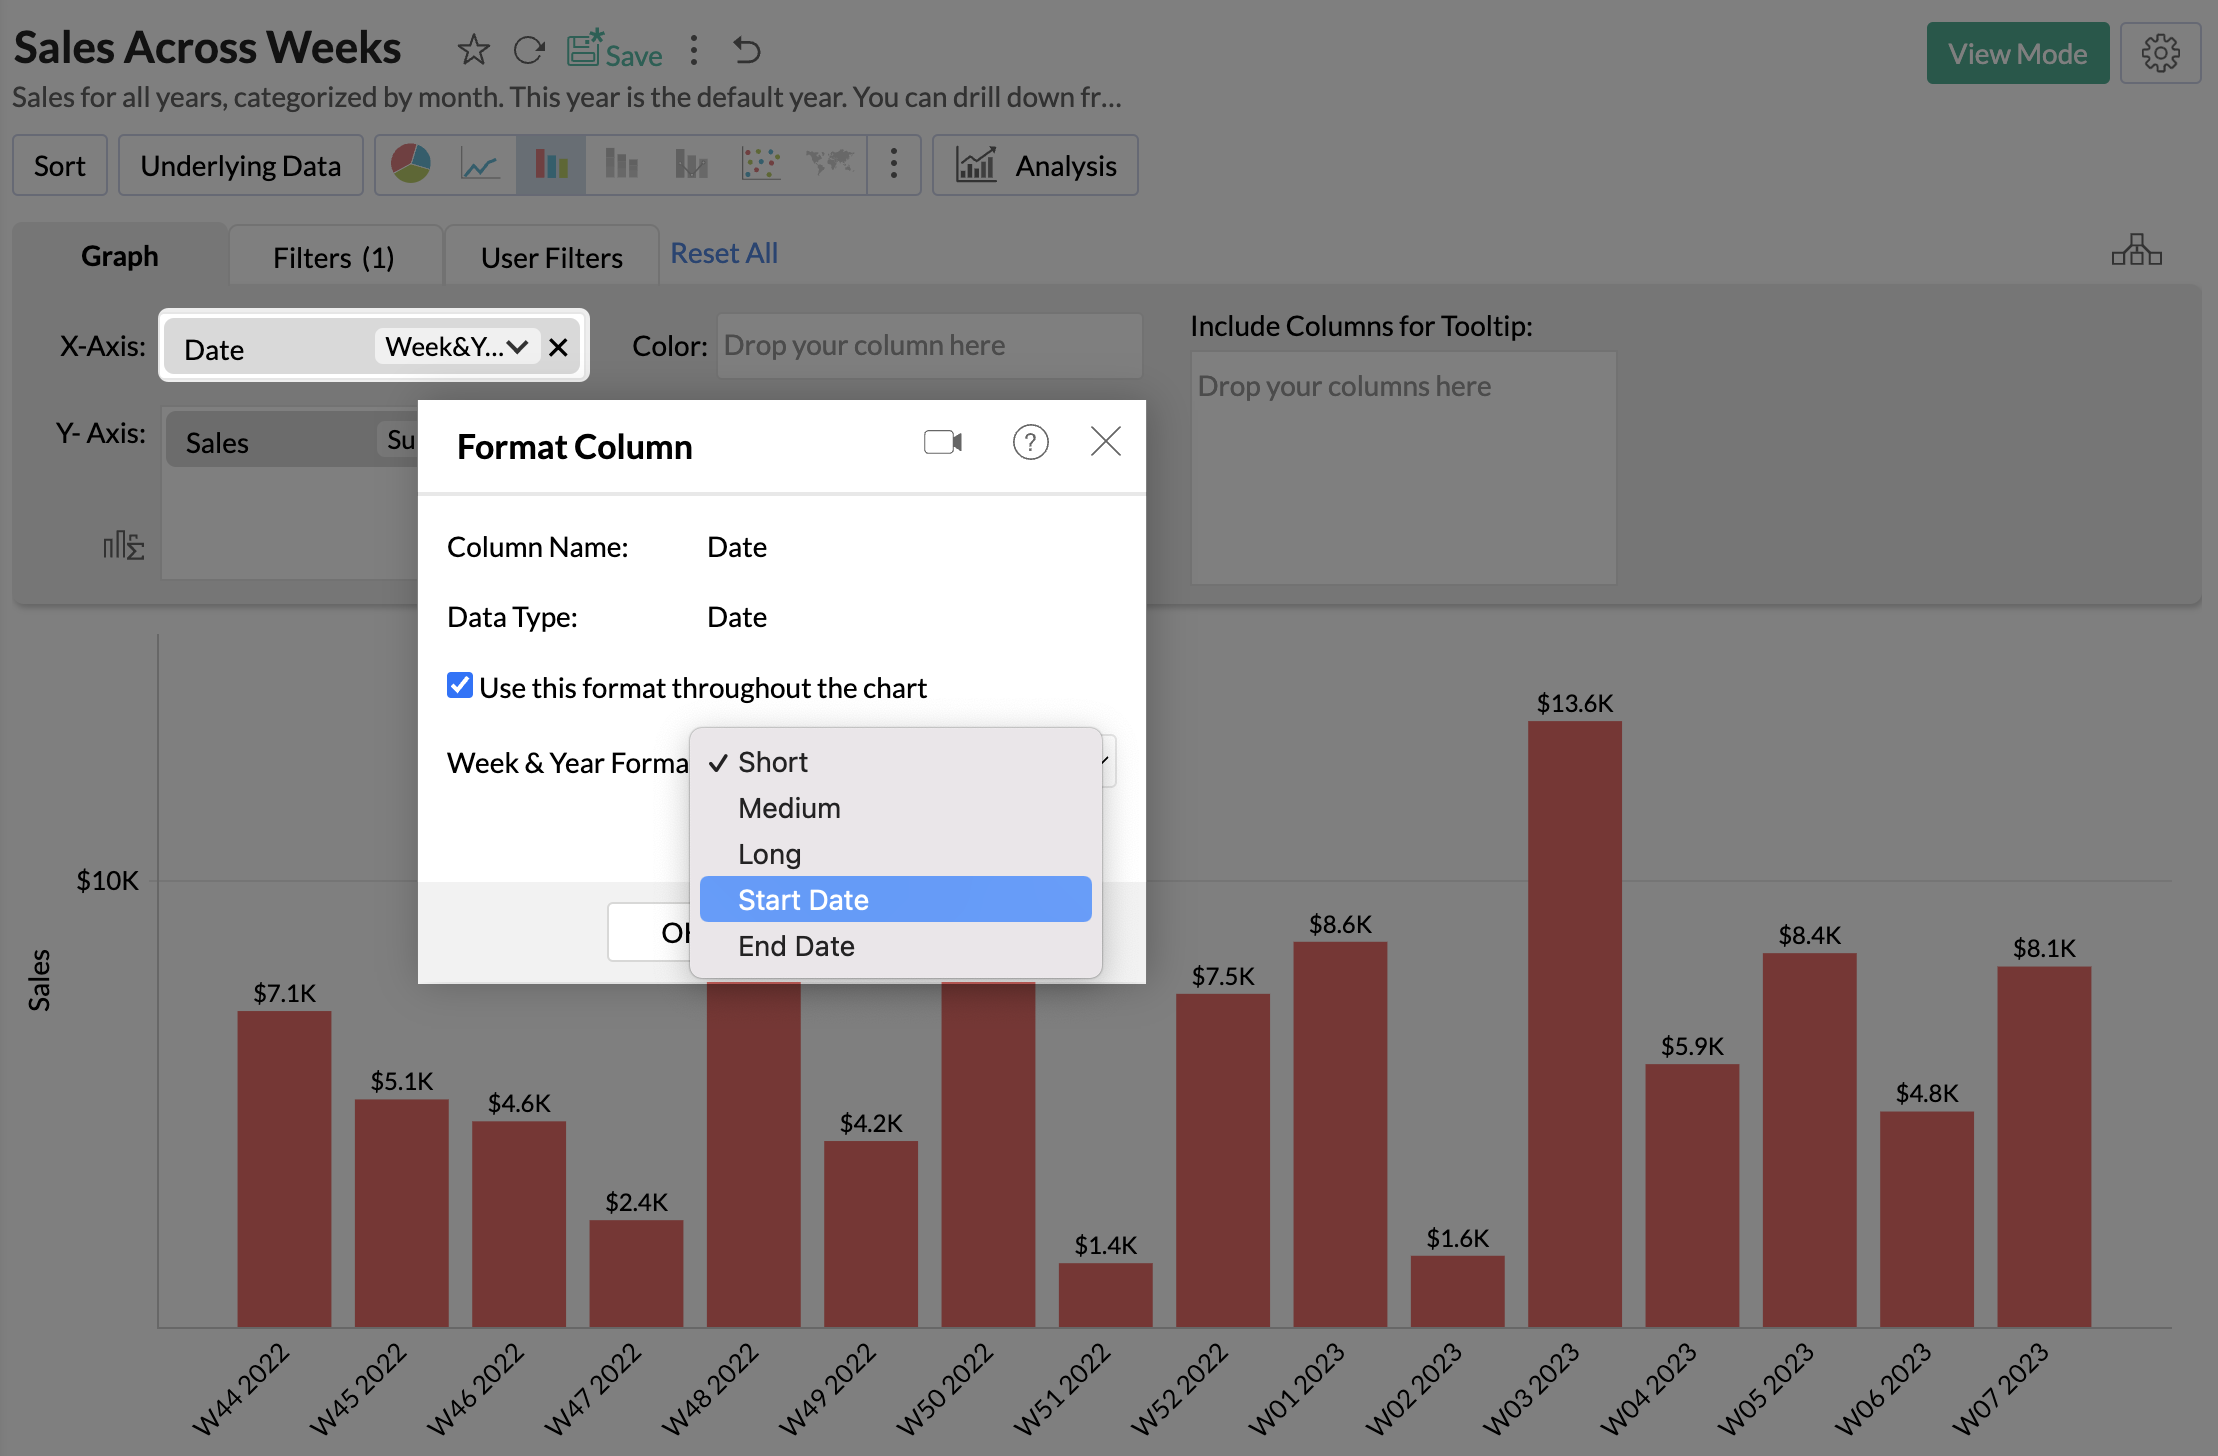
Date - Week & Year Format
EnhancementIn addition to Short, Medium and Long formats for displaying weekly data in charts, Analytics Plus supports Start Date and End Date. Choosing this option will display the Start or End Date of the week in weekly reports.
Click here to learn more.

Formulas supported in Live Connect
EnhancementYou can now create both Aggregate Formulas and Custom formulas in workspaces where you have setup Live Connect to cloud databases.
Enhancement in Dependency Views
EnhancementDependency Details option for the views has been enhanced with the following items.
- Views now include the Dashboards where the view is embedded.
- Table includes immediate child table.
- Query Table now includes multiple level parent tables and child tables.
- Dependency details can be invoked from Explorer and Model Diagram.
Click here to learn more.
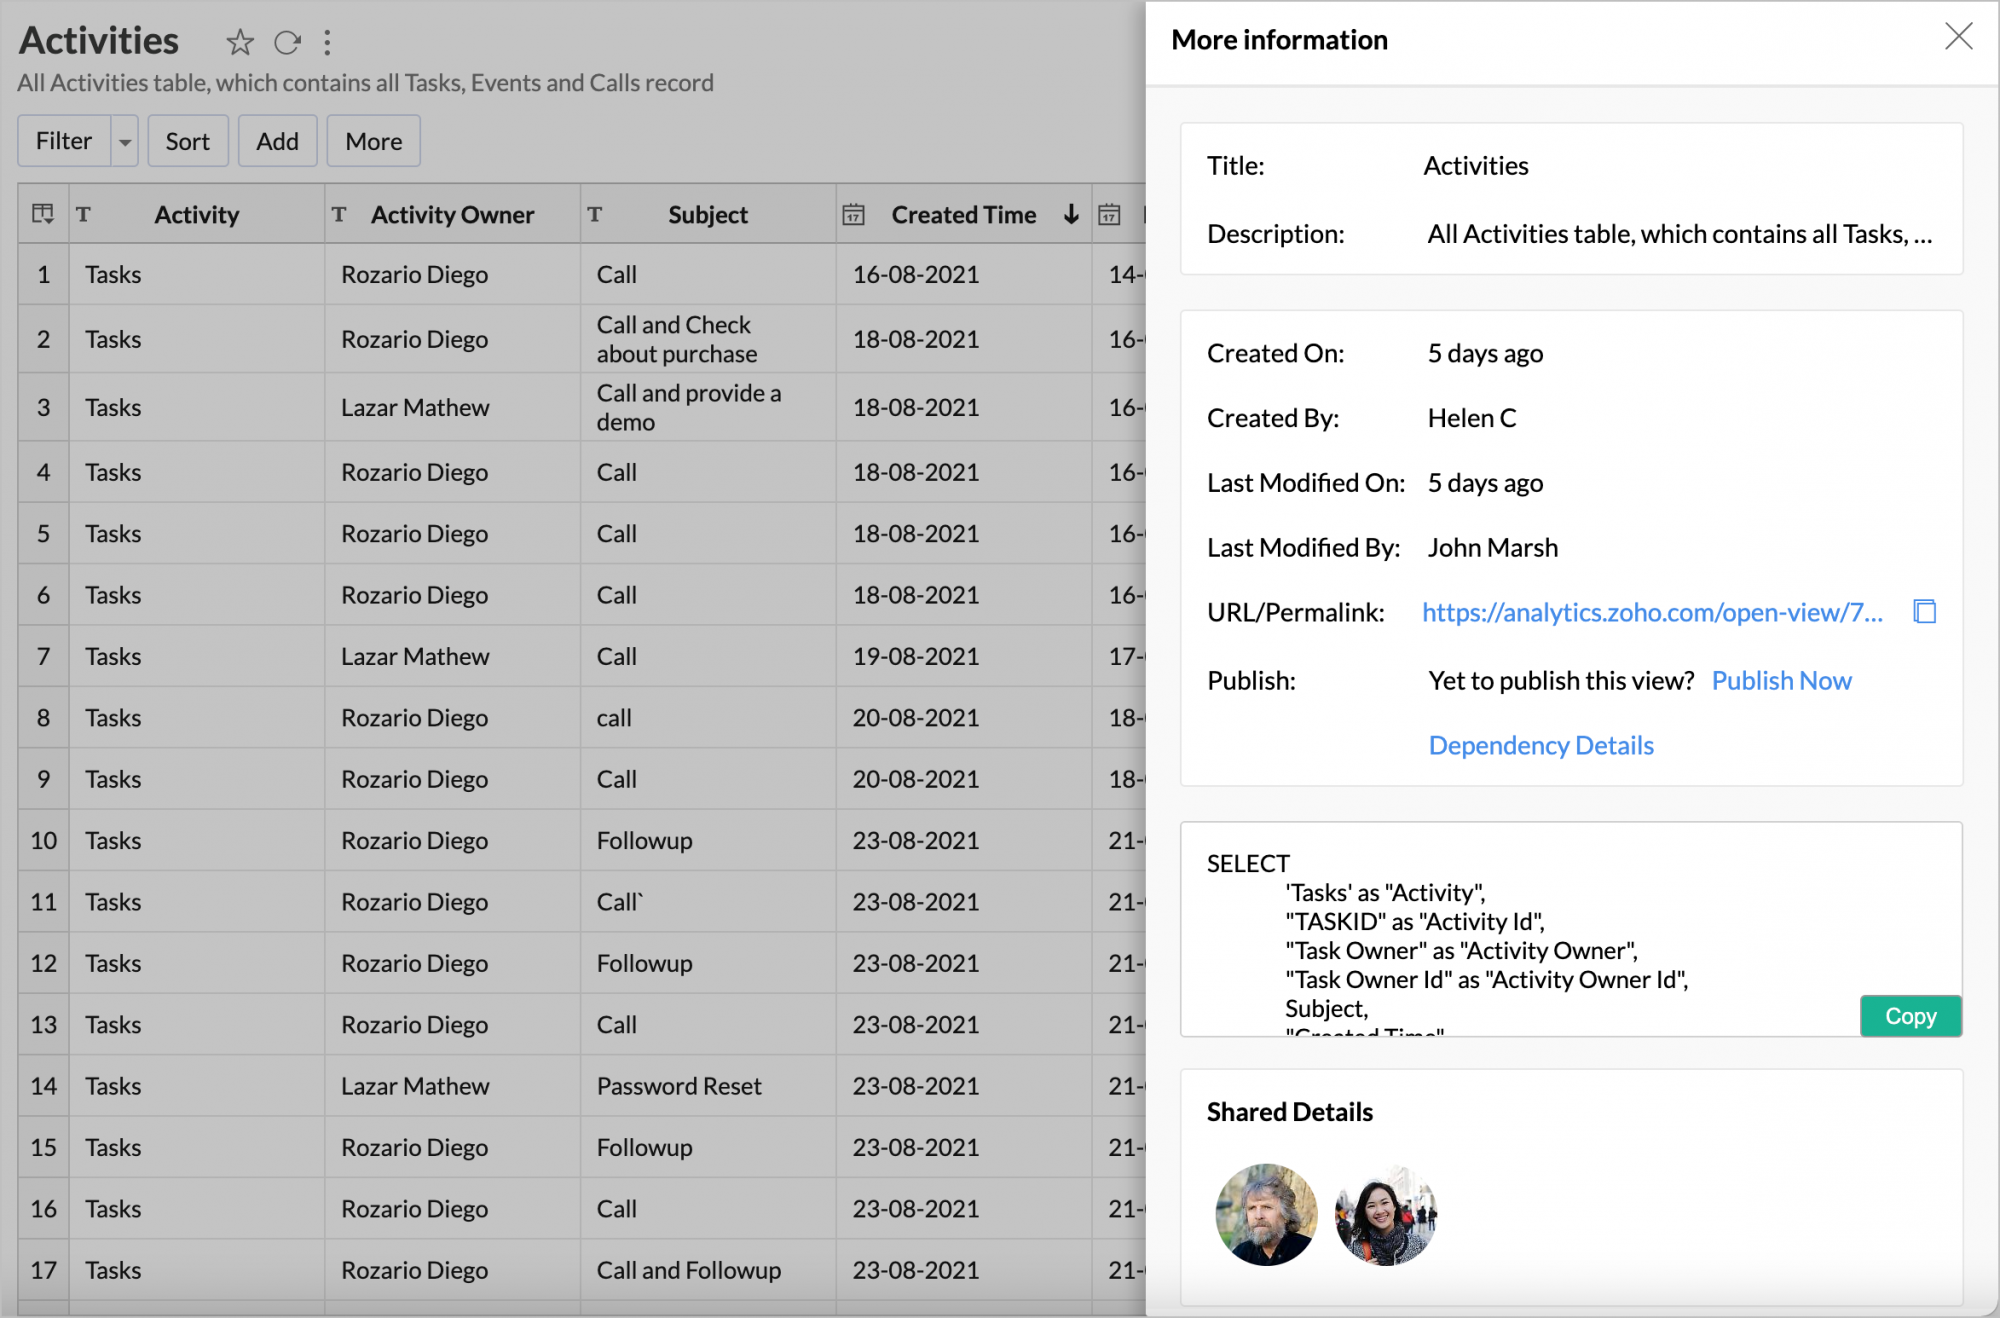
All New Information Window
EnhancementA new information window has been added to all the Views in Analytics Plus. Now from a single window, you can edit various options of the view, such as title, description, data source, publish and share details, and see dependency details, permalink, etc. Click here to learn more.

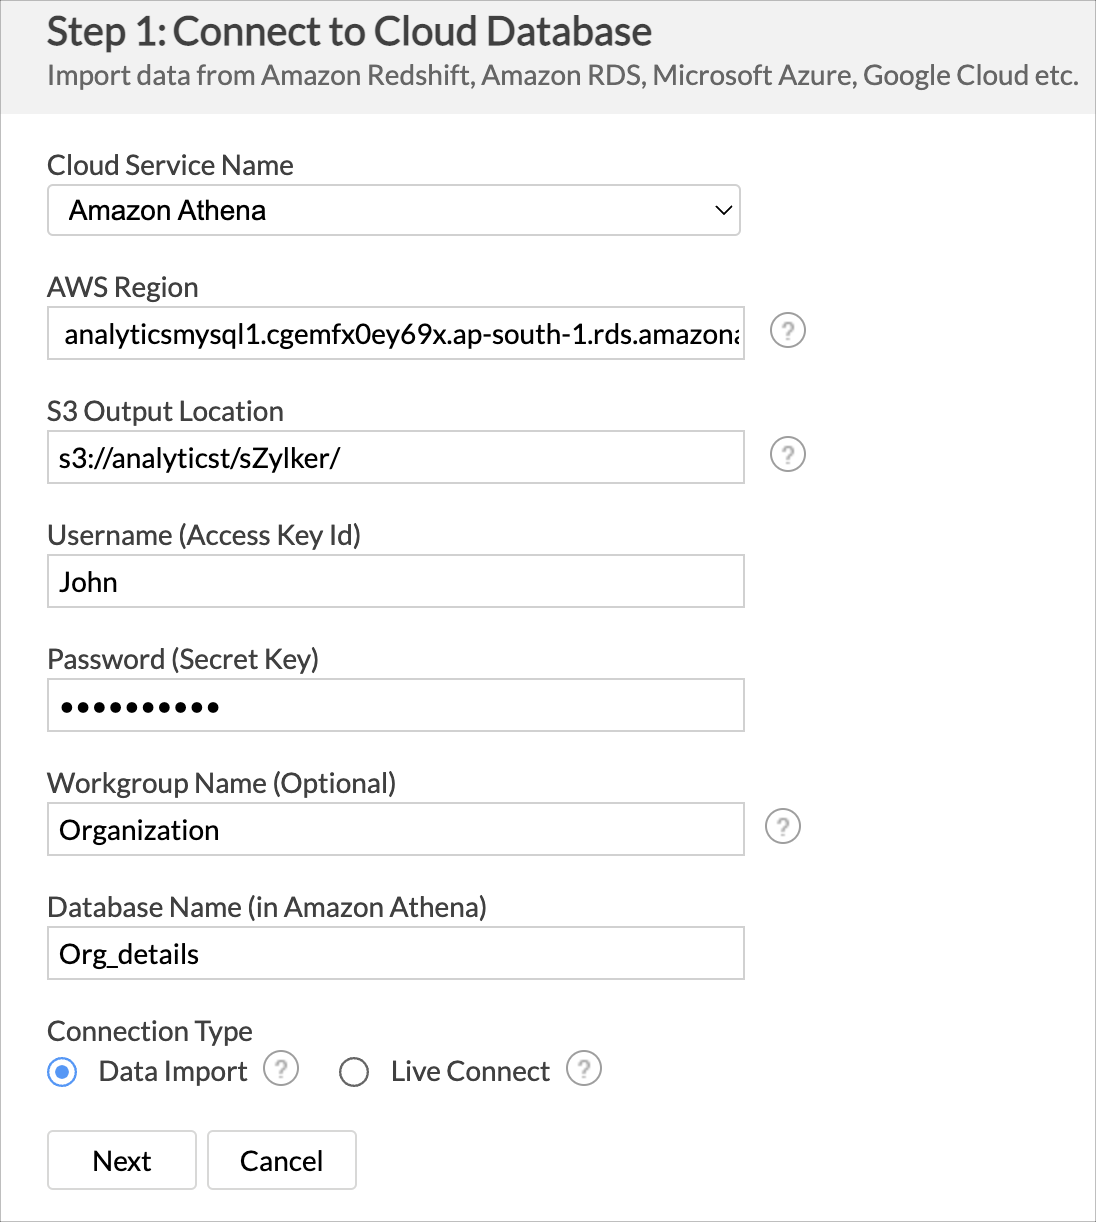
Expanding Databases Connectivity
NewAnalytics Plus now supports importing data from the following databases:
Local Databases Cloud DatabaseIssues fixed
Issues fixed- The support for TLSv1.0 and TLSv1.1 have been officially deprecated in this release. The TLS (Transport Layer Security) versions 1.0 and 1.1 are no longer considered secure due to known vulnerabilities and weaknesses.
- The critical security vulnerability related to privilege escalation has been addressed in this release. This vulnerability could potentially allow users (managers or viewers) to perform actions typically reserved for administrators, posing a significant security risk.
July
Build Number: 5260 (Release on: July 27, 2023)
Launching advanced analytics for Google Analytics 4 (GA4)
NewAnalytics Plus seamlessly integrates with Google Analytics 4 (GA4) to help you examine important web traffic KPIs, and make decisions backed by solid data to improve your SEO/SEM campaigns. Click here to learn more about this integration.
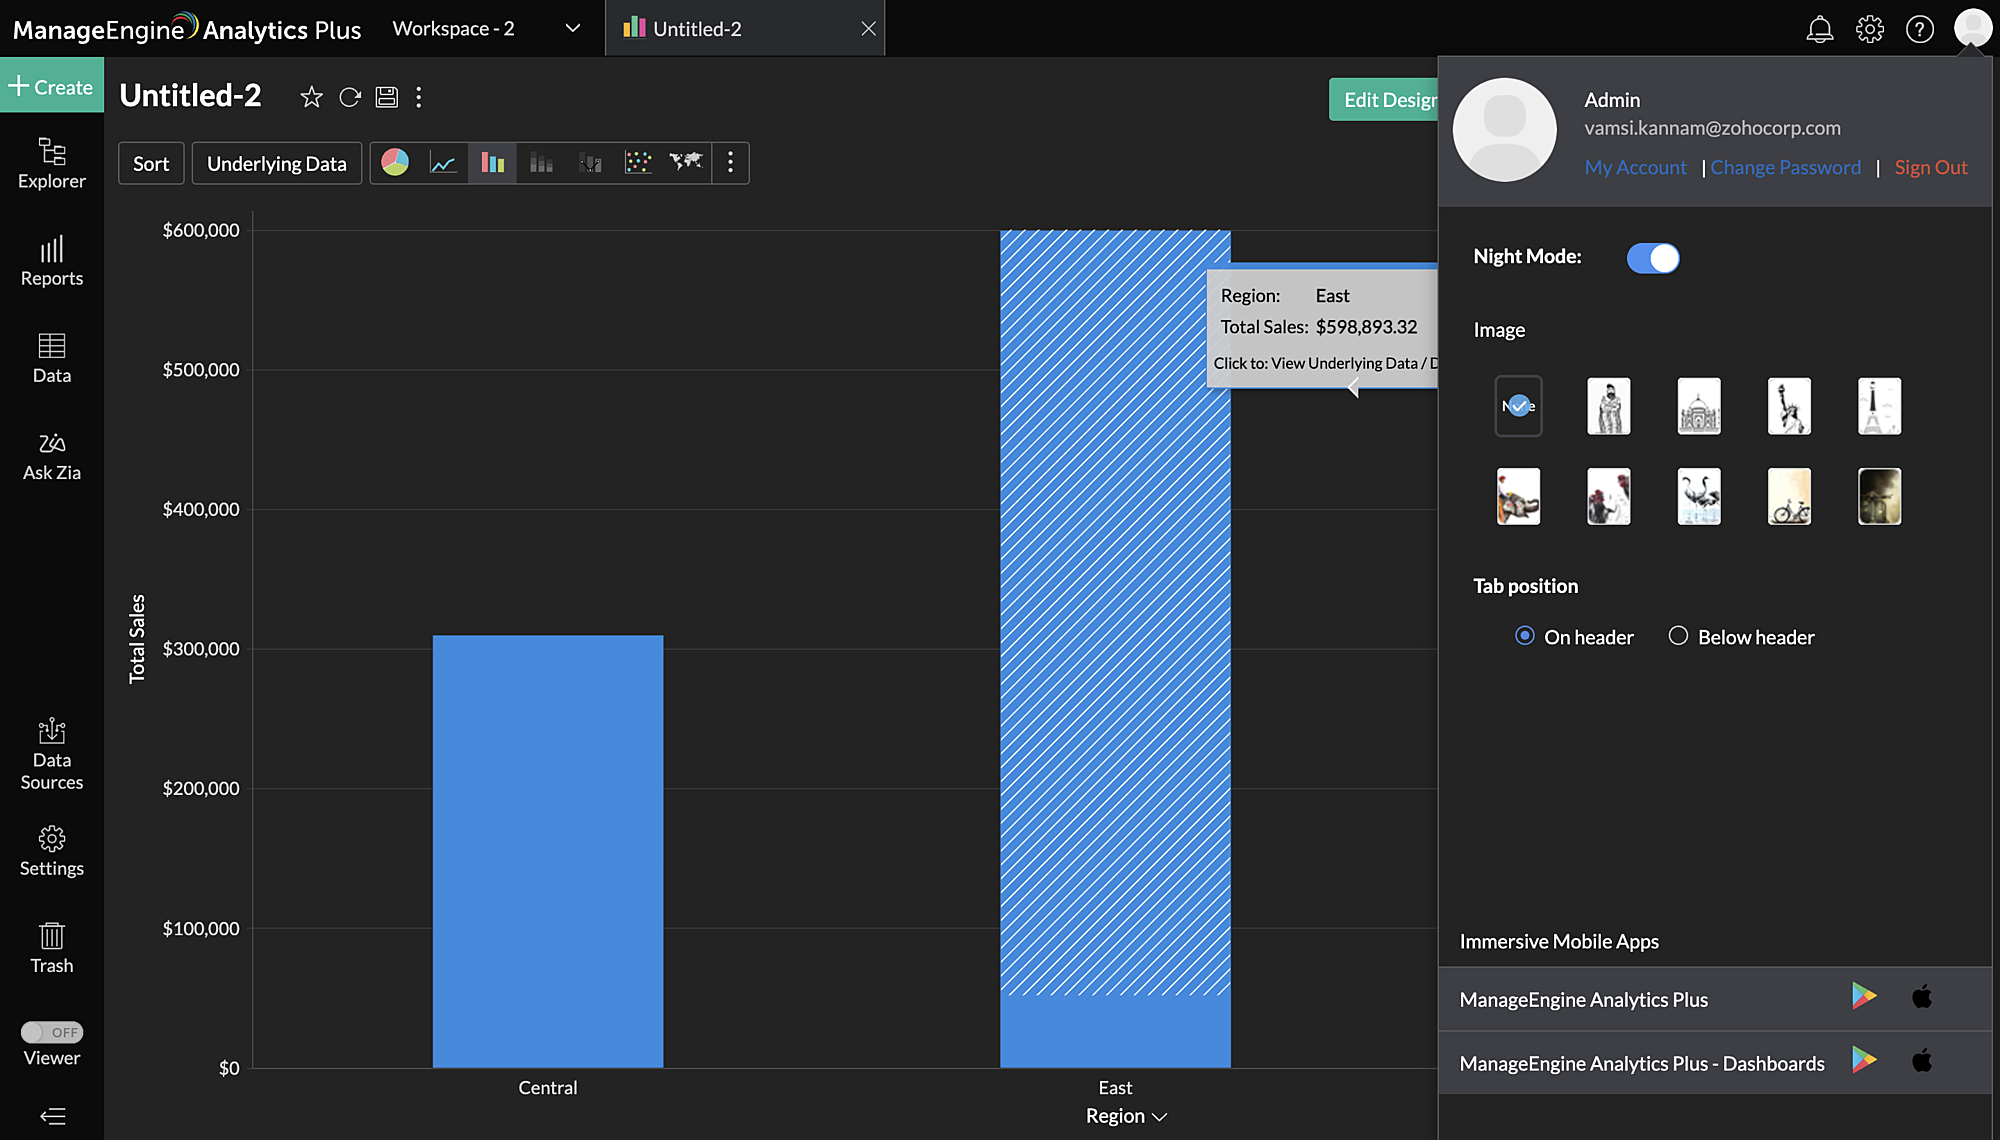
Night Mode Support
NewAnalytics Plus UX now supports a trendy night mode theme. You can now toggle the Analytics Plus interface between Day and Night UX modes.
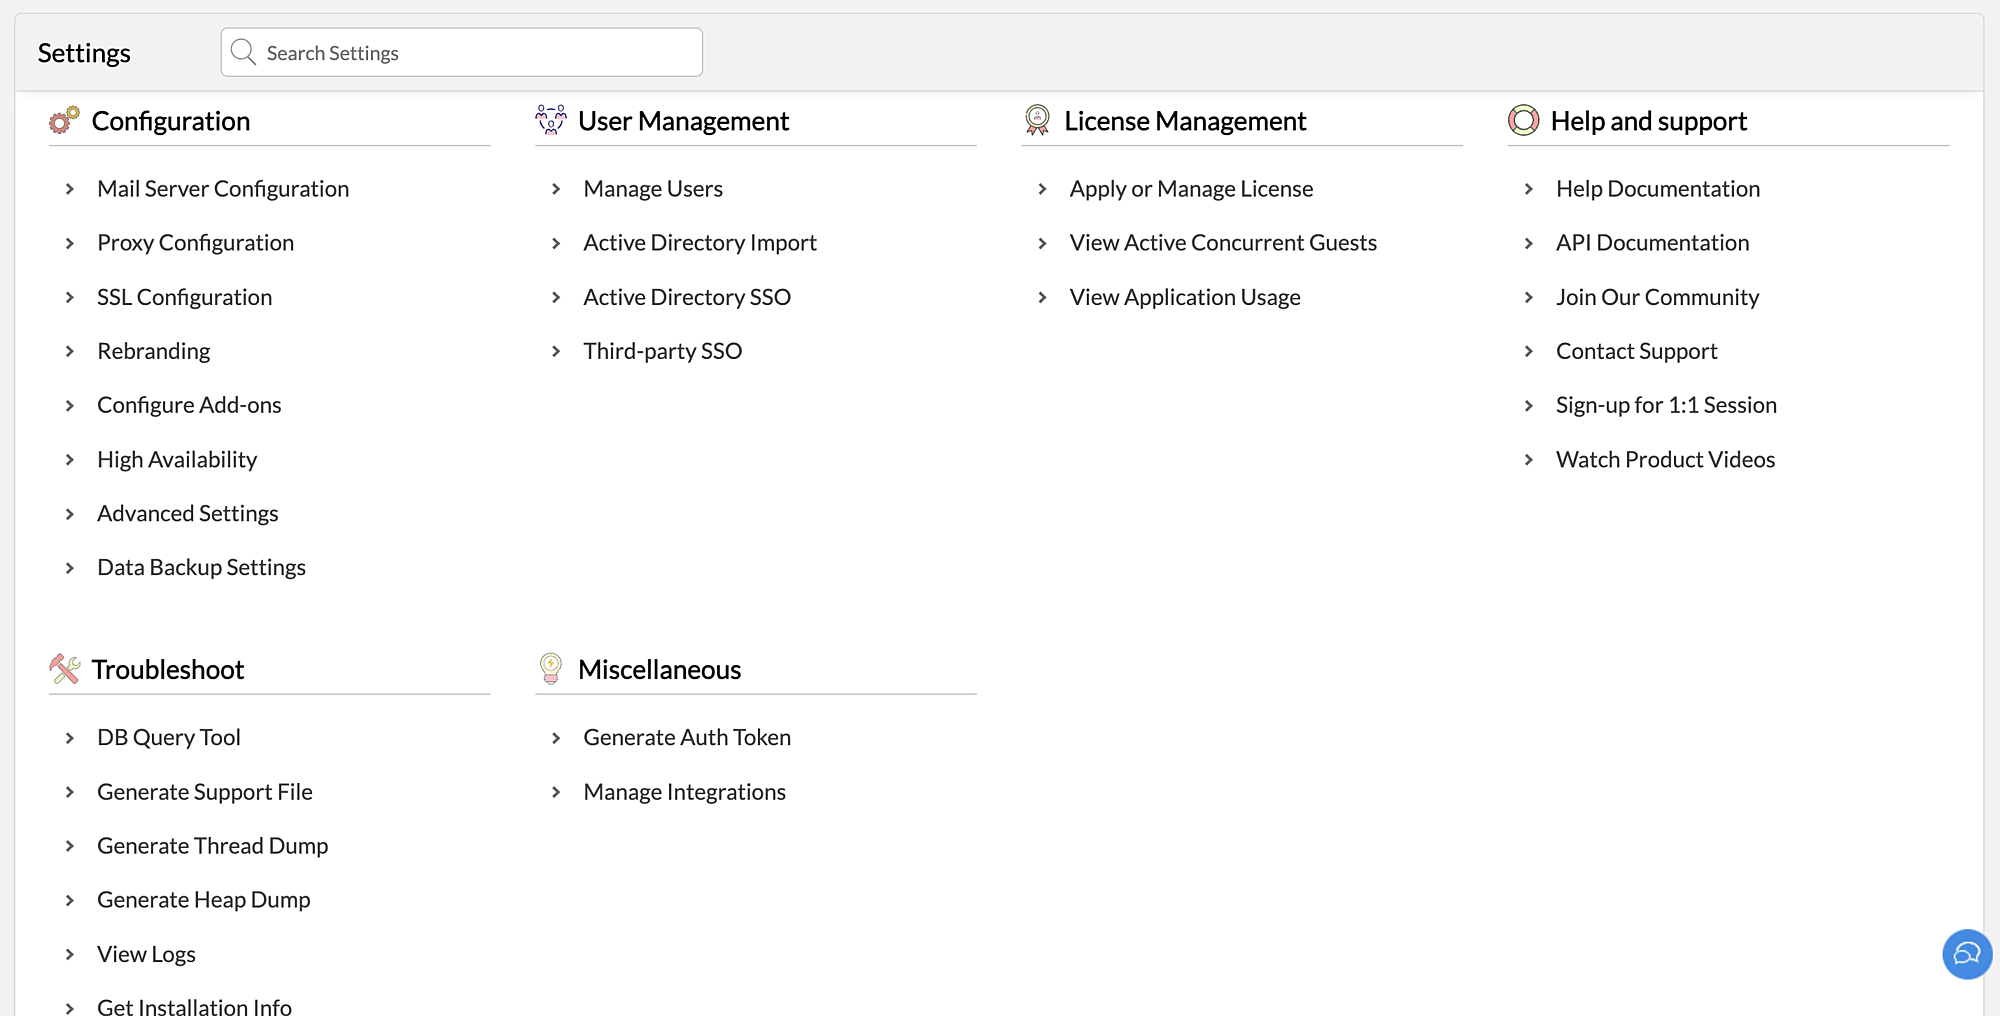
Settings page revamped
Enhancement- We've revamped the user interface of the Settings page. We've also categorised the settings and included new sections like help and support, troubleshoot and miscellaneous to improve the user experience. Click here to learn more.
June
Build Number: 5250 (Release on: June 28, 2023)
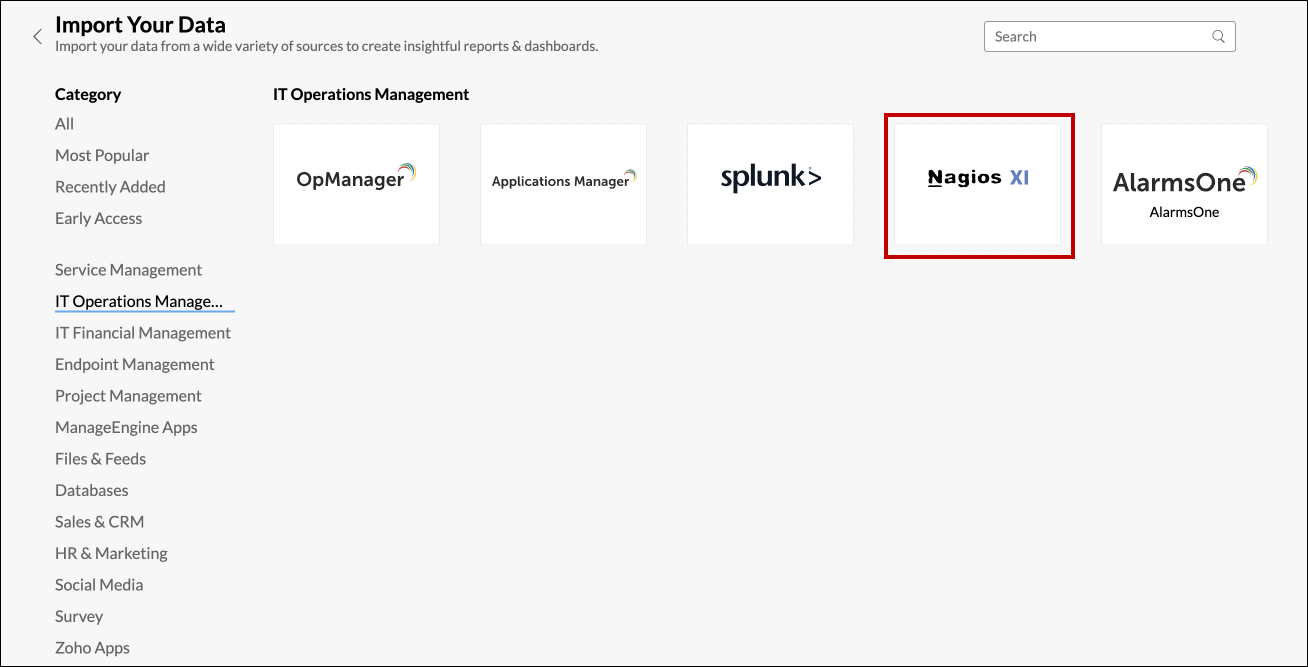
Launching advanced analytics for Nagios XI
NewAnalytics Plus seamlessly integrates with Nagios XI empowering organizations to make data-driven decisions and ensure the optimal performance of their IT infrastructure. Click here to learn more about this integration.
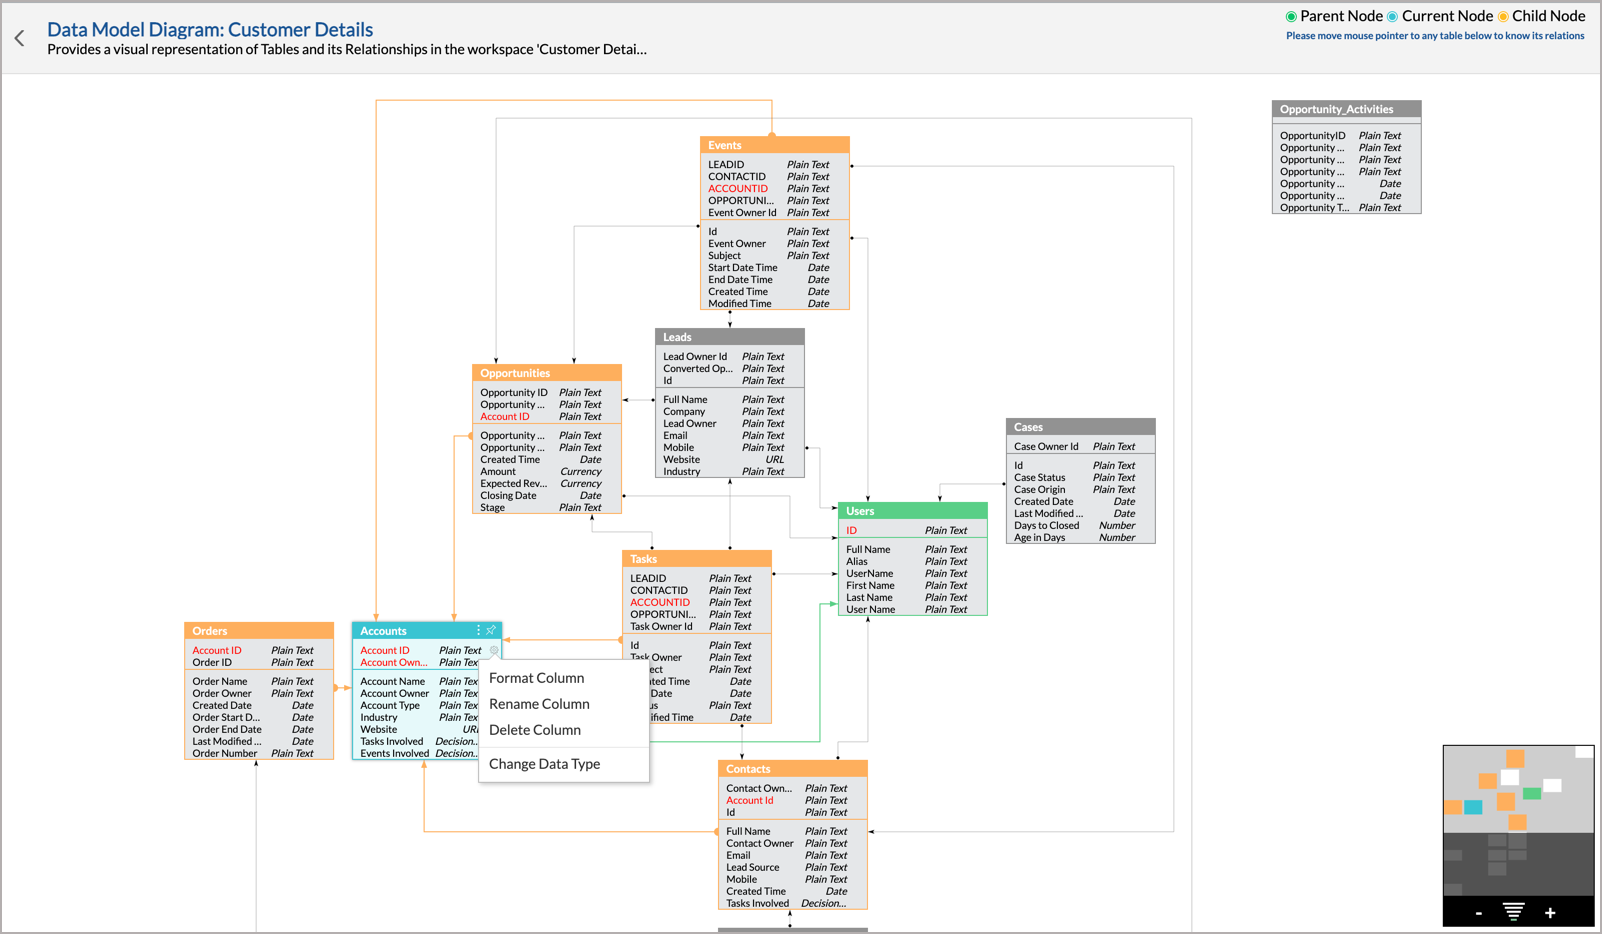
Introducing Data-Model Diagram
NewThis feature helps you visualize and understand relationships between tables in your data sources. You can view all the tables in your workspace and their relationships from the Model Diagram. Click here to learn more.
Introducing new language support
EnhancementManageEngine Analytics Plus user interface is now available in Romanian language in addition to the other languages.
Issues fixed
Issues fixed- The recently disclosed Remote Code Execution vulnerability in hsqldb jar (CVE-2022-41853) has been addressed in this release.
- The blank screen issue while using drill down function on Google Chrome v.114.0.5735.106 was fixed.
June
Build Number: 5240 (Release on: June 01, 2023)
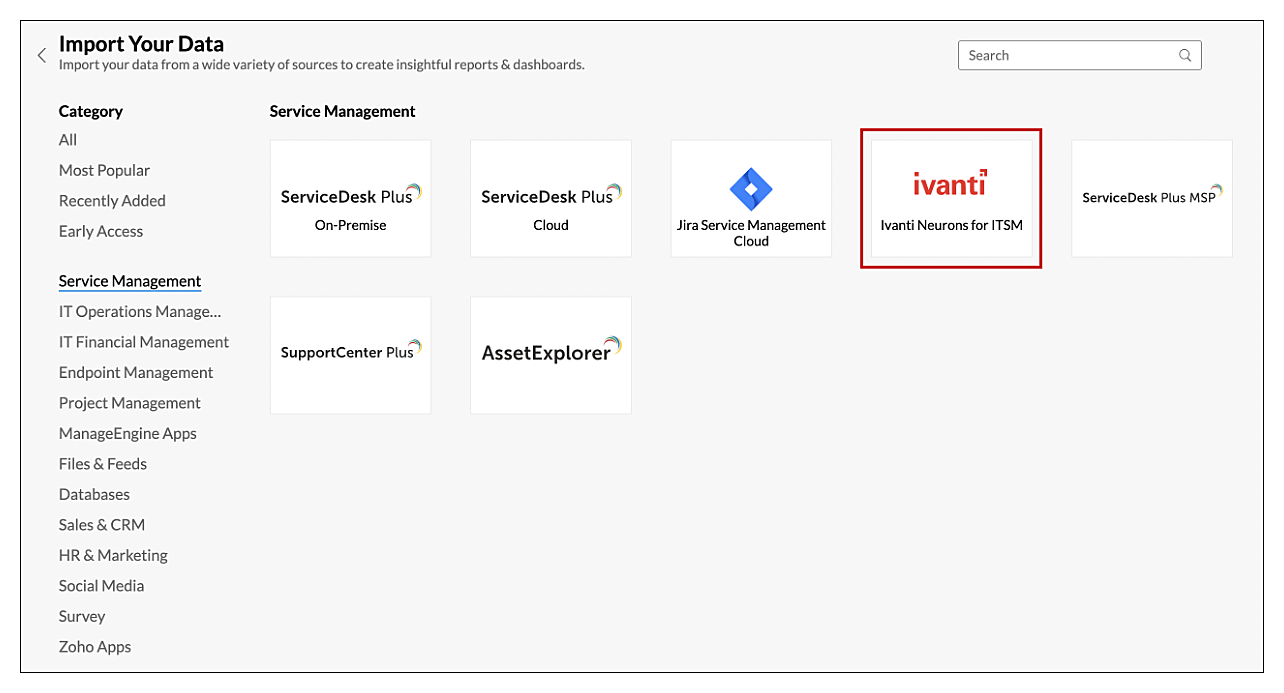
Introducing out-of-box integration with Ivanti Neurons for ITSM
NewAnalytics Plus seamlessly integrates with Ivanti Neurons for ITSM and offers data-driven insights for proactive service management and continuous improvement of IT operations. Click here to learn more about this integration.
Issues fixed
Issues fixed- The Vulnerabilities in Statistical data import (CVE-2021-36090,CVE-2021-35515,CVE-2021-35517,CVE-2021-35516) have been addressed in this release.
May
Build Number: 5230 (Release on: May 24, 2023)
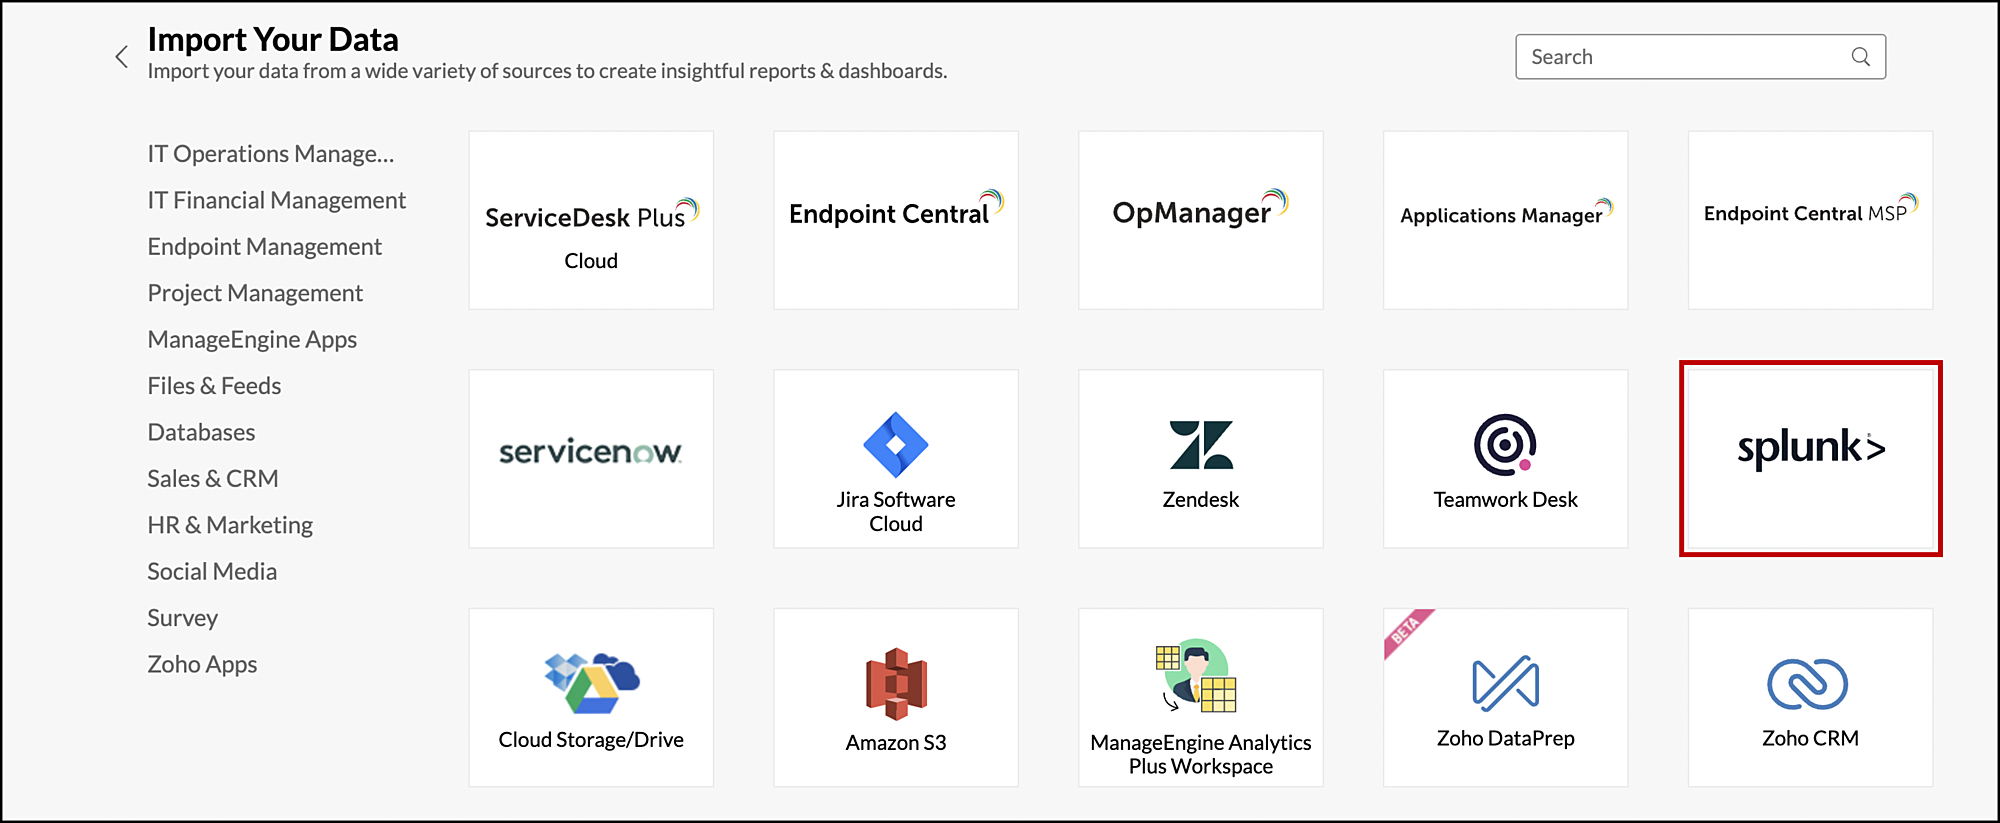
Introducing out-of-box analytics for Splunk
NewAnalytics Plus seamlessly integrates with Splunk to convert complicated machine generated Big Data into insightful dashboards, allowing users to derive key insights. Click here to learn more about this integration.
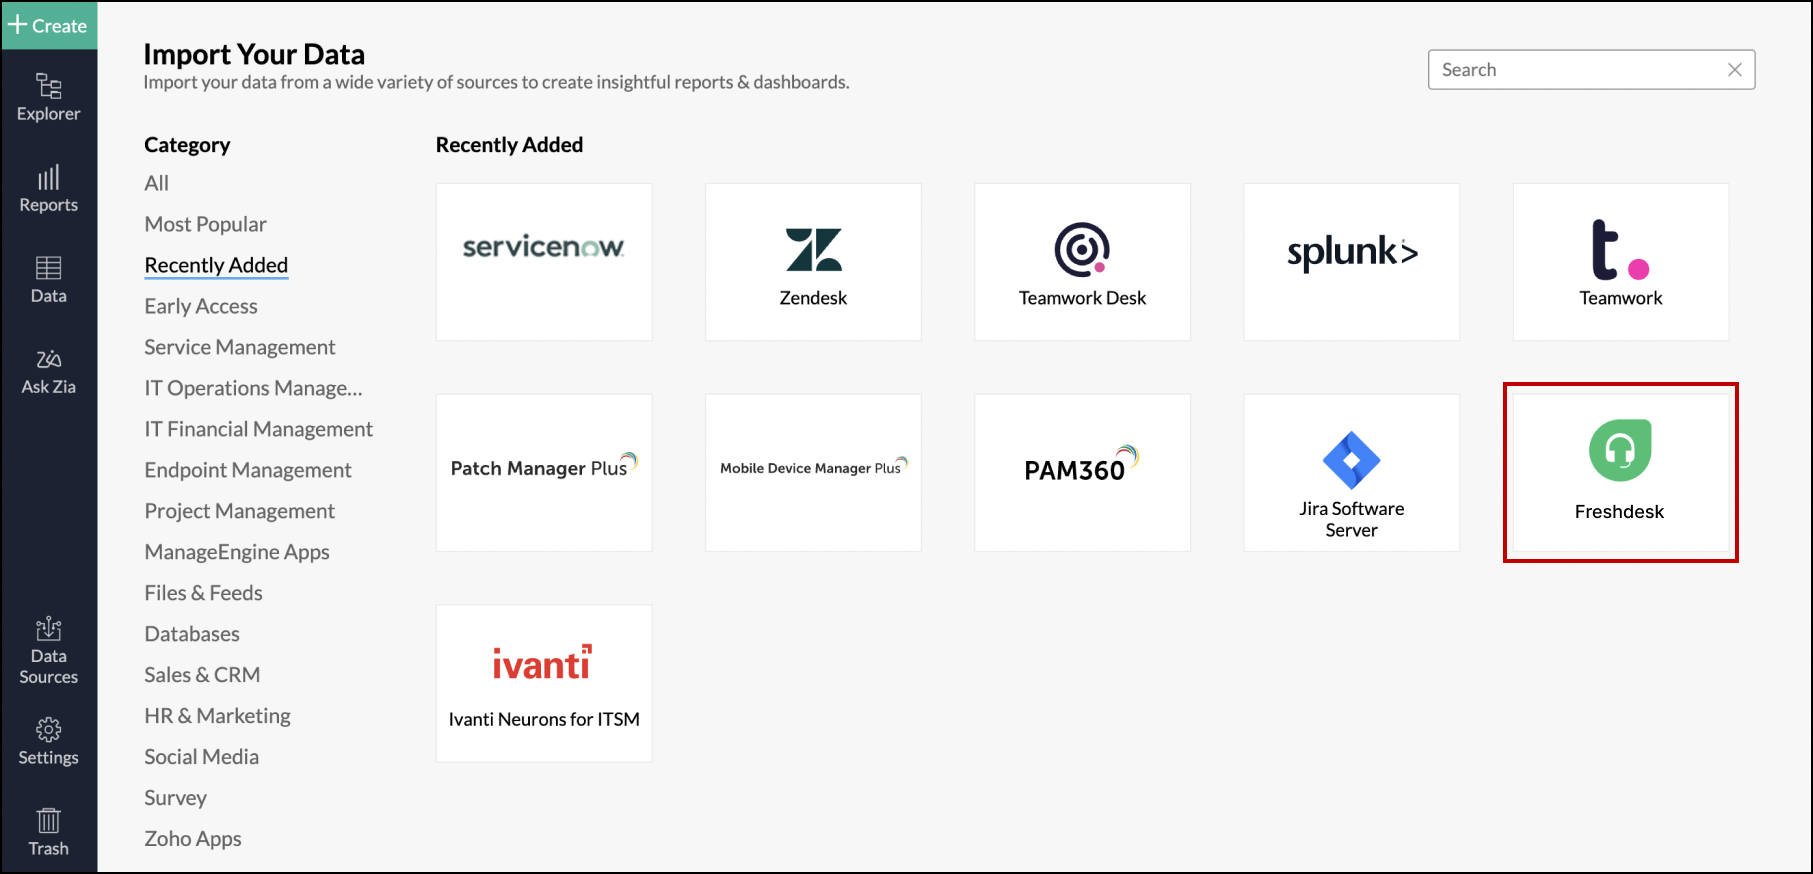
Launching advanced analytics for Freshdesk
NewIntroducing out-of-the-box reports and dashboards for Freshdesk, which allows you to easily analyze your help desk data and gain in-depth insights on key metrics. Click here to learn more about this integration.

Issues fixed
Issues fixed- The recently disclosed FasterXML jackson-databind vulnerabilities (CVE-2022-42004,CVE-2022-42003) and Oracle MySQL vulnerabilities (CVE-2022-21417,CVE-2022-21444) have been addressed in this release.
April
Build Number: 5220 (Release on: April 24, 2023)
Launching advanced analytics for additional modules in OpManager
NewIntroducing support for URL Monitors, URL Performance Details, and URL Availability History modules from OpManager. Click here to learn more about this integration.
Enhancements to Analytics Plus Mobile BI App
EnhancementThe following enhancements have been made to the Analytics Plus Mobile App:
- Analytics Plus mobile app now works with both the Analytics Plus On-Premise and Cloud deployments.
- iOS users can now include annotations made on reports and dashboards as part of PDF exports.
- Introducing in-app report commenting for faster collaboration.
- Users can now configure their notification preferences using the mobile app.
Click here to learn more.
Issues fixed
Issues fixed- The issue with the Apache Commons Text 1.8.jar (CVE-2022-42889) that resulted in a Remote Code Execution (RCE) vulnerability has been fixed.
- The issue where the high availability configuration failed due to machine passwords with special characters is now fixed.
Feb
Build Number: 5210 (Release on: February 14, 2023)
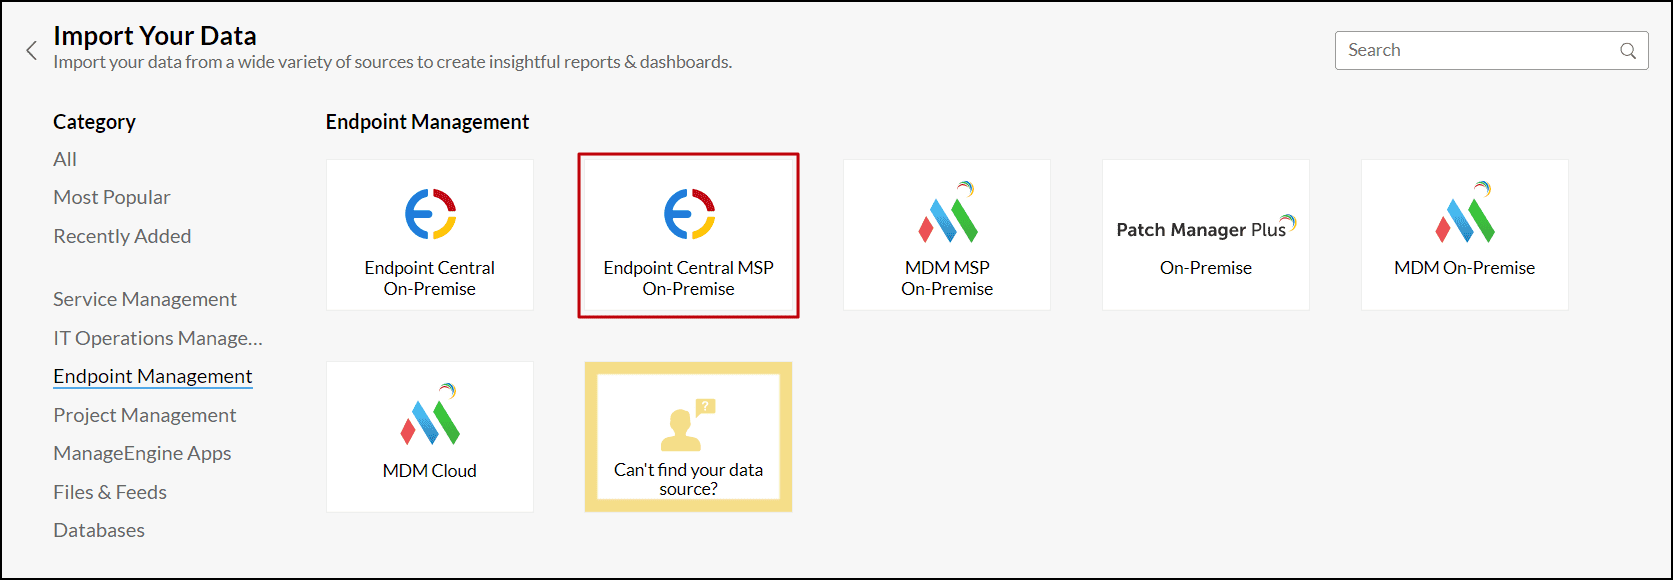
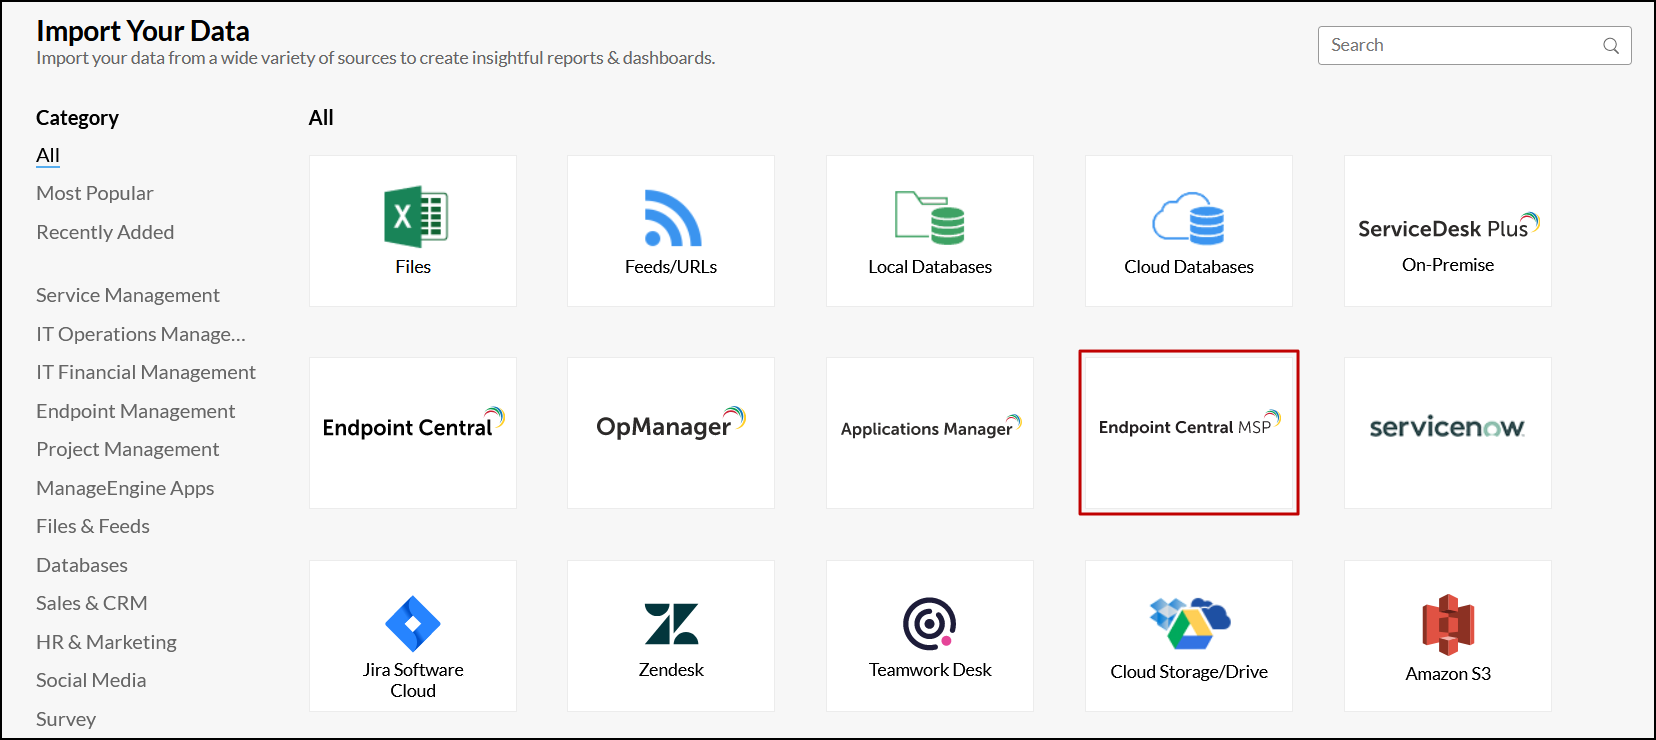
Introducing advanced analytics for Endpoint Central MSP
NewAnalytics Plus offers out-of-box analytics for Endpoint Central MSP to efficiently track and get an in-depth insight about all the managed devices in a unified view. Click here to learn more.
Support for new mail server types
EnhancementYou can now use OAuth authentication in SMTP or Microsoft's Exchange Web Services (EWS) as mail servers to trigger email notifications from Analytics Plus. Click here to learn more.
Launching advanced analytics for SupportCenter Plus' survey module
NewAnalytics Plus now offers out-of-the-box analytics for SupportCenter Plus survey module. Users should be on SupportCenter Plus build 14000 or above to view the respective reports. Click here to learn more.
Updated authentication process of ServiceDesk Plus MSP and SupportCenter Plus
EnhancementThe authentication mechanism of SupportCenter Plus and ServiceDesk Plus MSP has been changed to OAuth mode. Click the corresponding links to learn more.
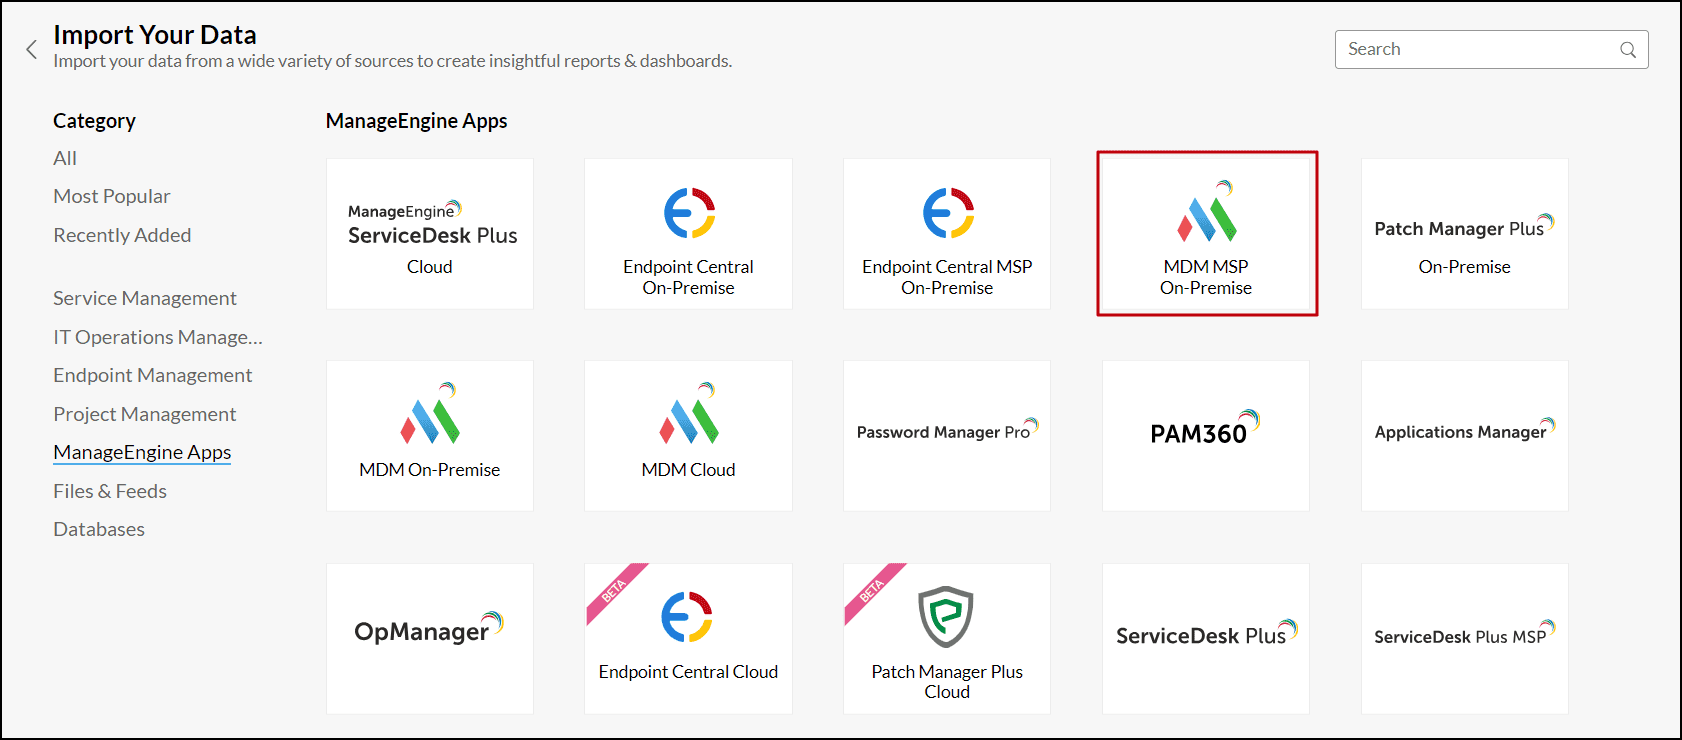
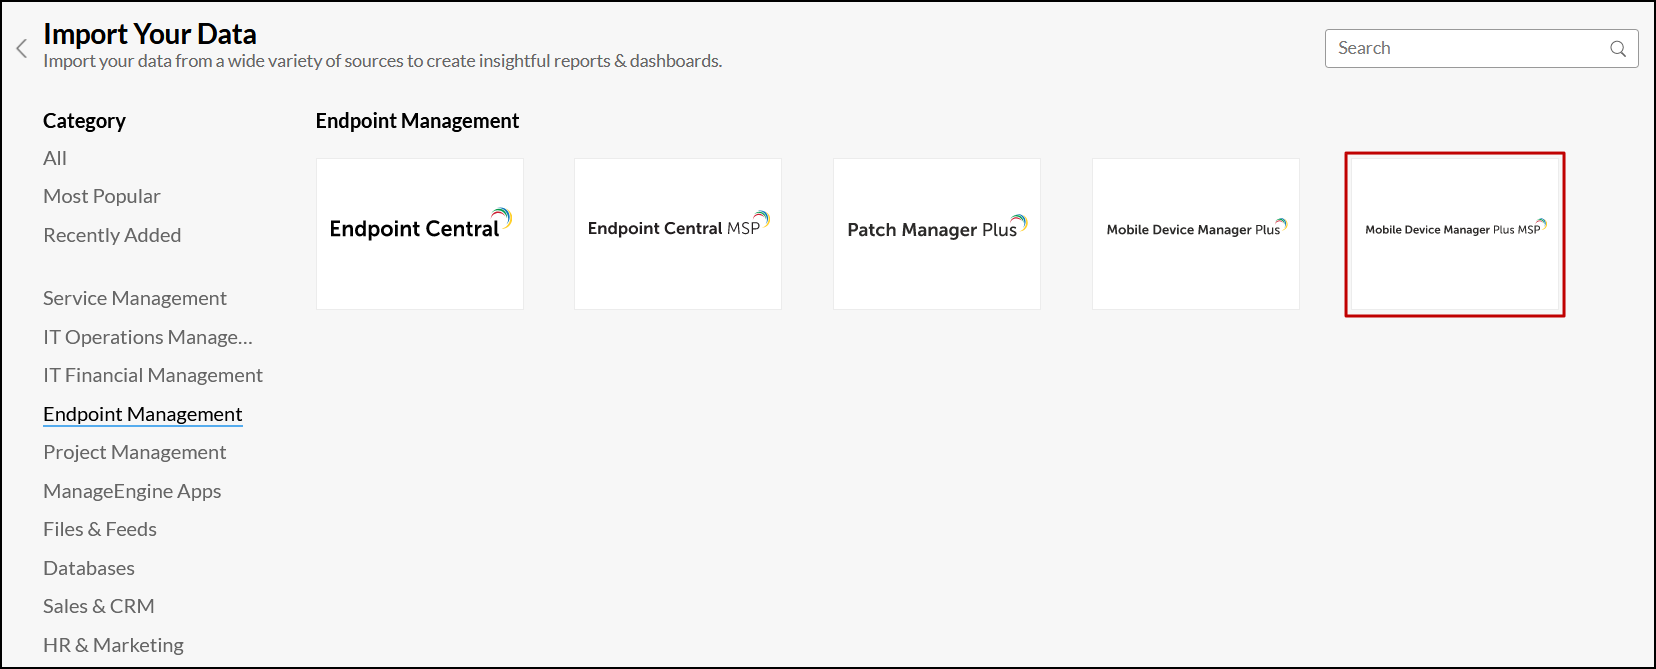
Launching out-of-box analytics for Mobile Device Manager Plus MSP
NewAnalytics Plus seamlessly integrates with Mobile Device Manager Plus MSP, enabling managed service providers to monitor and manage mobile devices efficiently. Click here to learn more.
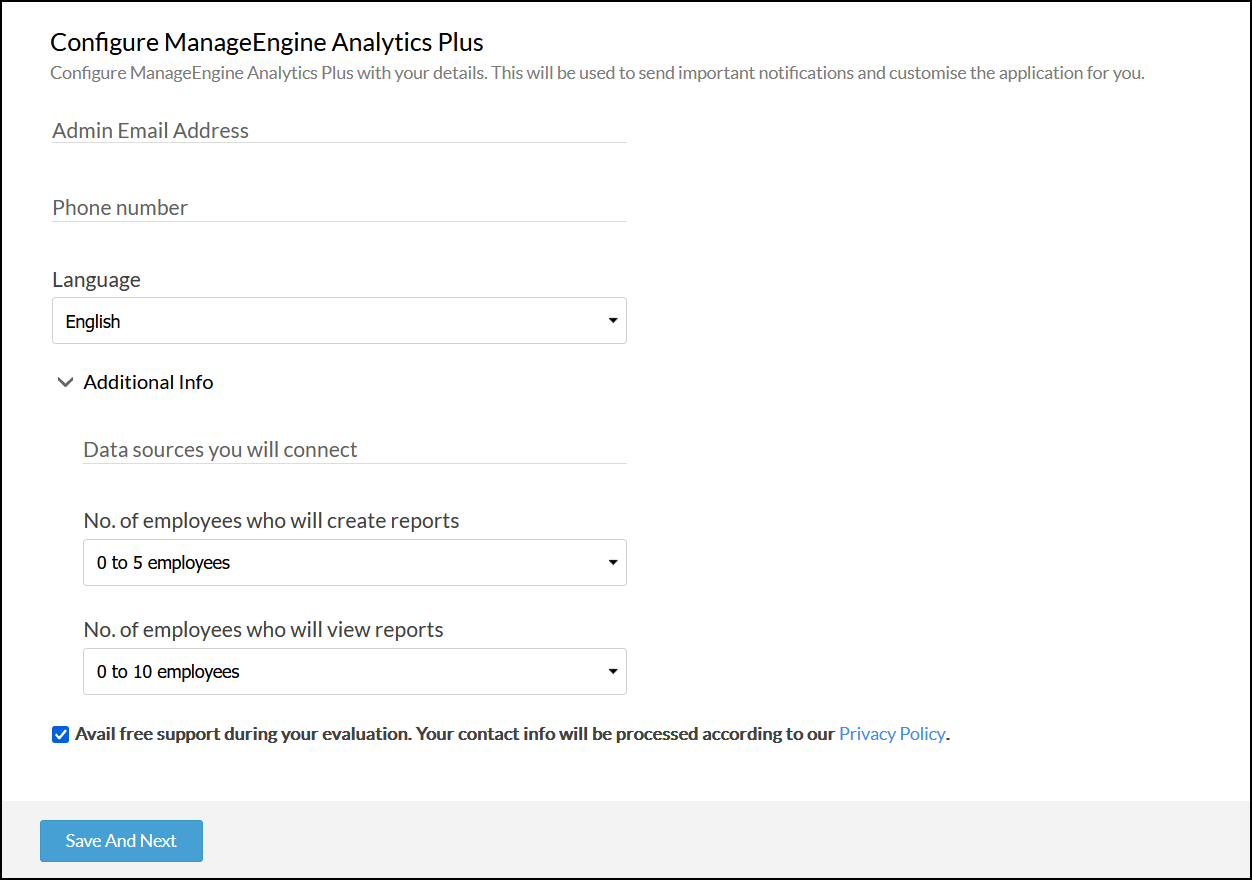
Redesigned getting started screens
EnhancementAnalytics Plus' getting started screens have been redesigned to enhance the user experience. Click here to learn more.
2022
Dec
Build Number: 5200 (Release on: December 26, 2022)
Database upgrade
EnhancementAnalytics Plus' backend PostgreSQL database which is used to store data is upgraded to version 11.14.
Advanced columnar engine
EnhancementExperience 2x faster read operations in Analytics Plus with the new and improved columnar engine.
Boosted performance
EnhancementAnalytics Plus can now support larger workloads with the introduction of horizontally scalable architecture.
Nov
Build Number: 5150 (Release on: November 07, 2022)
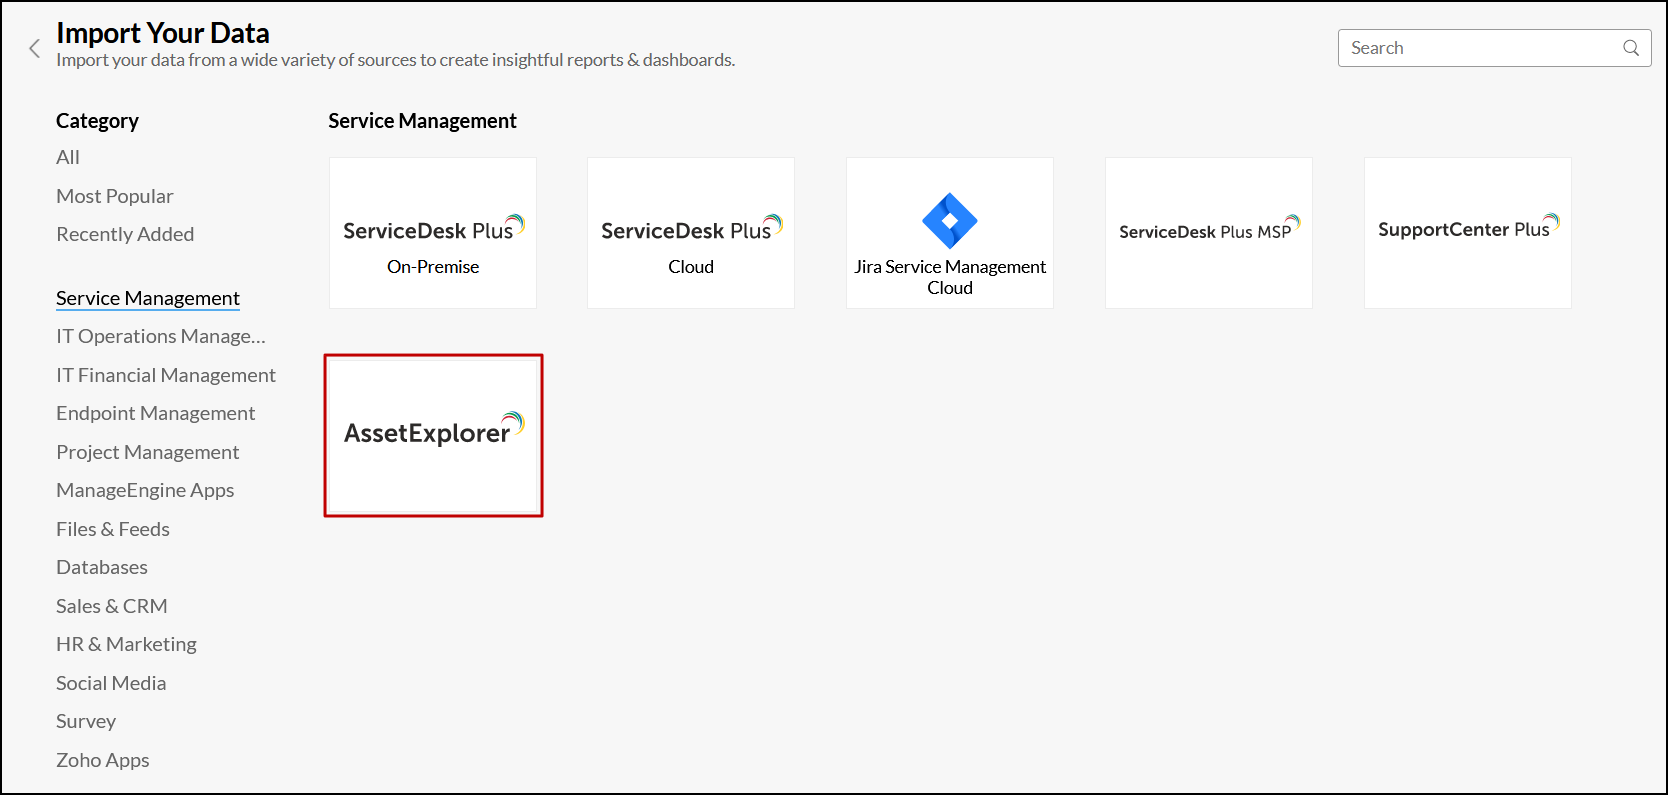
Introducing advanced analytics for ManageEngine AssetExplorer
NewAnalytics Plus offers out-of-box analytics to track and analyze your organization-wide asset information. Click here to learn more.
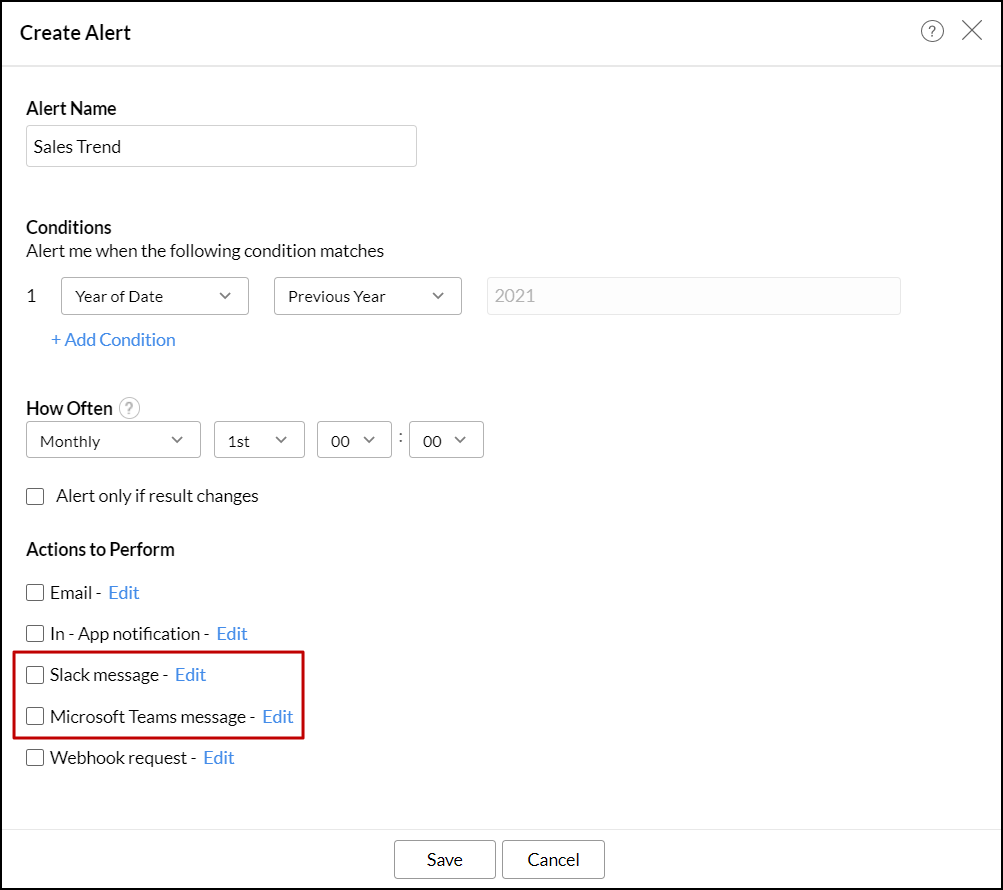
Rolling out Slack and Microsoft Teams notifications for data alerts
NewYou can now trigger and post threshold violation alerts directly in Slack and Microsoft Teams channels. Click the corresponding links to learn more.
ServiceDesk Plus' authentication process is reformed
EnhancementAnalytics Plus now uses OAuth based authentication mechanism to integrate with ServiceDesk Plus. Existing customers using this integration are advised to move to the OAuth mode for better security. Click here to learn more.
Enhancements to Google Ads integration
EnhancementThe Google Ads integration now requires a developer token to authenticate with Google Ads APIs for data collection. Click here to learn more.
Aug
Build Number: 5140 (Release on: August 22, 2022)
Introducing Live Connect support for Google BigQuery and DB2 cloud databases
NewAnalytics Plus now offers Live Connect support for Google BigQuery, and DB2 cloud services. Click the corresponding links to learn more.
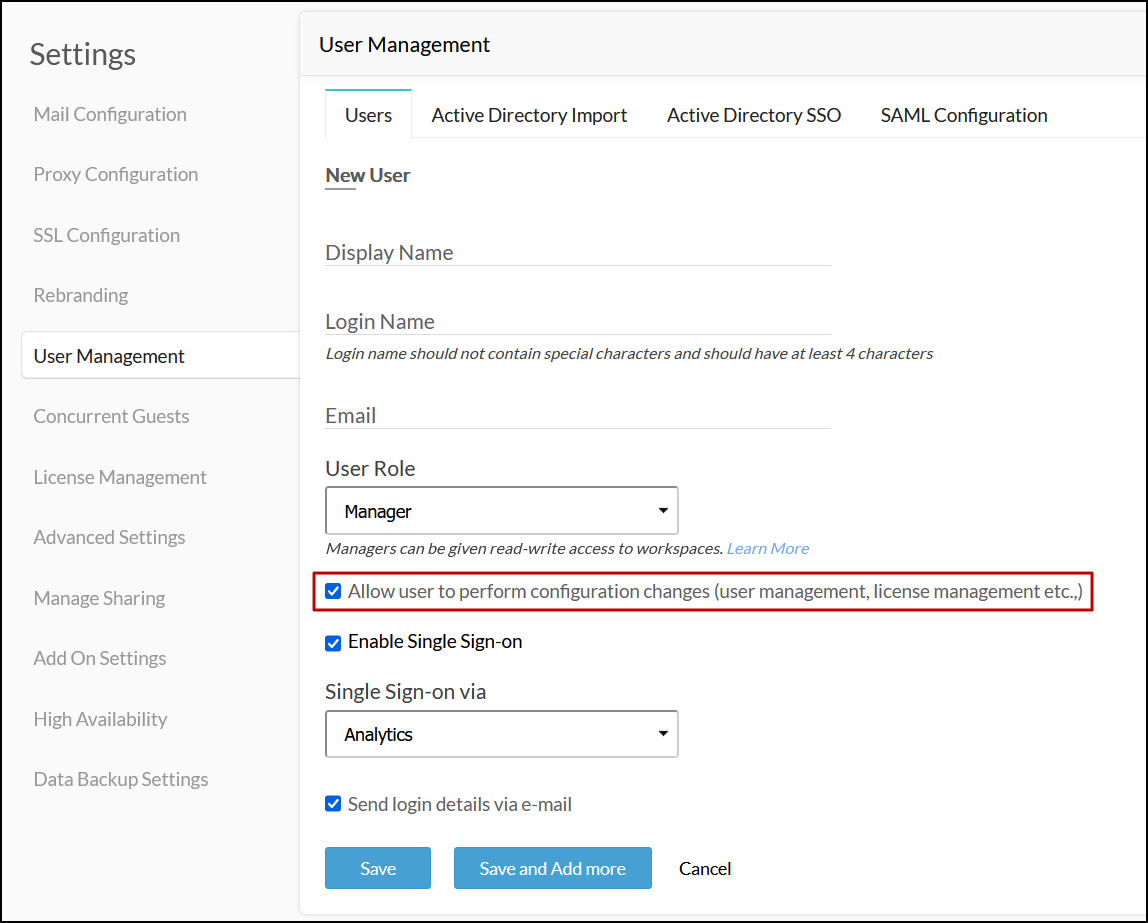
Unveiling admin delegation
NewAnalytics Plus administrators can now delegate permissions to add users, manage licenses etc., for users with the Manager role. Click here to learn more.
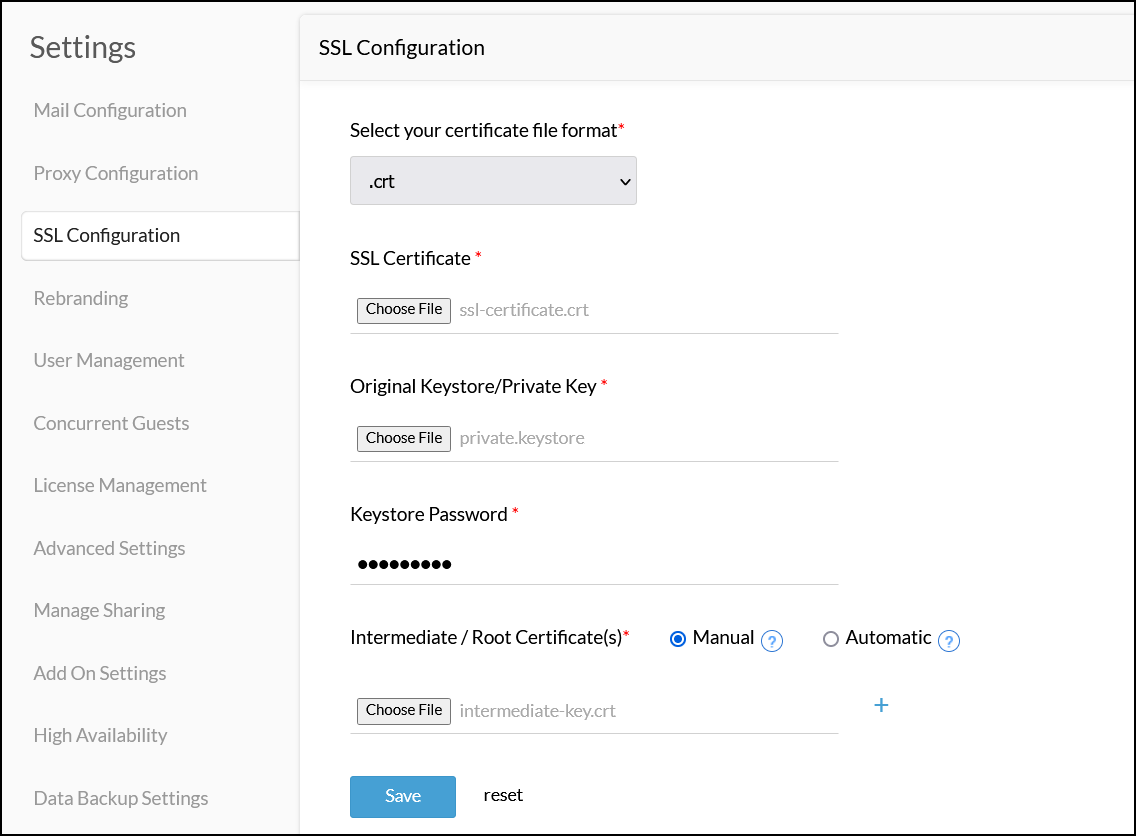
Apply SSL certificate seamlessly
NewAnalytics Plus allows you to apply an SSL certificate seamlessly from the Analytics Plus user interface. Click here to learn more.
Support to import GZIP files
EnhancementYou can now import data from GZIP files stored in your local drives, web URLs, or any FTP servers.
July
Build Number: 5130 (Release on: July 08, 2022)
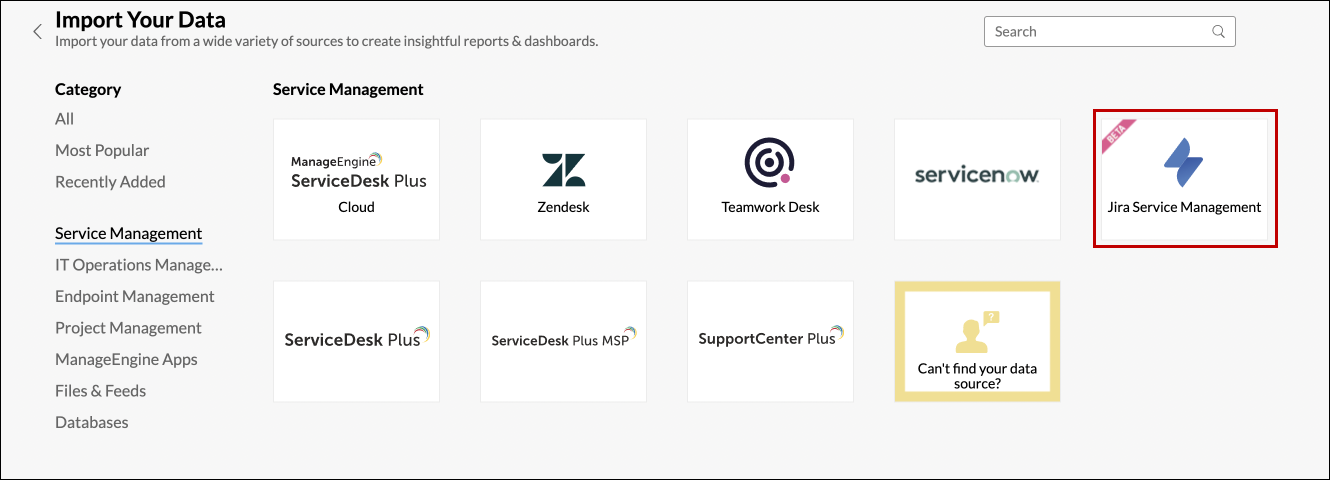
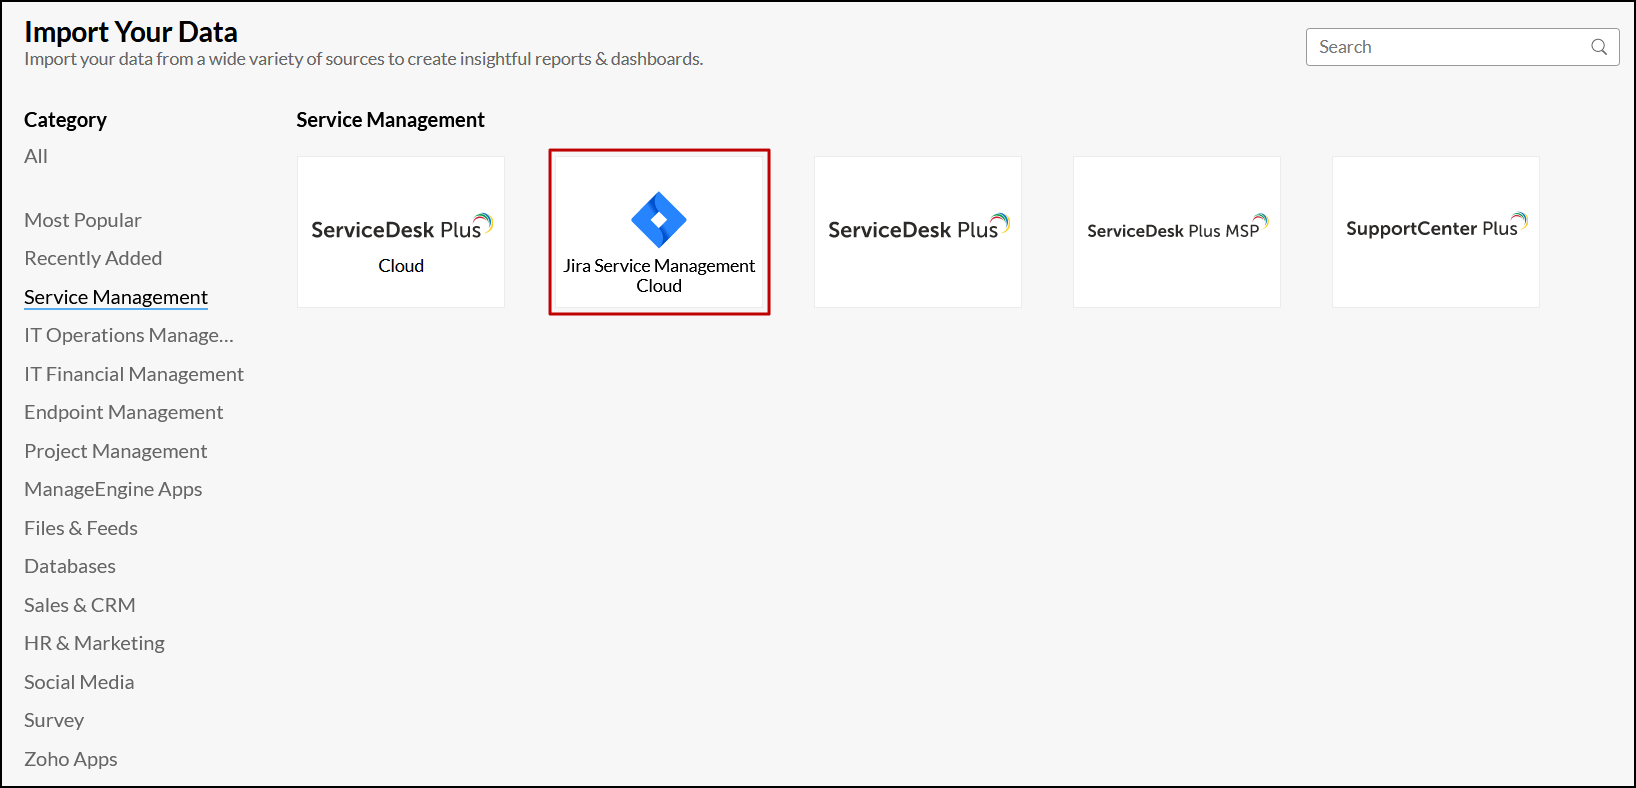
Introducing out-of-box analytics for Jira Service Management Cloud
NewAnalytics Plus seamlessly integrates with Jira Service Management Cloud to equip you with the required advanced service desk insights to stay on top of your customer experience. Click here to learn more.
Unveiling Live Connect support for local and cloud databases
NewAnalytics Plus now allows you to connect live with various local and cloud databases for real-time reporting and analysis. Click the corresponding links to learn more.
- Local databases: MariaDB and DB2.
- Cloud databases: IBM Cloud, Amazon Athena, Google Cloud MS SQL, and Snowflake.
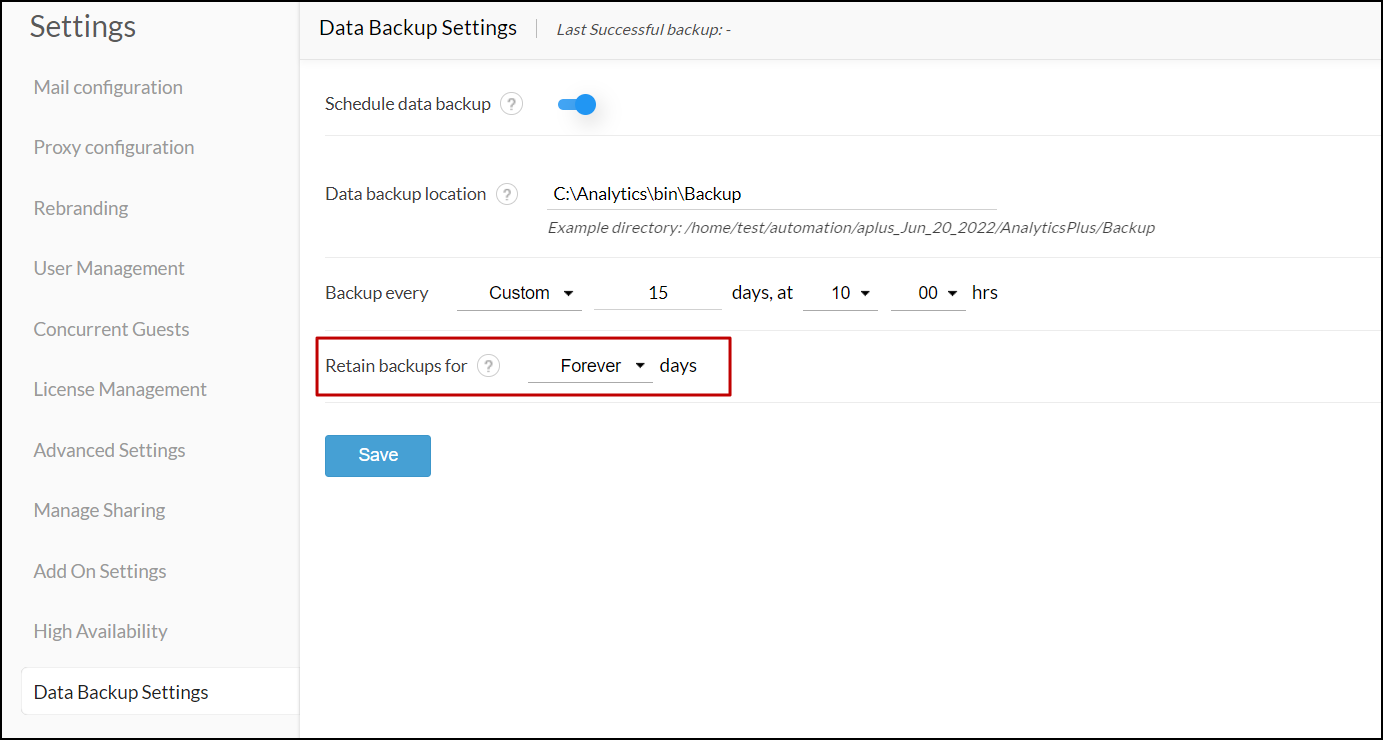
Enhancements to data backup
EnhancementAnalytics Plus enables you to choose the retention period for your data backups. Click here to learn more.
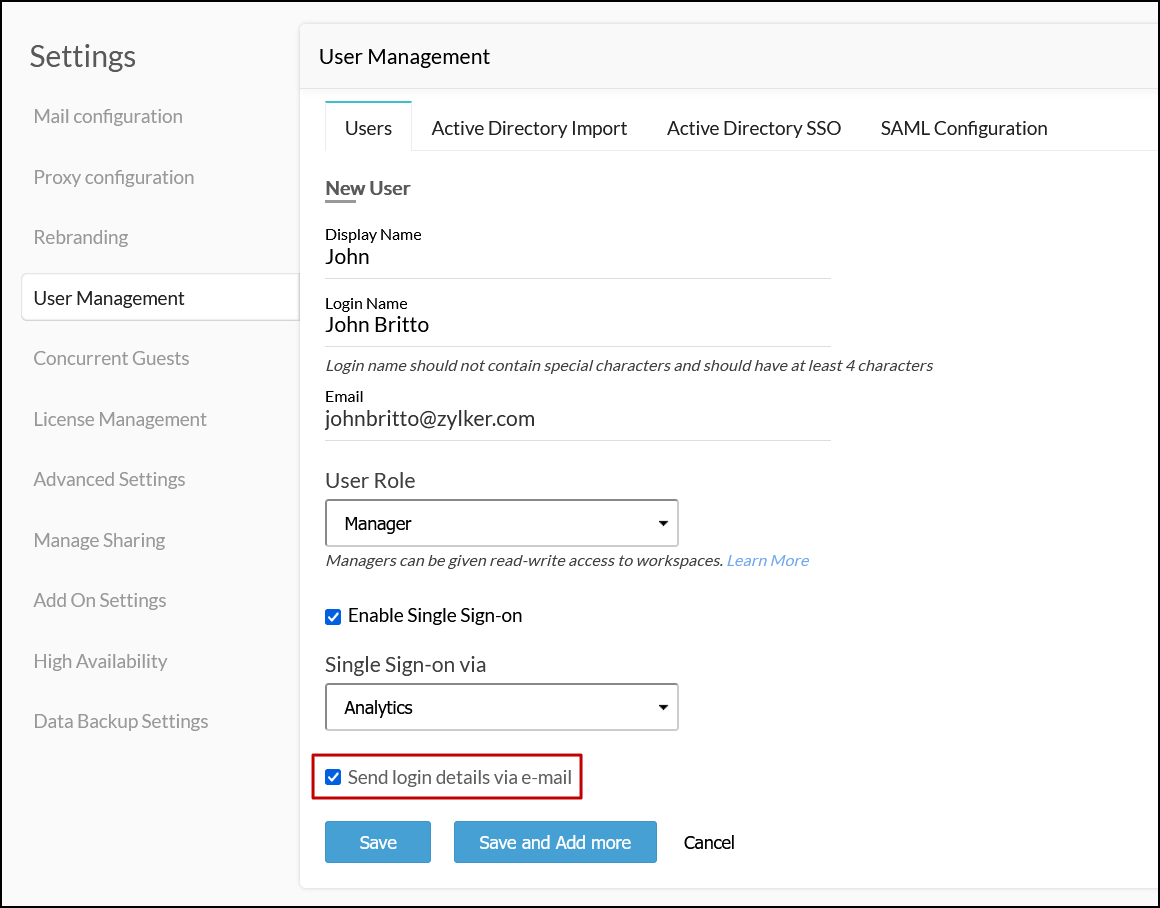
Support to enable/disable emails triggered on user addition
EnhancementYou can now choose to enable or disable the welcome email being triggered while adding SSO or Active Directory users to Analytics Plus. Click here to learn more.
May
Build Number: 5121 (Release on: May 31, 2022)
Issues fixed
Issues fixed- The issue while accessing the login page on deployments without internet access is now fixed.
May
Build Number: 5120 (Release on: May 24, 2022)
Introducing a new license category
NewAnalytics Plus now supports a new license category - Viewers. Members in this category can be given read permissions for shared views and tables. This named account category will allow admins to dynamically filter shared views based on individual viewer privileges. Click here to learn more.
Introducing out-of-box integrations with various business applications
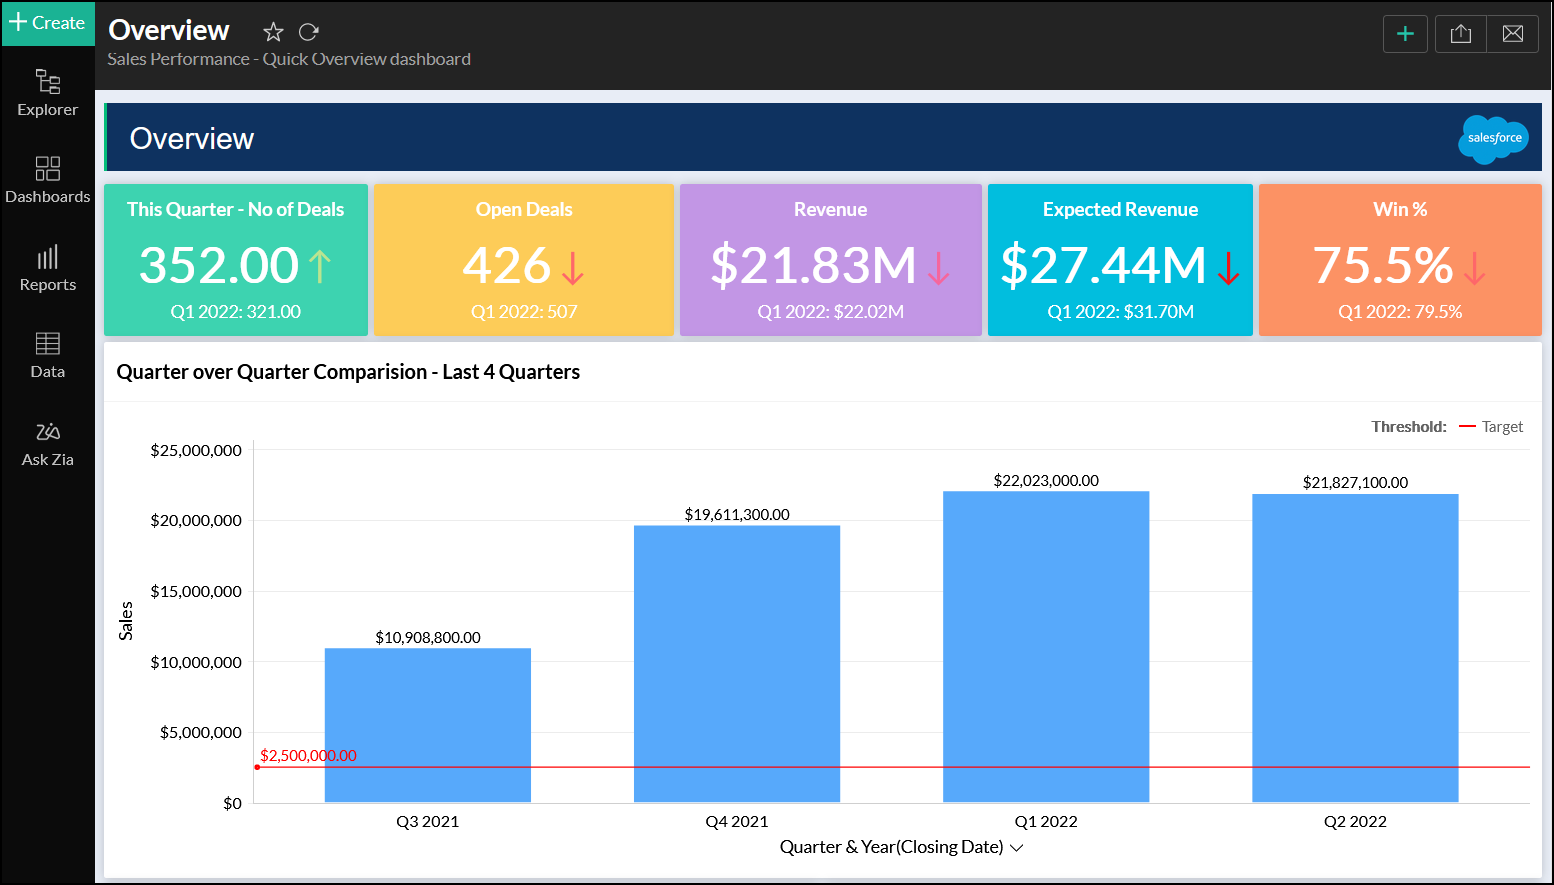
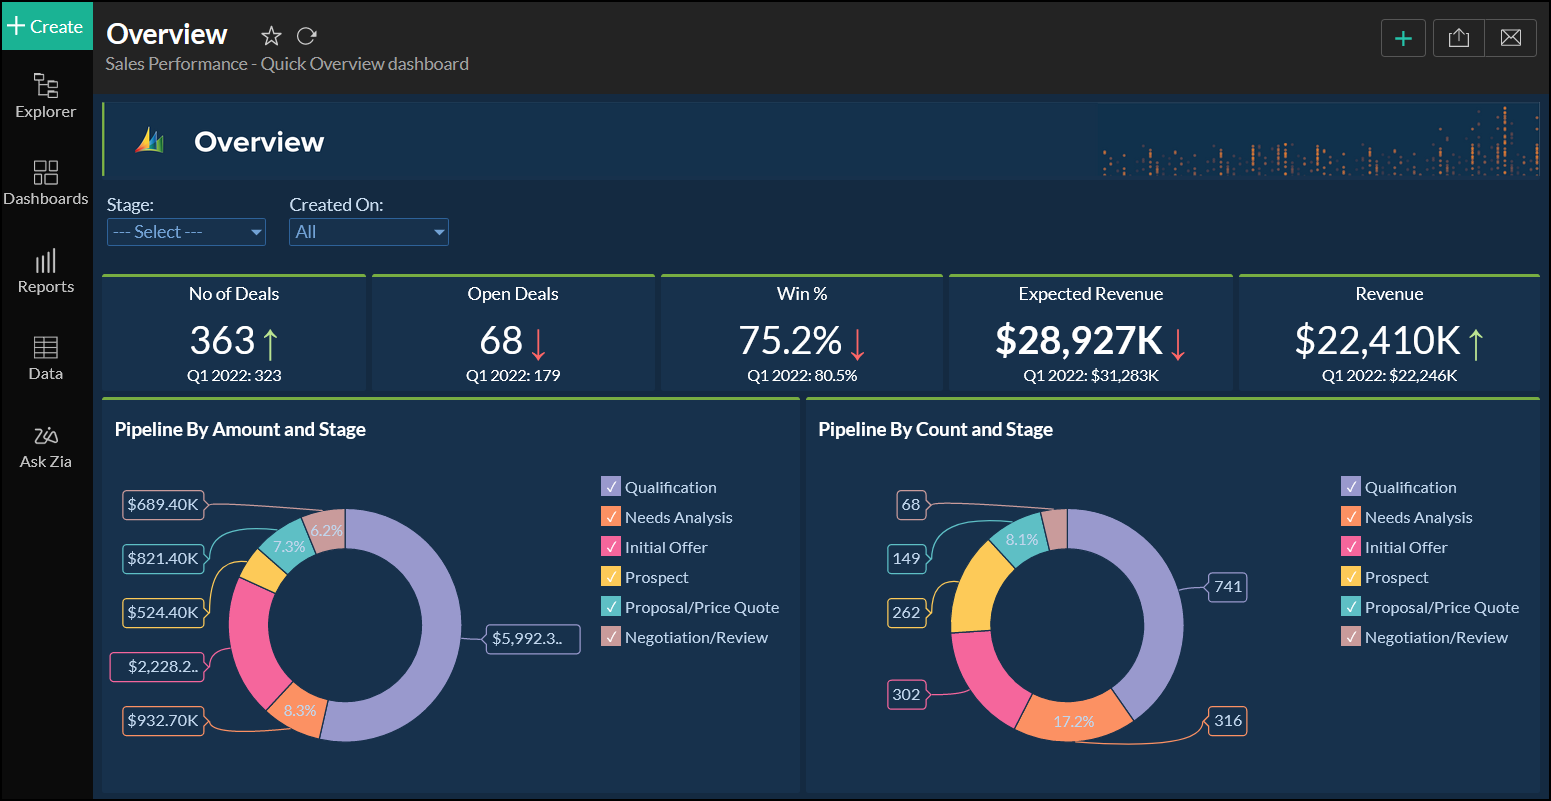
New1. Salesforce
Analytics Plus integrates with Salesforce and enables you to easily analyze your CRM data in detail and derive useful insights on your sales data. Click here to learn more.
2. Microsoft Dynamics CRM
Analytics Plus' out-of-the-box integration with Microsoft Dynamics CRM empowers you with in-depth analytical capabilities over your sales data. Click here to learn more.
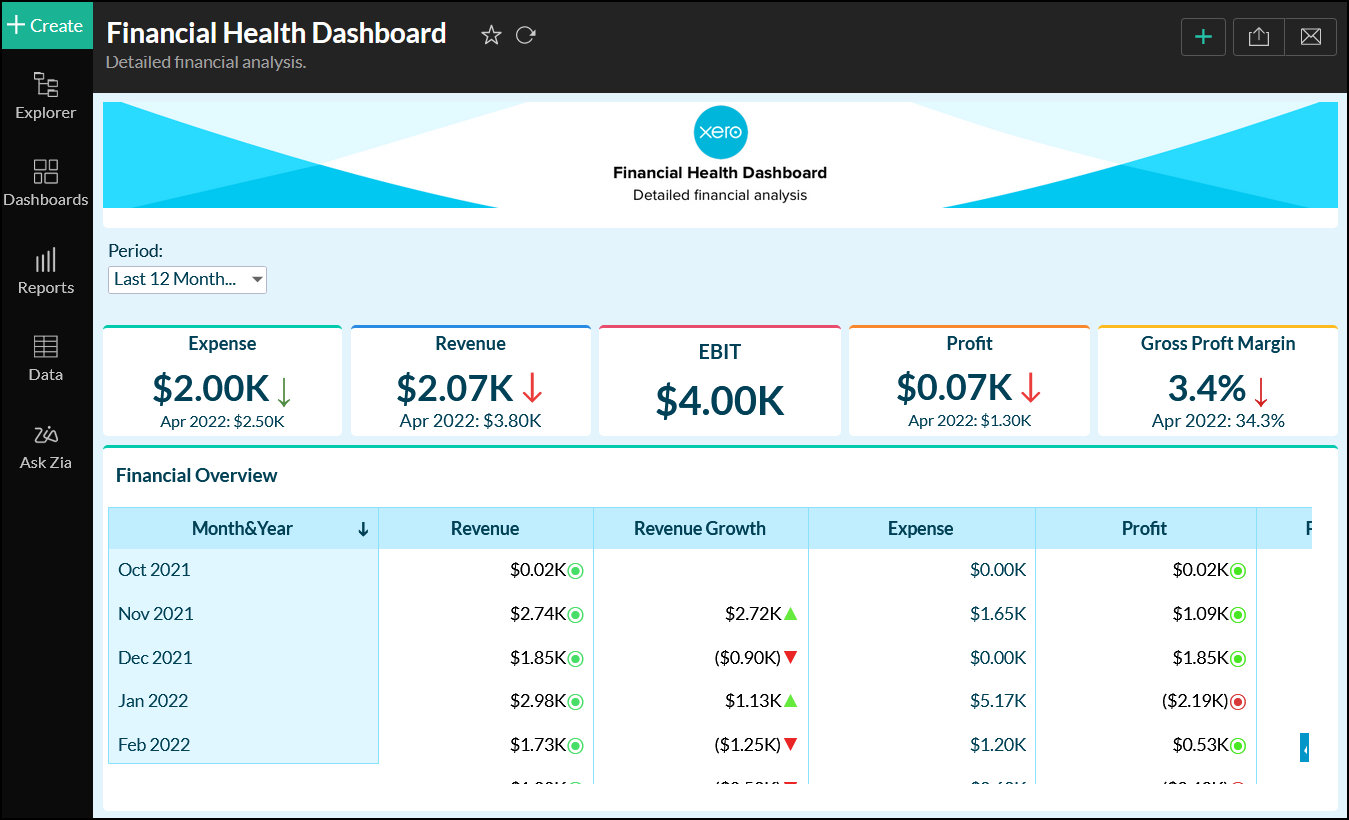
3. Xero
Analytics Plus seamlessly integrates with Xero, and enables you to analyze your financial data and create reports such as financial overview, bill trend and pending invoices. Click here to learn more.
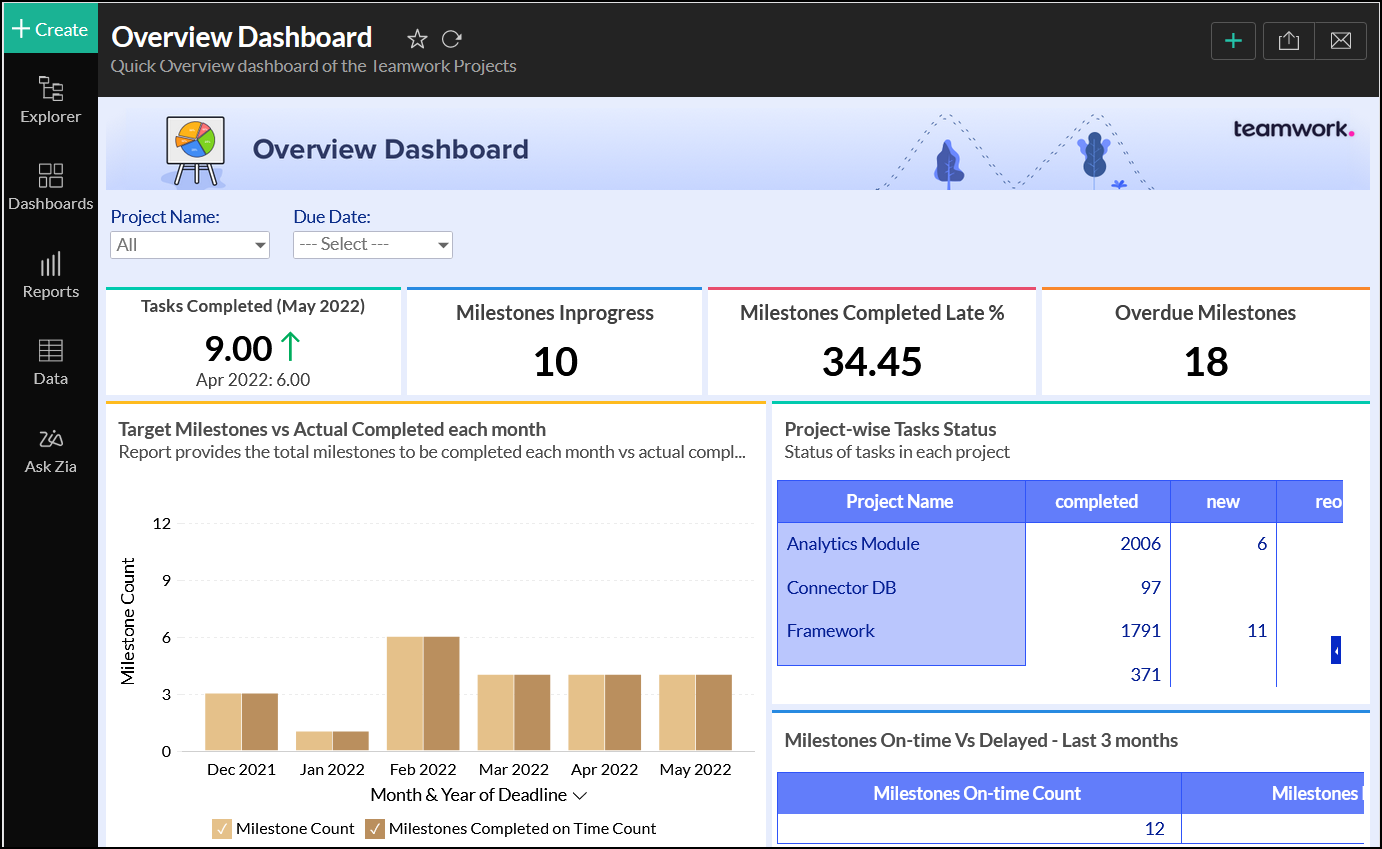
4. Teamwork
Analytics Plus now integrates out-of-the-box with Teamwork Projects and empowers the users with advanced analytical capabilities, thereby giving greater visibility and control over their projects. Click here to learn more.
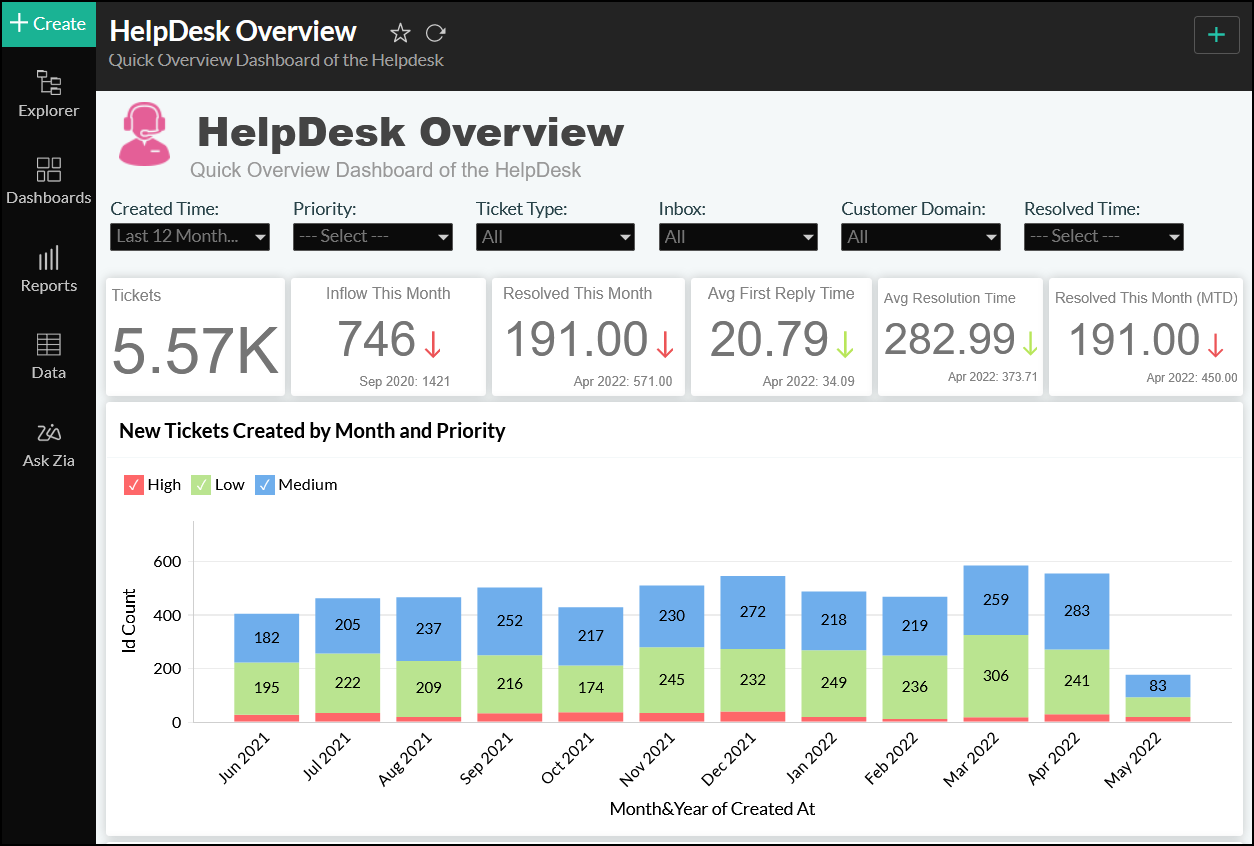
5. Teamwork Desk
Introducing out-of-the-box reports and dashboards for Teamwork Desk, which allows you to easily analyze your help desk data and gain in-depth insights on key metrics. Click here to learn more.
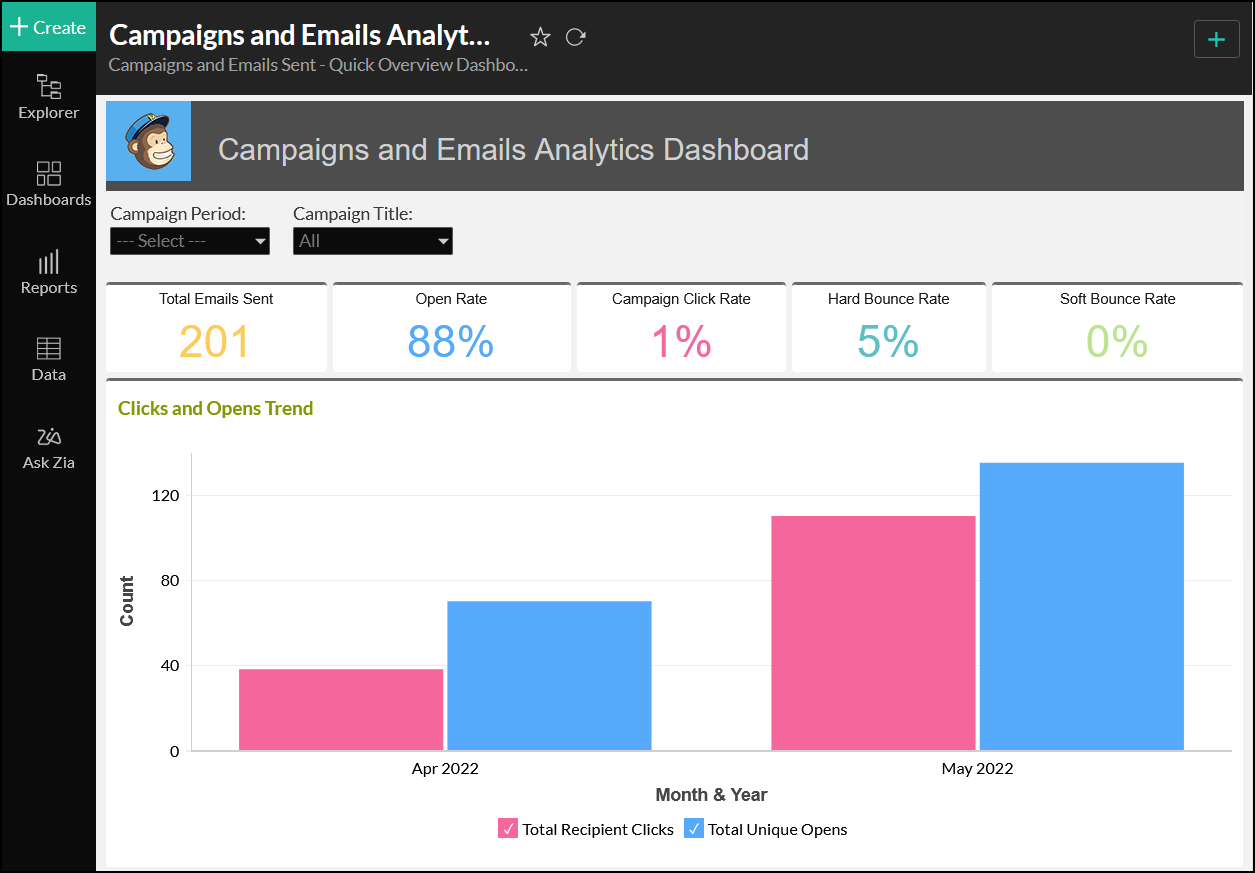
6. MailChimp
Launching advanced analytics for MailChimp, allowing product marketers and analysts to slice and dice their campaign data, and effectively manage email campaigns. Click here to learn more.
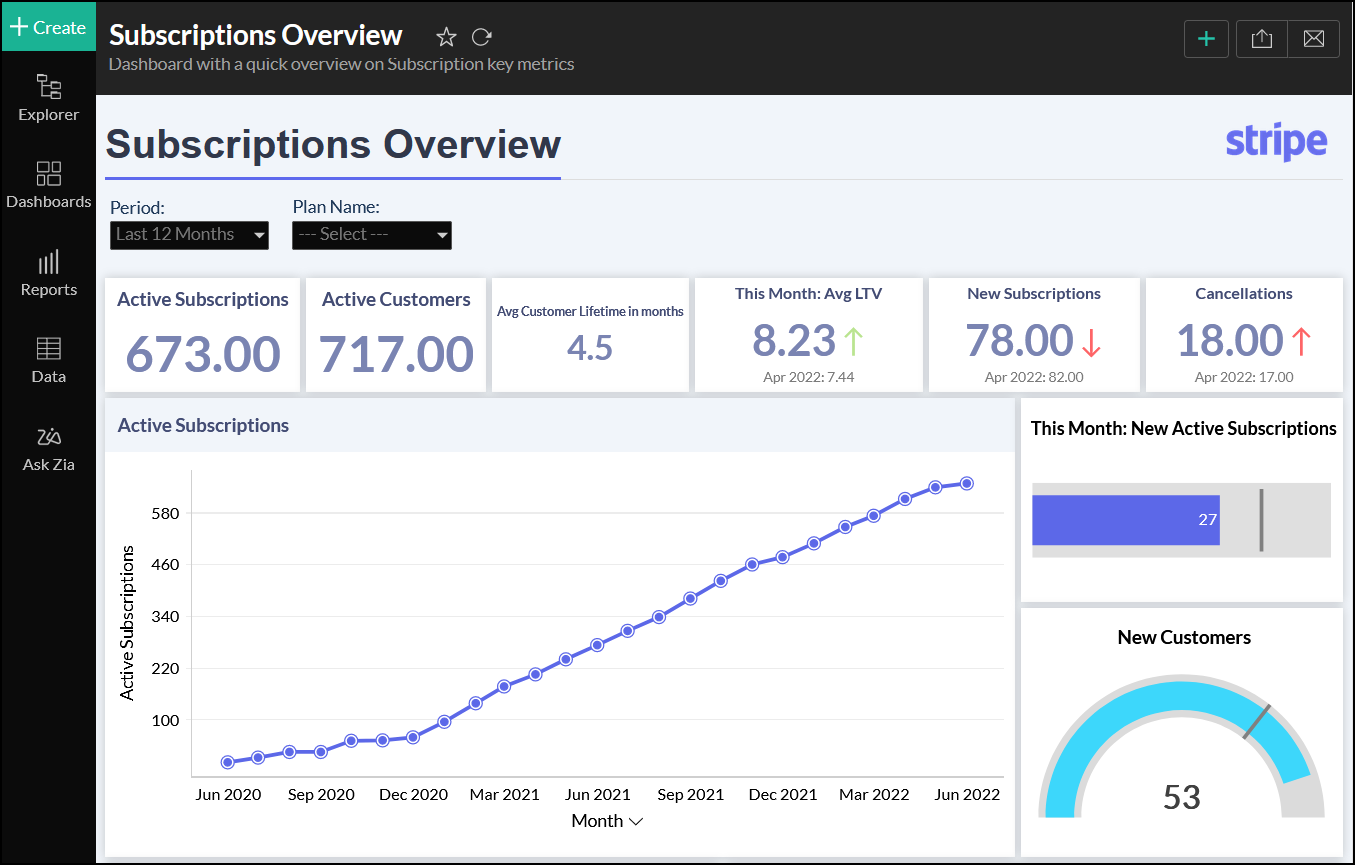
7. Stripe Subscriptions
Analytics Plus seamlessly integrates with Stripe Subscriptions and provides vital insights into your subscription data. Click here to learn more.
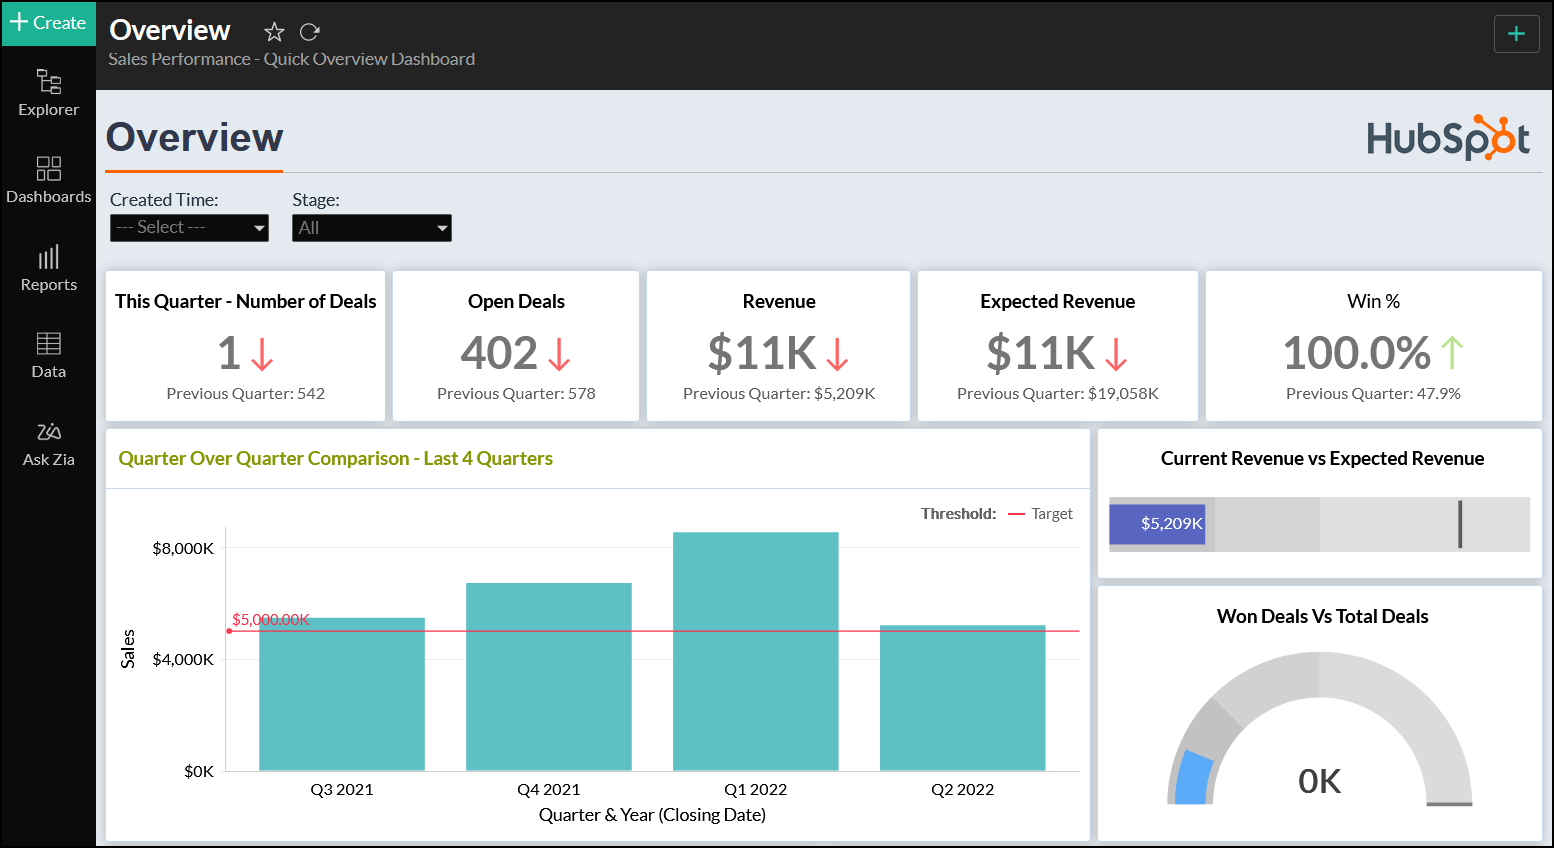
8. HubSpot CRM
Advanced analytics for HubSpot CRM empowers you with deep analytical capabilities over your sales data. Click here to learn more.
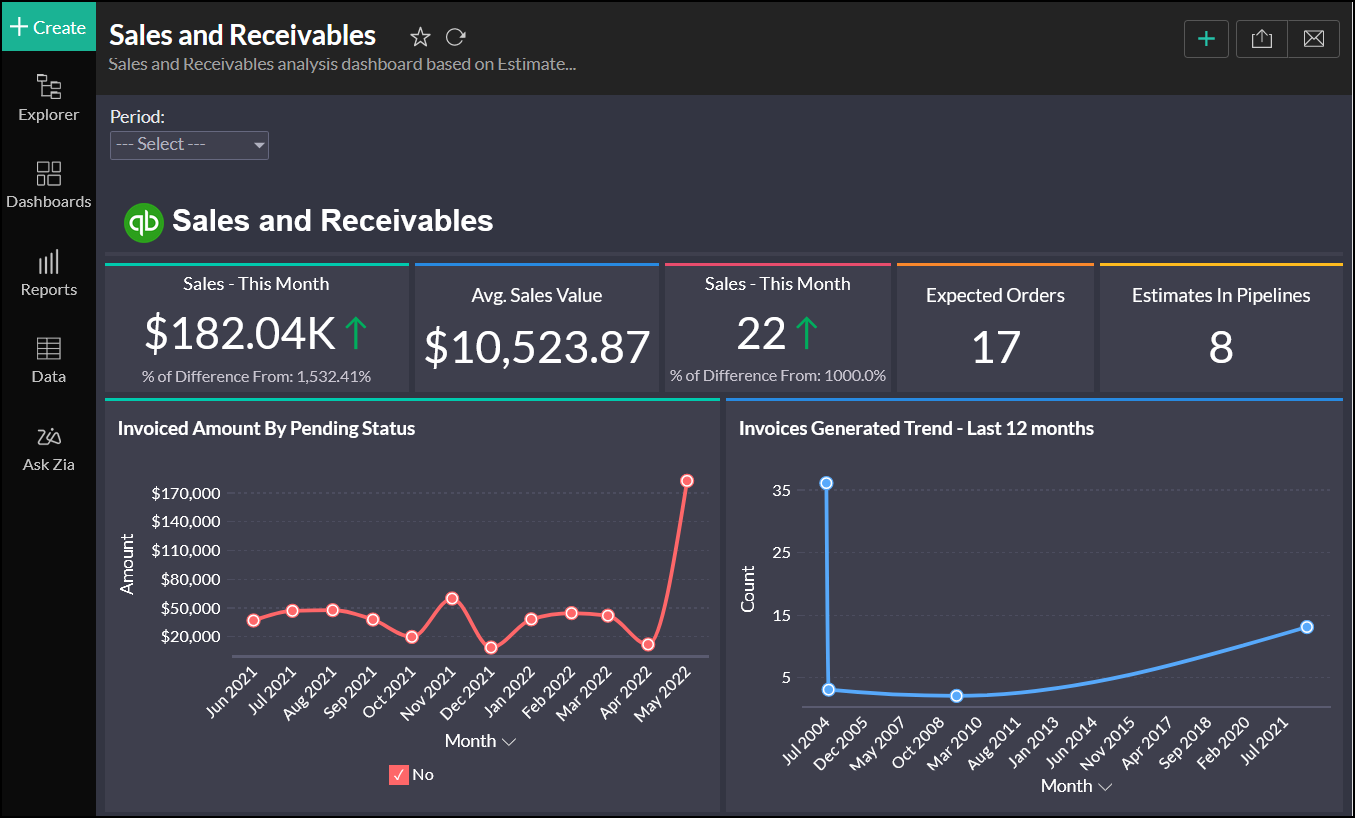
9. QuickBooks Desktop
Analytics Plus' out-of-the-box integration with QuickBooks Desktop enables you to easily analyze your accounting data and keep track of key metrics. Click here to learn more.
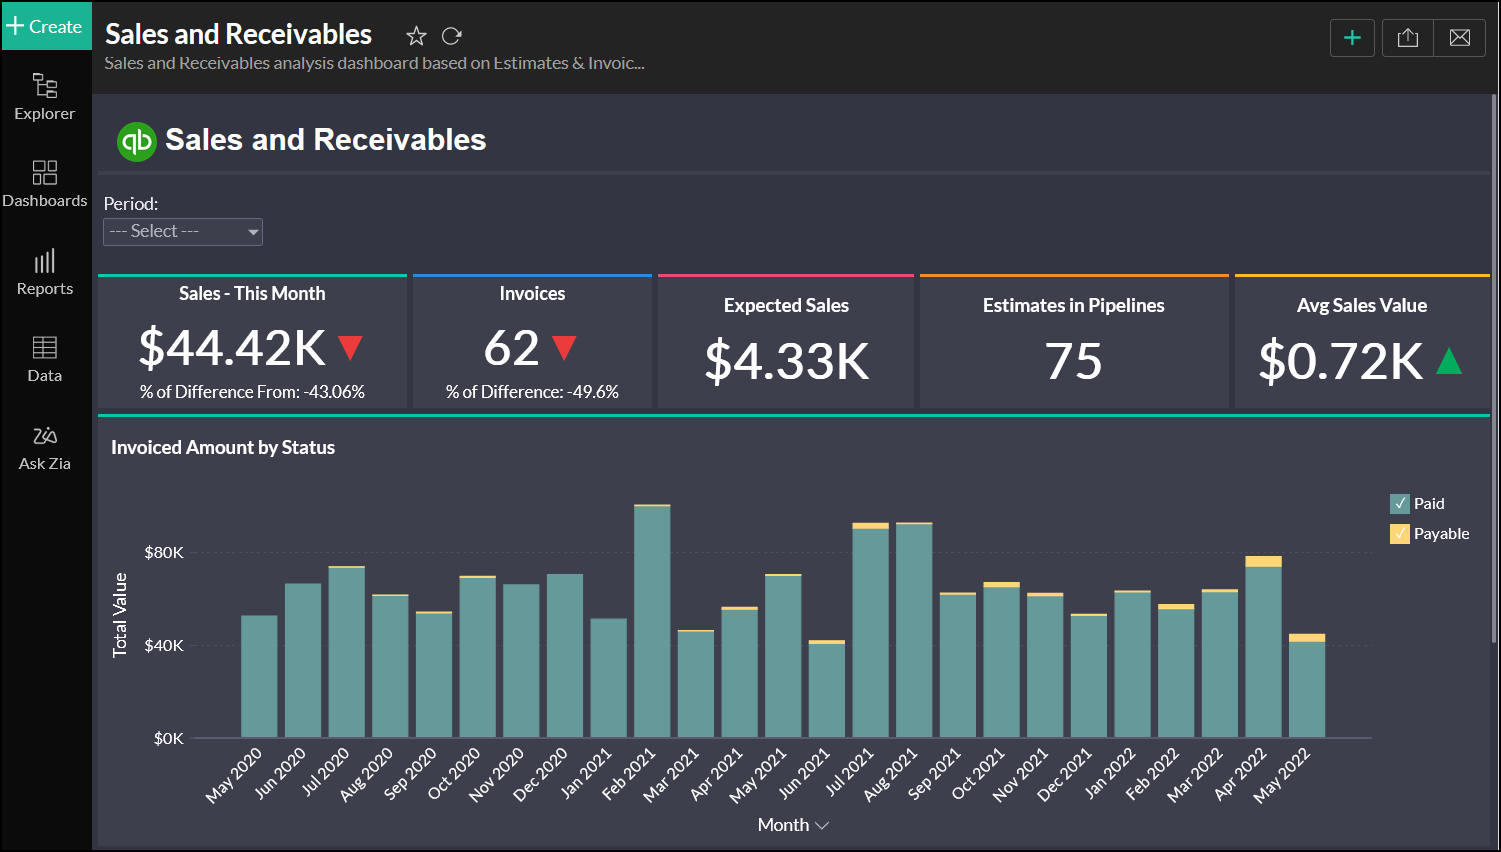
10. QuickBooks Online
Analytics Plus seamlessly integrates with QuickBooks Online and allows you to visualize insightful reports and dashboards for in-depth financial analysis. Click here to learn more.
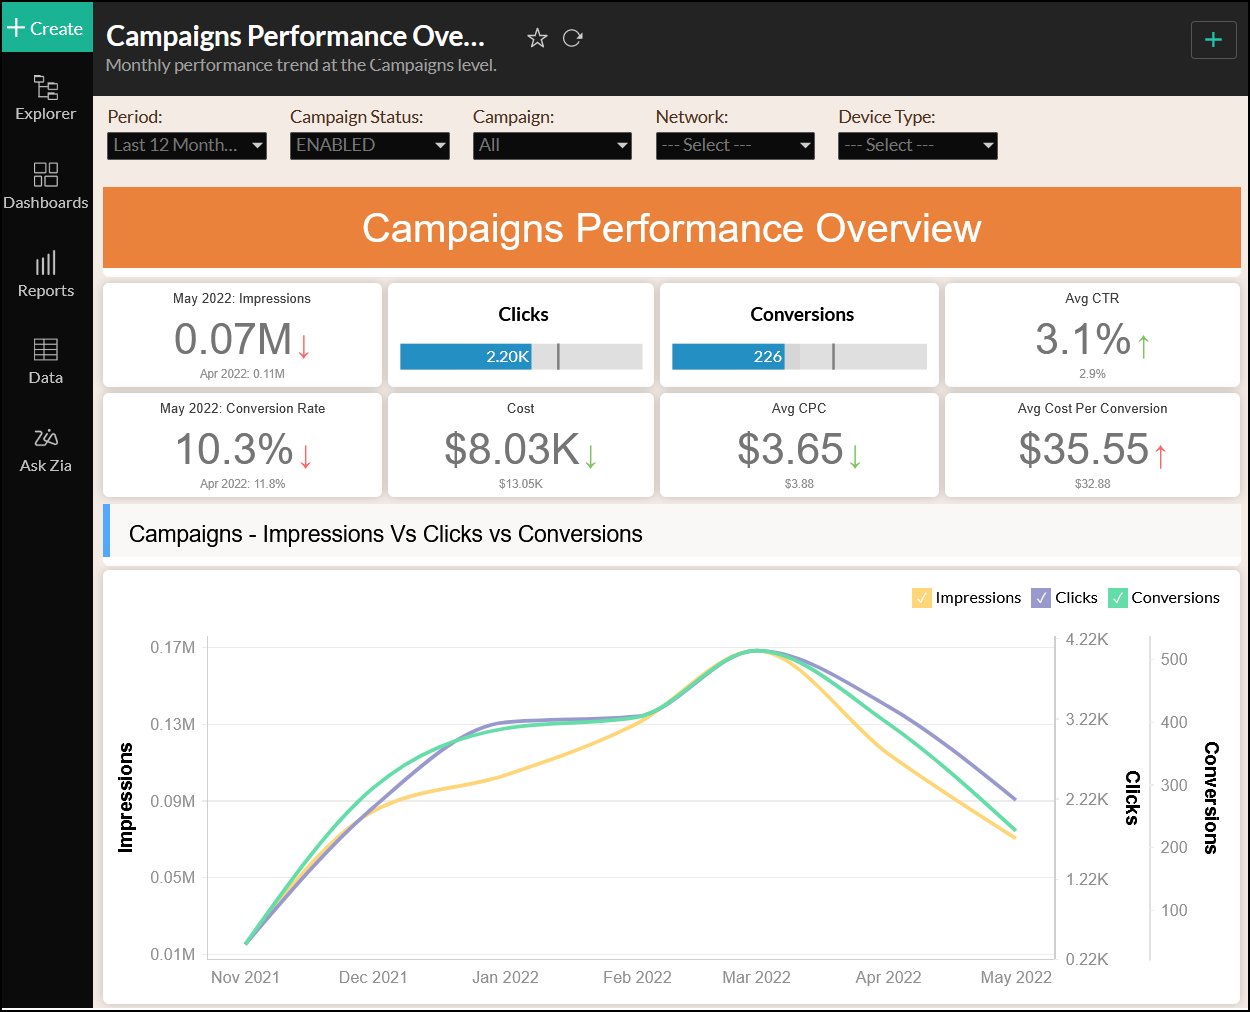
11. Google Ads
Analytics Plus now integrates with Google Ads and allows you to easily analyze your Google Ads campaign data and keep track of key metrics. Click here to learn more.
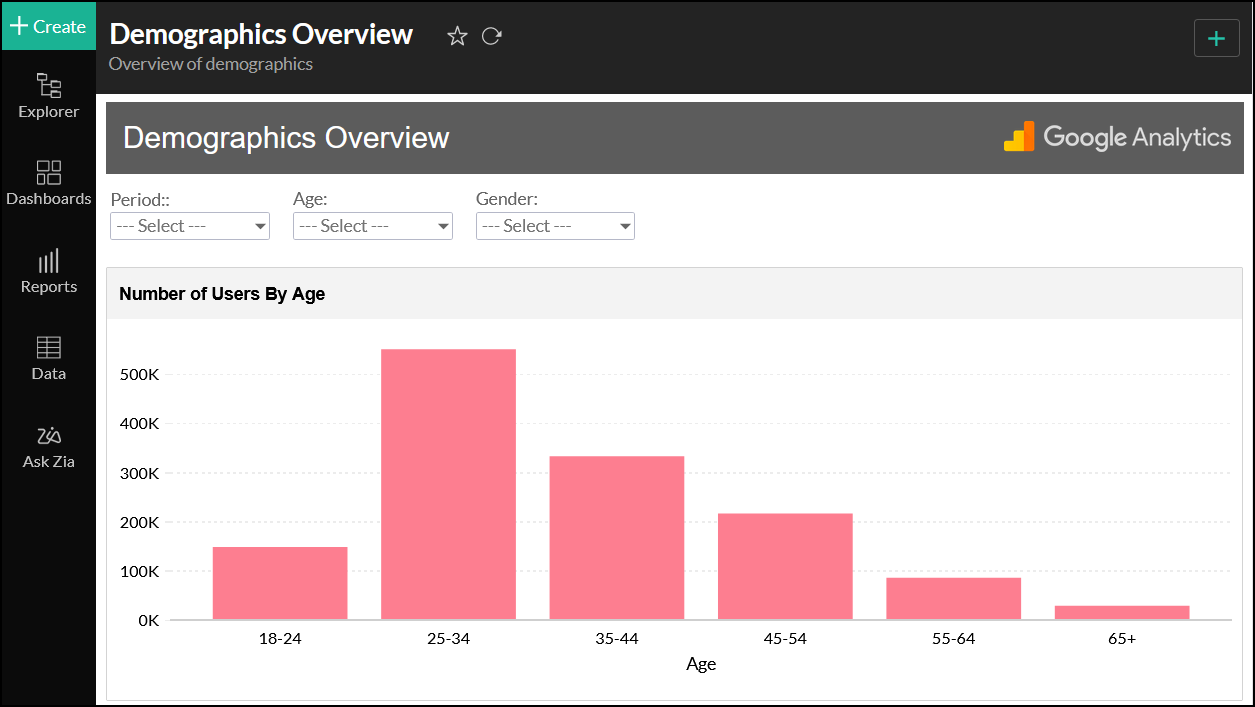
12. Google Analytics
Analytics Plus' out-of-the-box integration with Google Analytics arms marketers with the insights required to optimize and streamline marketing activities. Click here to learn more.
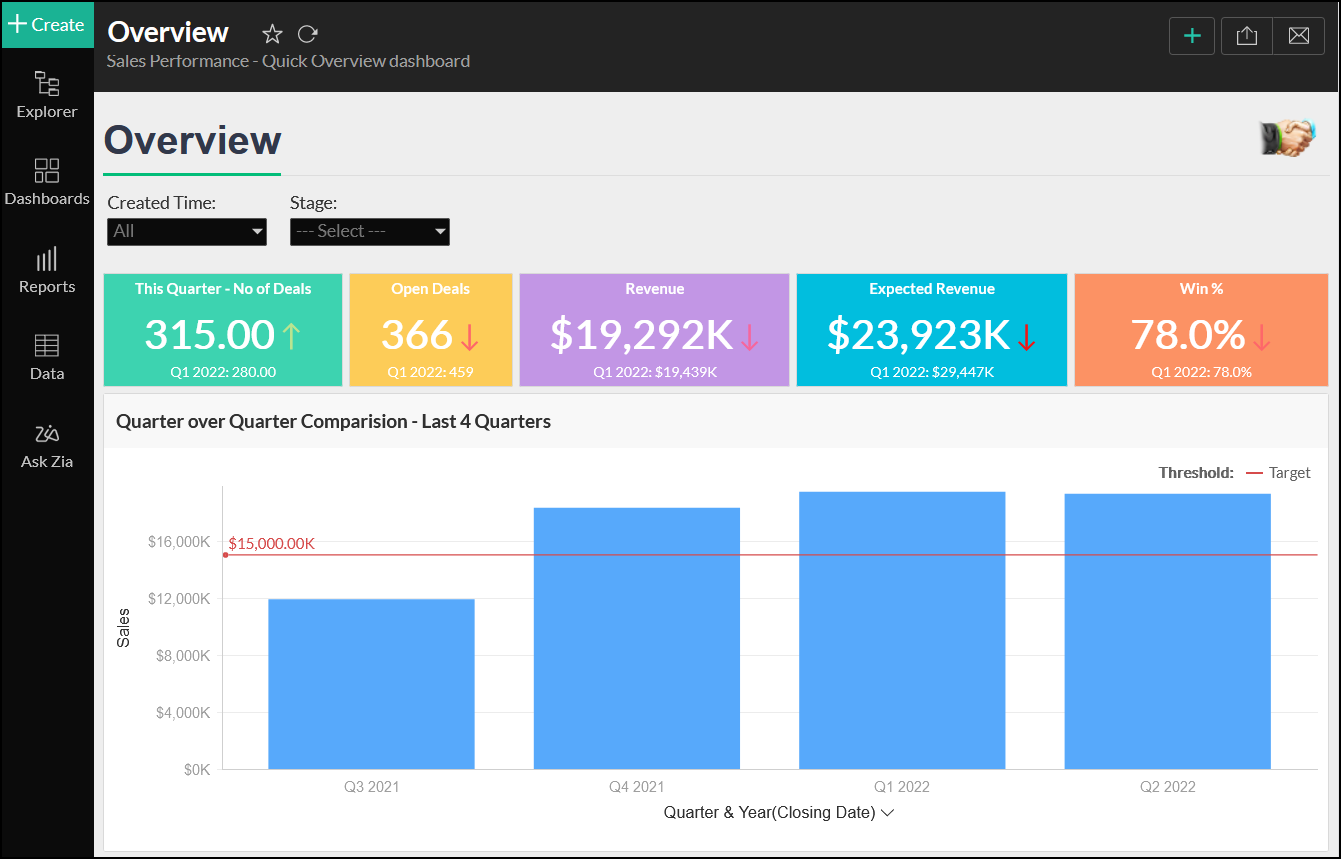
13. Zoho CRM
Advanced analytics for Zoho CRM enables you to perform in-depth analysis of your Zoho CRM data easily and keep track of vital metrics. Click here to learn more.
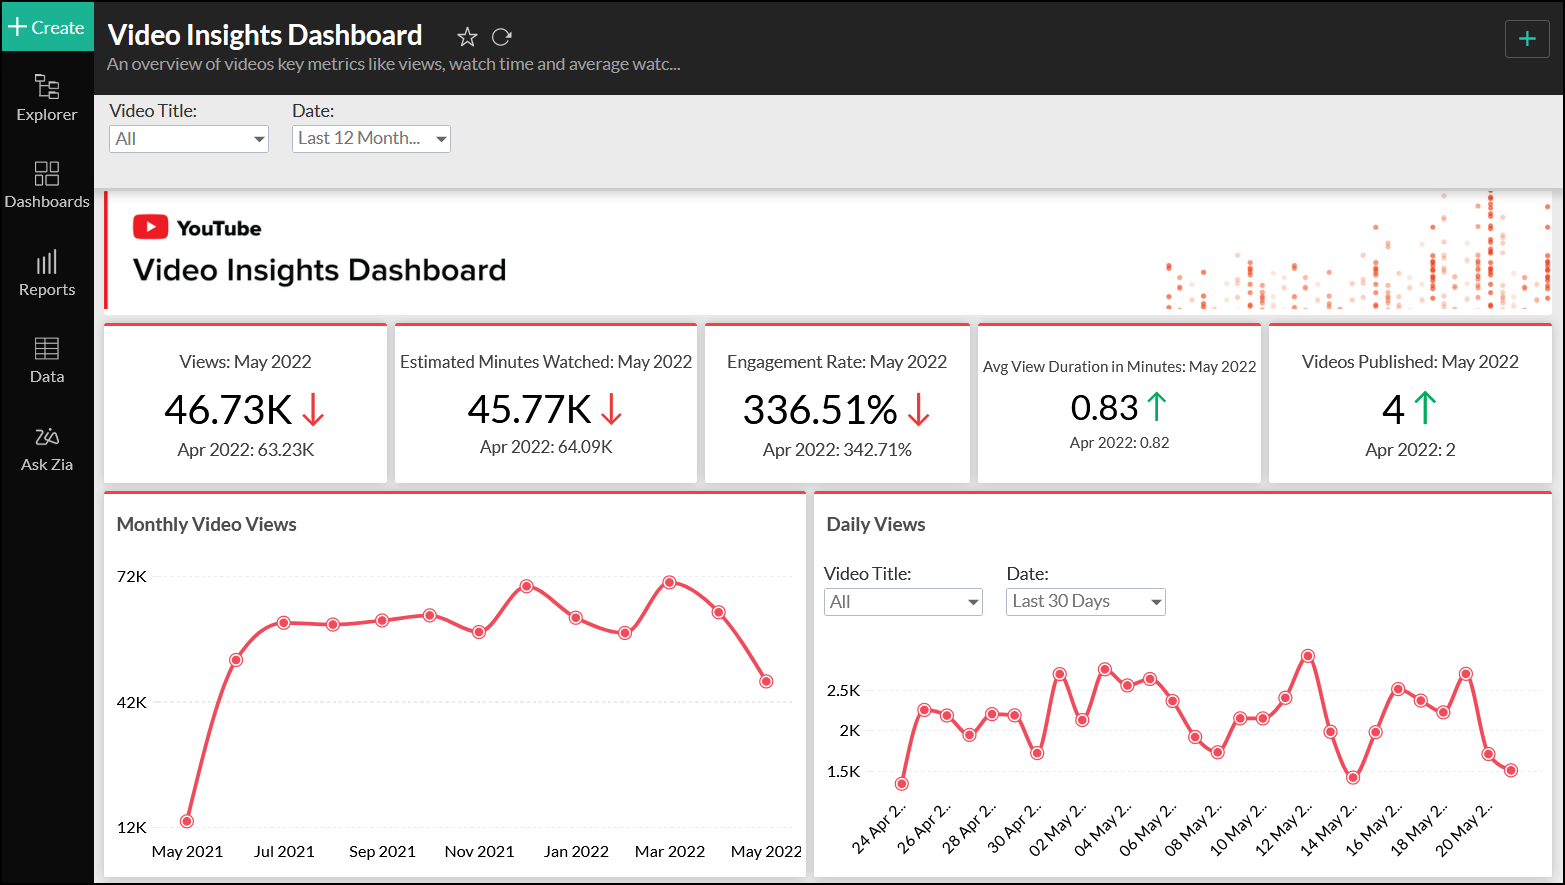
14. YouTube
With advanced analytics for YouTube, you can easily analyze your YouTube data and gain vital insights on key social media metrics. Click here to learn more.
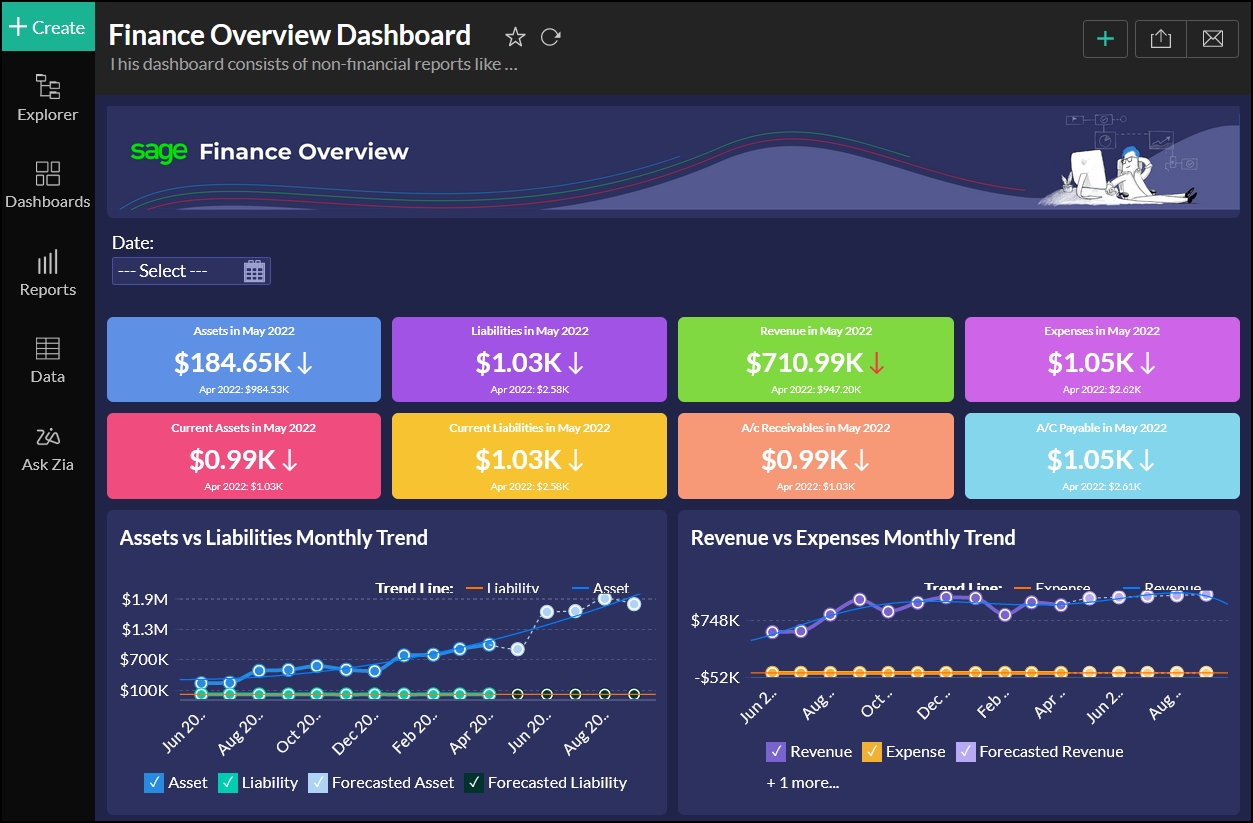
15. Sage Accounting
Analytics Plus now integrates with Sage Accounting and allows you to easily track, analyze and draw crucial insights from your financial data. Click here to learn more.
16. Exact Online
Analytics Plus integrates with Exact Online and enables you to analyze your accounting data easily and keep track of key metrics. Click here to learn more.
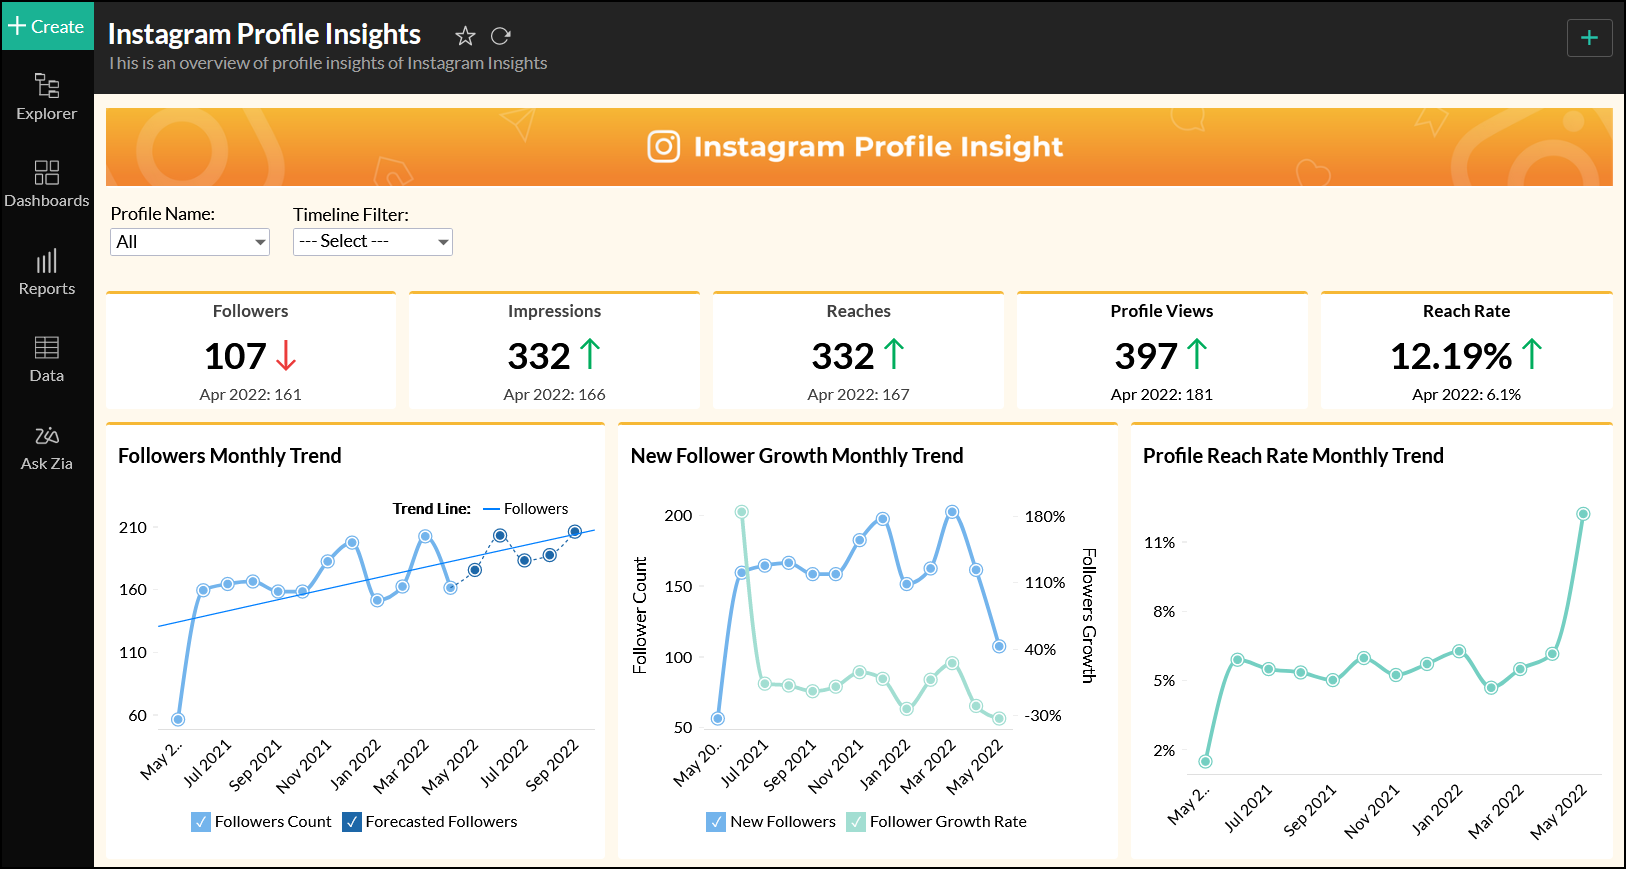
17. Instagram
Analytics Plus seamlessly integrates with Instagram, and enables you to analyze your account's performance and user traction easily. Click here to learn more.
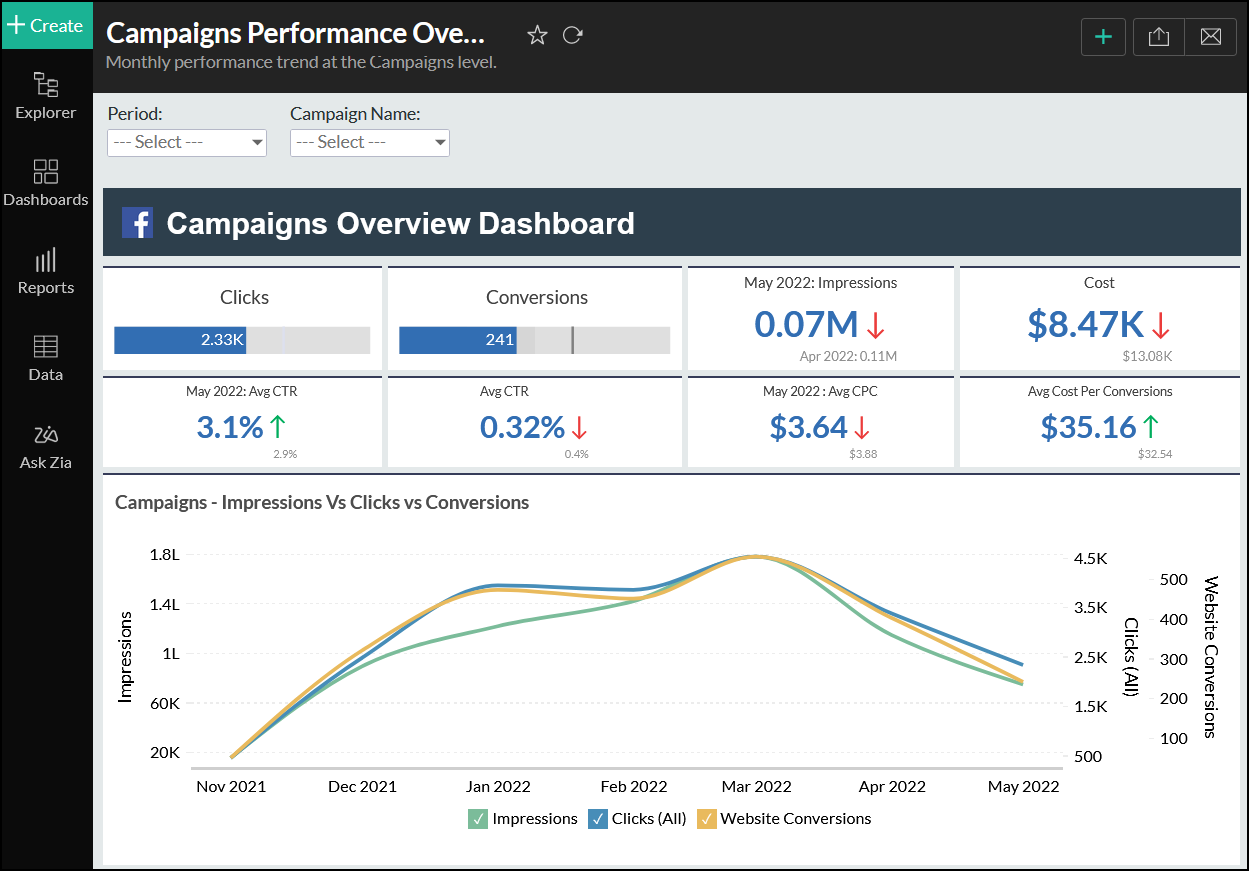
18. Facebook Ads
Analytics Plus now integrates with Facebook Ads, providing an in-depth analysis of your Facebook Ad campaign data. Click here to learn more.
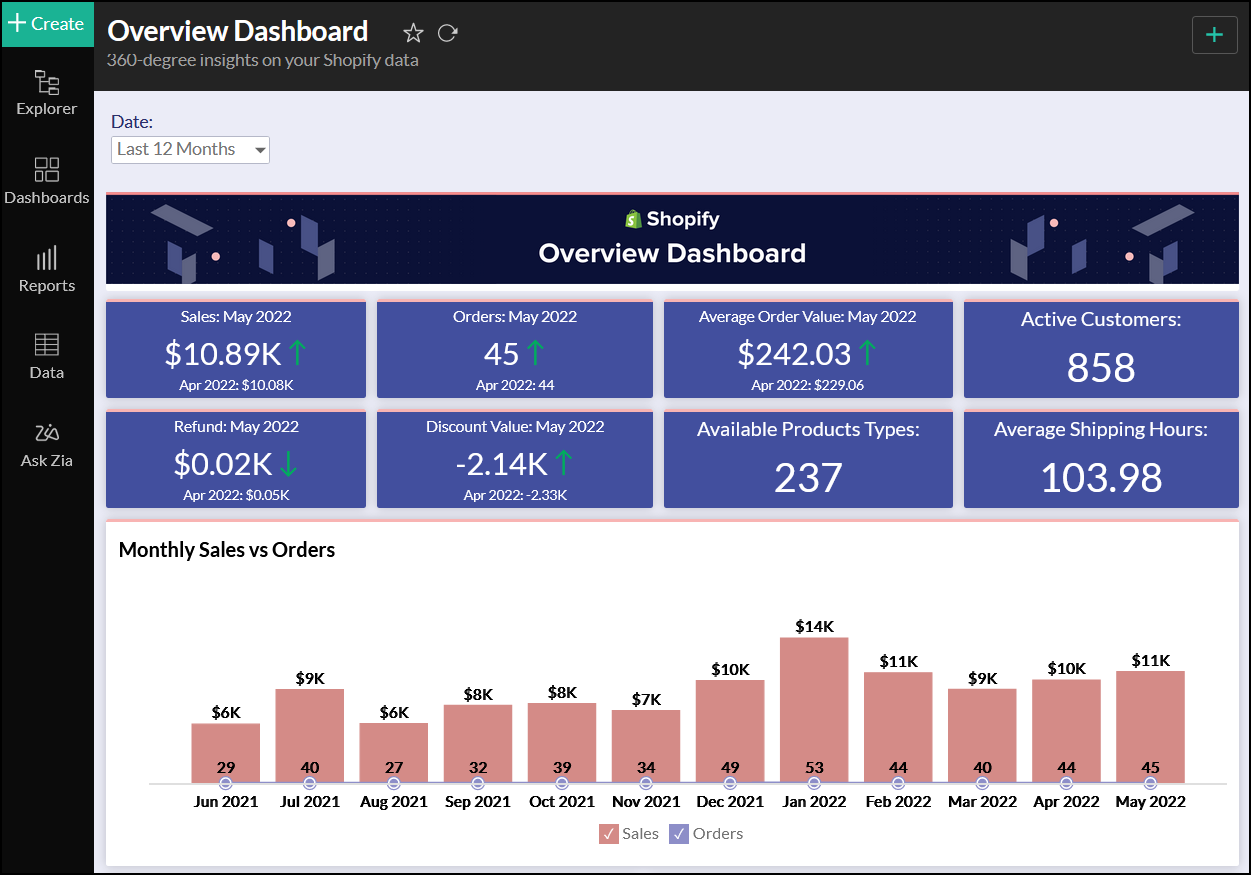
19. Shopify
Analytics Plus now integrates out-of-the-box with Shopify, providing actionable and detailed insights on your e-commerce data. Click here to learn more.
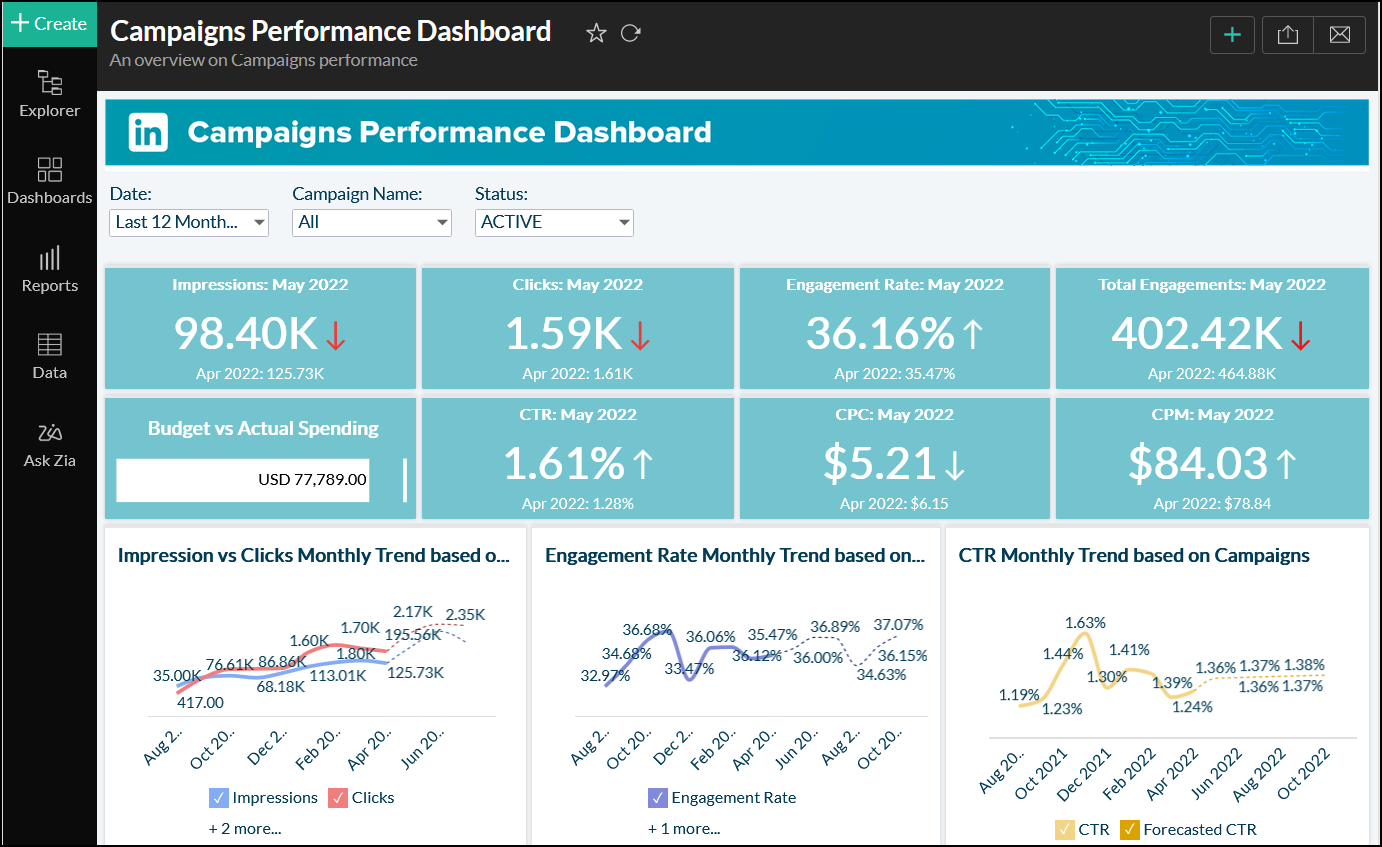
20. LinkedIn Ads
Analytics Plus seamlessly integrates with LinkedIn Ads, and provides intuitive reports and dashboards that equip you with the insights required to create more engaging content and make better marketing decisions. Click here to learn more.
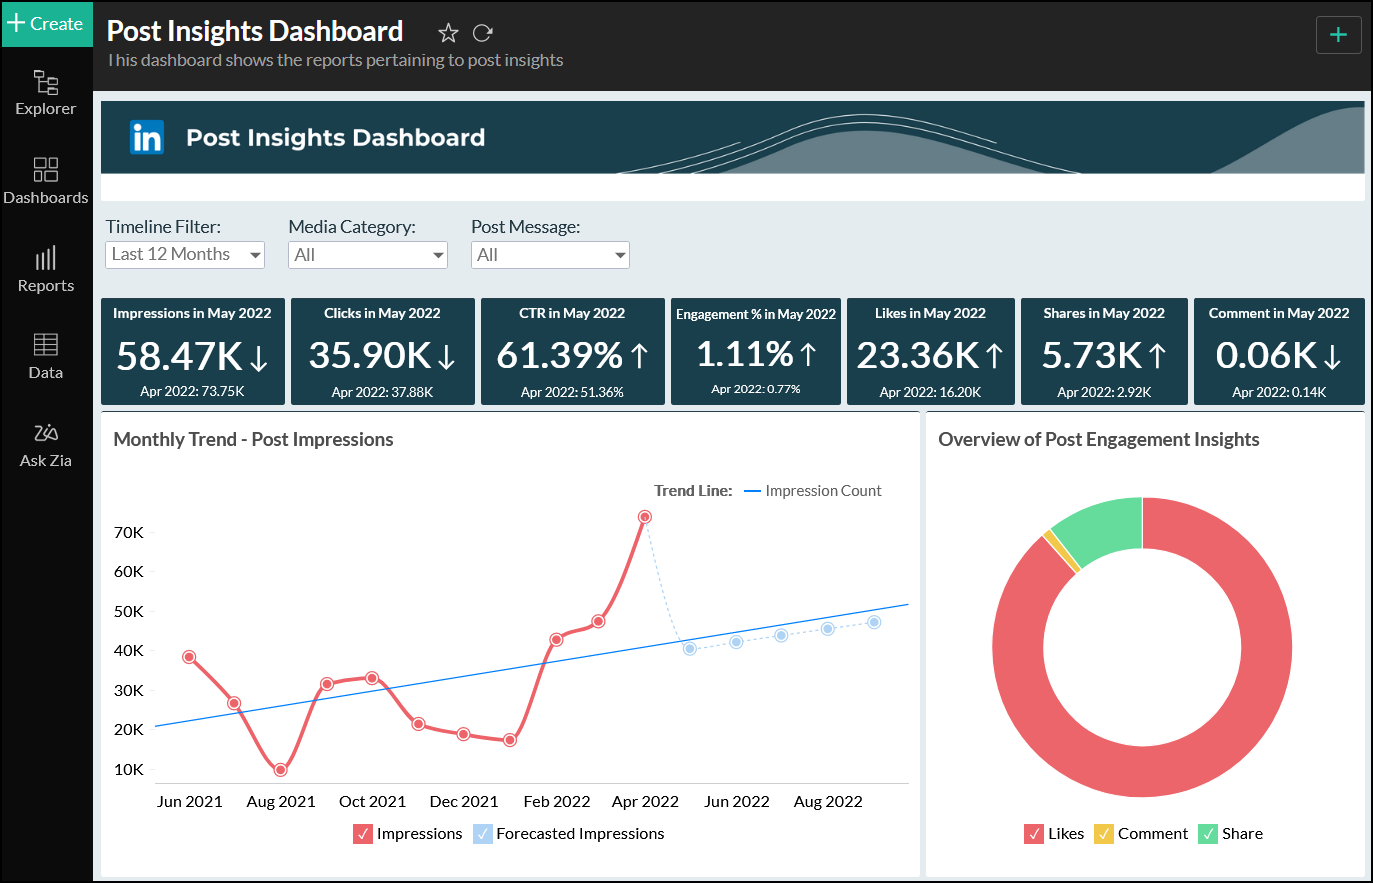
21. LinkedIn Pages
Analytics Plus now offers out-of-the-box analytics for LinkedIn Pages and enables you to track page performance, analyze page activities, and gain deeper insight into LinkedIn Page engagements. Click here to learn more.
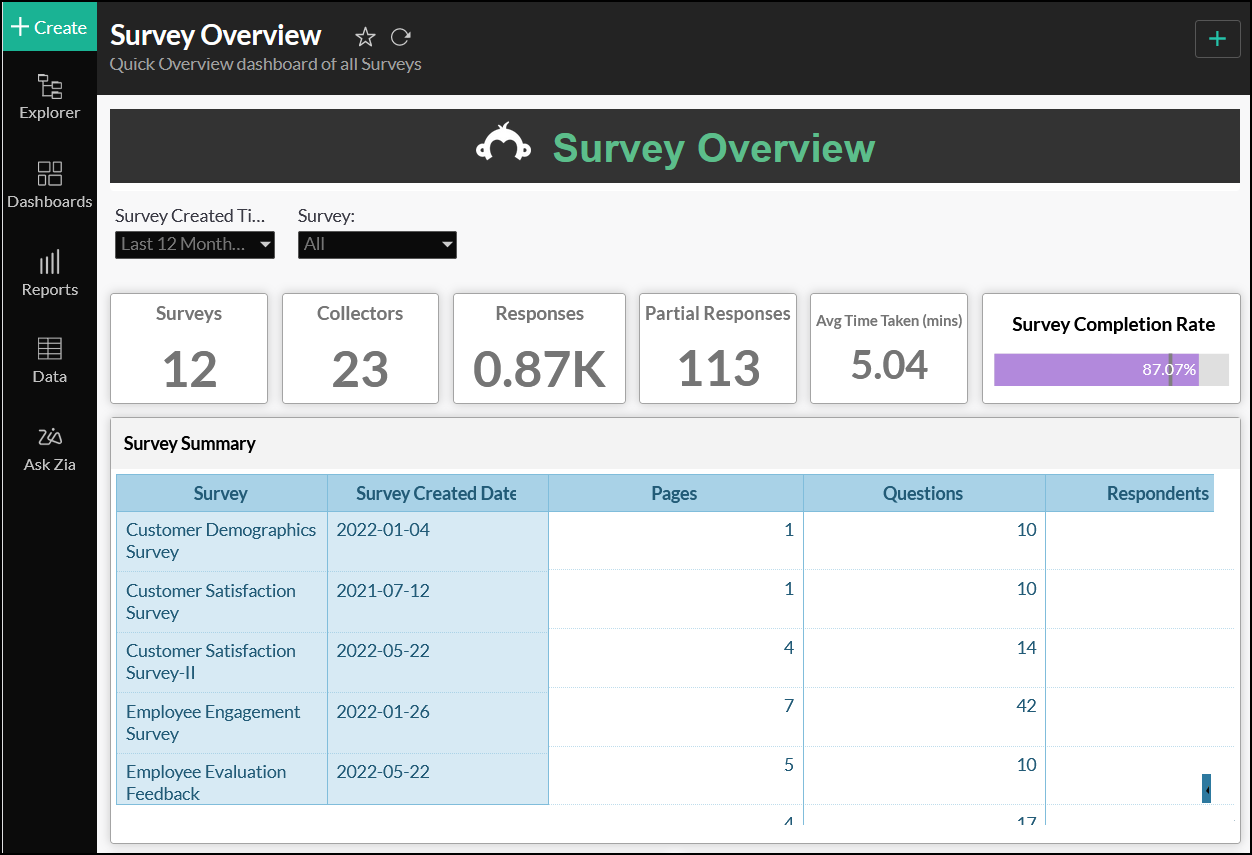
22. SurveyMonkey
Analytics Plus seamlessly integrates with SurveyMonkey, and enables businesses to efficiently summarize, analyze and draw insights from survey data. Click here to learn more.
23. Zoho Creator
Analytics Plus offers out-of-box integrations with Zoho Creator Cloud and On-Premise, and enables you to easily analyze your Zoho Creator data and create insightful reports and dashboards. Click here to learn more.
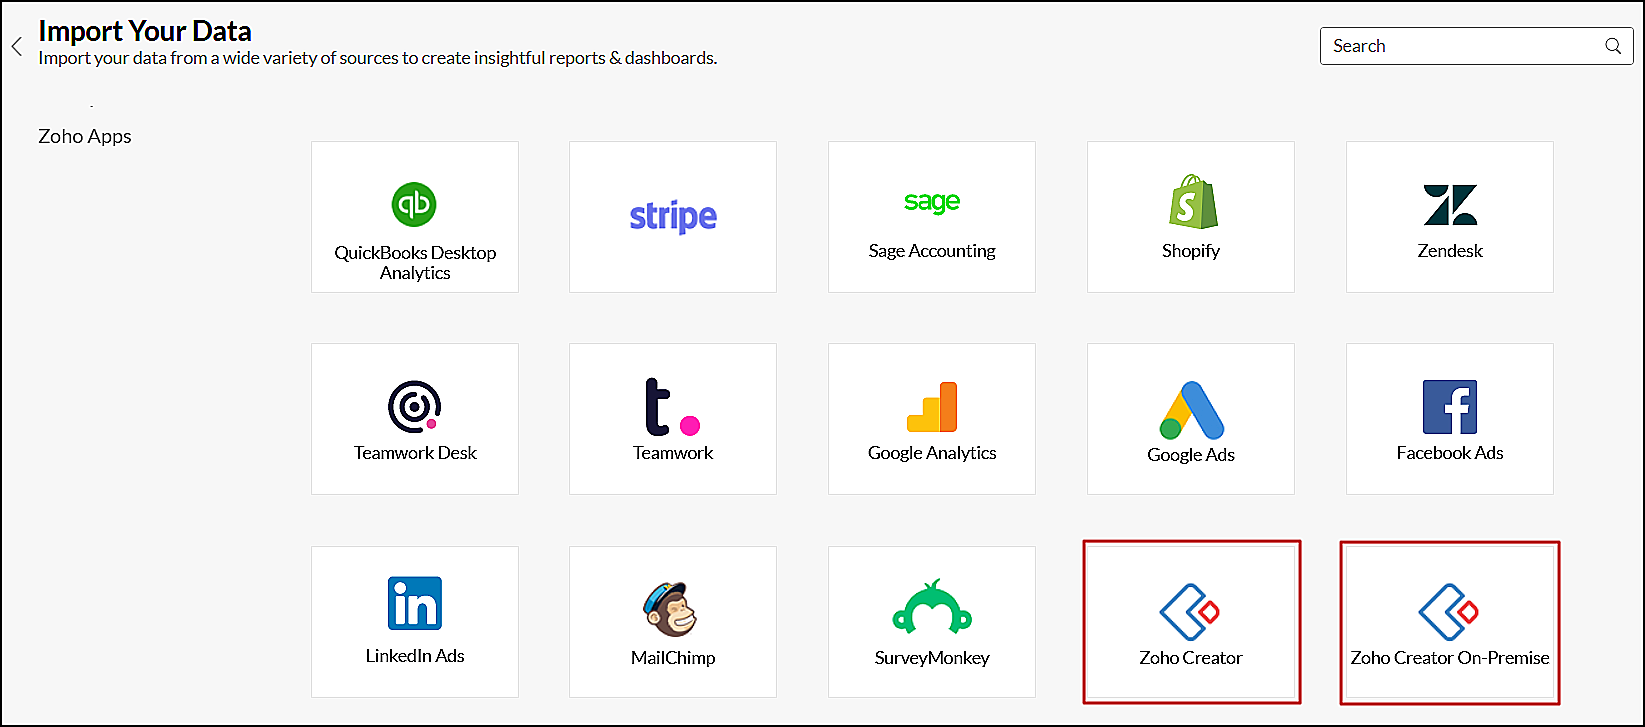
24. Zoho Data Prep
Analytics Plus seamlessly integrates with Zoho DataPrep and allows you to easily analyze the data that has been cleansed, transformed, and enriched in Zoho DataPrep. Click here to learn more.
April
Build Number: 5110 (Release on: April 14, 2022)
Launching advanced analytics for asset and survey modules in ServiceDesk Plus MSP
NewIntroducing support for asset and survey modules in ServiceDesk Plus MSP. Users should be on ServiceDeskPlus MSP build 10600 or above to view the respective reports. Click here to learn more.
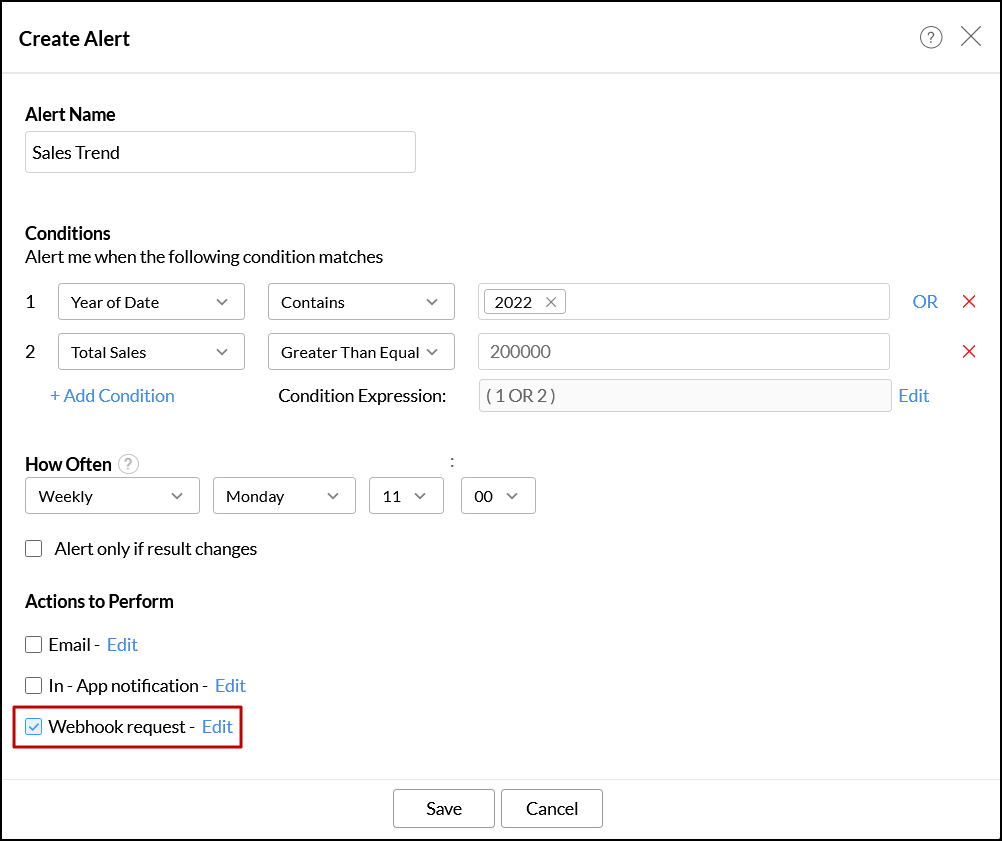
Introducing webhooks for data alerts
NewYou can now leverage webhooks to trigger alert notifications or custom workflows when data alert conditions are met. Click here to learn more.
Retain source workspace's column data type
EnhancementWhile importing data from other Analytics Plus workspaces, the columns' data type will also be retained as in the source workspace.
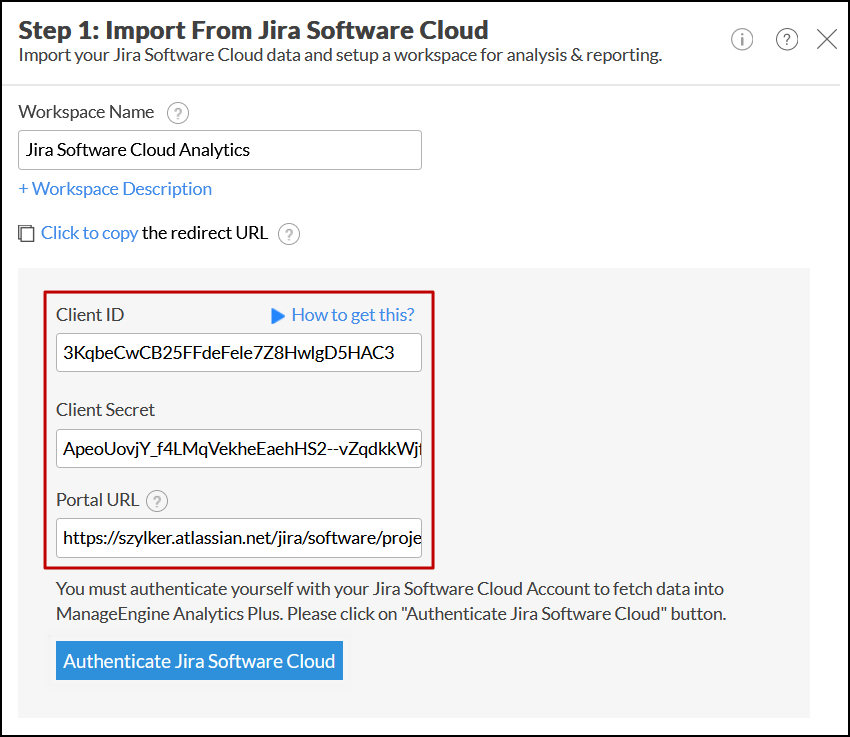
Updated Jira Software Cloud authentication process
EnhancementThe authentication mechanism for Jira Software Cloud has been changed from being key based to OAuth mode. Click here to learn more.
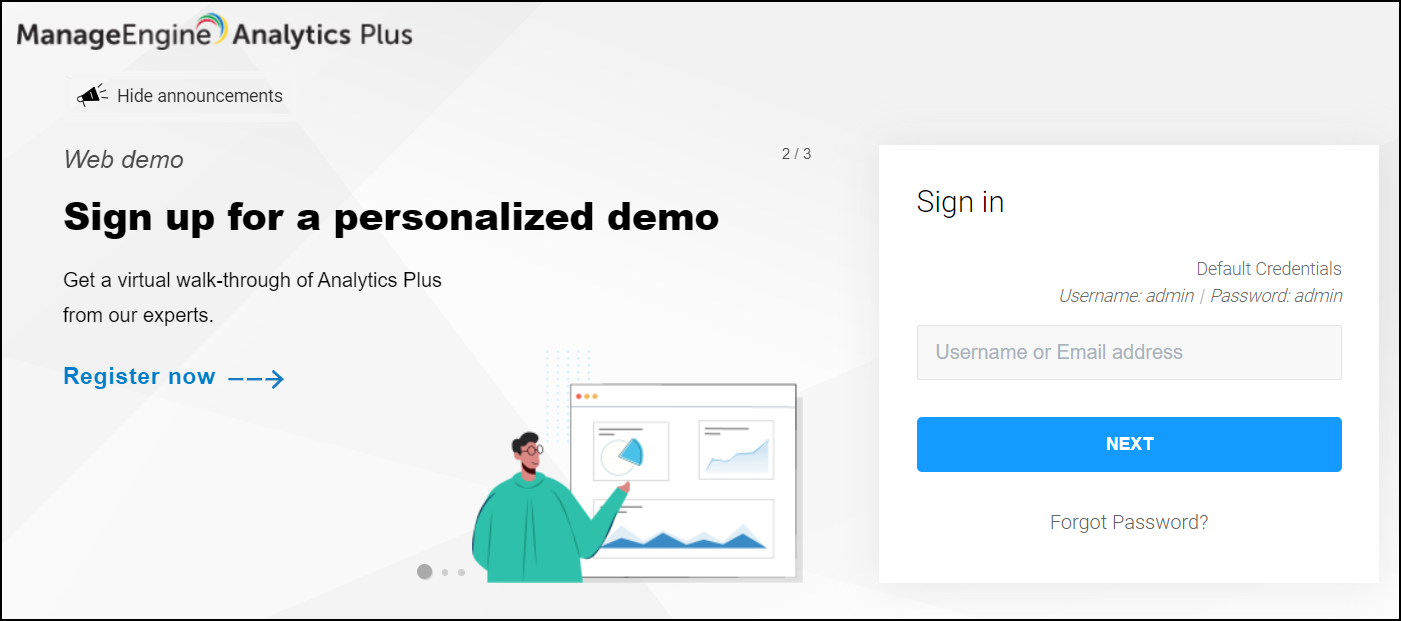
Revamped Analytics Plus login page
EnhancementAnalytics Plus' login page has been revamped to display product-related announcements. Click here to learn more.
March
Build Number: 5100 (Release on: March 22, 2022)
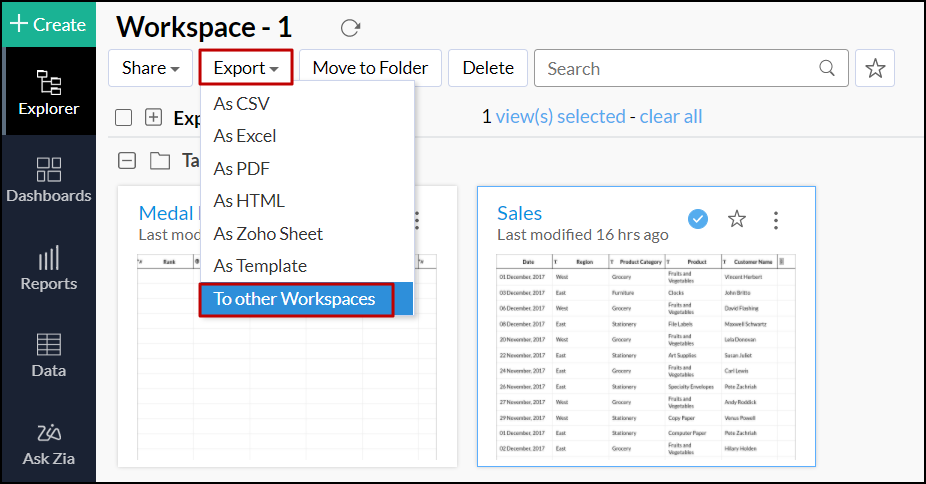
Export views to other workspaces
NewAnalytics Plus now allows you to easily export reports, dashboards and tables from one workspace to another within the same installation. Click here to learn more.
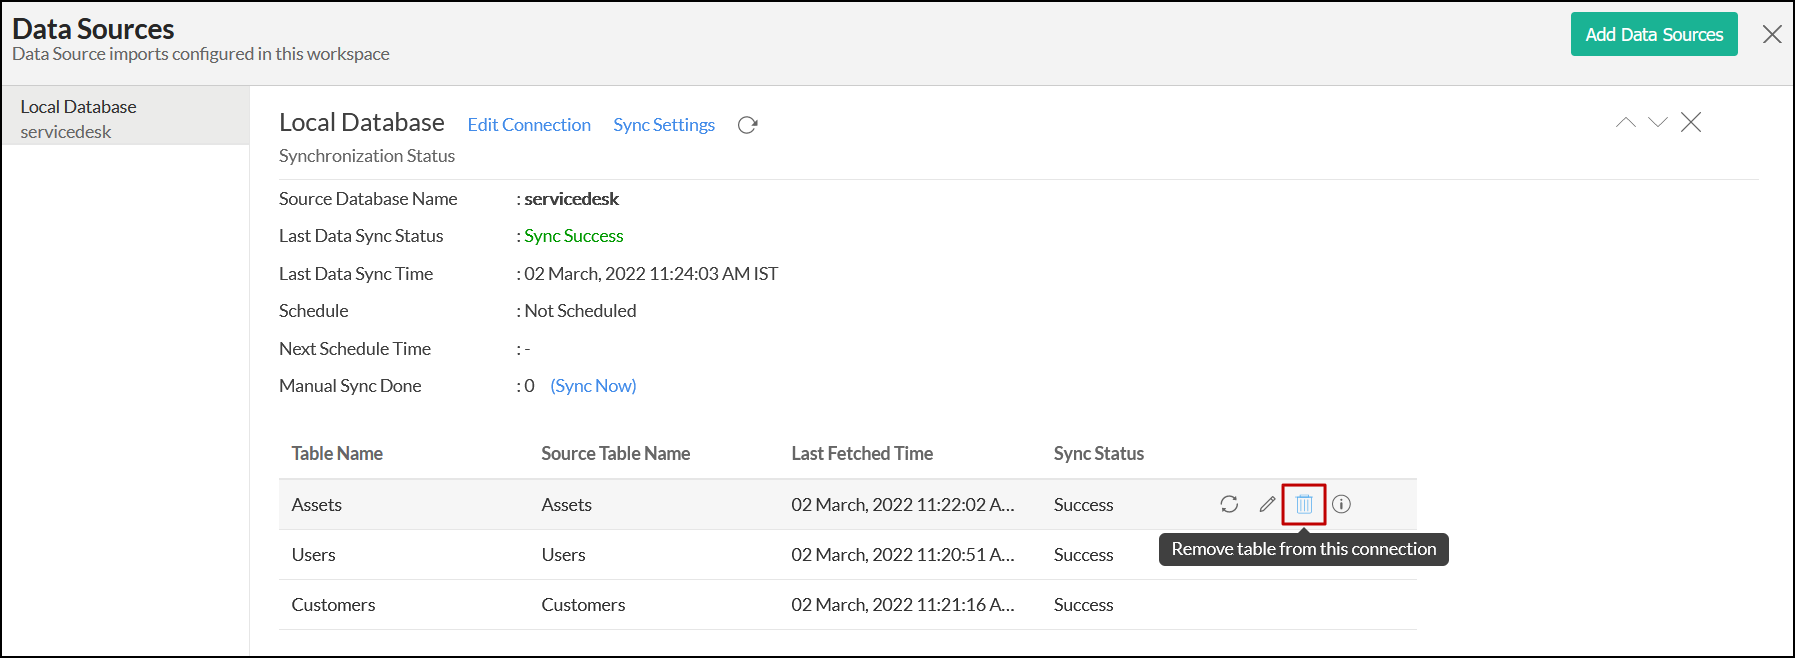
Remove a table's data source
EnhancementYou can now remove an individual table's data source, to stop the table from updating new data from the source. Click here to learn more.
Sync meta data changes instantly
EnhancementYou can instantly reflect the source database's meta data changes to individual tables in Analytics Plus easily. This is only applicable for data imported using live connections. Click here to learn more.
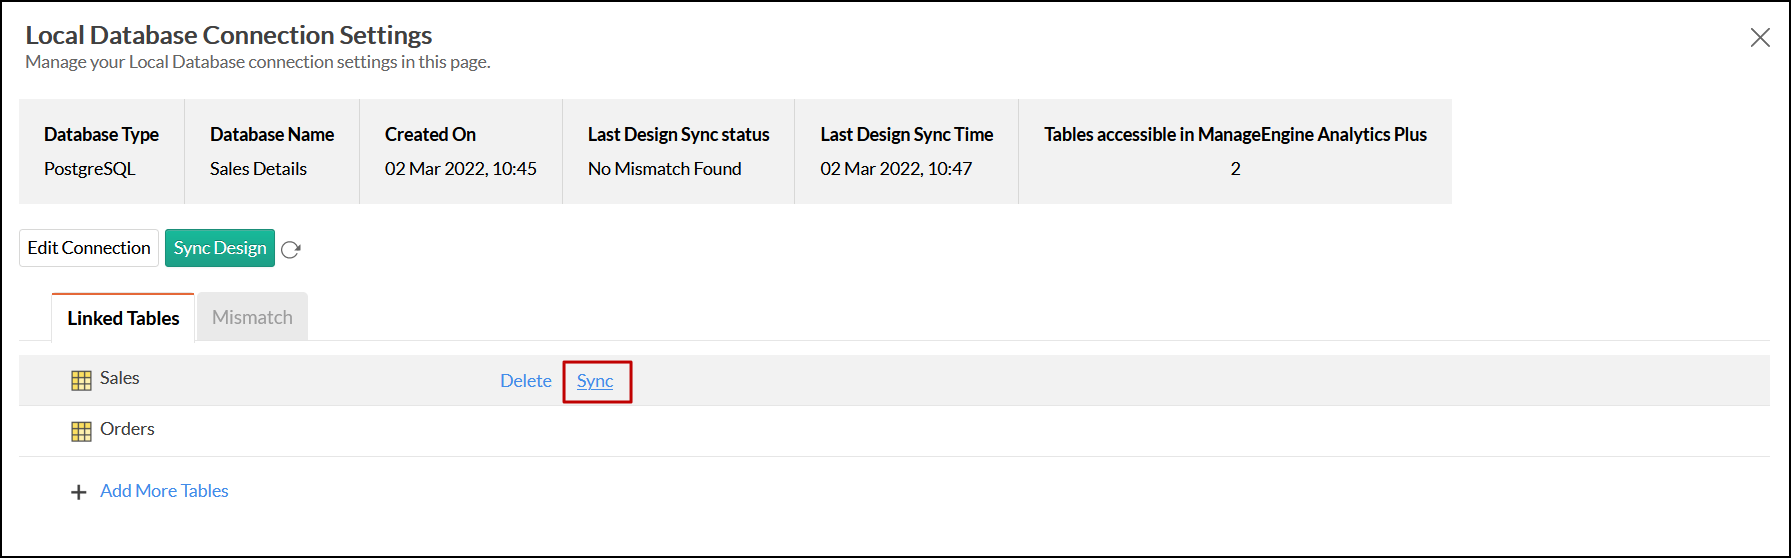
Introducing support for Tabular functions in query tables
NewQuery tables now support Tabular functions such as Rank and Row Number that compares values across rows.
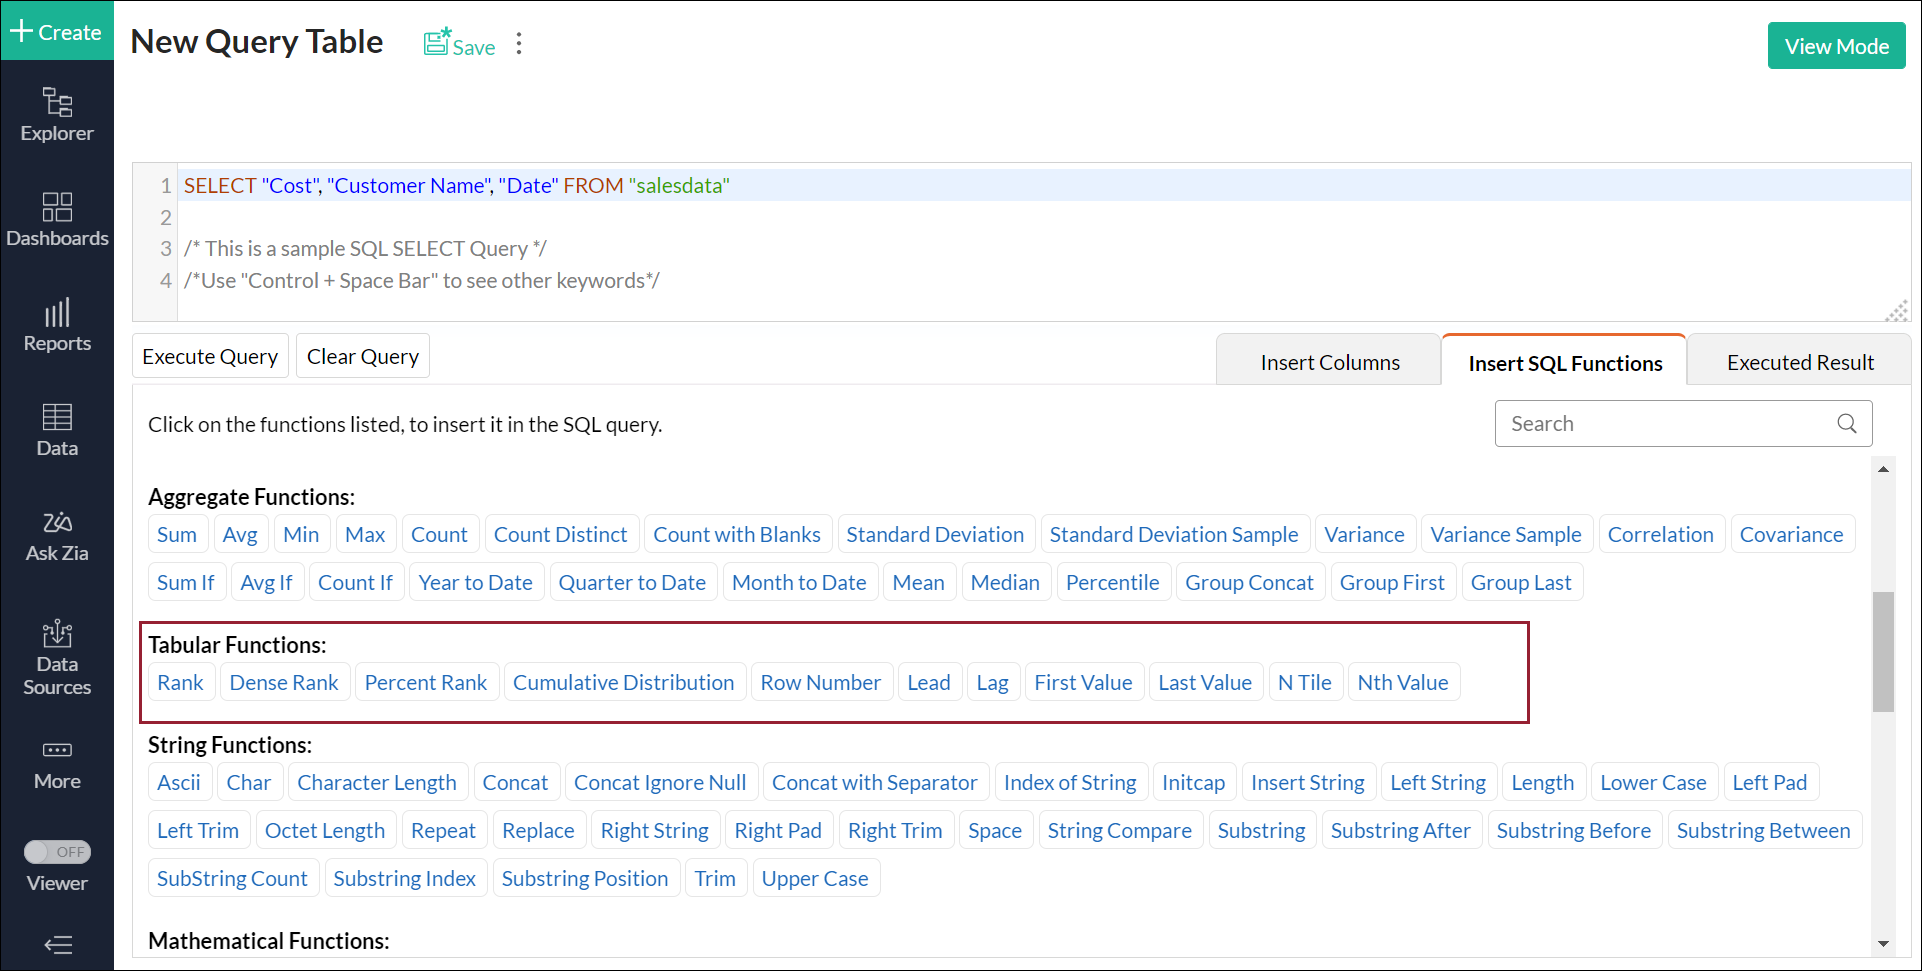
Support for AND/OR logical operators in data alerts
EnhancementYou can leverage AND and OR logical operators while creating data alerts. Click here to learn more.
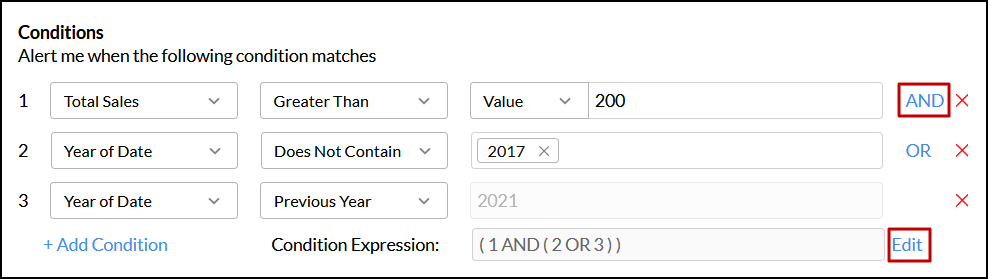
Enhanced custom sort interface
EnhancementThe custom sort option in reports has been revamped to enhance user experience.
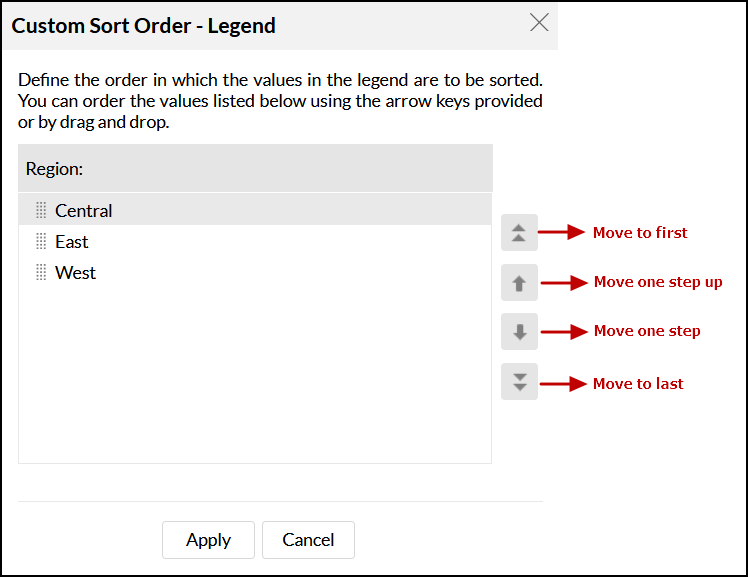
Feb
Build Number: 5090 (Release on: February 21, 2022)
Configure multi-factor authentication
NewAnalytics Plus users can now configure multi-factor authentication for enhanced security. Click here to learn more.
Modifications to the Annual Maintenance and Support license format
EnhancementAnalytics Plus is moving to an xml-based Annual Maintenance and Support (AMS) license format that allows for notifications before AMS expiration. Click here to learn more.
Jan
Build Number: 5080 (Release on: January 25, 2022)
Support for single sign-on with ServiceDesk Plus
NewThis release includes functionality that will allow single sign-on to be configured with ManageEngine ServiceDesk Plus.
Note: To enable single sign-on, ServiceDesk Plus users should be on build 13000 or above.
Enhancements
EnhancementAnalytics Plus administrators will now be notified to reset the default application password for enhanced security.
2021
Dec
Build Number: 5070 (Release on: December 21, 2021)
Issues fixed
Issues fixed- The recently disclosed Apache Log4j vulnerabilities (CVE-2021-45046, CVE-2021-44228 and CVE-2021-45105) have been addressed in this release.
Dec
Build Number: 5060 (Release on: December 09, 2021)
Apply multiple user filters simultaneously
EnhancementYou can now choose to apply multiple user filters simultaneously in a dashboard. Click here to learn more.
Choose the required data center
EnhancementYou can now choose the data center associated to your ManageEngine ServiceDesk Plus Cloud account while setting up the integration. Click here to learn more.
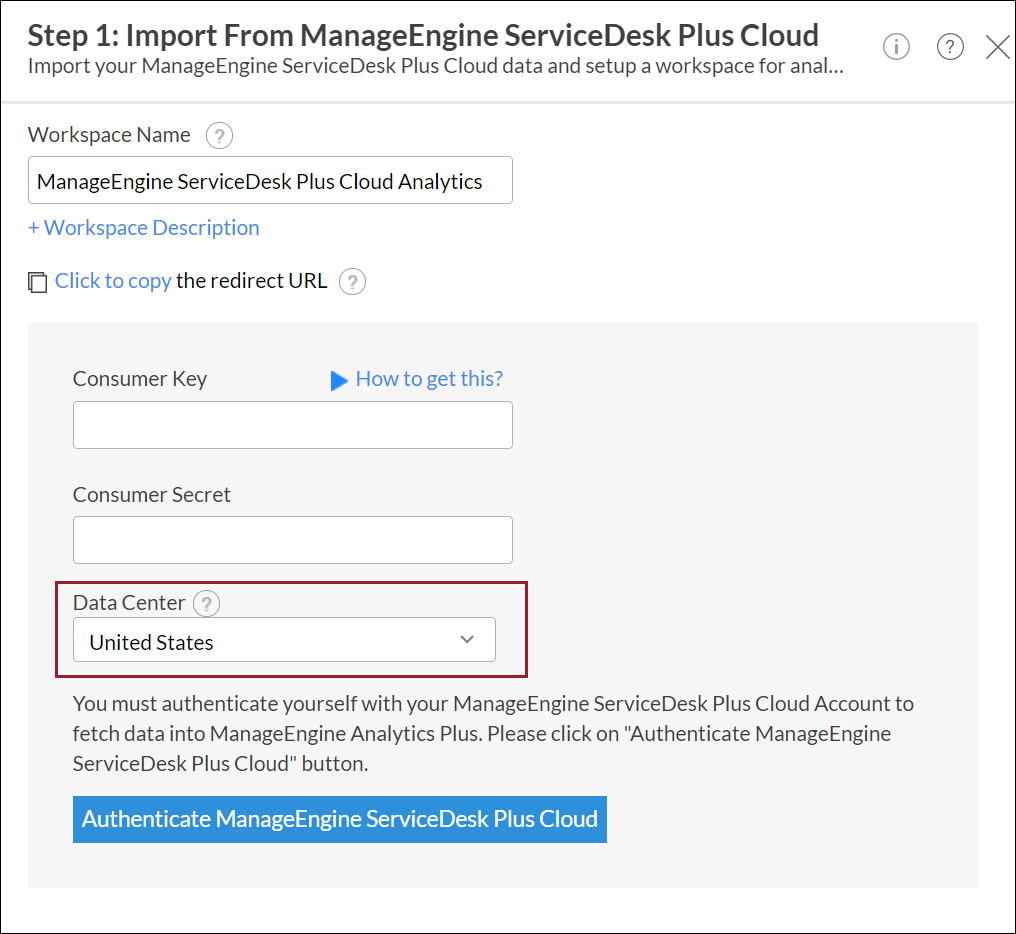
Nov
Build Number: 5050 (Release on: November 03, 2021)
Import data from Google Cloud SQL MS SQL Server
EnhancementYou can now import data from SQL Server hosted in Google Cloud SQL cloud database. Click here to learn more.
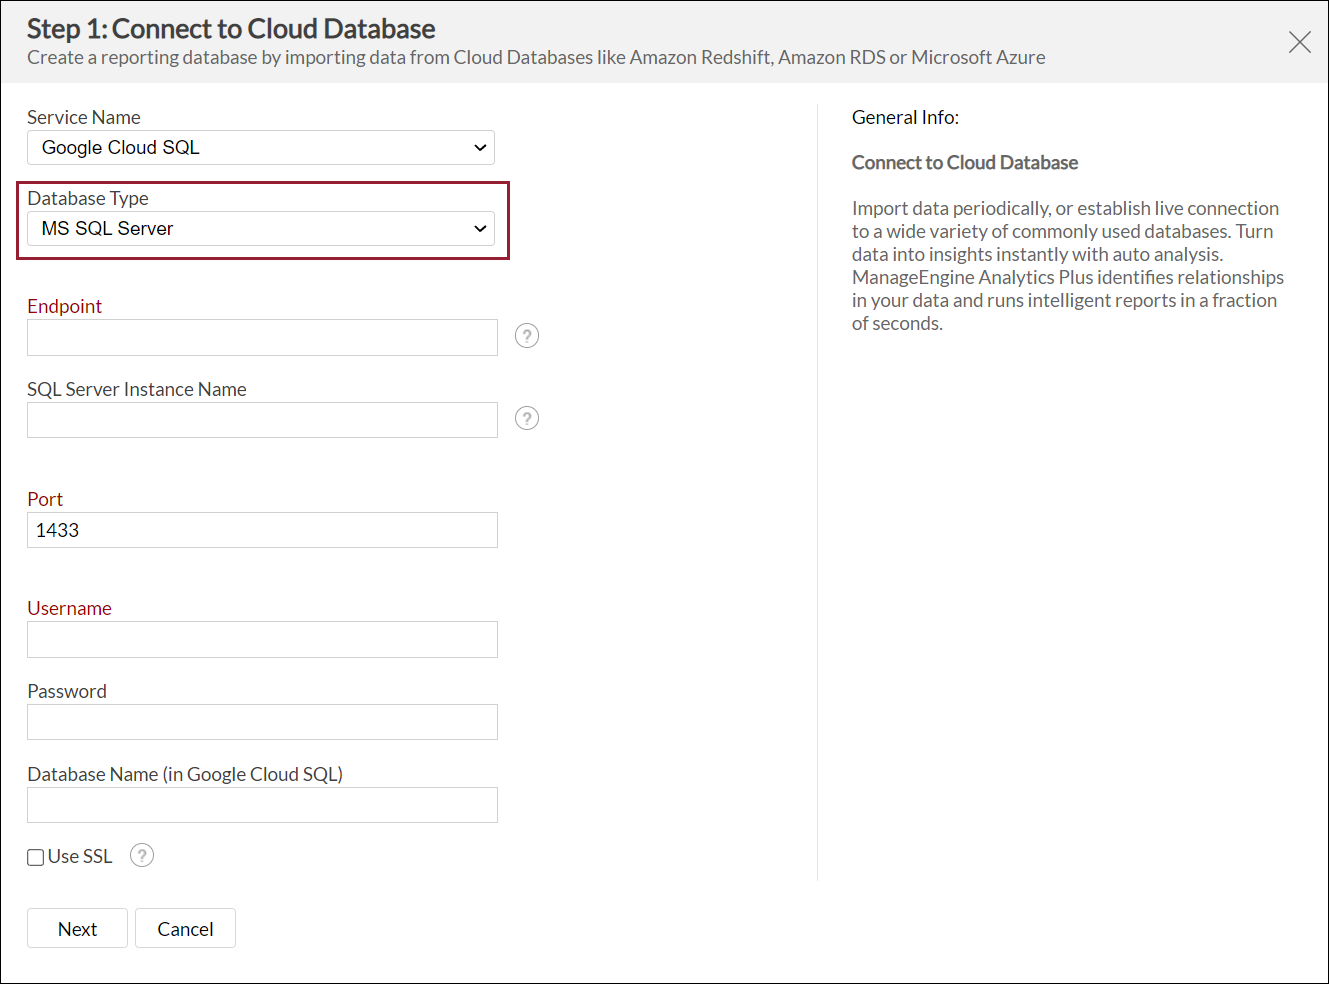
Revamped getting started screens
EnhancementAnalytics Plus' getting started screens have been revamped to enhance the user experience. Click here to learn more.
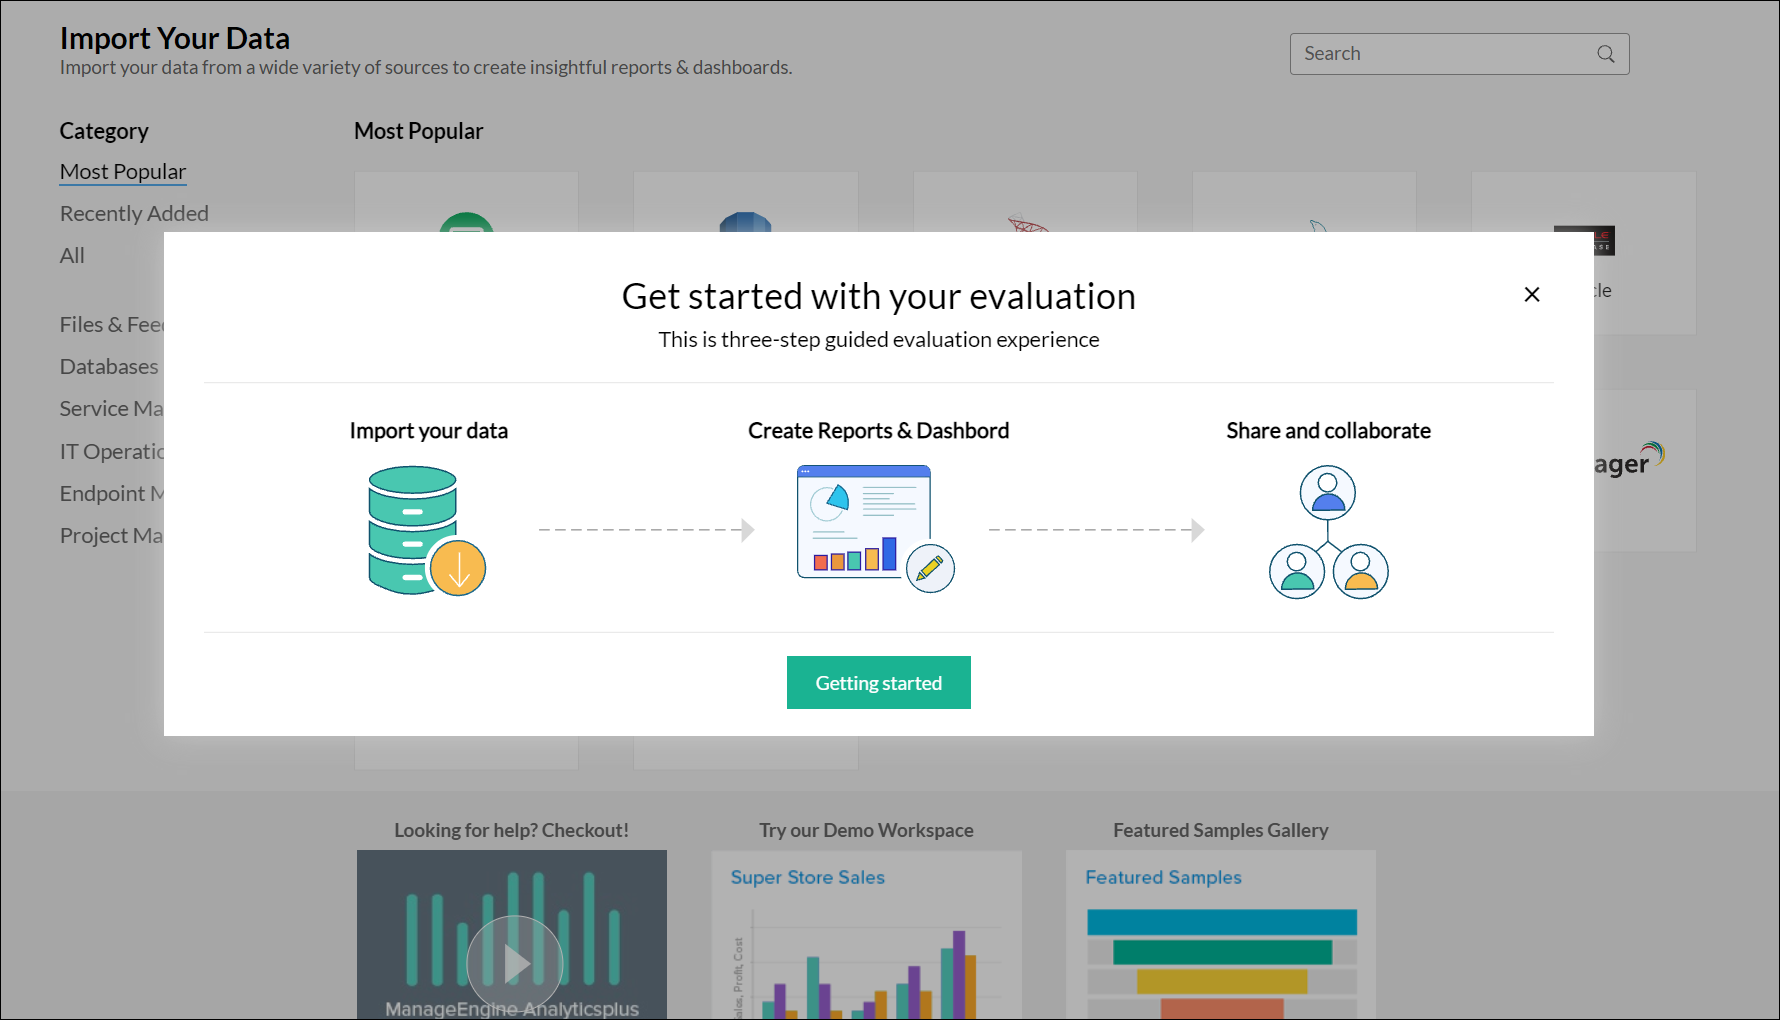
Enhanced forecasting engine
EnhancementYou can choose to generate forecasts for the columns used in a chart's Color shelf. Click here to learn more.
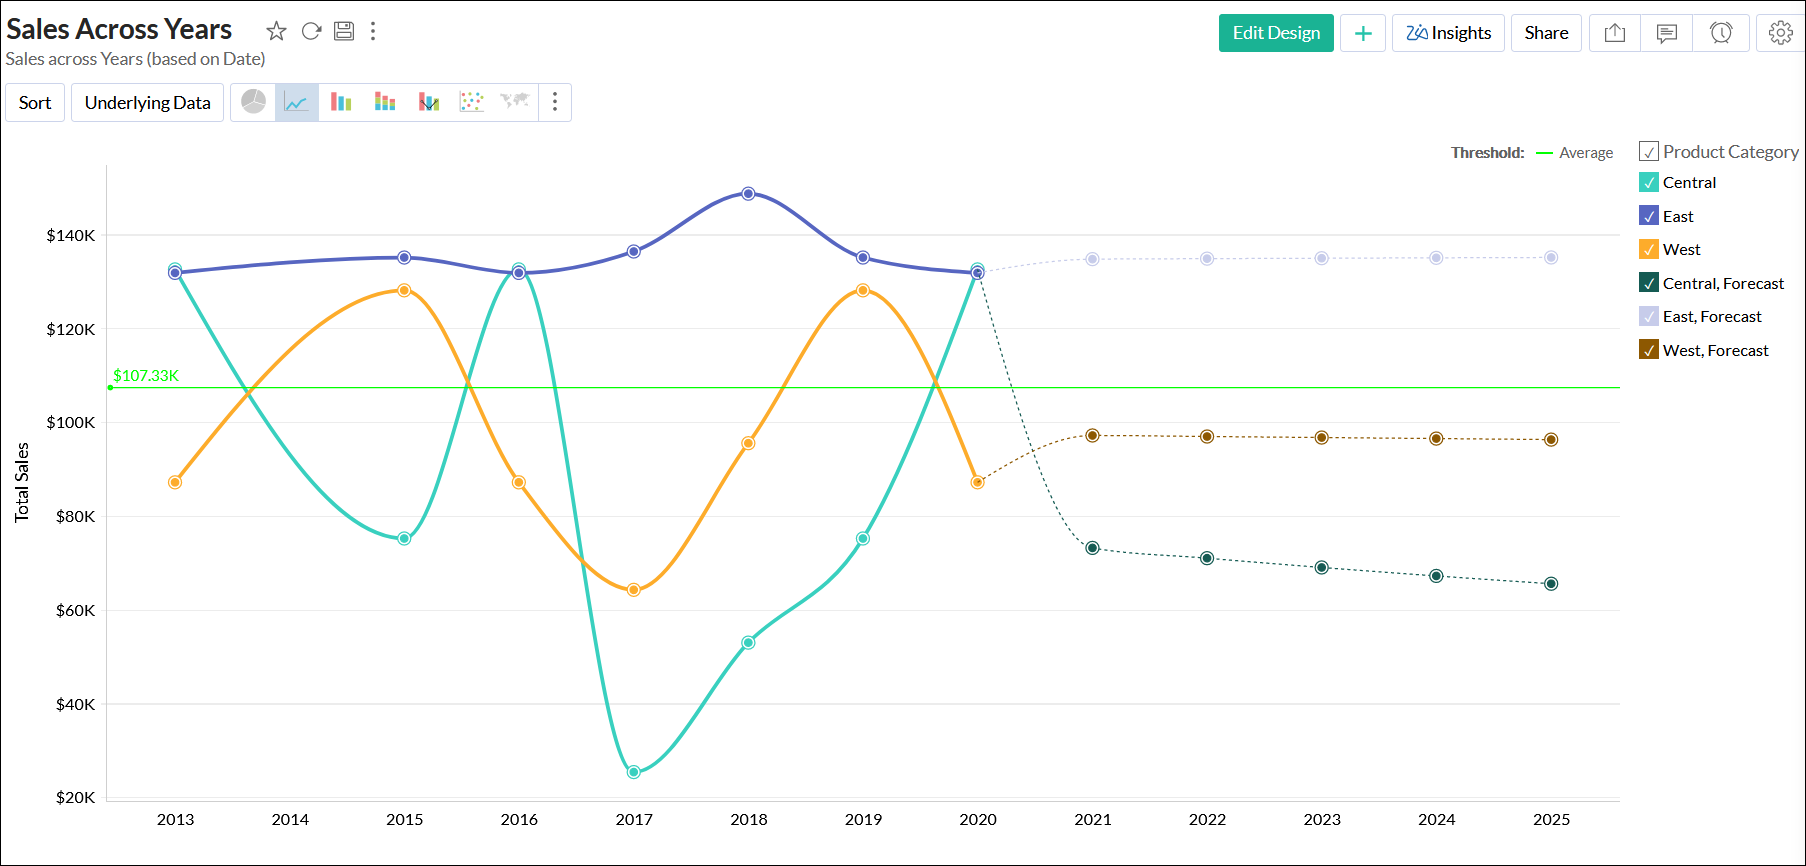
Introducing workspace-level formatting
NewYou can now configure workspace-level formatting options. These configurations will apply to all views in the workspace. Click here to learn more.
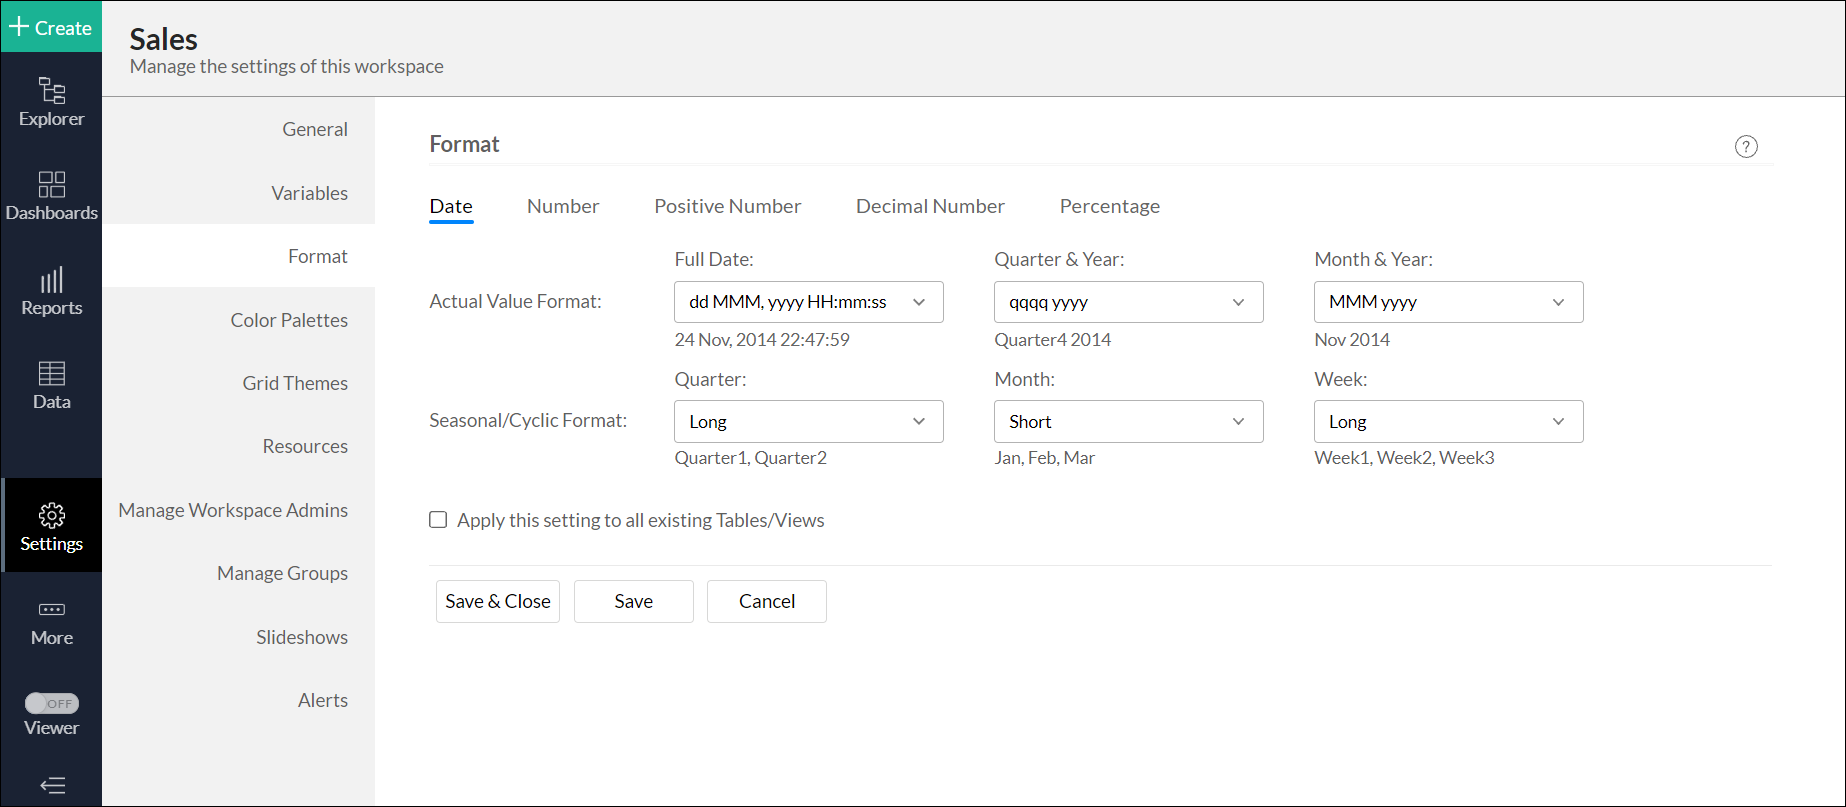
Support for lookup columns in live connections
EnhancementYou can now create lookup columns while importing data using live connections. Click here to learn more.
Introducing new KPI chart type widgets
NewNew KPI chart type widgets have been introduced in Analytics Plus. Click here to learn more.
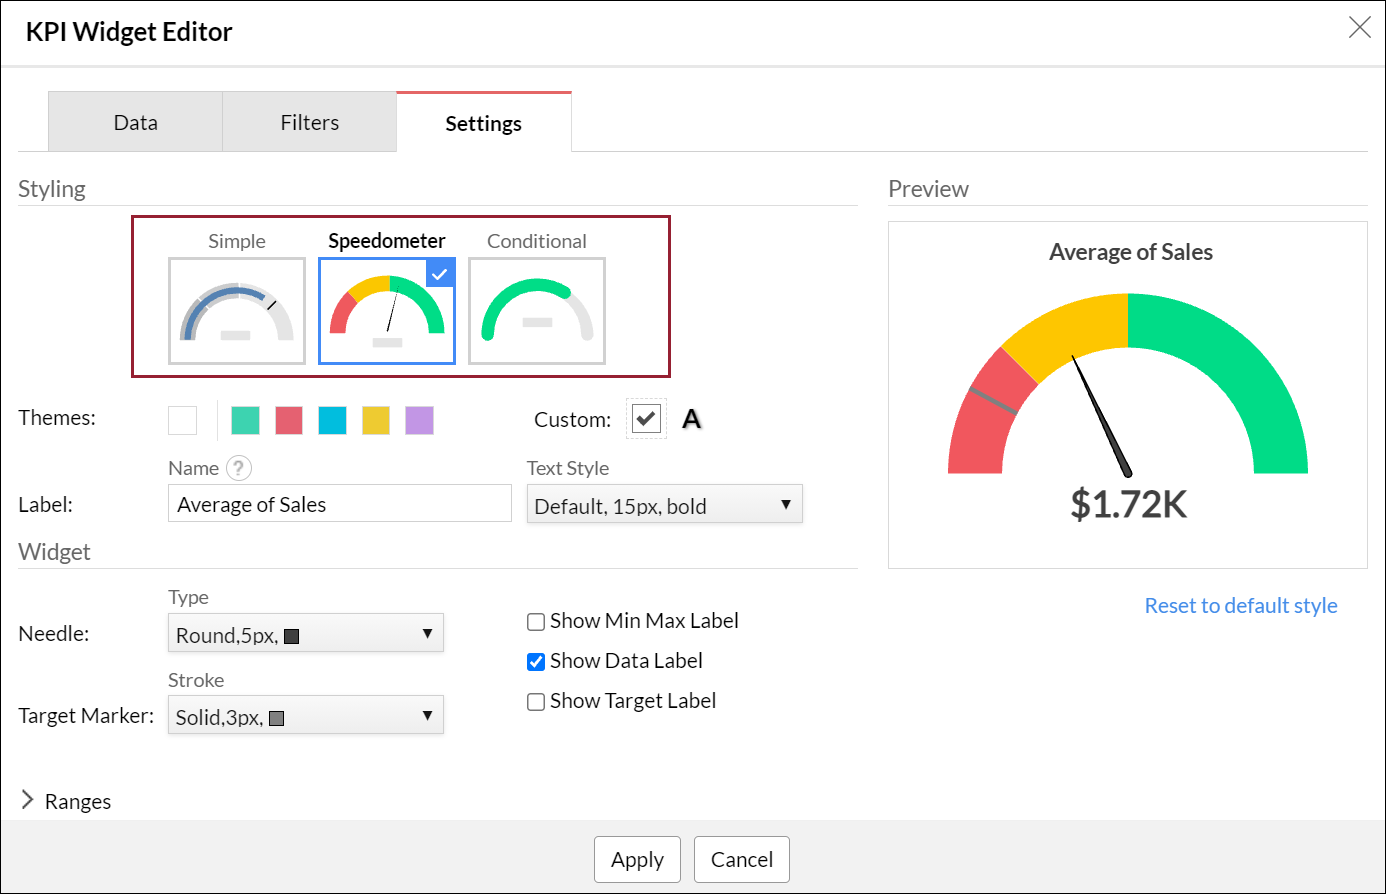
Introducing enhancements in reports
EnhancementThe following enhancements have been made to reports in Analytics Plus:
1. A chart's Edit Design mode displays contextual menu options over columns used in the chart builder (on mouse hover). Click here to learn more.
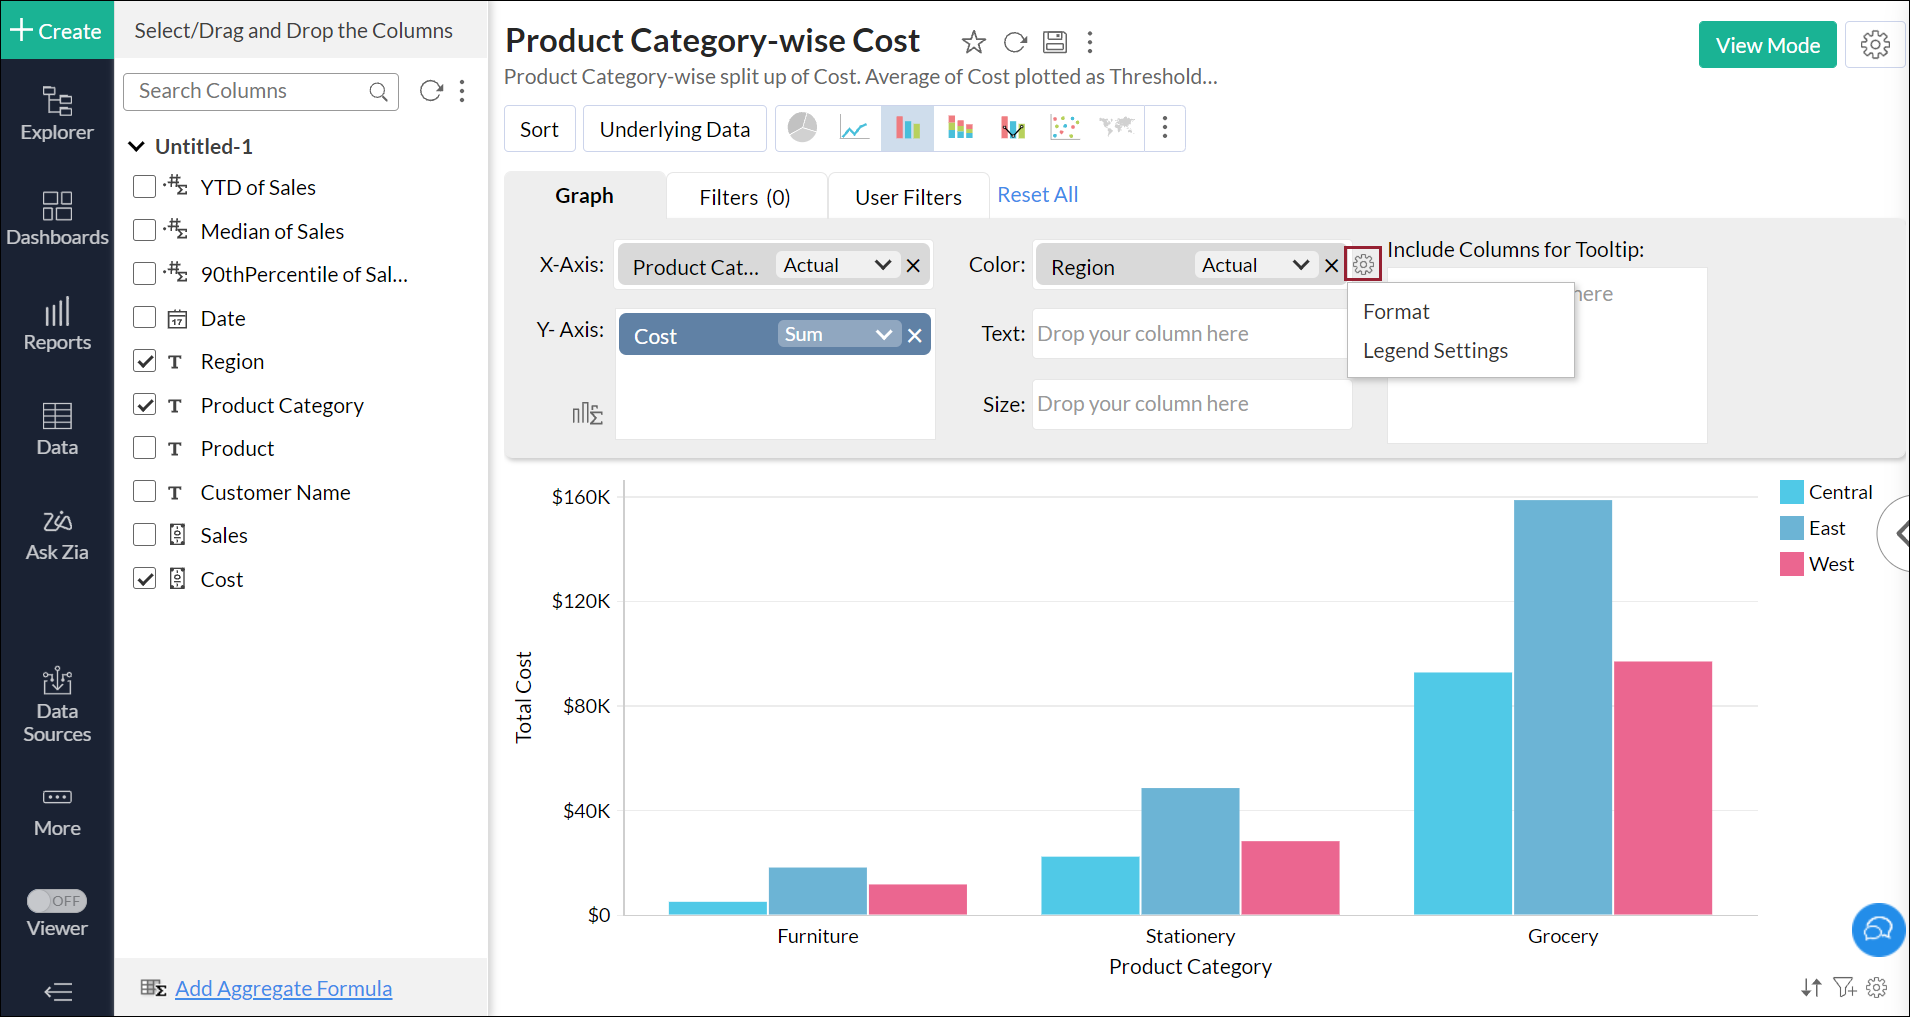
2. You can now display images in the place of text in a chart's axis. Click here to learn more.
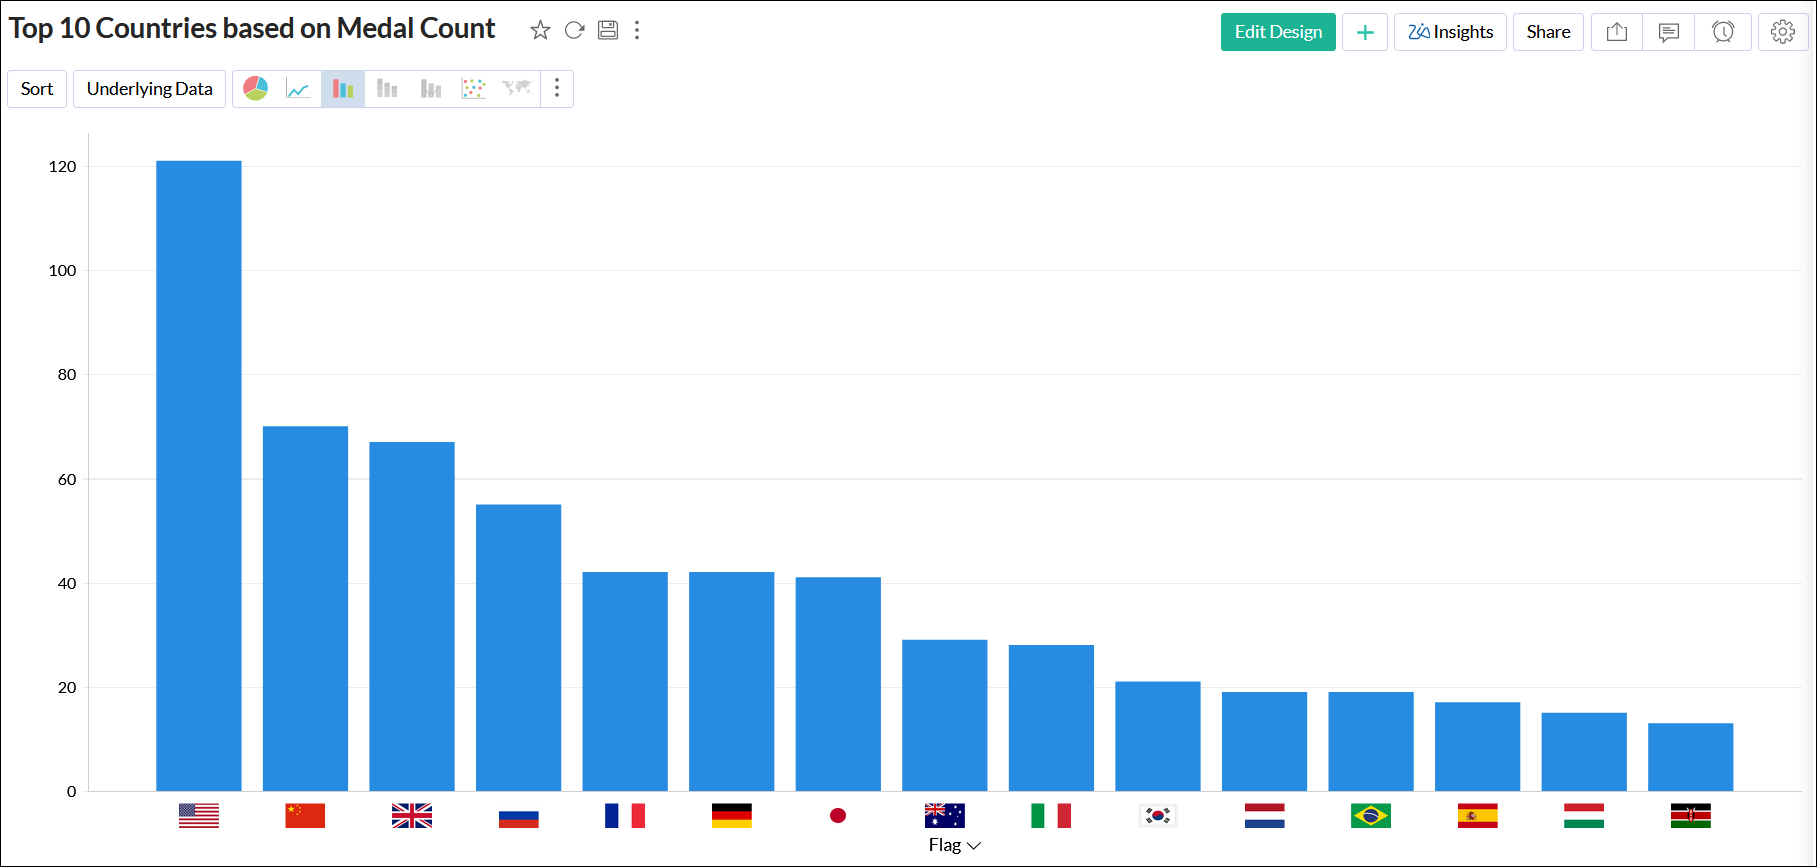
3. The creating a tabular view screen has been revamped for easier navigation.
Oct
Build Number: 5030 (Release on: October 18, 2021)
Introducing audit logs
NewAnalytics Plus administrators can now capture detailed logs on application access and user activity, and access insightful reports and dashboards on the same. Click here to learn more.
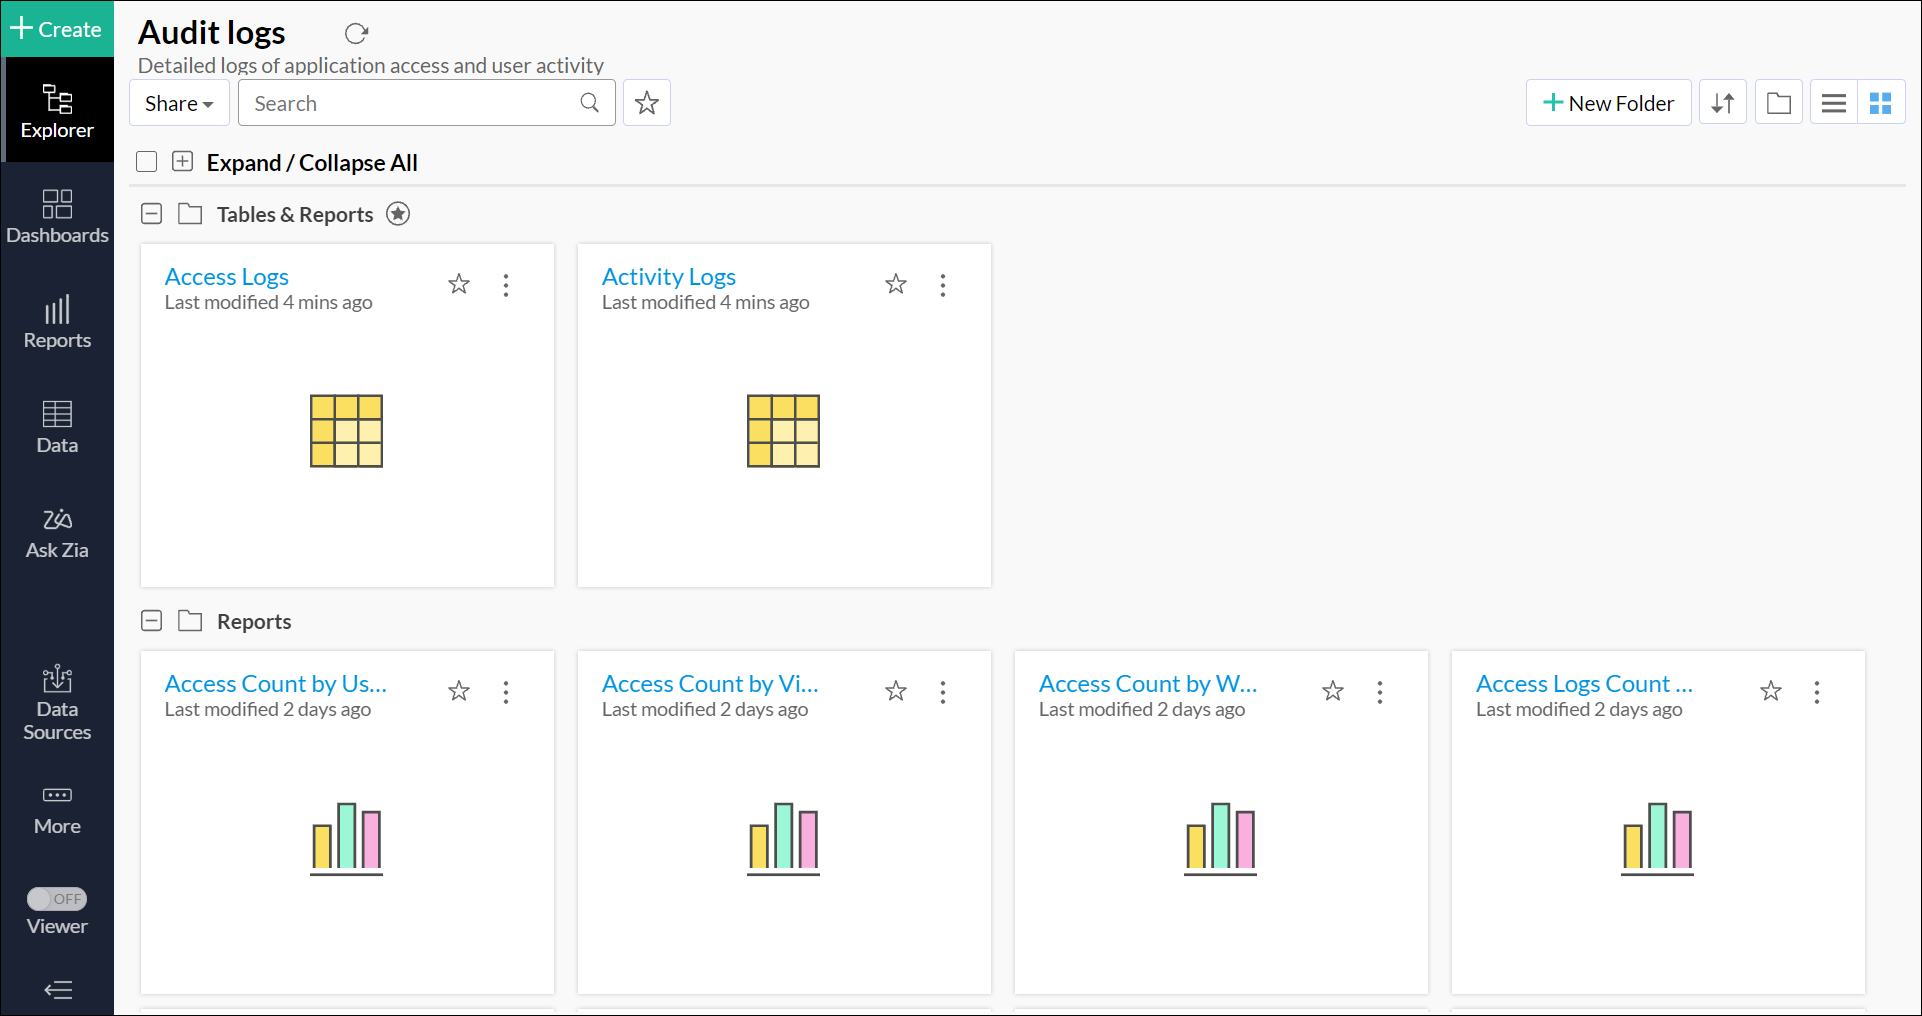
Sep
Build Number: 5020 (Release on: September 27, 2021)
Launching advanced analytics for additional modules in ServiceNow
EnhancementAnalytics Plus now offers out-of-the-box analytics for ServiceNow's release management, change management and configuration management modules. Click here to learn more.
Sep
Build Number: 5010 (Release on: September 08, 2021)
Introducing out-of-box integration with ServiceDesk Plus Cloud
NewAnalytics Plus seamlessly integrates with ManageEngine ServiceDesk Plus Cloud, to provide a detailed analysis of your help desk metrics. Click here to learn more.
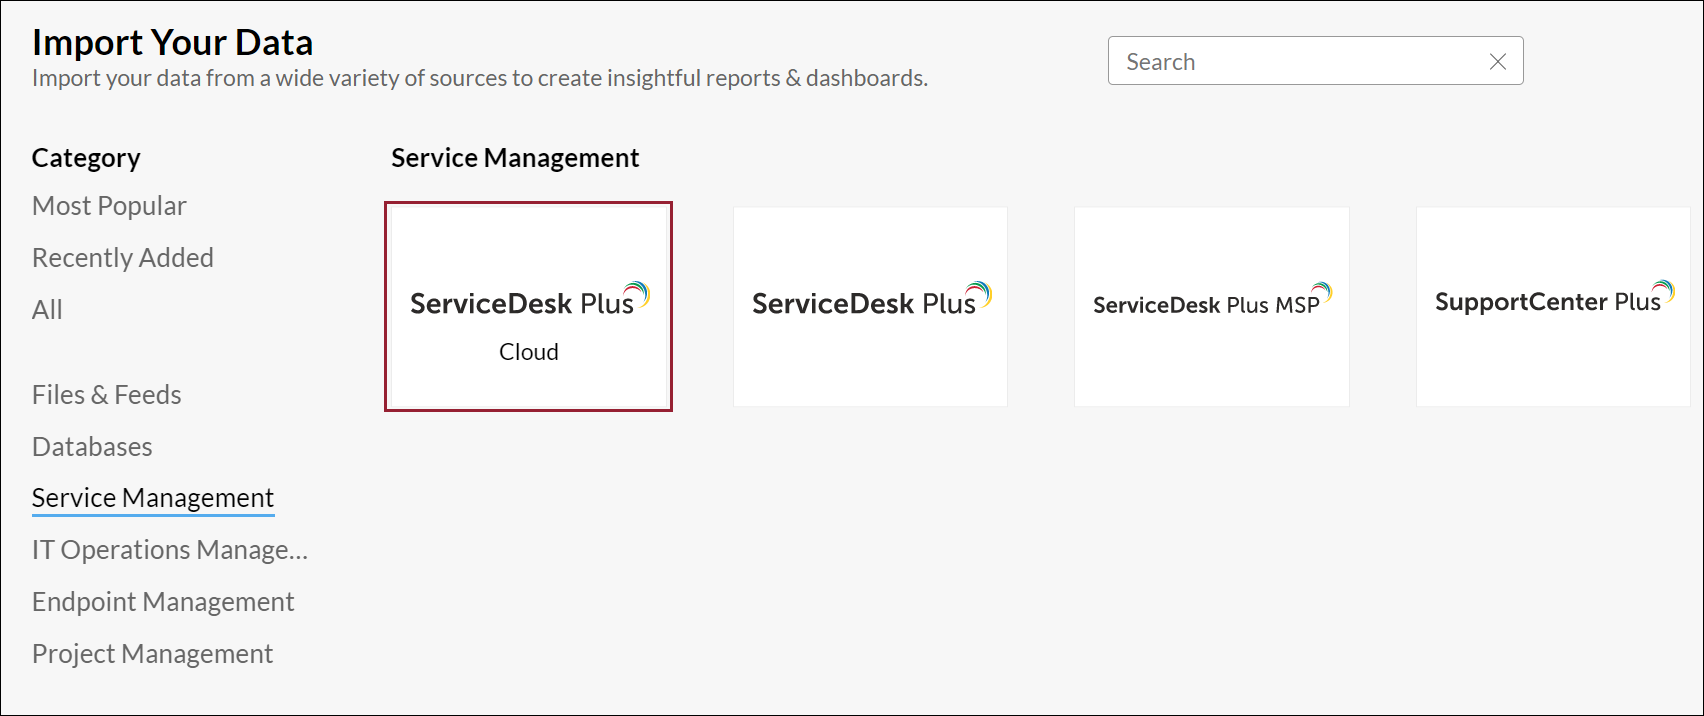
Issues fixed
Issues fixed- The issue while exporting custom map charts is now fixed in workstations with Google Chrome versions 59 or above installed.
- The issue that exported dashboards in a PDF layout without reflecting the configured password is fixed.
Note: To facilitate enhanced security, the default installation folder for Analytics Plus on Windows servers is now 'C:Program Files/'.
July
Build Number: 5000 (Release on: July 26, 2021)
Introducing What-If analysis
NewThis feature allows you to perform scenario analysis over data to visualize business impact if the involved variables change. Click here to learn more
ServiceDesk Plus and Endpoint Central blended reports
NewYou can now access out-of-the-box blended reports that combine data from ManageEngine ServiceDesk Plus and ManageEngine Endpoint Central. Click here to learn more
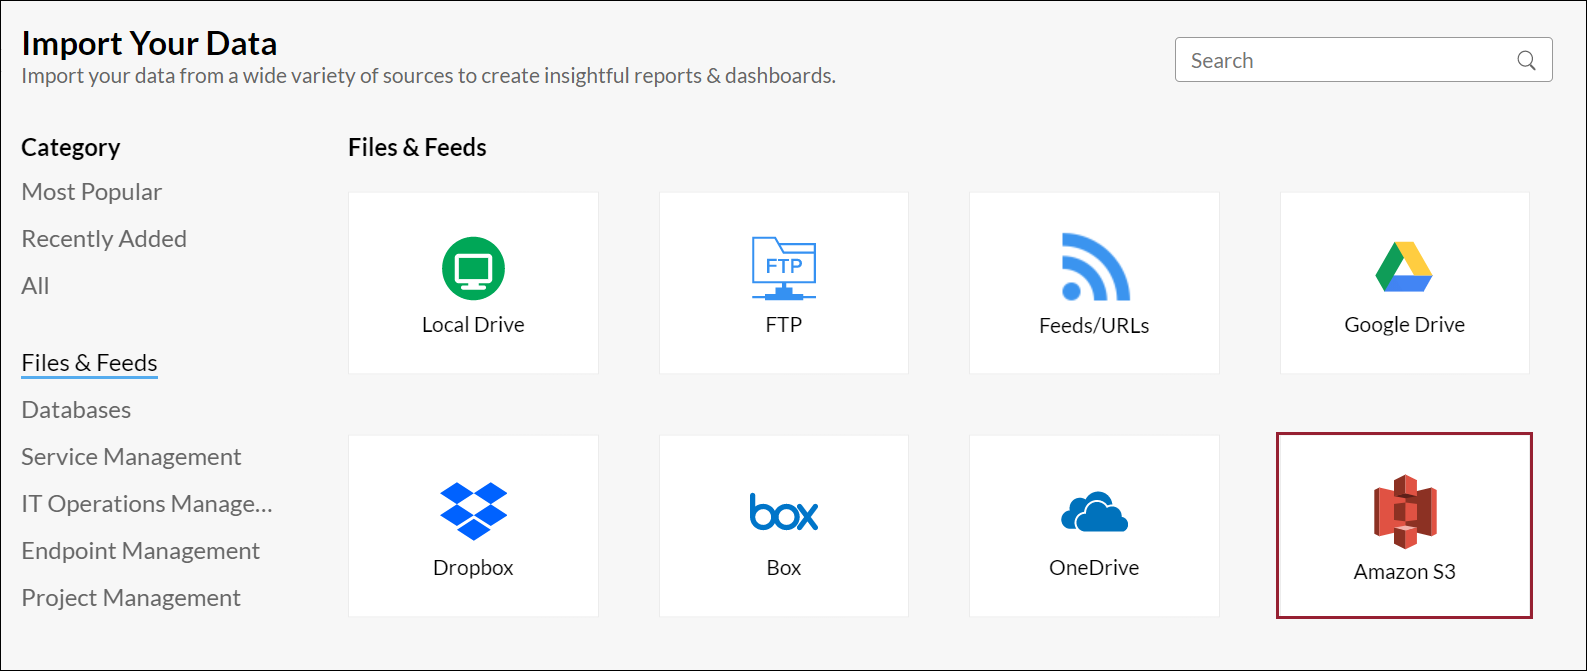
Import data from Amazon S3
NewYou can now import data from files stored in Amazon S3 cloud database. Click here to learn more
Enhancements to Ask Zia
EnhancementThe following enhancements have been made to Ask Zia.
1. Introducing Zia Insights - you can now access actionable insights on your visualizations instantly. Click here to learn more
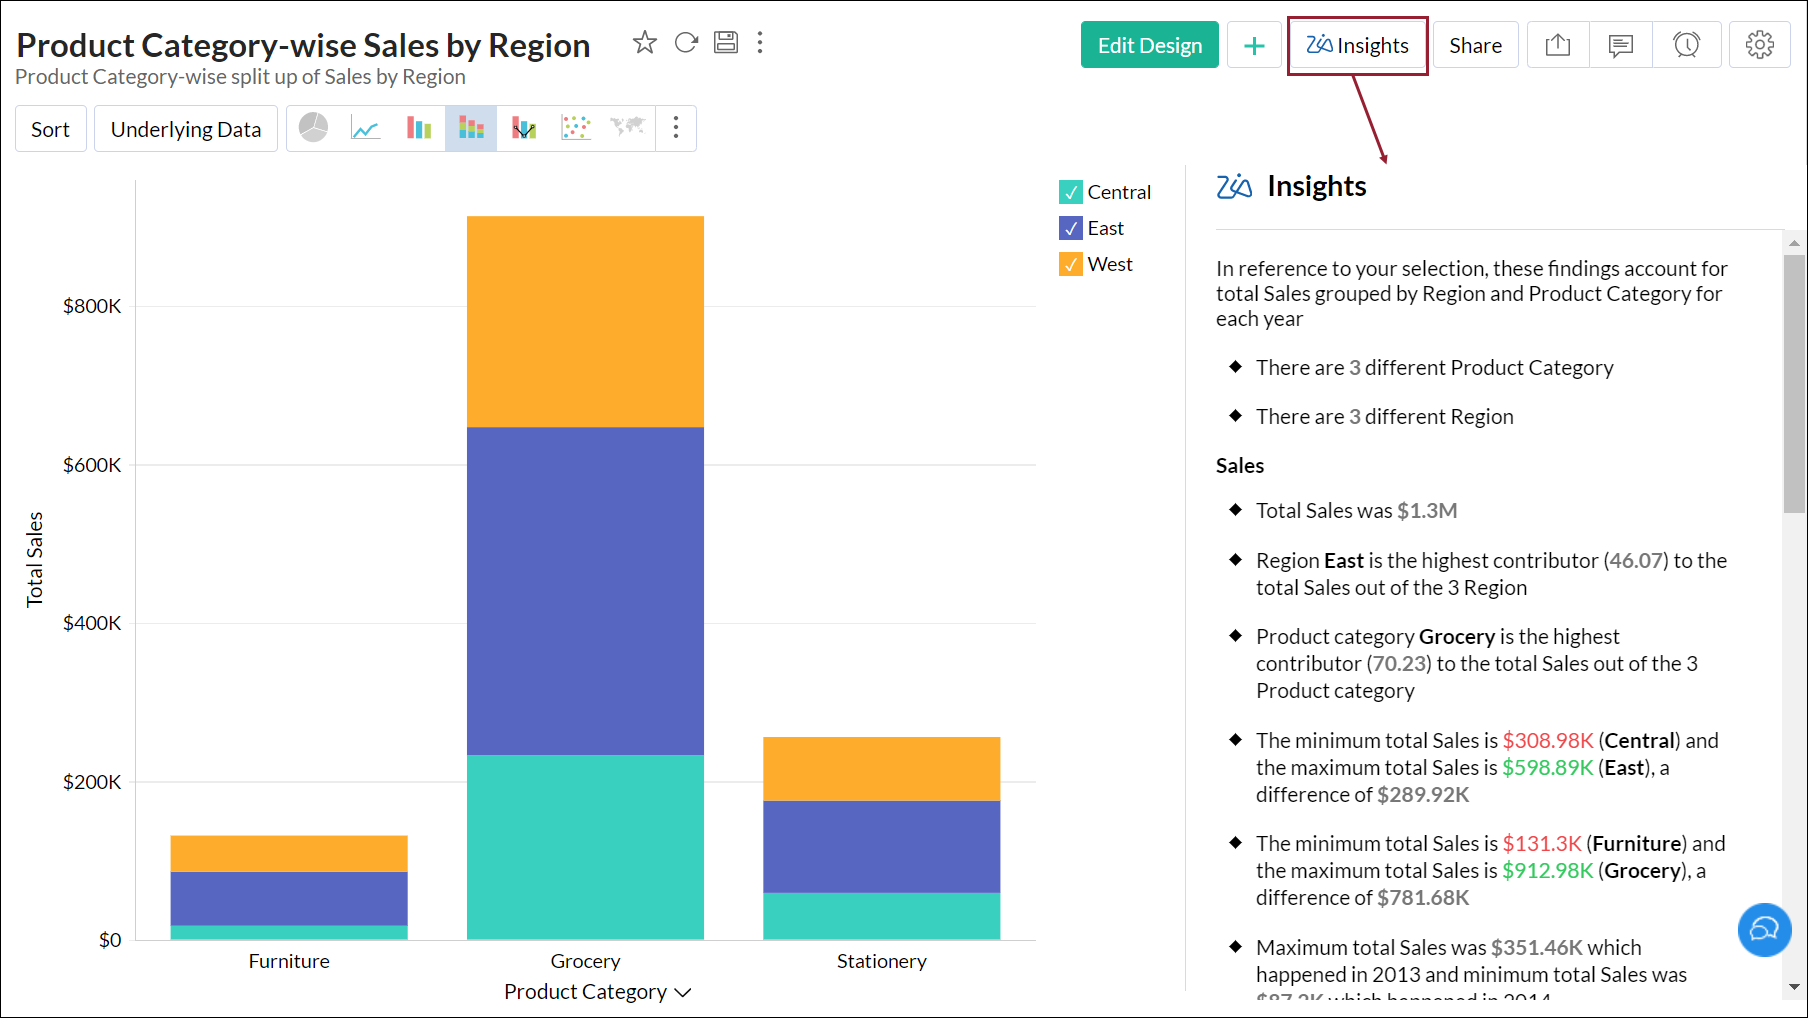
2. Our AI assistant, Ask Zia, now supports inputs in Spanish.
Conditional formatting of pivot views
EnhancementYou can now format the values in your pivot views based on relevant conditions. Click here to learn more
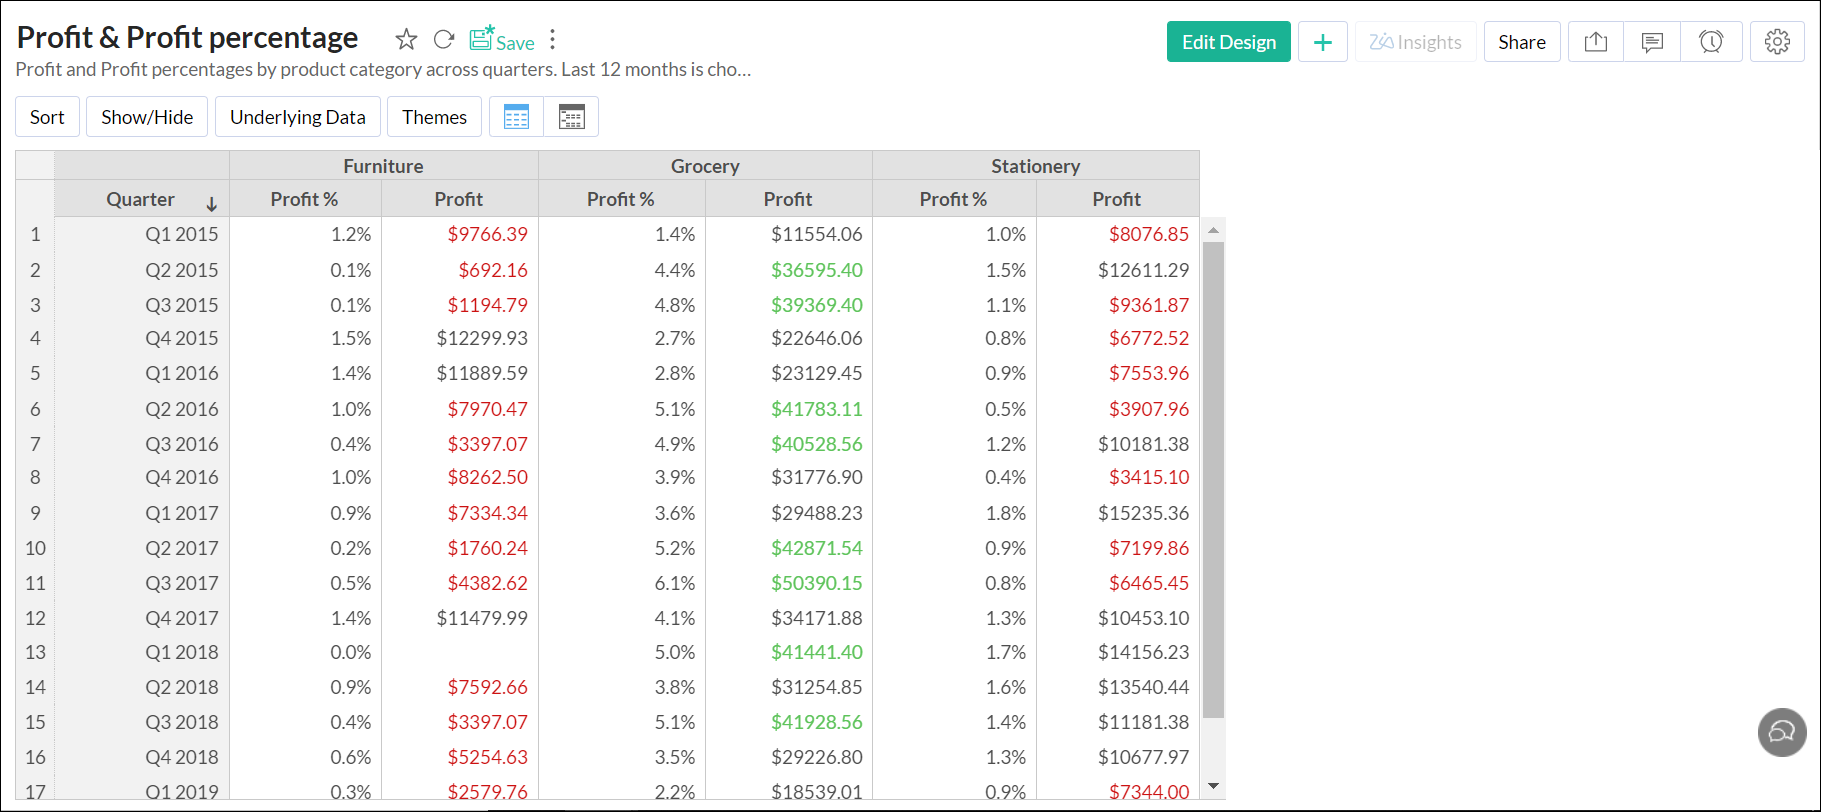
Introducing new themes
NewWith the additional themes you can now customize your Analytics Plus application per your requirements.
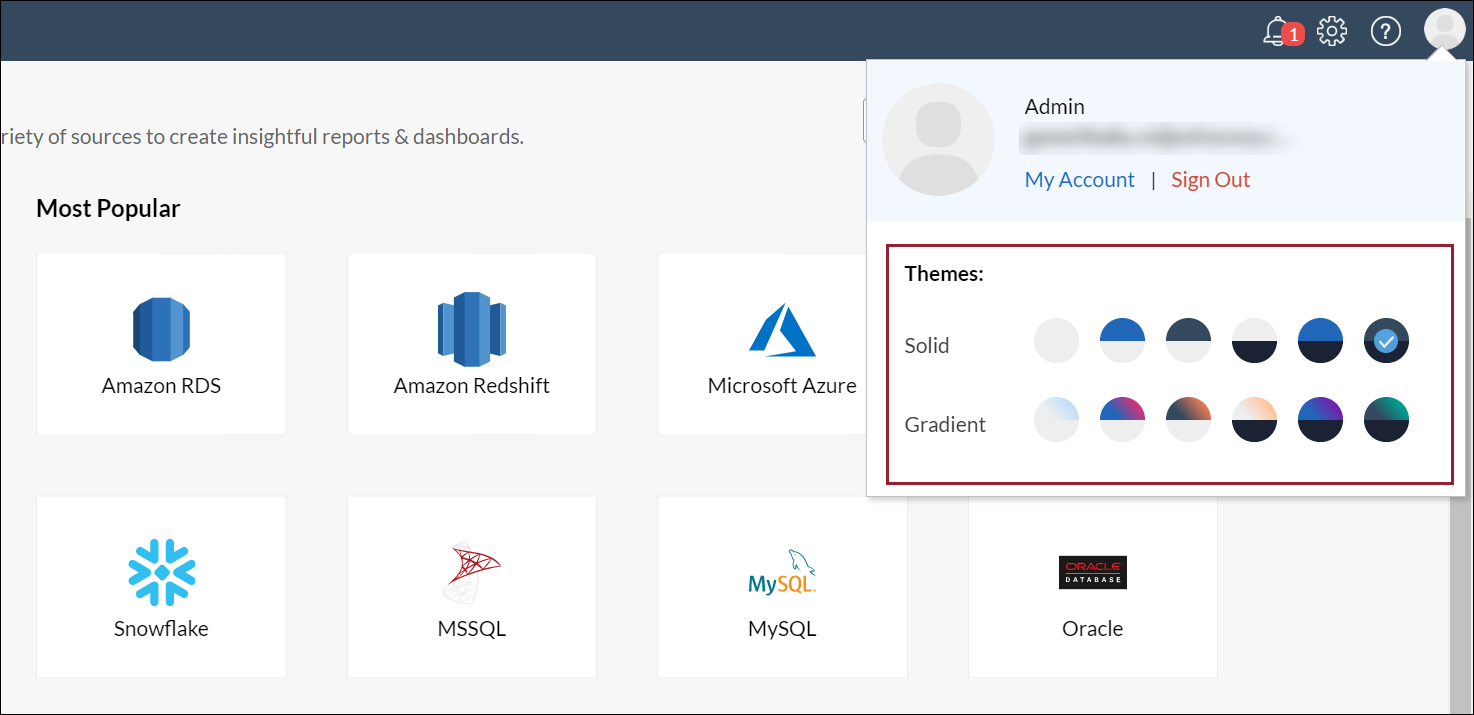
Customize map chart theme
EnhancementYou can now customize your map chart's background theme using custom images. Click here to learn more
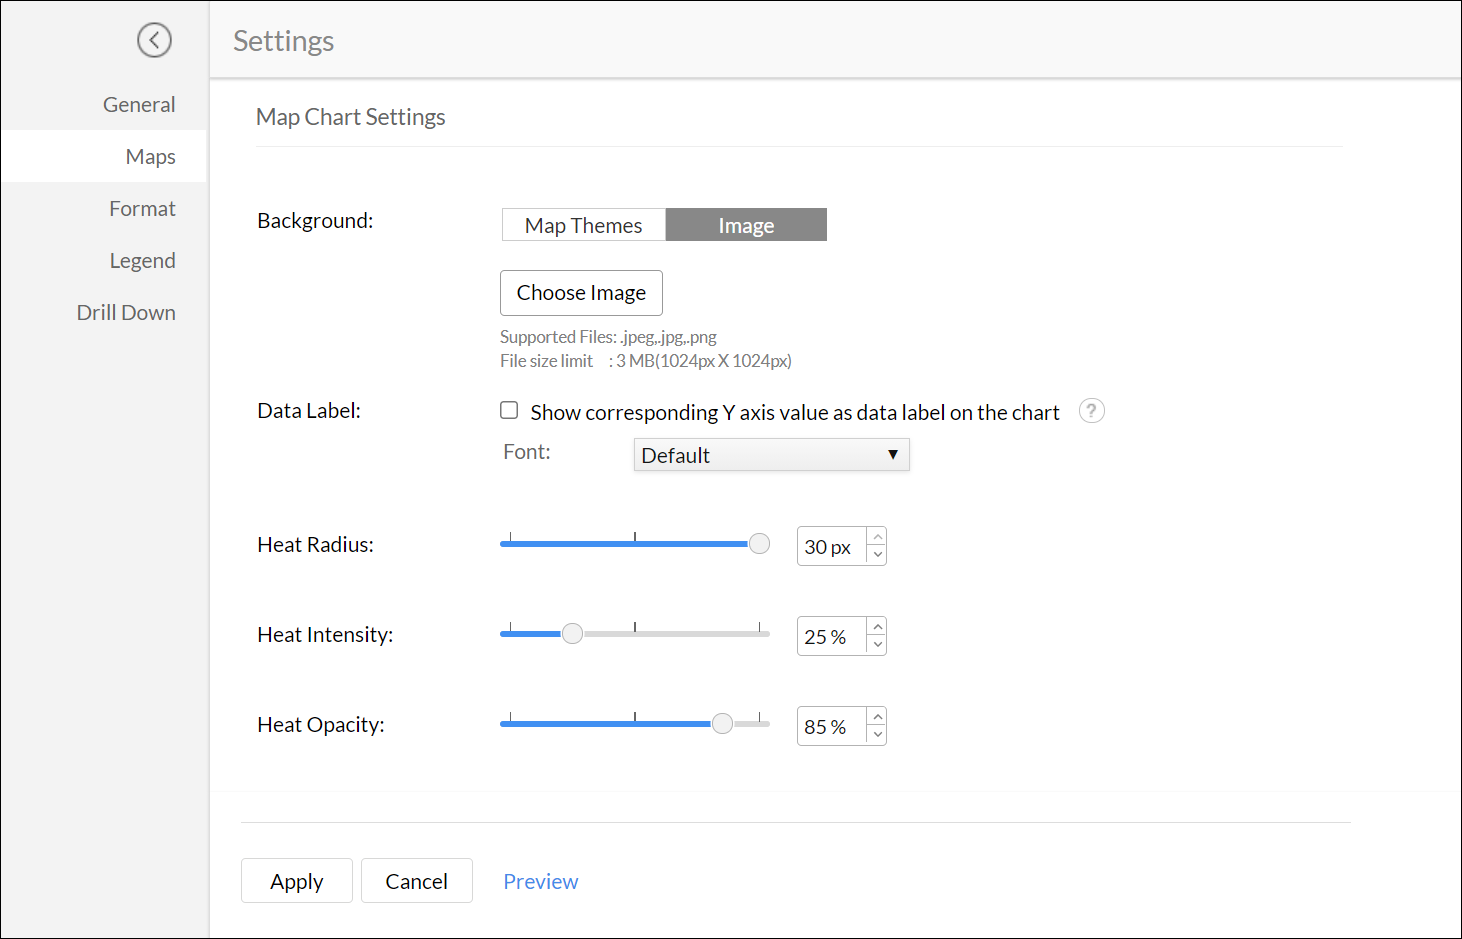
Revamped Edit Table screen
EnhancementThe Edit Table screen has been revamped for easier navigation
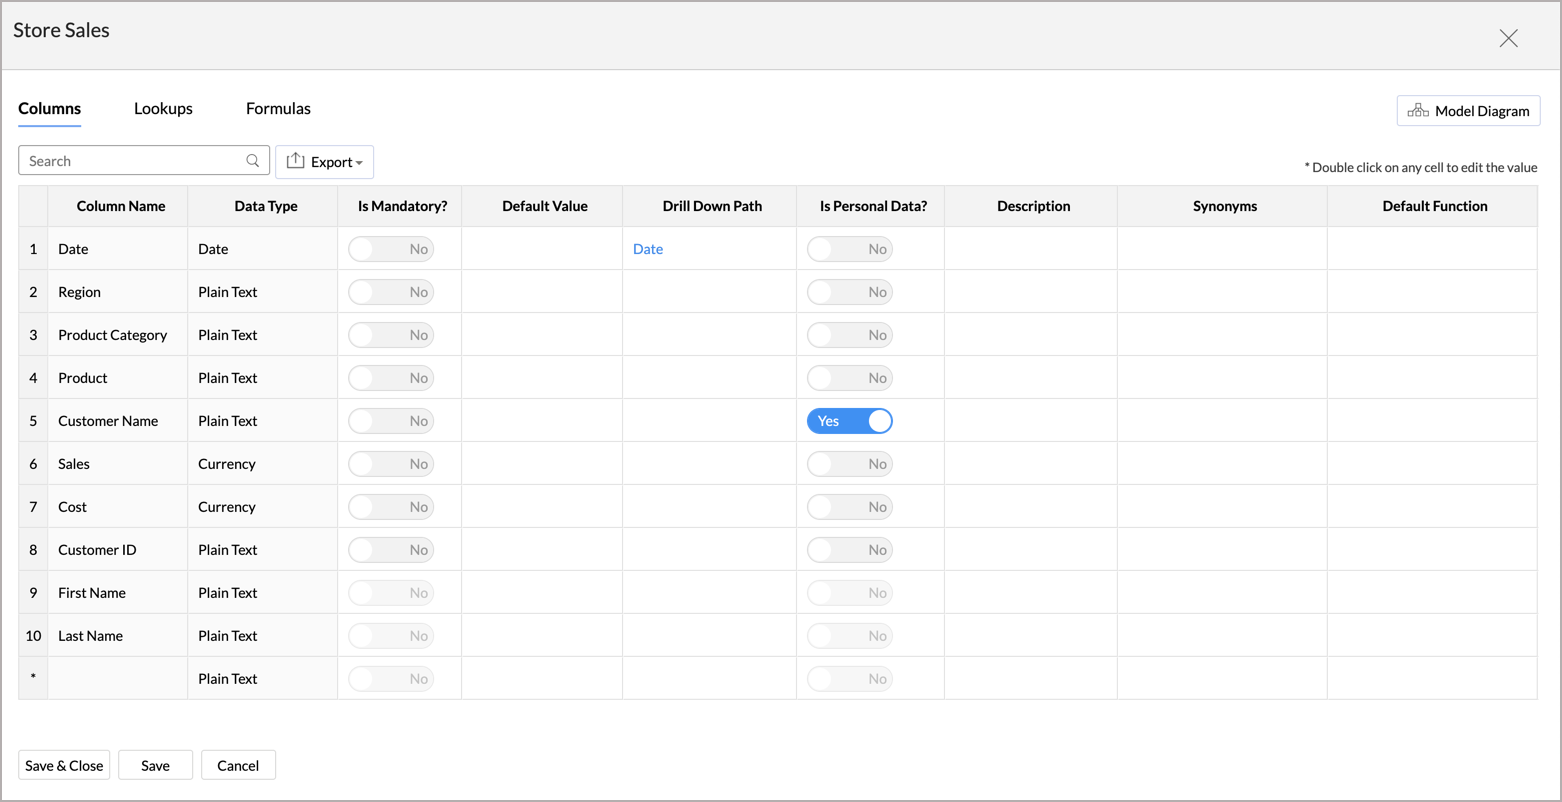
July
July
Build Number: 4760 (Release on: July 08, 2021)
Launching advanced analytics on ServiceDesk Plus' user surveys
NewAnalytics Plus now offers out-of-the-box analytics for ServiceDesk Plus survey module. Click here to learn more
Note: Existing Analytics Plus users should upgrade to Analytics Plus build 4760 and ServiceDesk Plus build 11300 to enable these reports.
June
Build Number: 4750 (Release on: June 28, 2021)
Introducing support for high availability
NewYou can now achieve application redundancy by setting up a high availability configuration. Click here to learn more
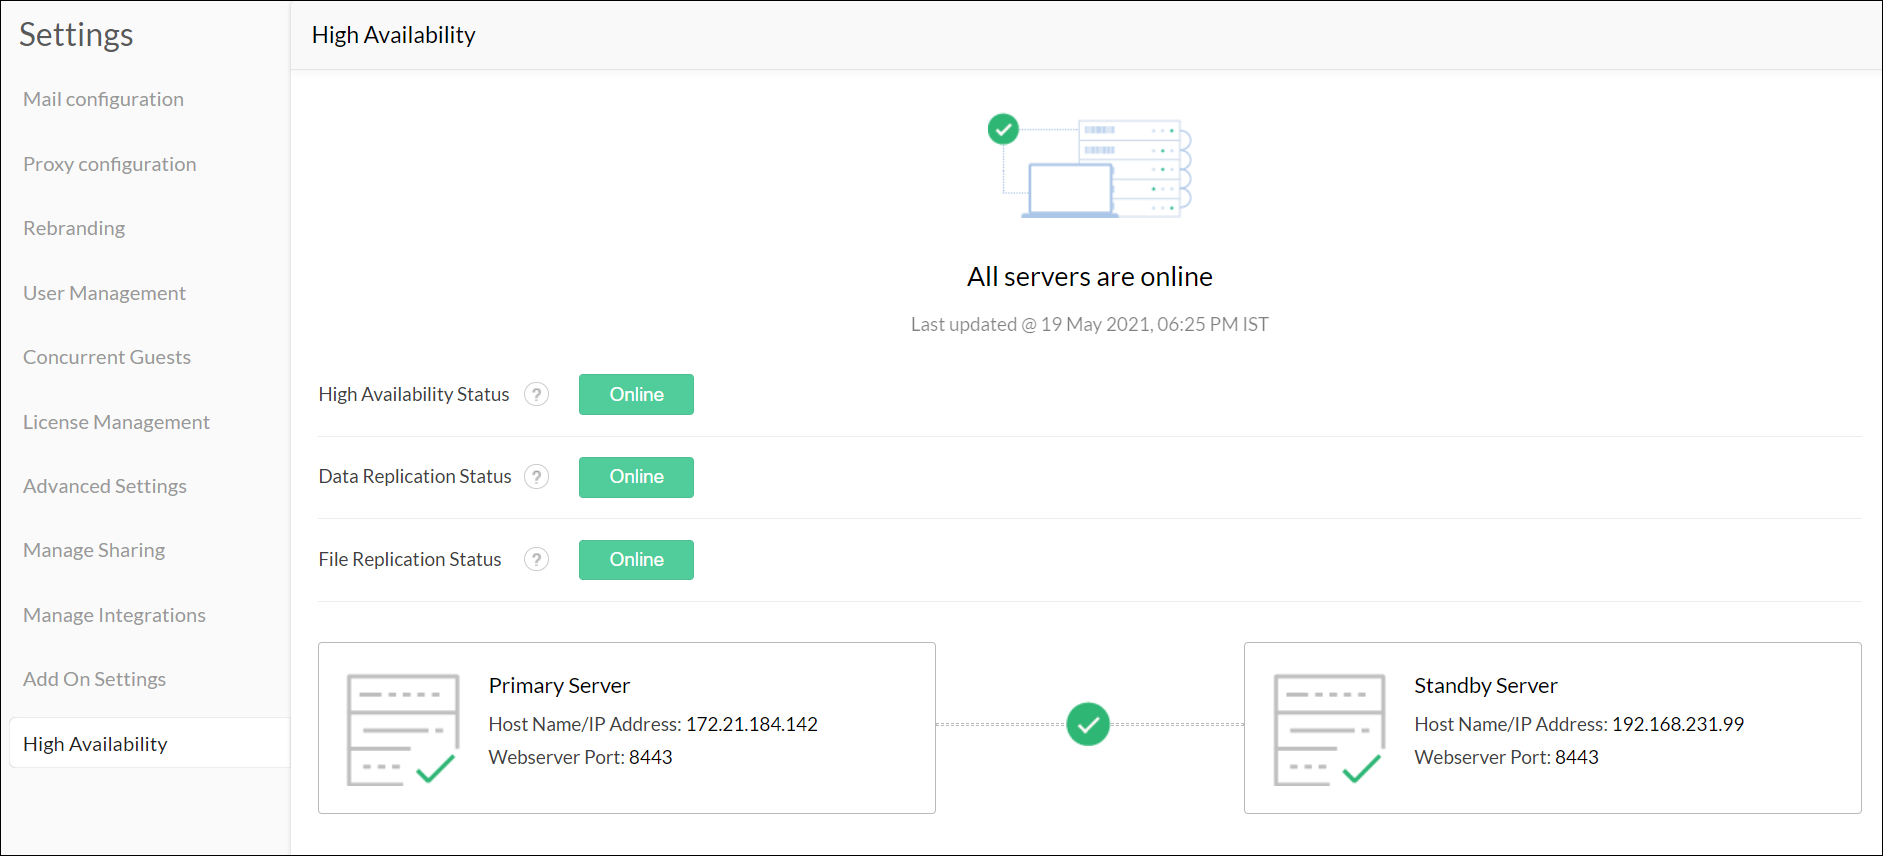
Issues fixed
Issues fixed- The Cross-Site Scripting (xss) vulnerability in the display name field is now fixed.
May
Build Number: 4700 (Release on: May 31, 2021)
Import data from Template files
NewAnalytics Plus now allows you to copy reports, dashboards and tables from one workspace or installation to another. Click here to learn more
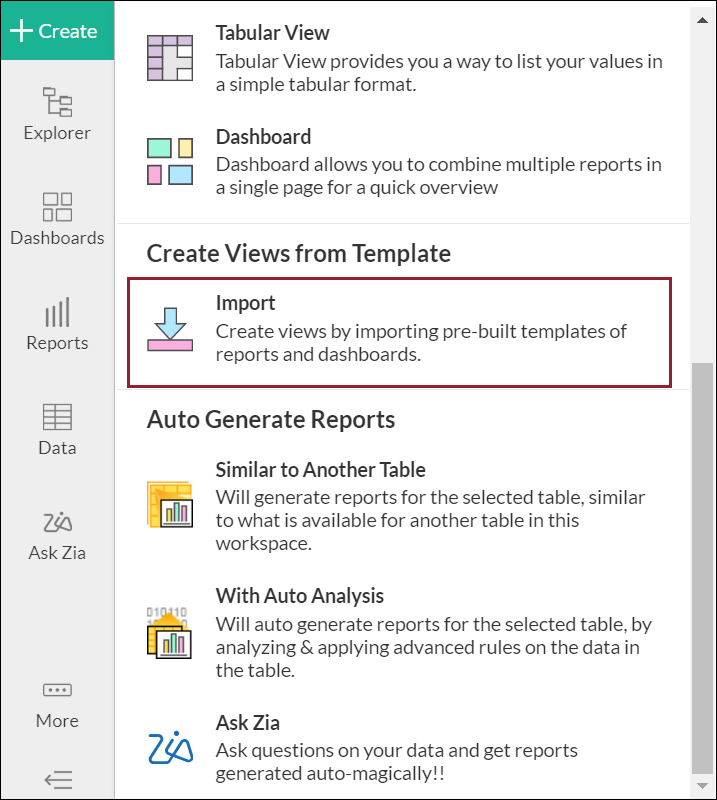
Import data from Analytics Plus workspaces
NewYou can also import data from one Analytics Plus workspace to another from the Import your Data screen. Click here to learn more
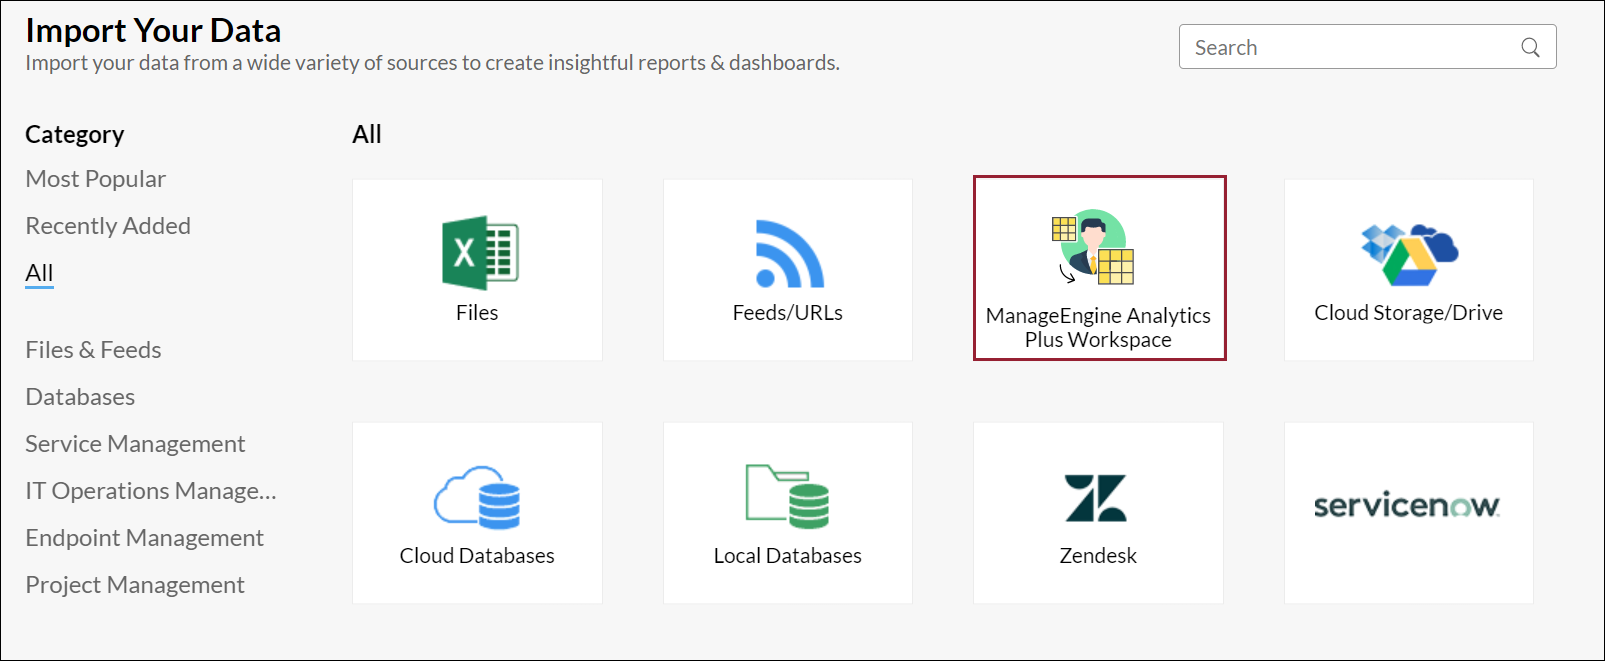
Customize forecasting models
EnhancementYou can now customize the mathematical models involved in forecasting your data. Click here to learn more
Introducing Viewer mode
NewThis mode removes edit/modify action buttons from the UI, thereby setting up reports and dashboards for a clutter-free view-only experience.
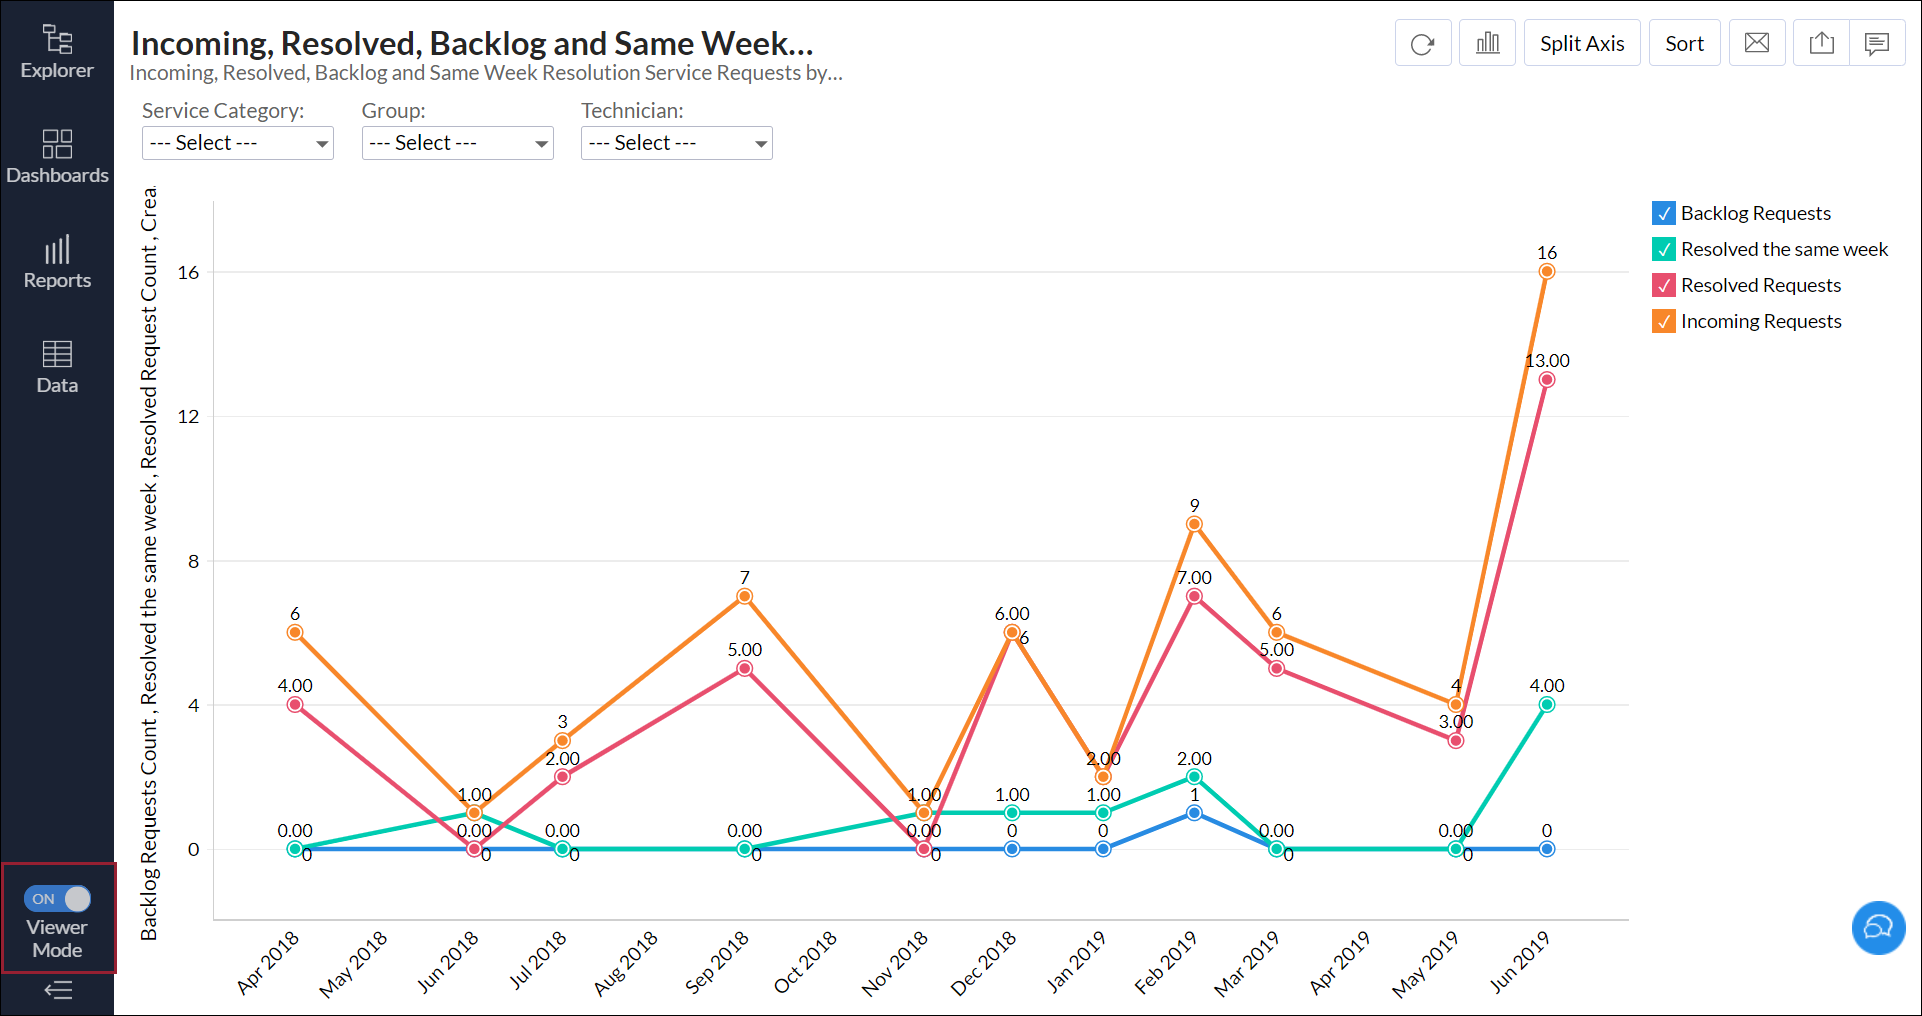
Enhancements to charts
EnhancementThe following enhancements have been made to charts:
1. When a chart has multiple axes, you can now choose to merge specific axes. Click here to learn more
2. You can now apply various effects on your chart to modify its overall appearance. Click here to learn more
Expand and collapse user filters
EnhancementYou can now expand and collapse the user filters in your dashboards. Click here to learn more about user filters.
Enhanced user interface
EnhancementThere are also several minor enhancements in the Analytics Plus user interface, designed to enhance your experience.
May
Build Number: 4650 (Release on: May 12, 2021)
Import data in batches (Pagination)
EnhancementYou can now import large amounts of data in batches from web URLs. Click here to learn more.
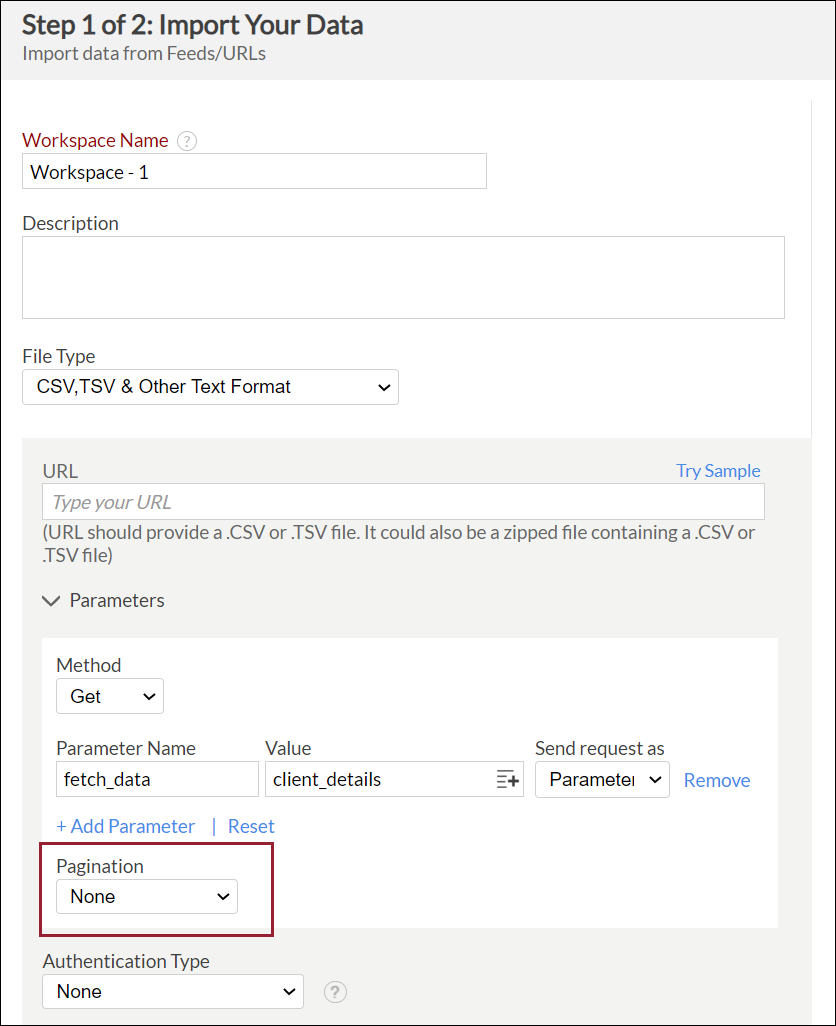
Import spatial data files
NewAnalytics Plus now allows you to import spatial data files from local files. Click here to learn more.
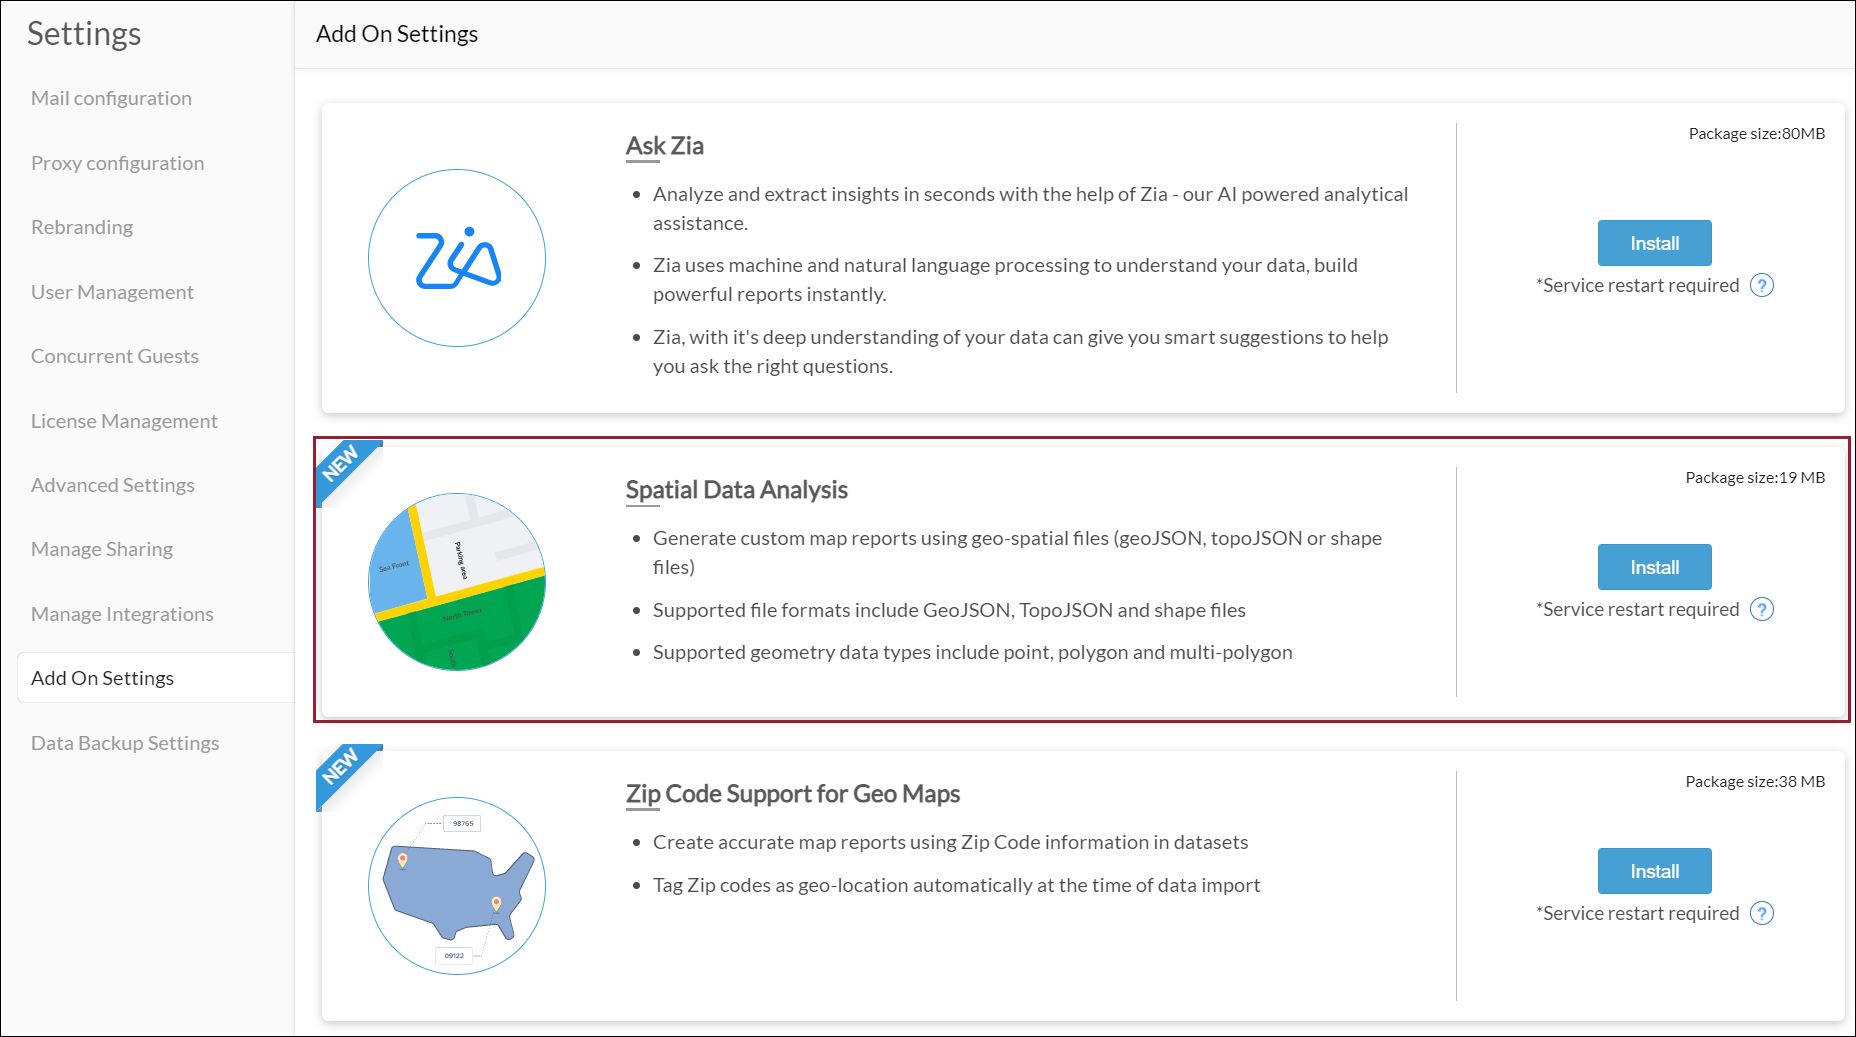
Import zip code data with ease
NewYou can now import zip code data into Analytics Plus, and generate geo visualizations within minutes. Click here to learn more.
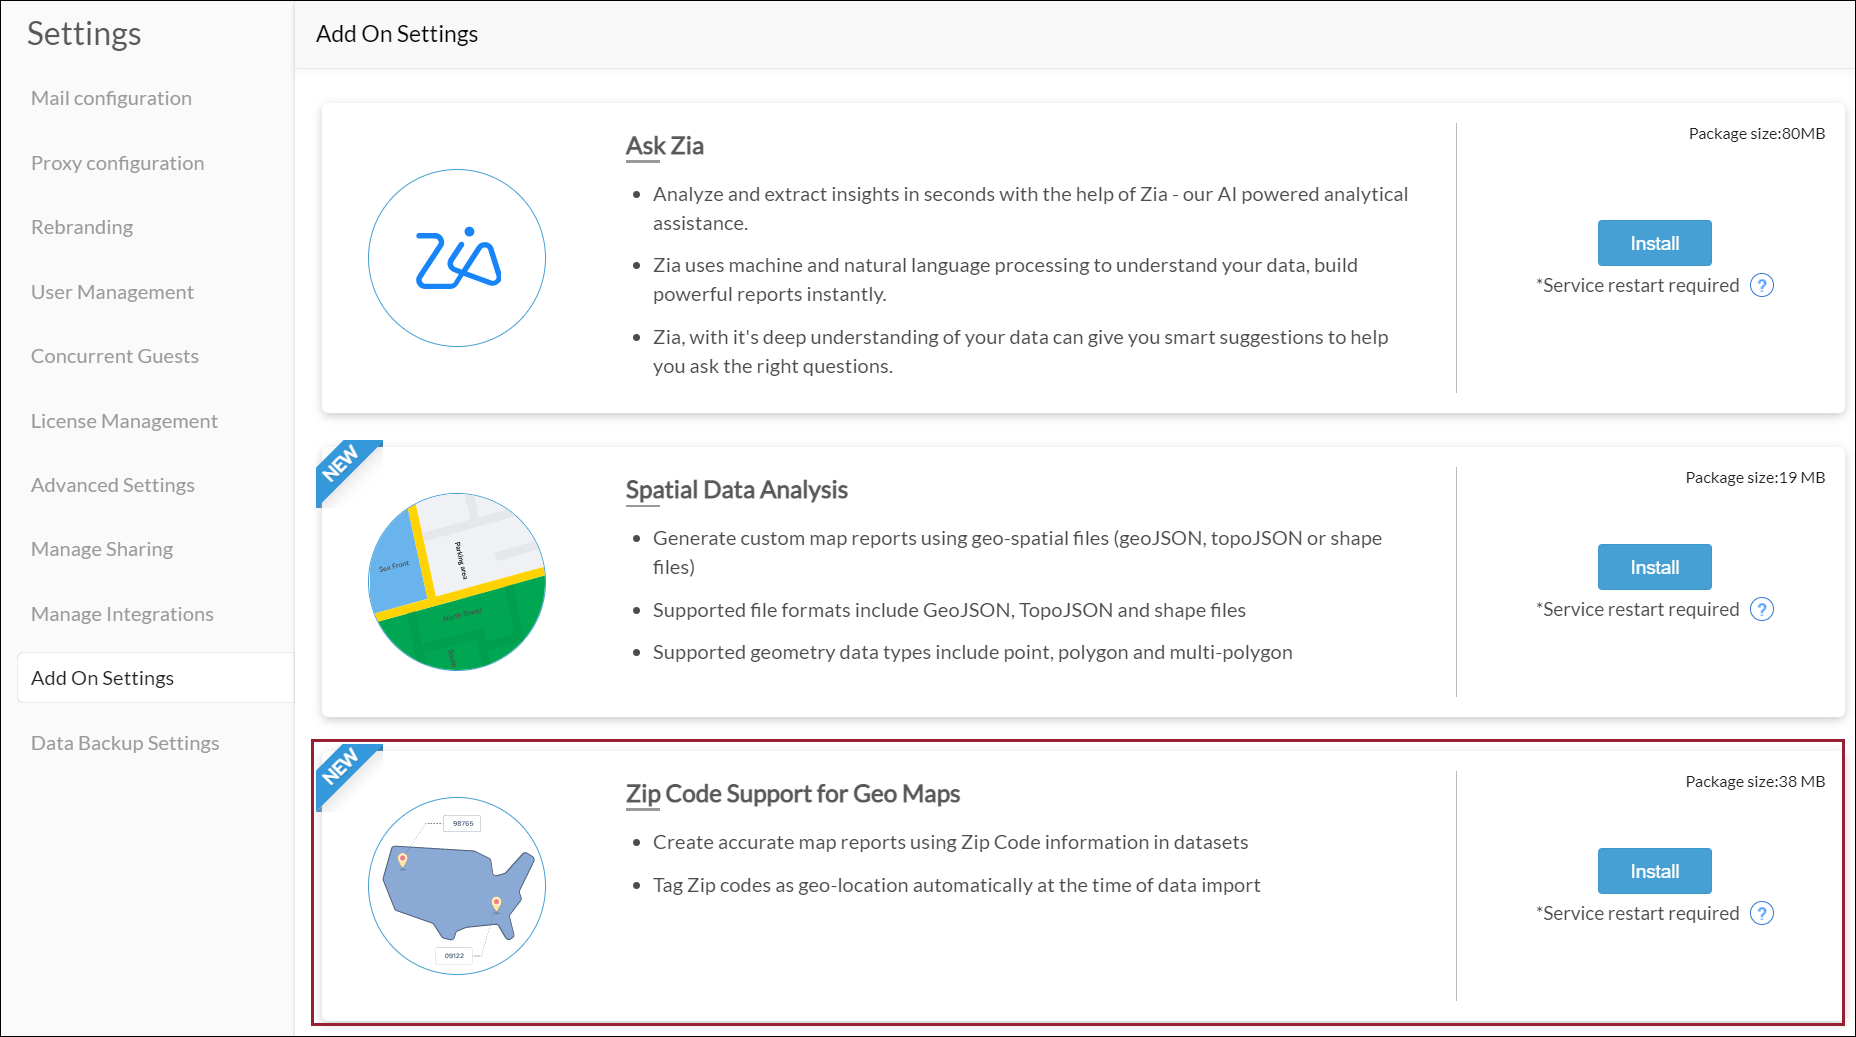
Introducing enhancements to Ask Zia
EnhancementThe following enhancements have been made to Ask Zia:
1. Ask Zia now supports predictive analytics and generates reports with forecasted values. Click here to learn more
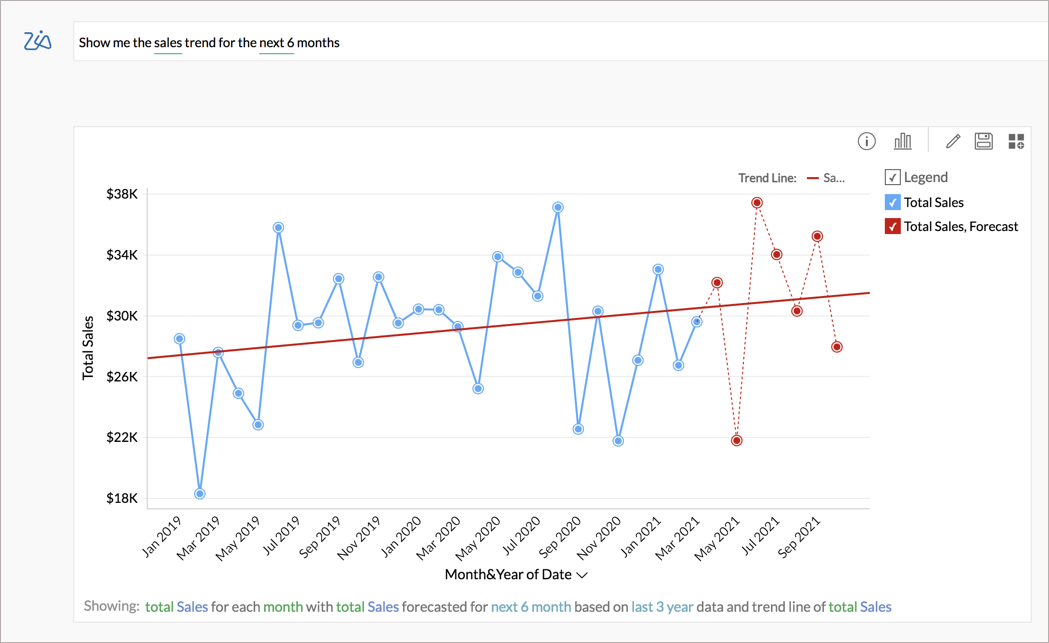
2. Introducing conversation mode: Ask Zia allows you to post follow up questions to help you dig deeper into your data.
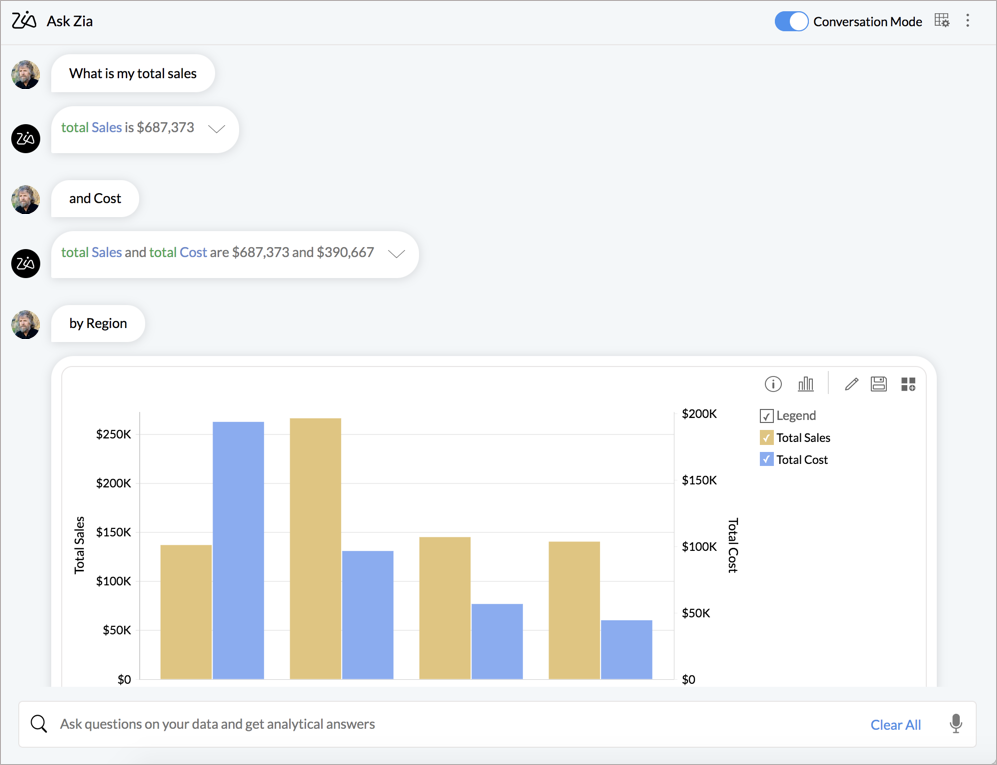
3. Ask Zia is now exclusively available in conversation mode within dashboards, to answer any dashboard-specific questions.
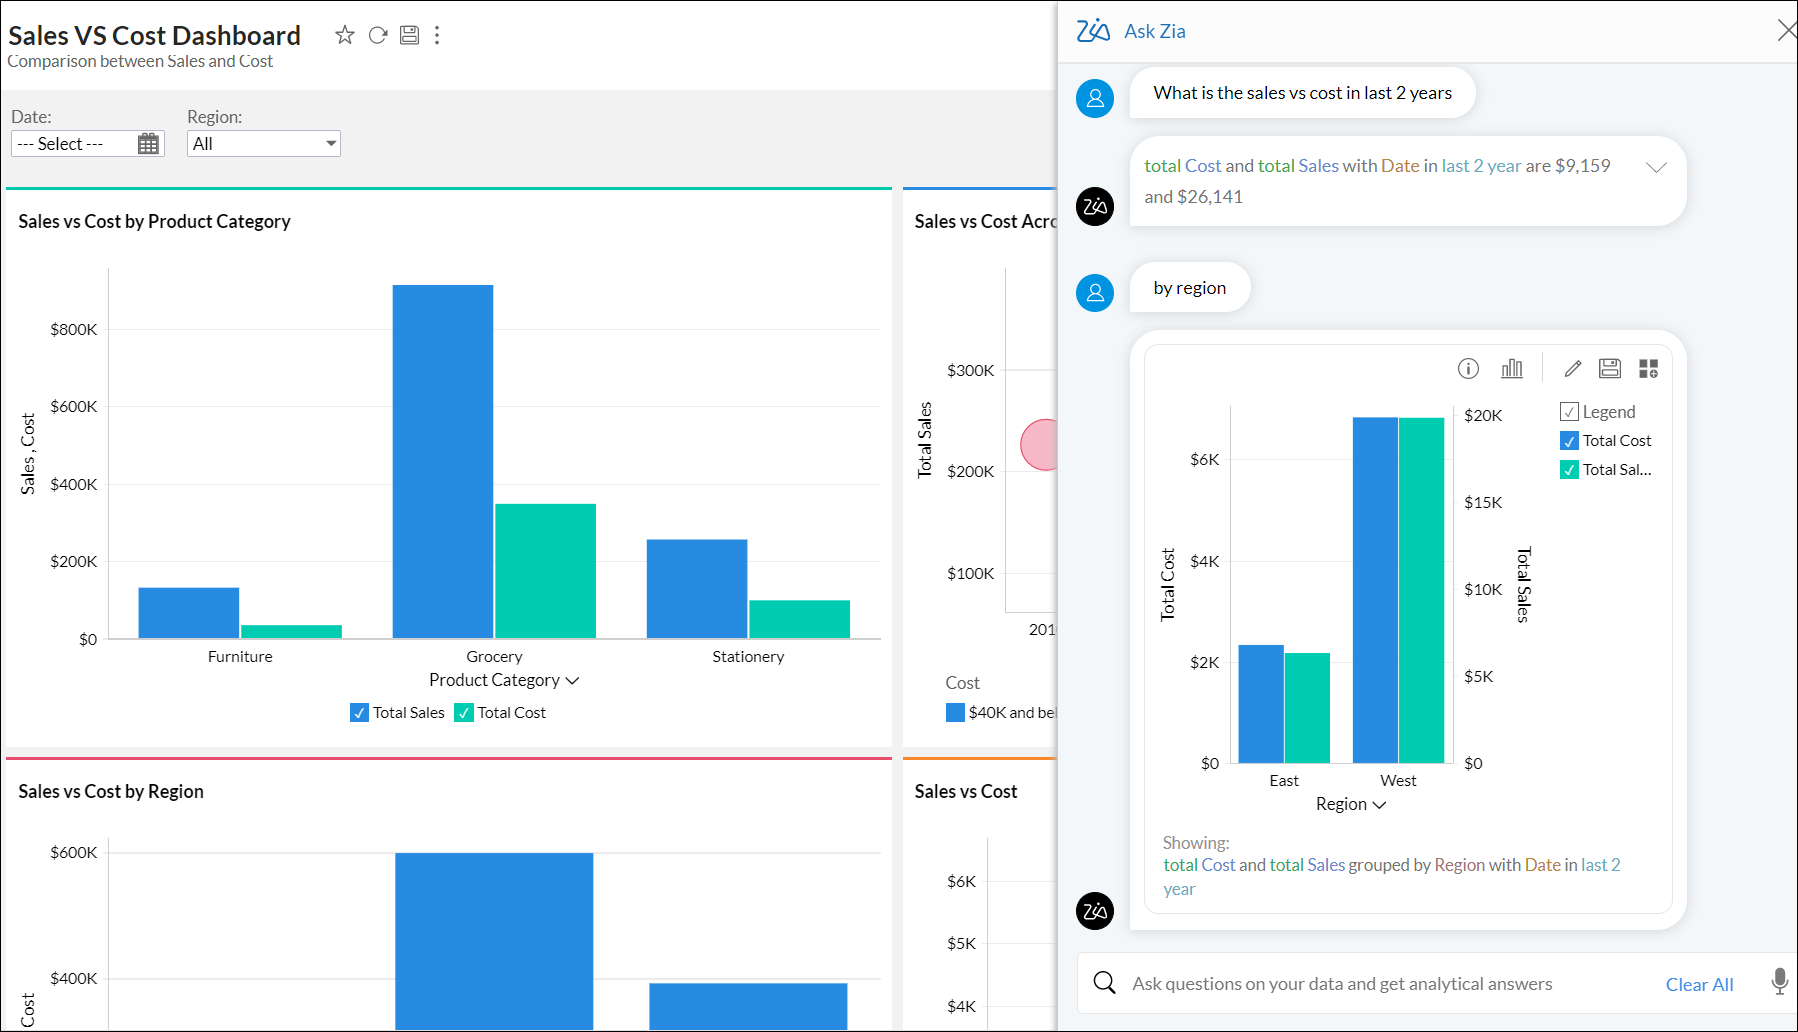
4. Ask Zia will list existing reports as answers to your questions where applicable.
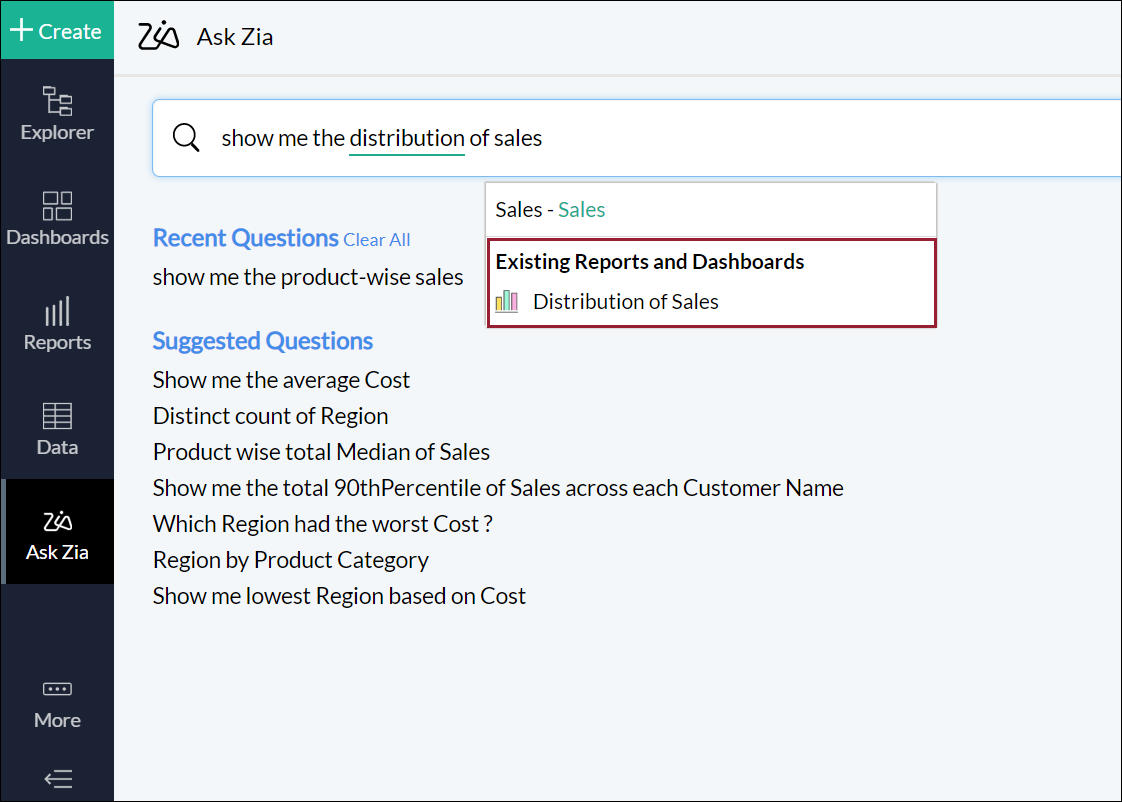
5. You can now map terms in your questions to corresponding columns in the data table while entering your questions. Click here to learn more.
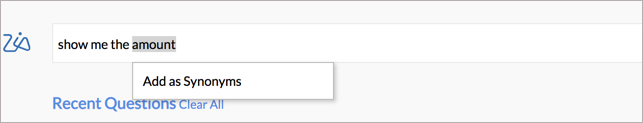
Introducing enhancements to dashboards
EnhancementThe following enhancements have been made to dashboards:
1. You can now add multiple tabs to your dashboards.Click here to learn more.
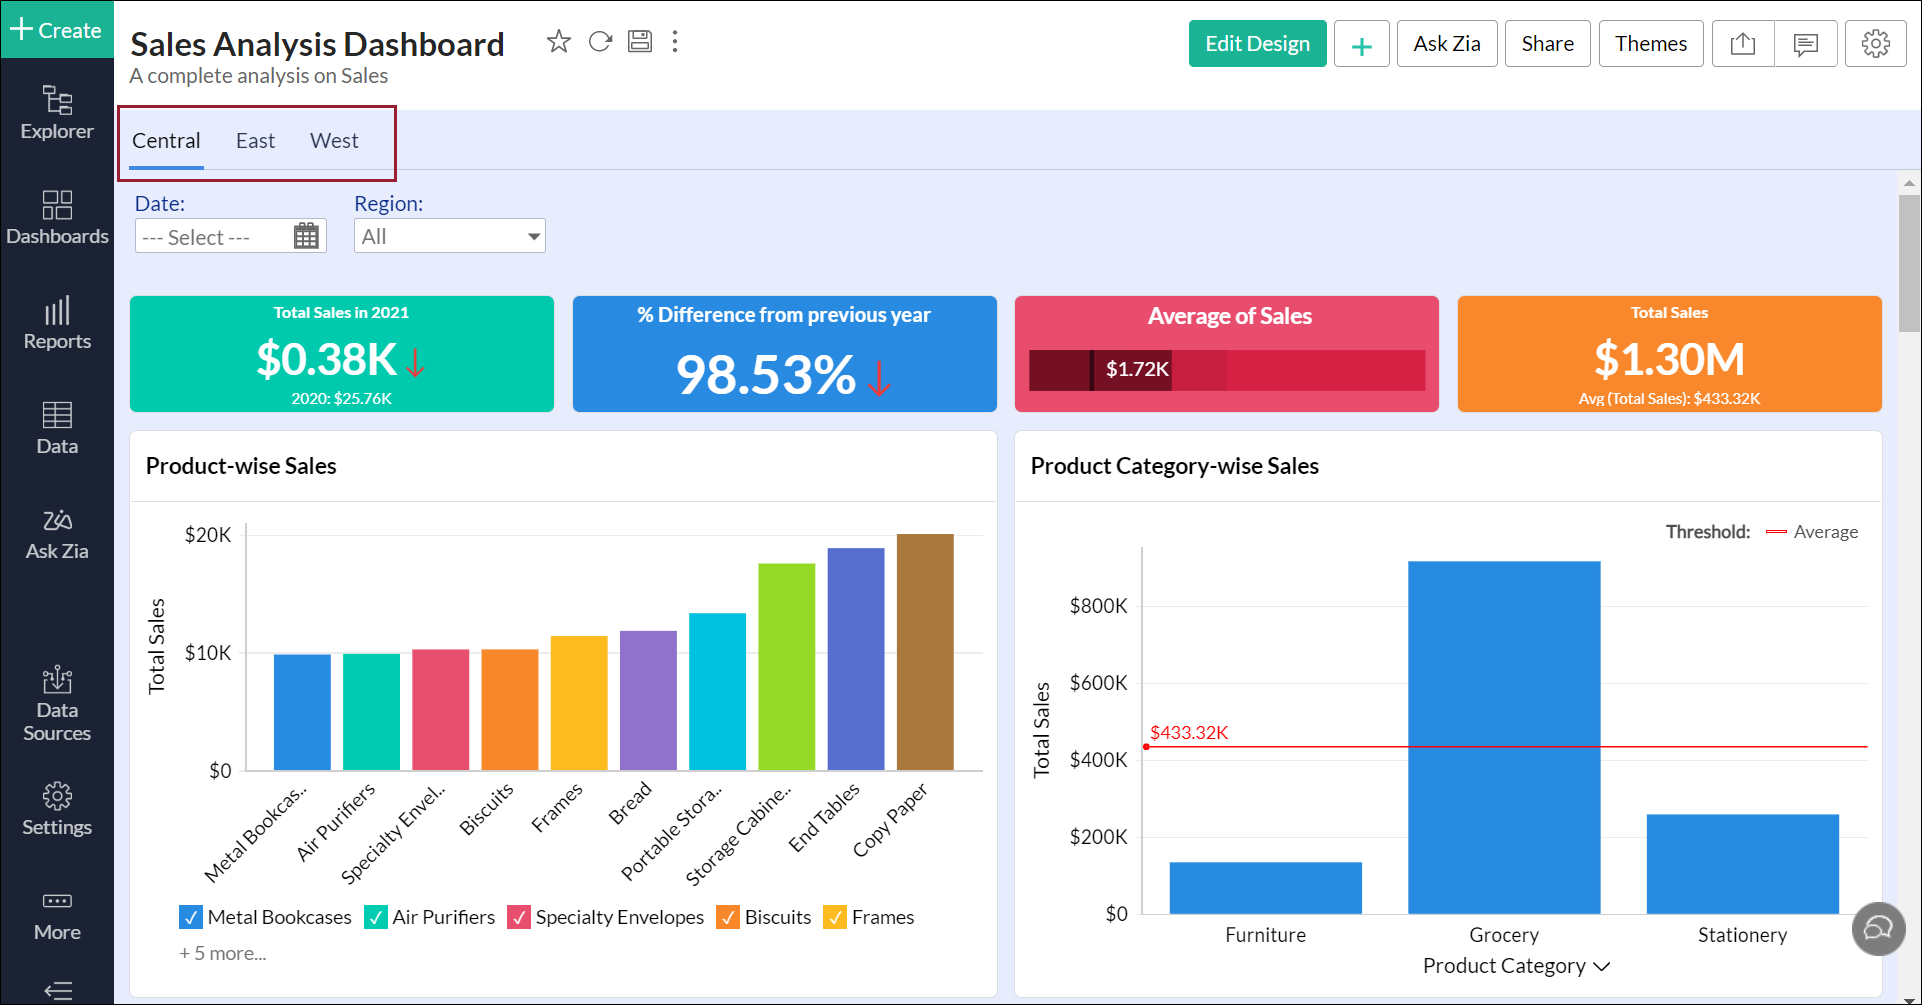
2. The merge user filters functionality in dashboards has been enhanced to support all data types. Click here to learn more.
Introducing enhancements to sort functionality in charts
EnhancementYou can now sort your multi-axis charts with both X and Y-axes values. Additionally, the Sort option in your chart's toolbar has been revamped for easier navigation. Click here to learn more.
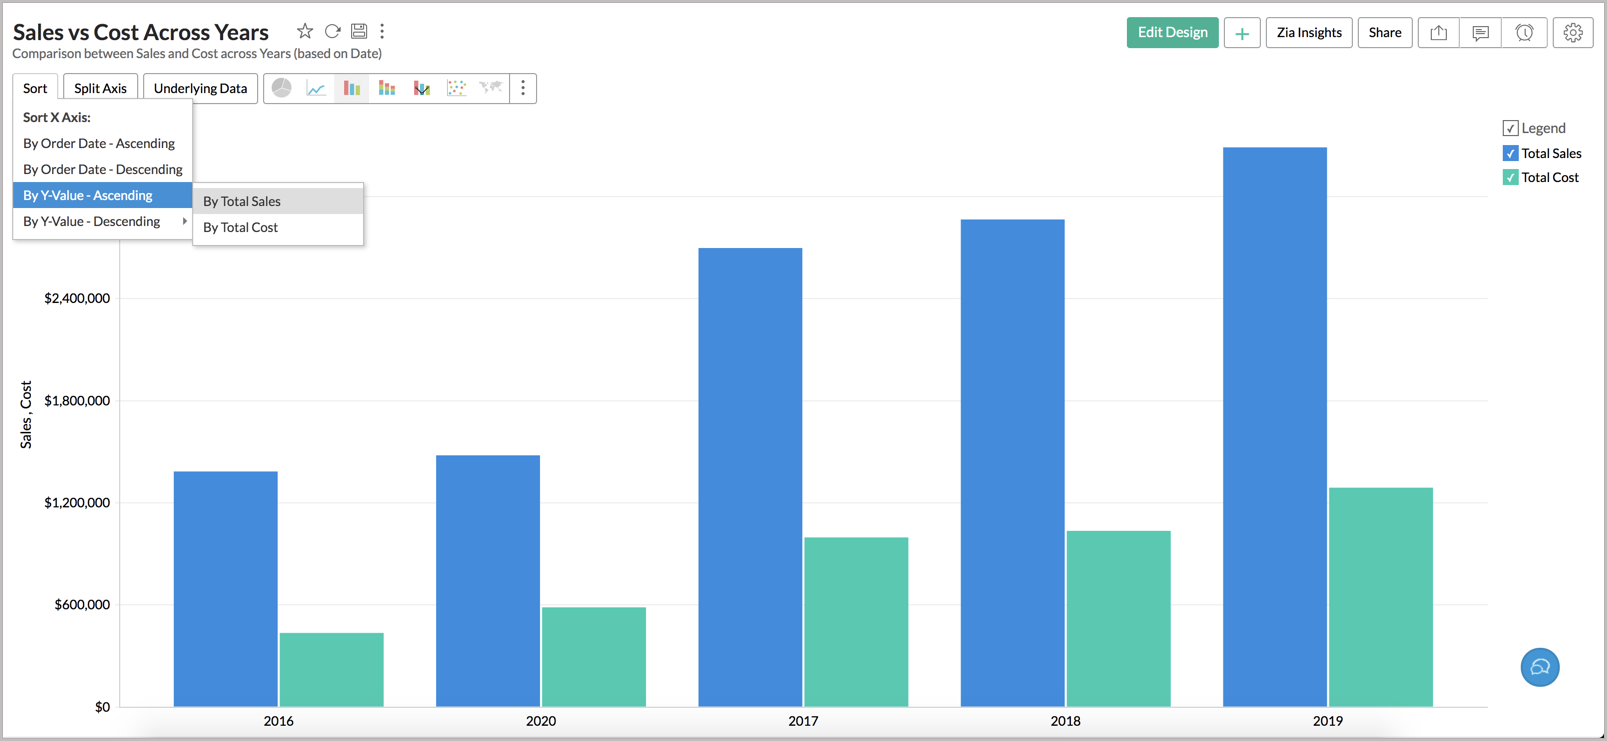
Introducing enhancements to the Export feature
Enhancement1. You can now export multiple views from the Explorer easily.
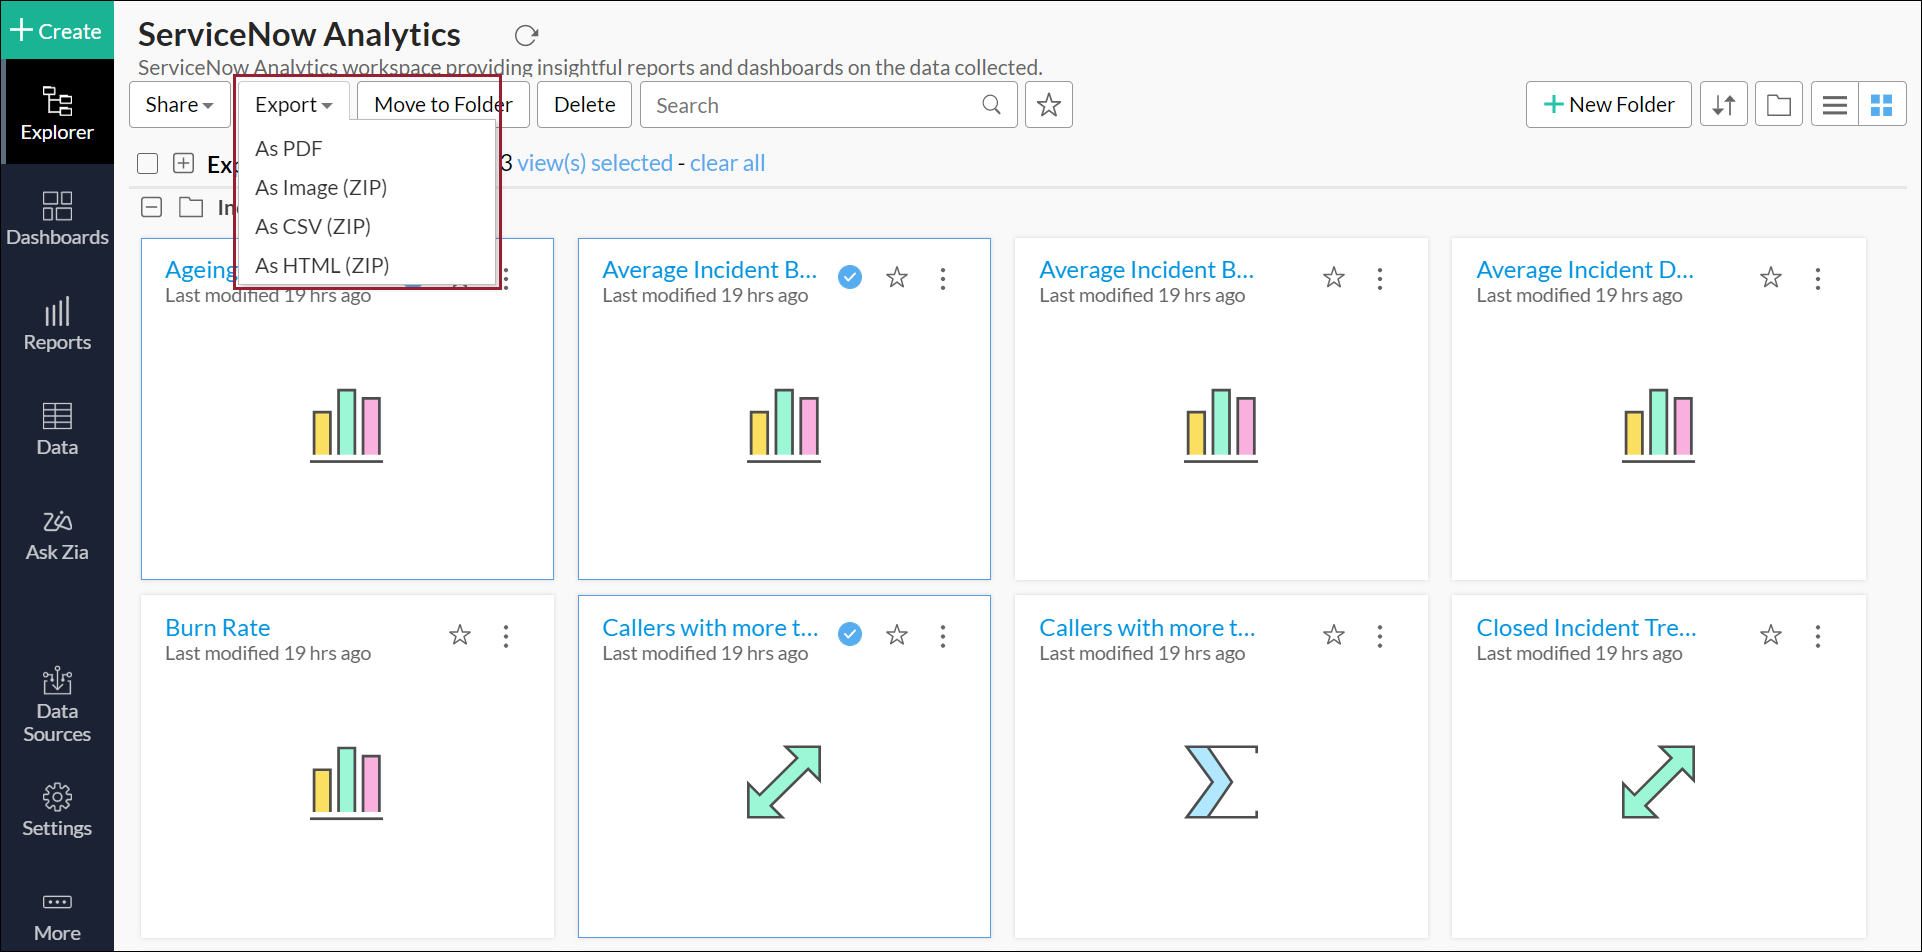
2. Analytics Plus also allows you to export all the views under a particular folder.
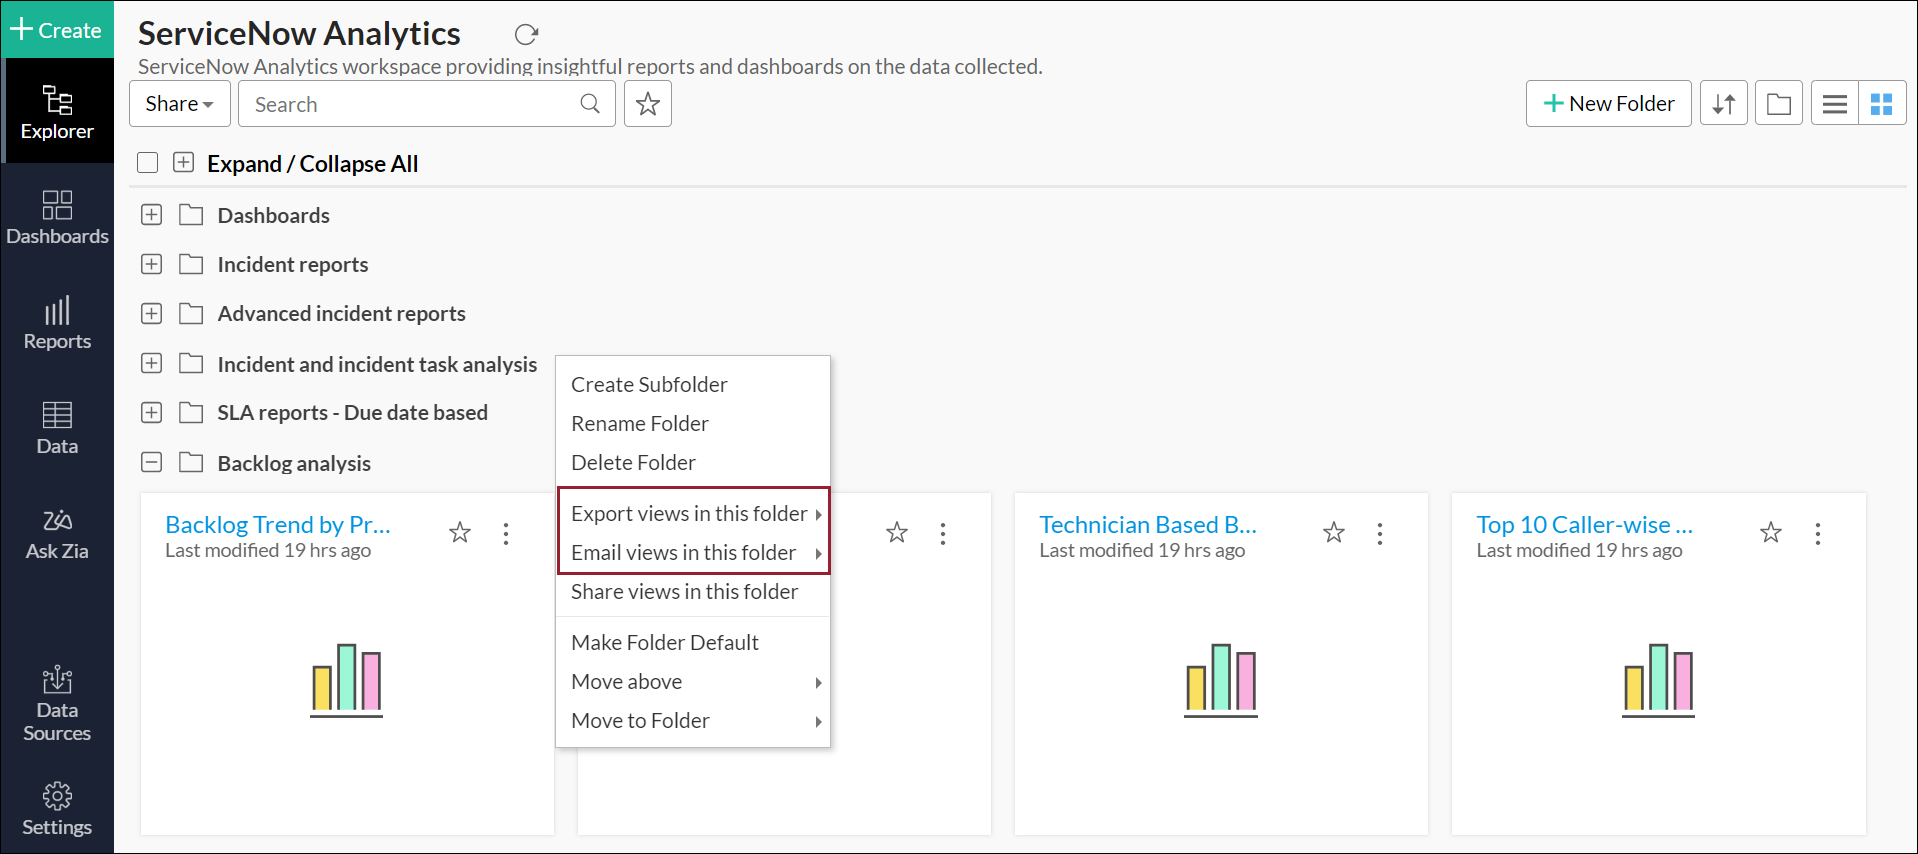
Preview your slideshows
EnhancementSlideshows in Analytics Plus now support a new preview option. Click here to learn more.
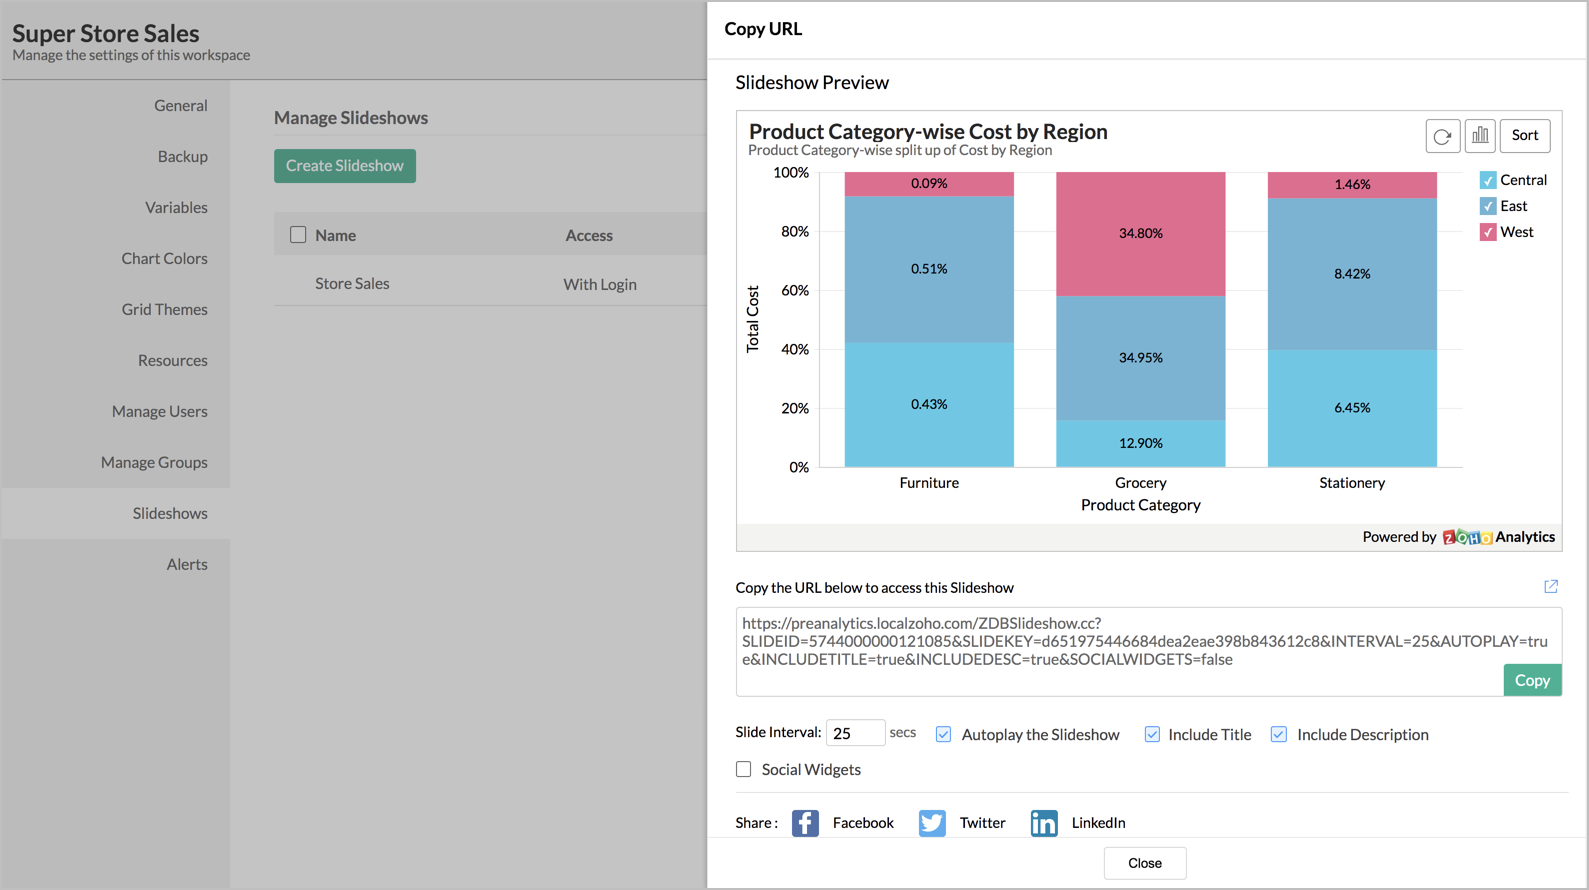
Automate scheduled application backups
NewYou can now automate scheduled backups of the Analytics Plus application easily. Click here to learn more.
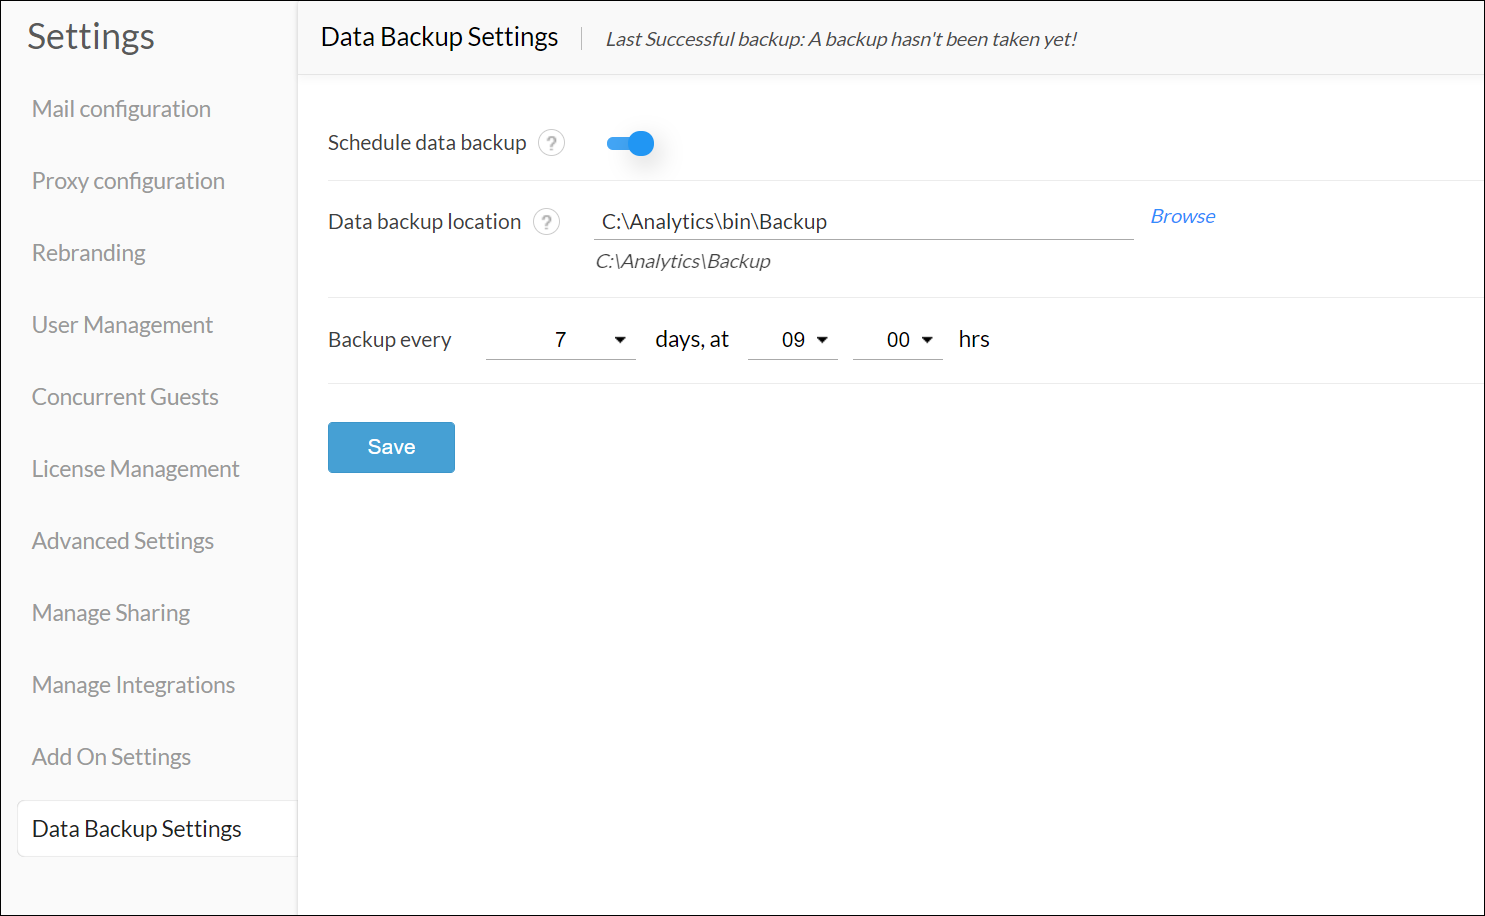
April
Build Number: 4610 (Release on: April 15, 2021)
Issues fixed
Issues fixed- The keystore encryption issue that required an application restart has now been fixed.
March
Build Number: 4600 (Release on: March 26, 2021)
Import data from more local databases
EnhancementYou can now import data into Analytics Plus from the following local databases:
- SQLite
- Progress OpenEdge
- Hive
- Firebird
- YugabyteDB
- Microsoft Access
- SAP HANA
Click here to learn more
Import data from cloud databases into existing tables
EnhancementYou can now import data from cloud databases into existing tables in Analytics Plus. Click here to learn more
Introducing trend lines
NewYou can now identify past and future data trends in Analytics Plus easily. Click here to learn more
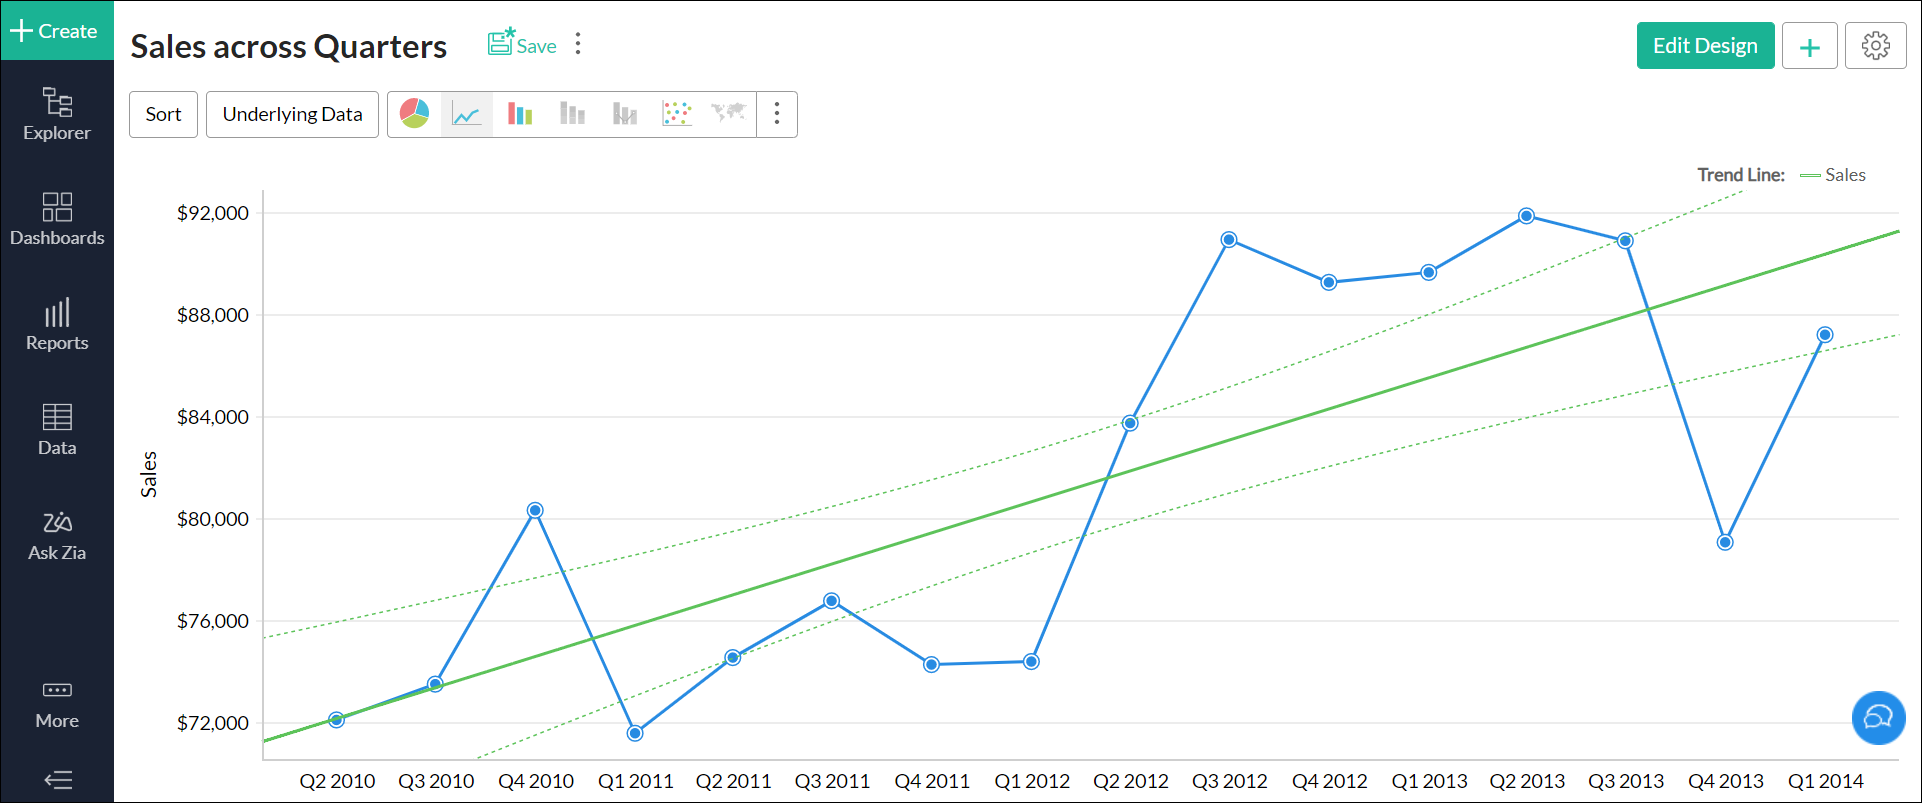
Introducing enhancements to Ask Zia
EnhancementThe following enhancements have been made to Ask Zia:
- The AI assistant can now understand questions that are grammatically unstructured or incomplete.
- Ask Zia now features typo tolerance, to understand words that are spelled incorrectly.
- Ask Zia can now interpret the mathematical function that is best suited for your question.
- The AI assistant's knowledge of dates is now enhanced - the term "weekend" and the abbreviated versions of months can now be used.
Click here to learn more
Support for date-based lookup column
EnhancementAnalytics Plus now allows you to configure a date column as a lookup column between two tables. Click here to learn more
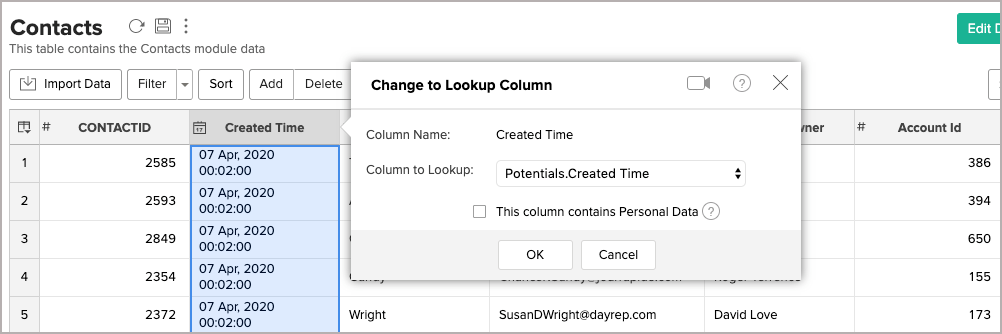
Introducing enhancements to charts
EnhancementThe following enhancements have been made to charts:
1. A new chart type has been introduced: Histogram. Click here to learn more
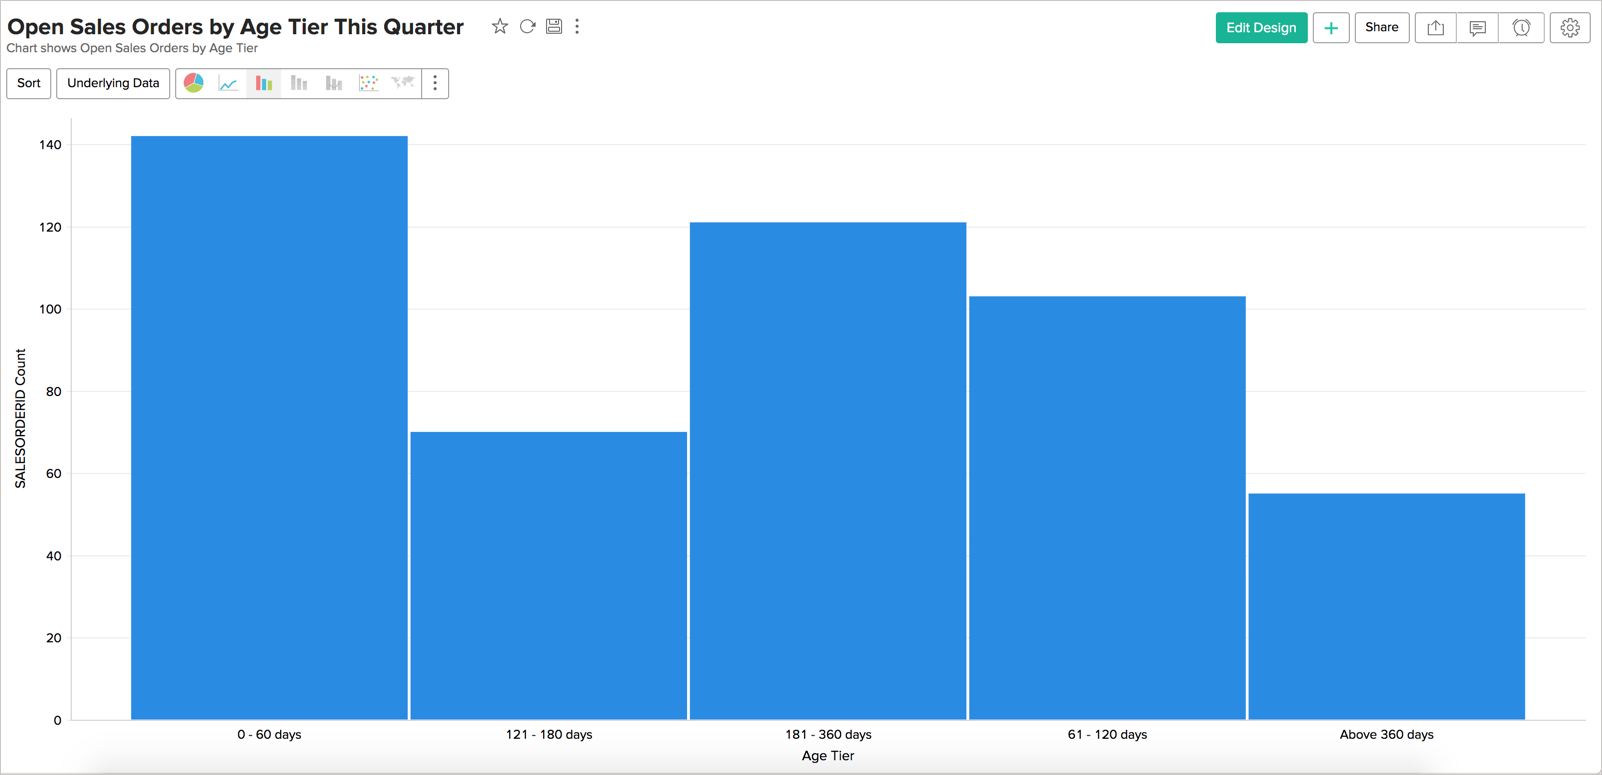
2. You can now apply patterns to your charts, and choose from a range of pre-built ones or create your own. Click here to learn more
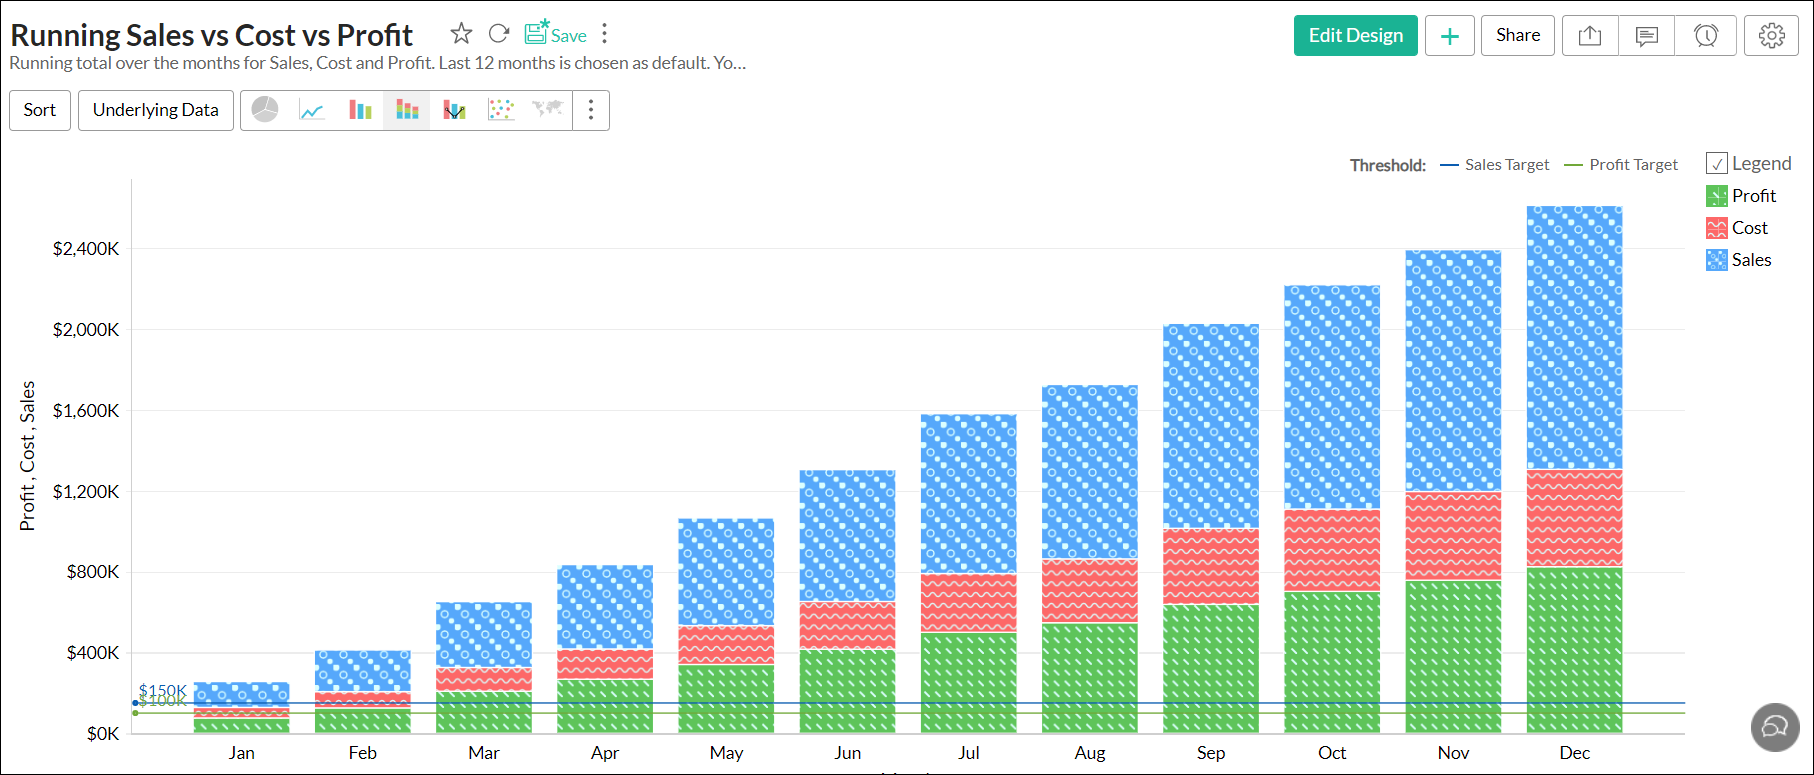
3. You can now create a 100% stacked bar chart, and charts with horizontal stacked bars that can have multiple Y axes.
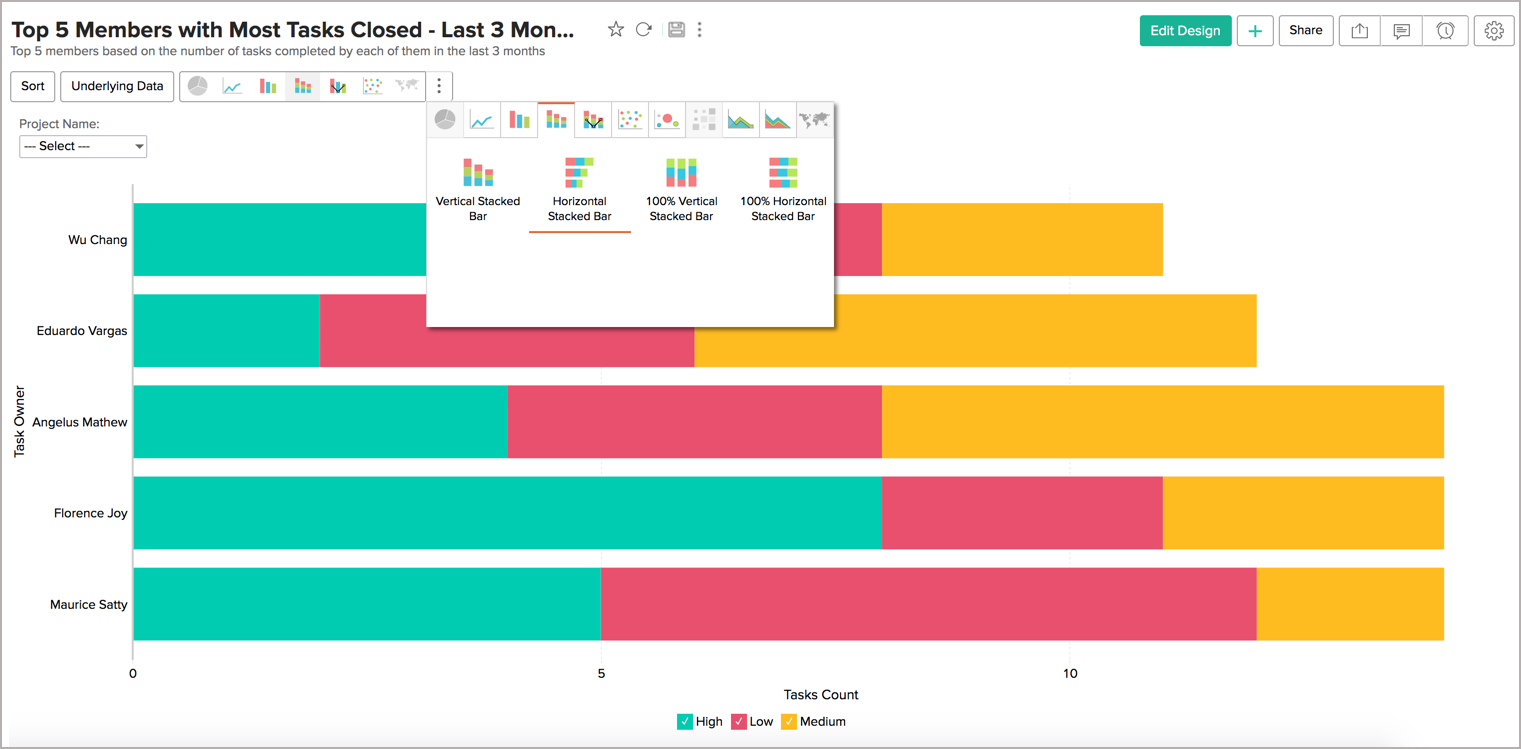
4. Analytics Plus allows you to switch your chart's axis dynamically, to view the chart per your requirements. Click here to learn more
5. You can now choose to disable the Dynamic Drill Down option in charts. Click here to learn more
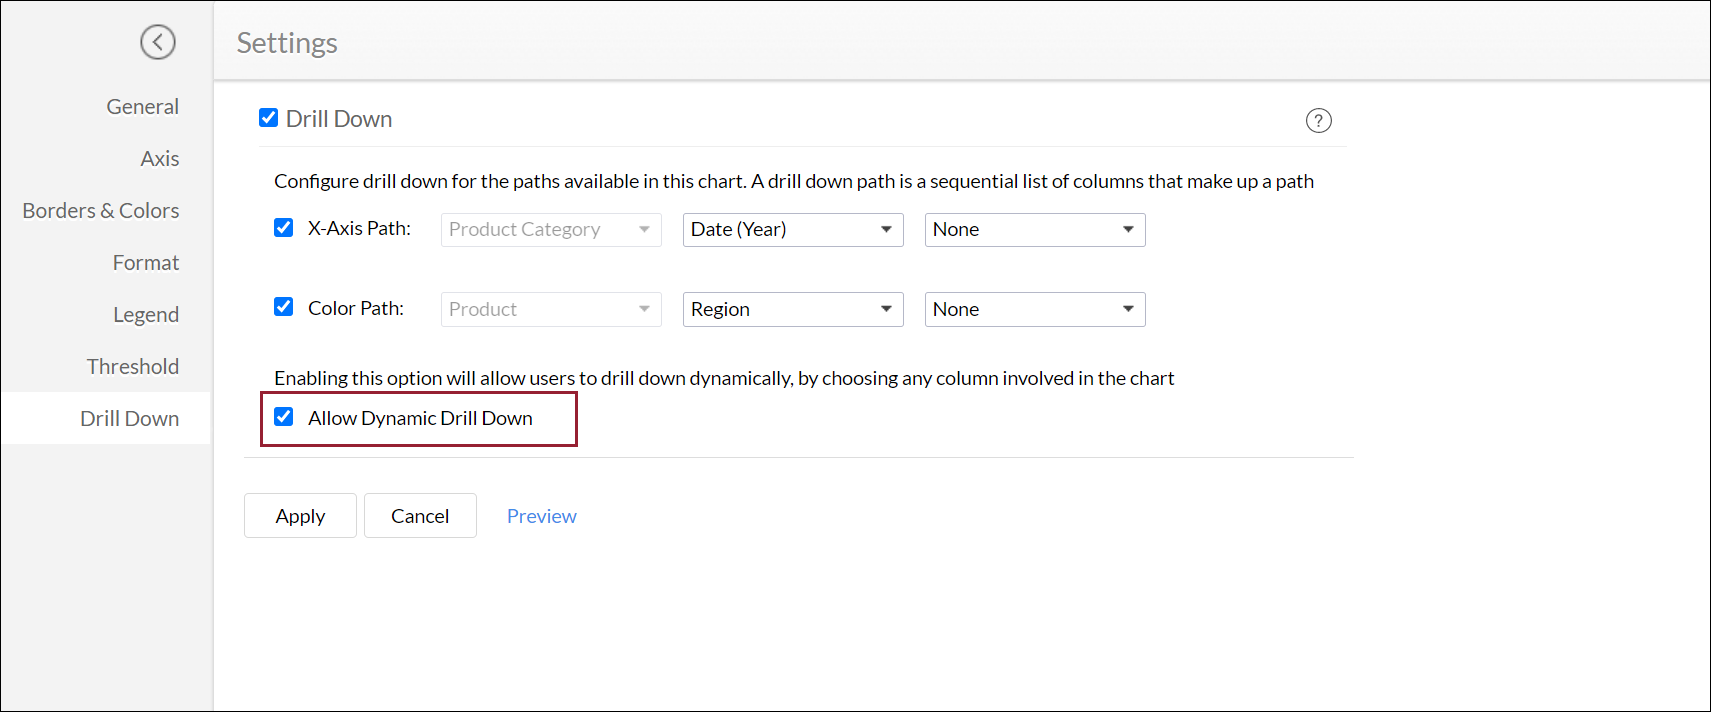
Introducing enhancements to pivot views
EnhancementThe following enhancements have been made to pivot views:
1. You can now hide specific columns in pivot views easily. Click here to learn more
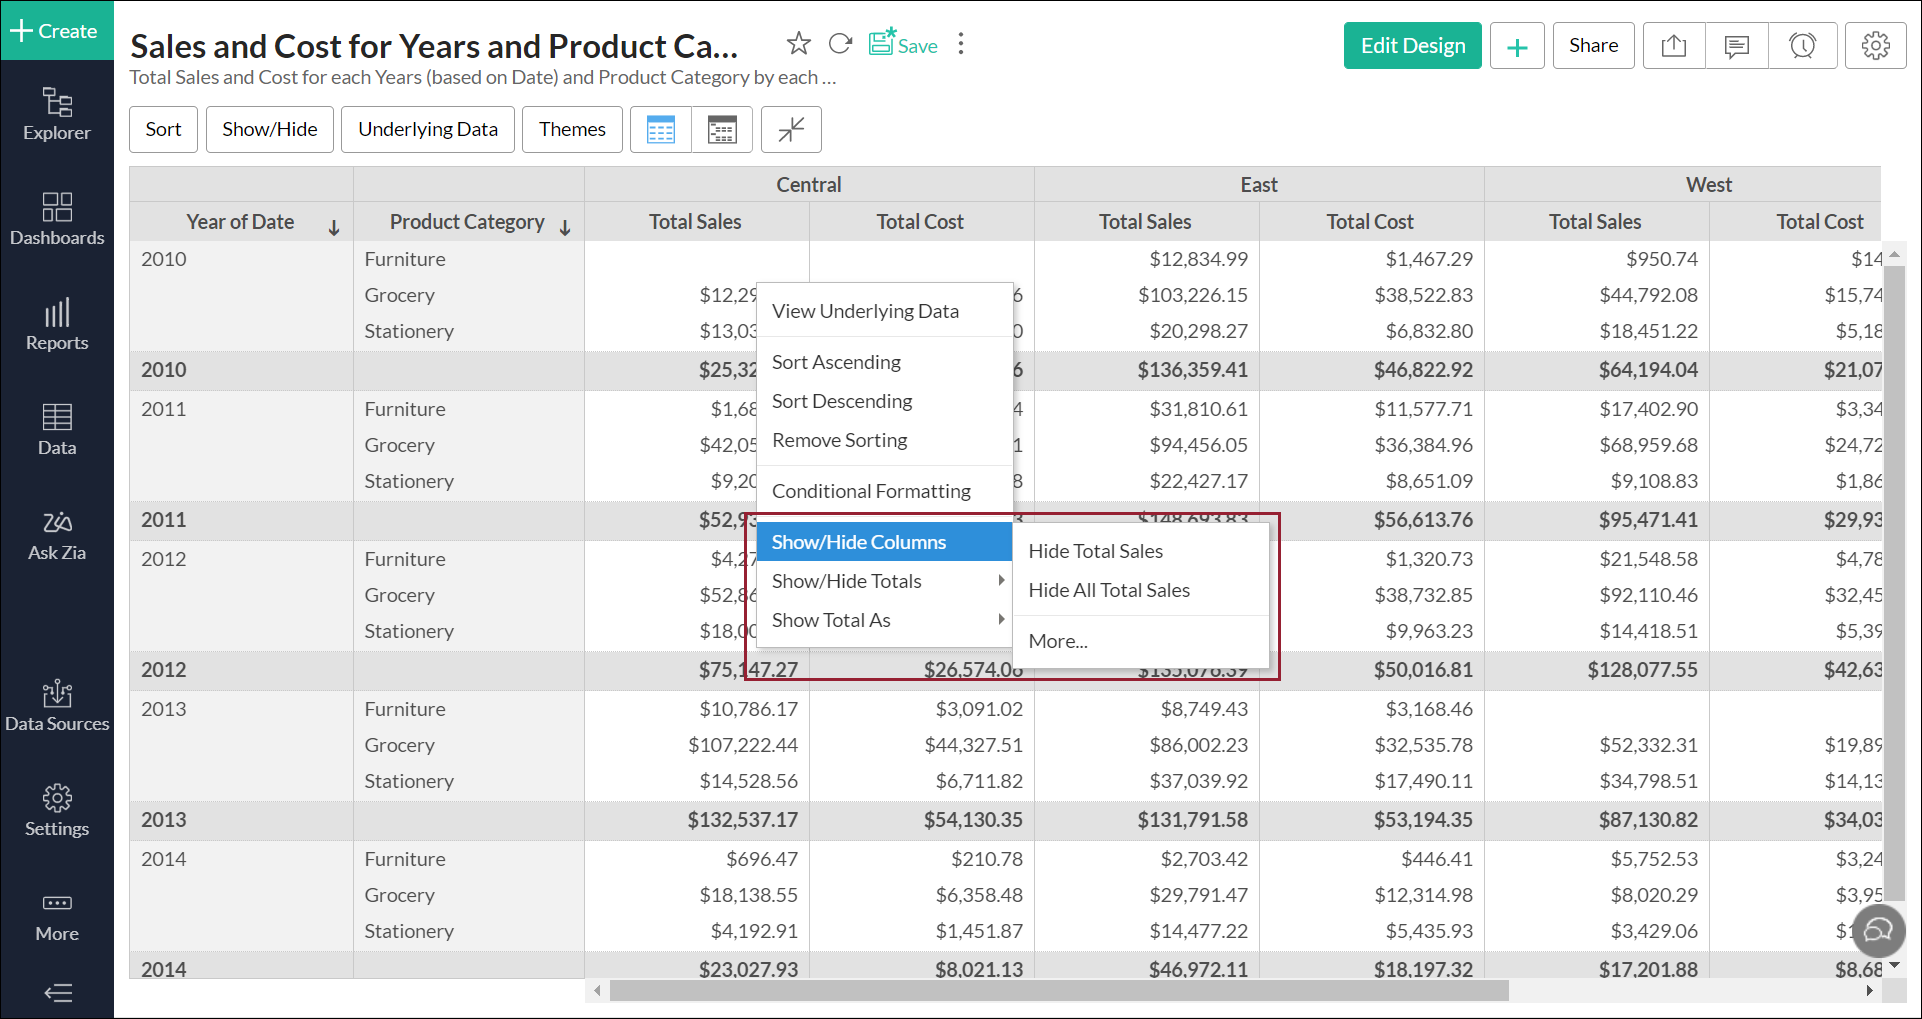
2. You can now expand and collapse the rows, columns and cells in your pivot views. Click here to learn more
Introducing enhancements to sharing and publishing options
EnhancementThe following enhancements have been made to the sharing and publishing functionality:
1. You can now request access to views that haven't been shared with you. Click here to learn more
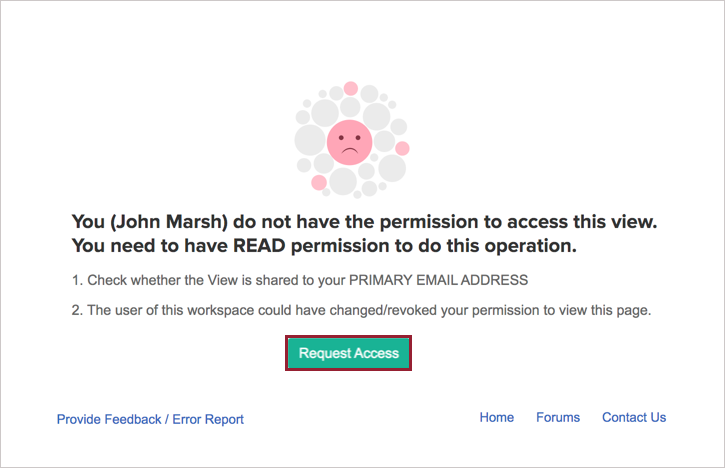
2. Analytics Plus now allows you to set expiration dates for views that are published without login credentials Click here to learn more
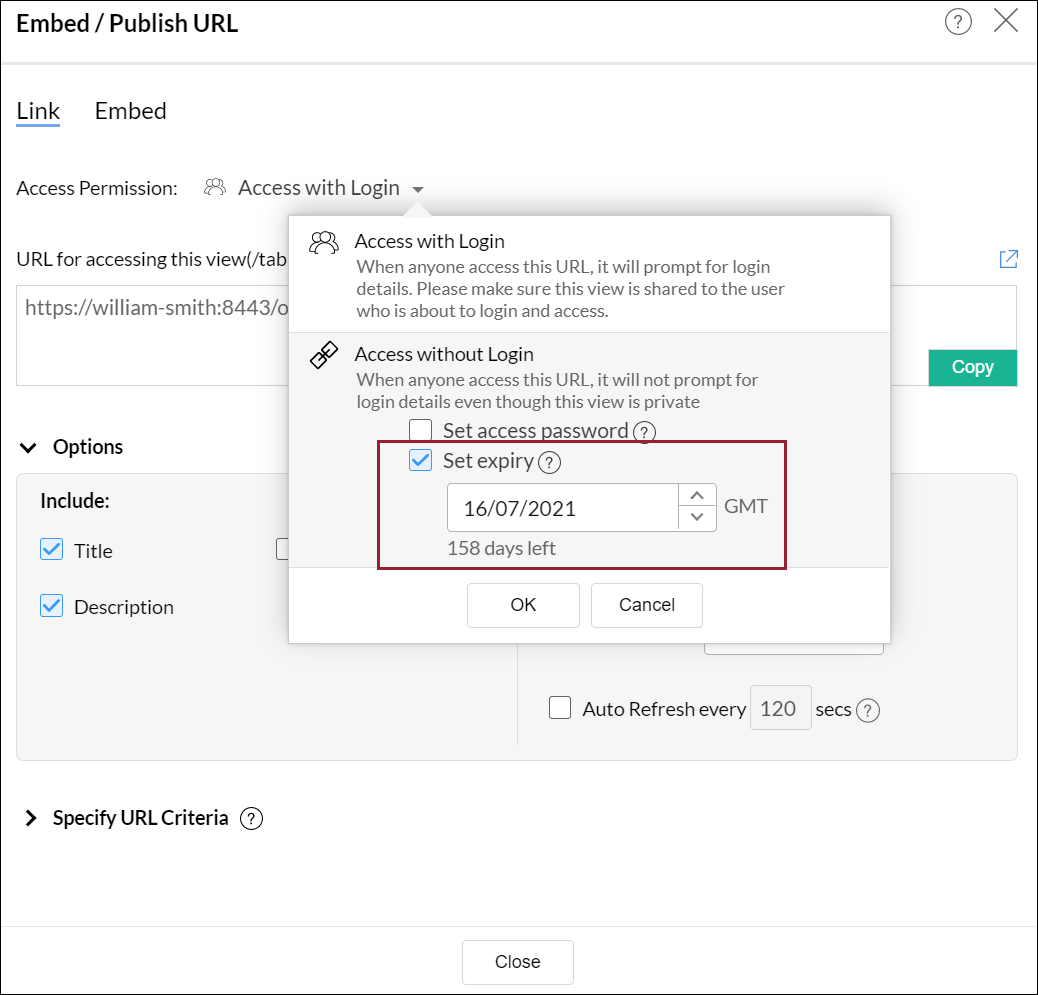
3. While publishing a table, you can now choose to publish only selective columns from that table. Click here to learn more
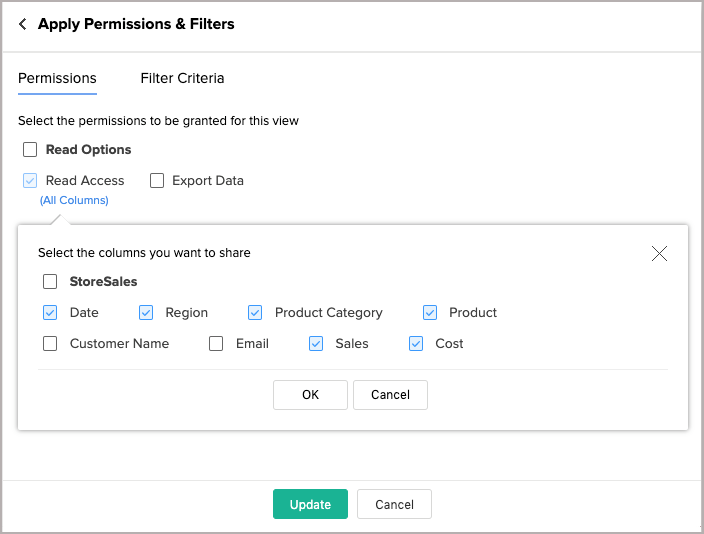
4. The Export and Email dialog boxes have been revamped for easier navigation. Click here to learn more
Introducing enhancements to Explorer view
EnhancementThe following enhancements have been made to the Explorer View:
1. You can convert a parent folder to a sub-folder, and vice versa. Click here to learn more
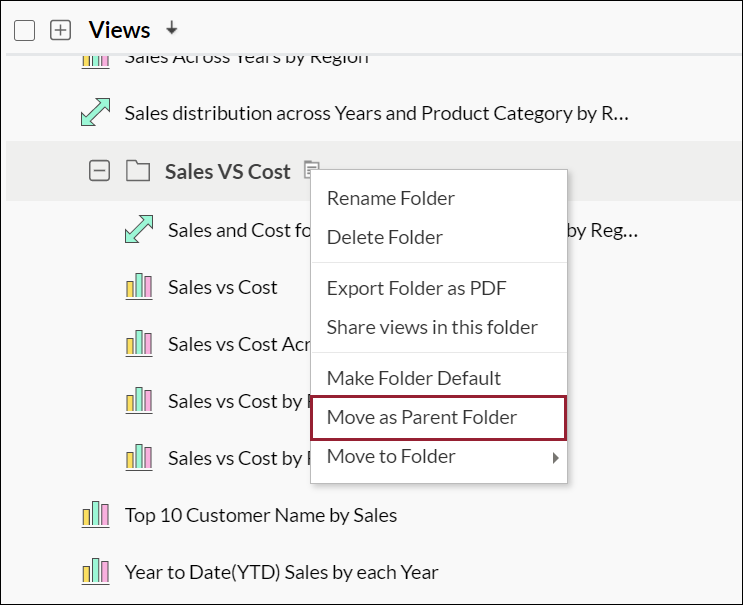
2. You can now mark sub-folders as default folders in your workspace. Click here to learn more
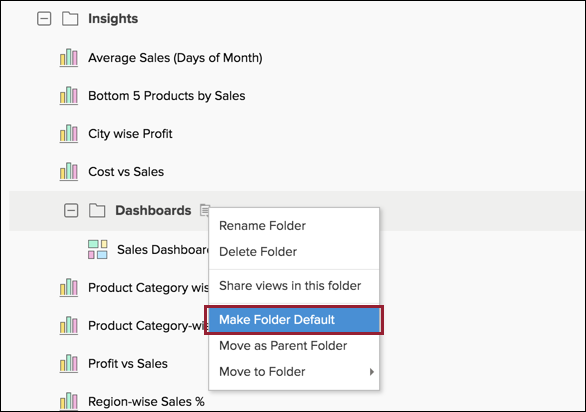
Bookmark views easily
EnhancementYou can now bookmark important views when accessing them, using the icon found beside the view's name.
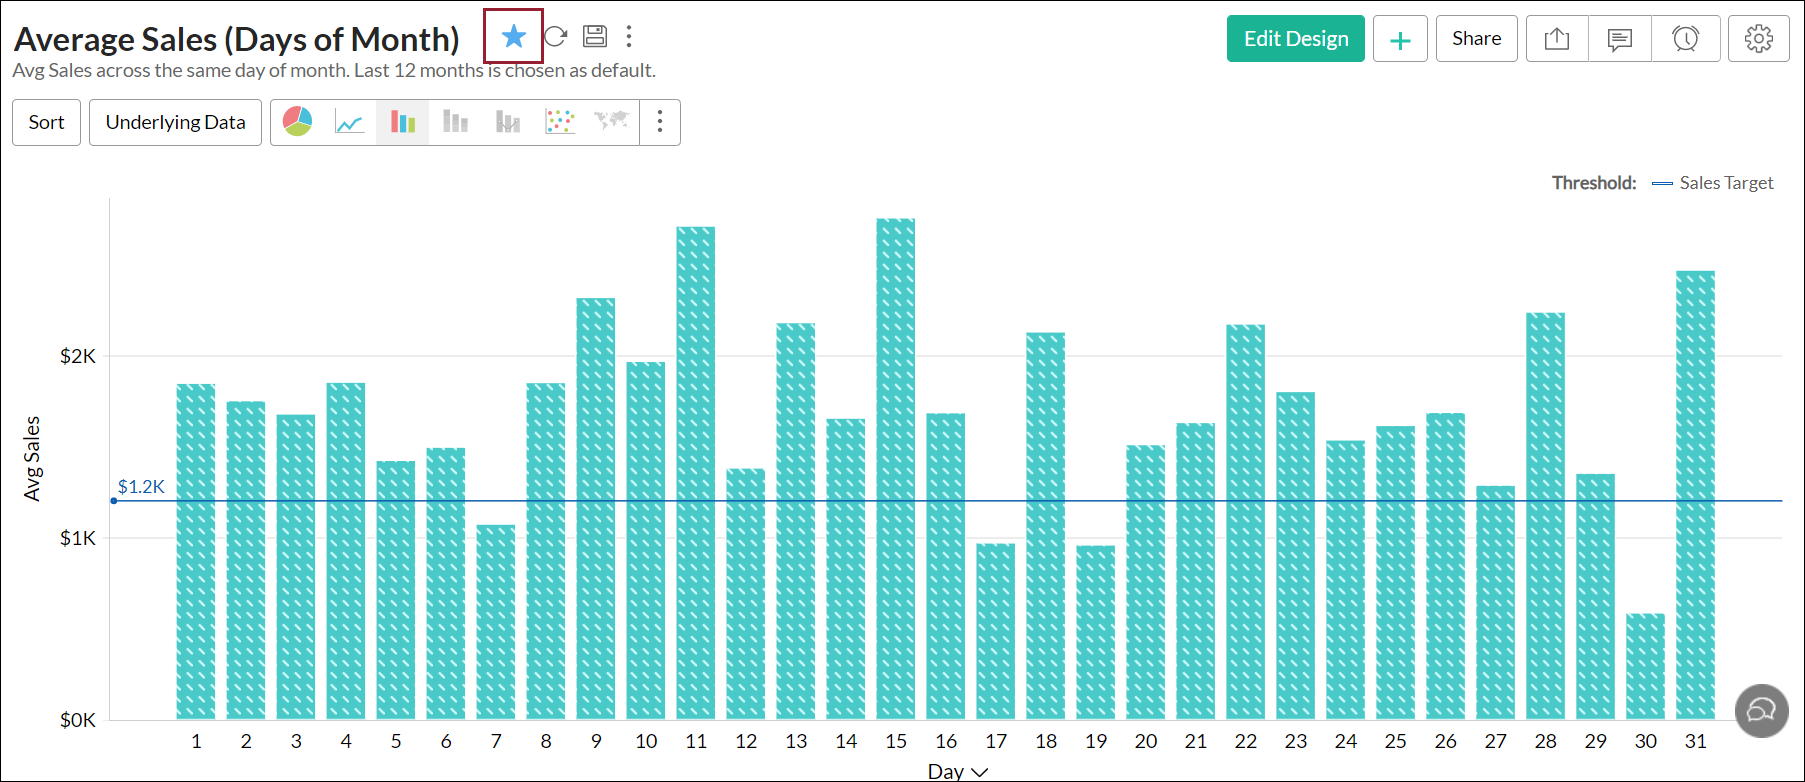
Introducing enhancements to user filters
EnhancementThe following enhancements have been made to user filters:
- The existing List only relevant values option can now be used to configure cascading user filters, wherein the subsequent user filter's values are dependent on the preceding user filter's value.
- Conversely, the Show All option can be selected to list every value in the subsequent user filter, regardless of the preceding user filter's value.
Click here to learn more
Issues fixed
Issues fixed- Encryption issues with the keystore password stored in the server.xml file in the /conf directory has now been fixed.
Note: For Windows installations, Microsoft Visual C++ 2015-2019 will be installed automatically along with Analytics Plus if its not already available on the installation server. This is to ensure seamless support with the Analytics Plus database, and enhance its performance.
Feb
Build Number: 4595 (Release on: February 23, 2021)
Launching advanced analytics for Endpoint Central's Inventory module
NewAnalytics Plus now offers out-of-the-box analytics for hardware and software inventory modules in Endpoint Central. Click here to learn more.
Issues fixed
Issues fixed- The Cross-Site Scripting (xss) vulnerability in the workspace name field is now fixed.
2020
Nov
Build Number: 4590 (Release on: November 12, 2020)
Launching advanced analytics for additional metrics in OpManager
NewManageEngine OpManager customers can now run reports on device availability and interface performance. OpManager should be on build 125215 or above for these reports to work. Click here to learn more.
Introducing support for stored procedures
NewYou can now invoke stored procedures to import data from specific databases. Click here to learn more.
Oct
Build Number: 4580 (Release on: October 19, 2020)
Concurrent Viewers license category is now renamed
EnhancementThe existing Concurrent Viewers license category has been renamed as Concurrent Guests. This is only a name change with no change in functionality.
Sep
Build Number: 4570 (Release on: September 01, 2020)
Introducing support for additional modules in SupportCenter Plus
NewAnalytics Plus now offers out-of-the-box analytics for SupportCenter Plus' Billing, Tasks, Time Analysis (which covers changes in Ticket Status, Support Group and Support Reps), Time Entries, and Solutions modules. Click here to learn more.
Note: Existing Analytics Plus users should upgrade to Analytics Plus build 4570 and SupportCenter Plus build 11000 to enable these reports.
Aug
Build Number: 4560 (Release on: August 13, 2020)
Introducing Standard license
NewIntroducing the Standard edition - a new multi-user edition that supports data import from any one of the available data sources. Click here to learn more.
The Personal edition now supports data import only from files/feeds, local and cloud databases, and allows users to analyze a total data volume of 10K rows.
July
Build Number: 4550 (Release on: July 20, 2020)
Database upgrade
EnhancementThe Analytics Plus database is upgraded from PostgreSQL version 9.6 to version 11.7.
June
Build Number: 4510 (Release on: June 24, 2020)
Issues fixed
Issues fixed- Issues with variables, and e-mails scheduled with the Apply corresponding share filter criteriaoption, prevented users from upgrading to build 4500. Those users can now upgrade to build 4510.
Note: The Apply corresponding share filter criteria option will now be disabled while scheduling e-mails, if there is no filter criteria specified in the report. When new filter criteria are added, ensure this option is selected to apply the corresponding filters in the scheduled e-mail.
May
Build Number: 4500 (Release on: May 28, 2020)
Introducing Wildcard filters
NewYou can now construct filter criteria with multiple string conditions to filter the data in your reports. You can choose between matching conditions based on AND/OR rules. Click here to learn more.
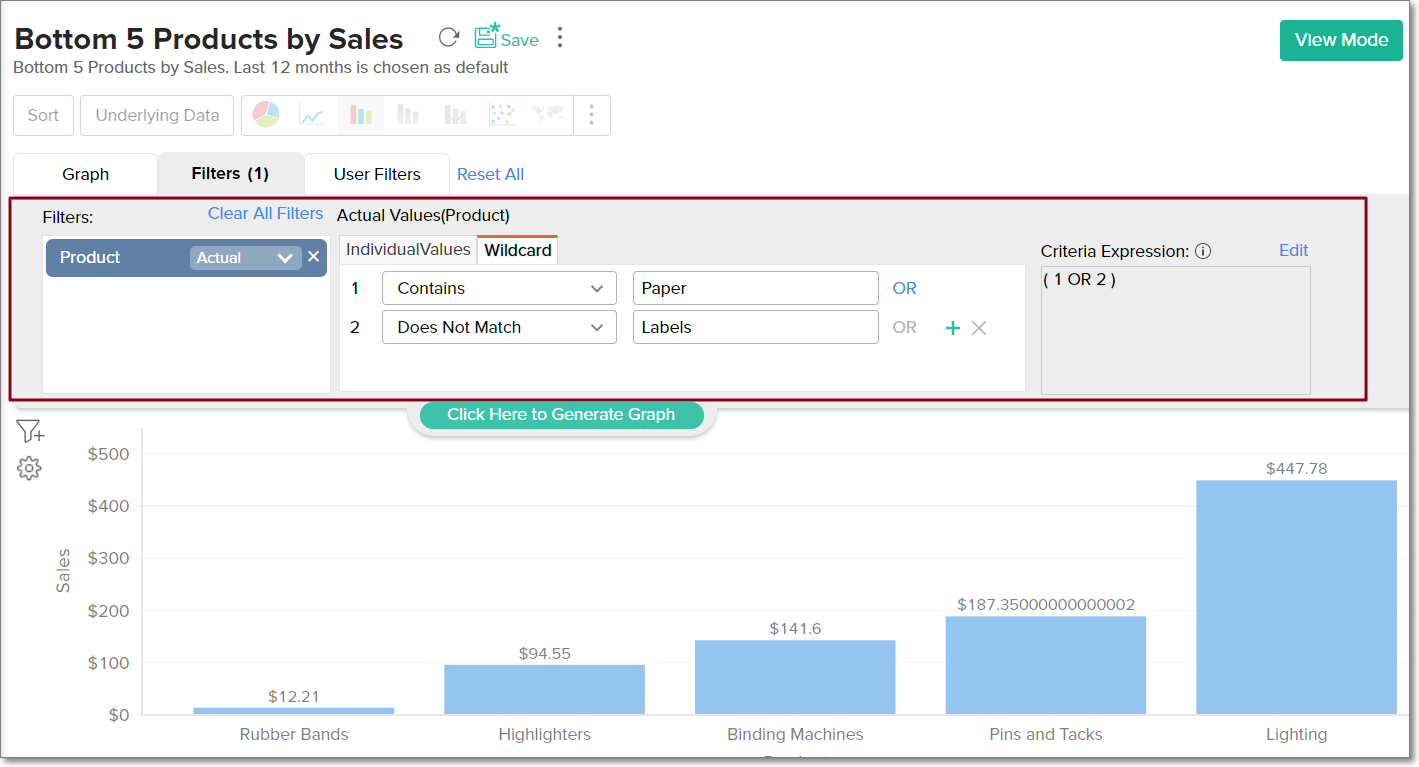
Create data snapshots with forecasted values
EnhancementEasily create Data Snapshots of charts containing forecasted values. Click here to more about data snapshots.
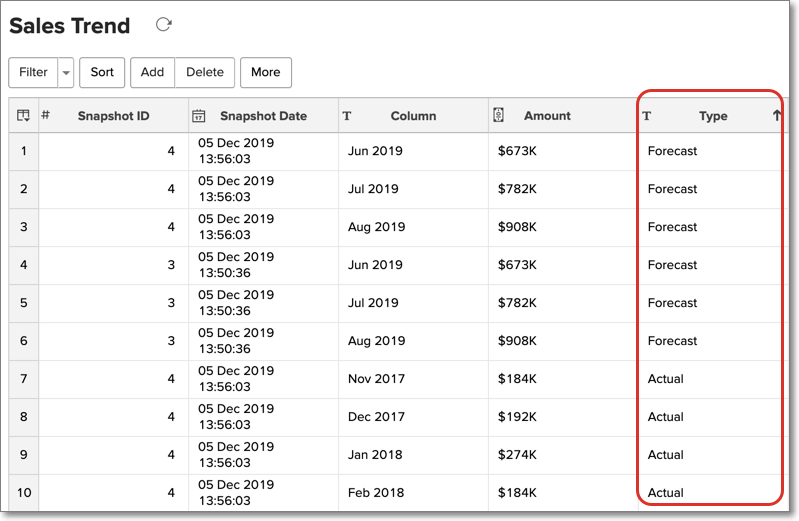
Auto-generate reports over a table's related data
EnhancementAuto-generate reports over data from both the selected table and its connected tables easily, using the Similar to Another Table feature.
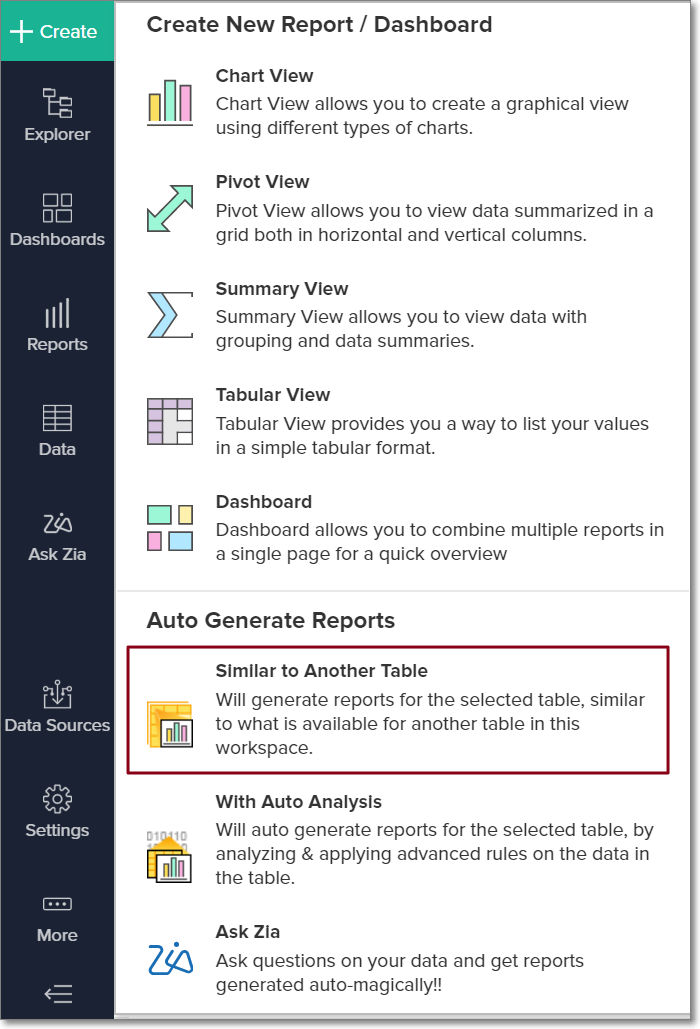
Pivot or unpivot your data tables easily
EnhancementThe below keywords are now supported while creating query tables:
- Pivot: Converts rows into columns by turning the unique values in the input column to multiple output columns.
- Unpivot: Converts columns into rows by changing multiple columns to values in a single row.

Customize alignment of KPI widgets
EnhancementYou can now customize a KPI widget's alignment in a dashboard easily.
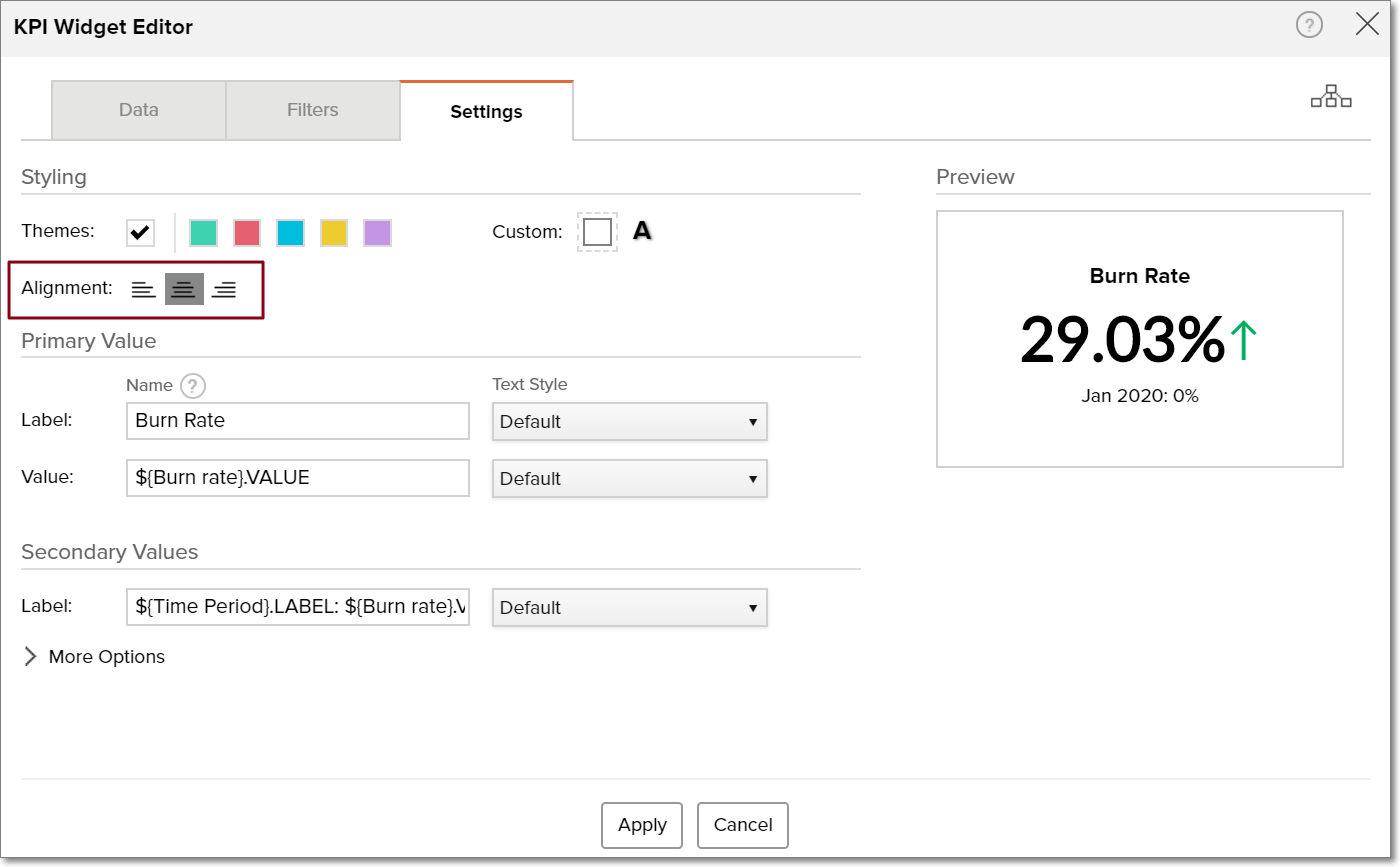
Introducing enhancements to charts
EnhancementThe following enhancements have been made to charts:
1. Choose to display legends with or without their corresponding values, and customize their format. Click here to learn more.
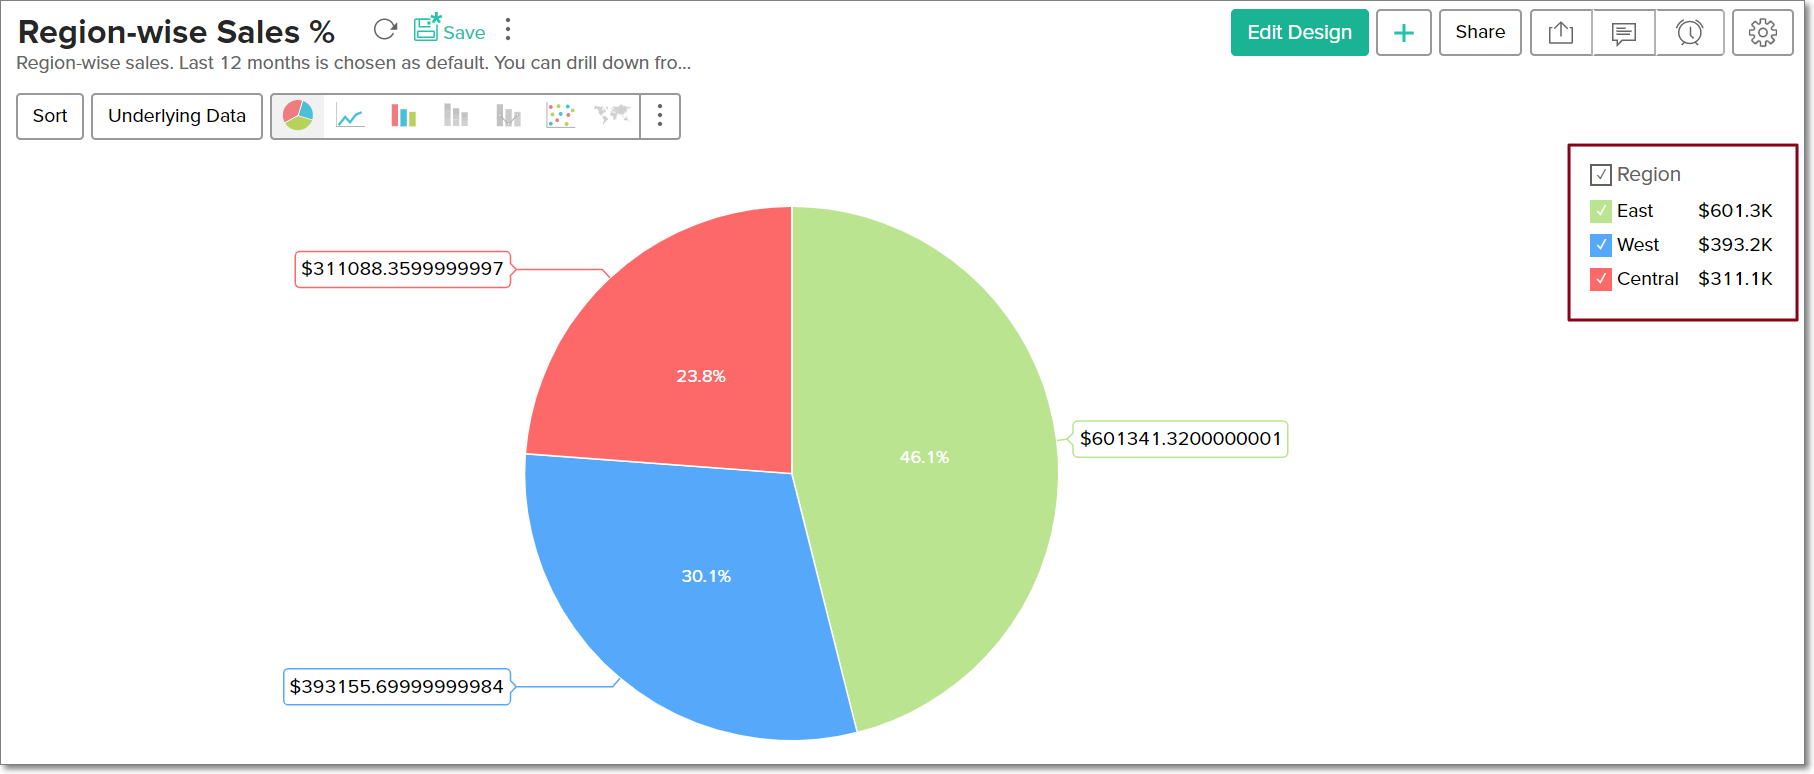
2. You can now plot charts with percentile function applied over the numeric data. Click here to learn more.
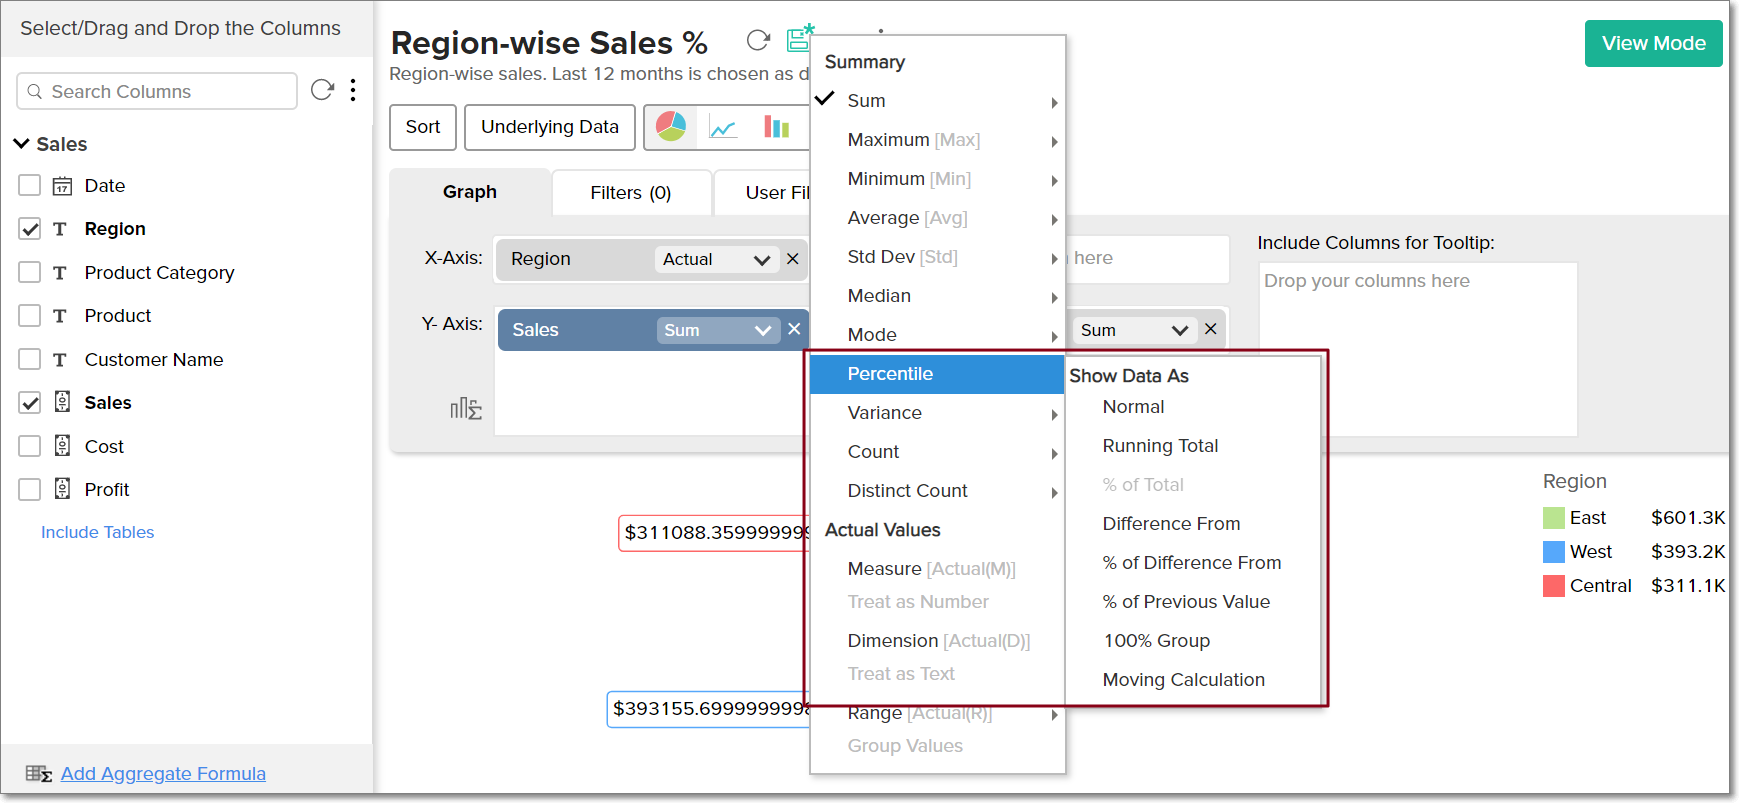
Introducing enhancements to Explorer view
EnhancementThe following enhancements have been made to the Explorer View:
1. Select and move multiple views across folders in a workspace.
2. Move sub-folders from one parent folder to another, and make parent folders as sub-folders within another folder.
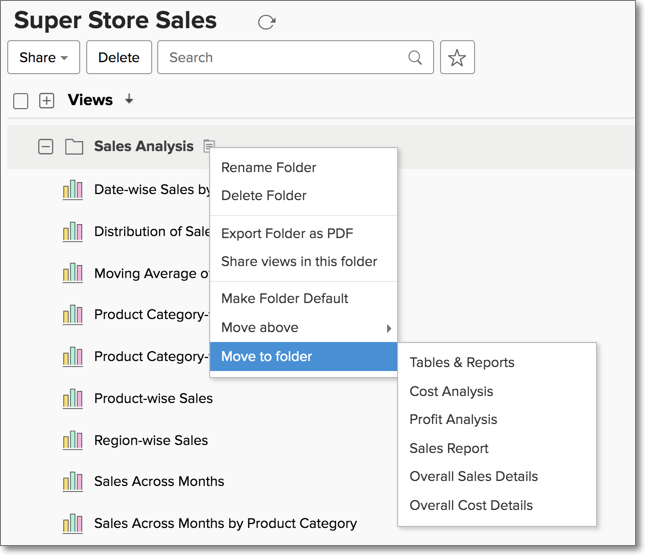
3. You can now bookmark important views from the Reports and Dashboards section in the side panel.
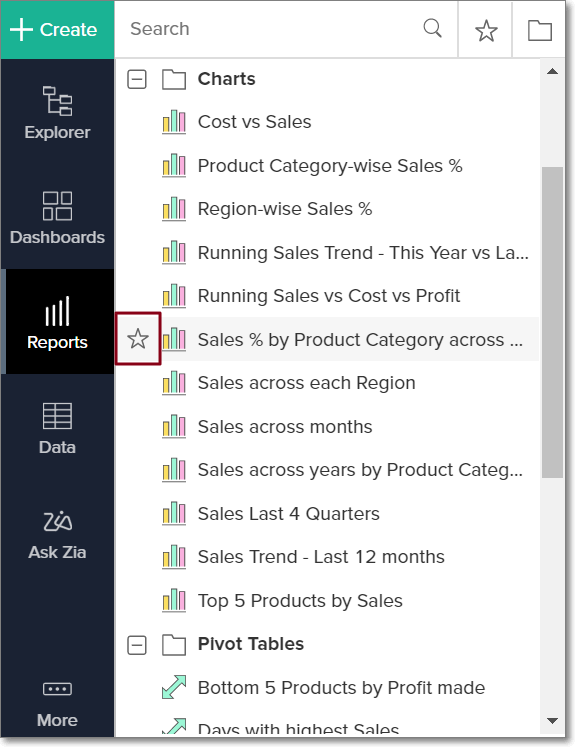
4. Creating new views is now easier, with options to create tables, reports, and dashboards from the respective sections in the side panel.
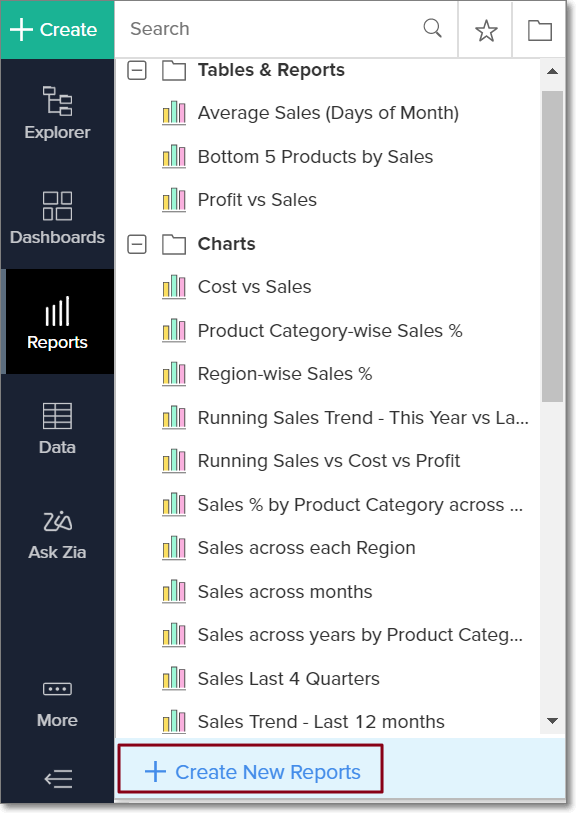
Introducing enhancements to collaboration features
EnhancementThe following enhancements have been made to the collaboration features:
1. The various collaboration options are now grouped under the common Share button. Click here to learn more about sharing.
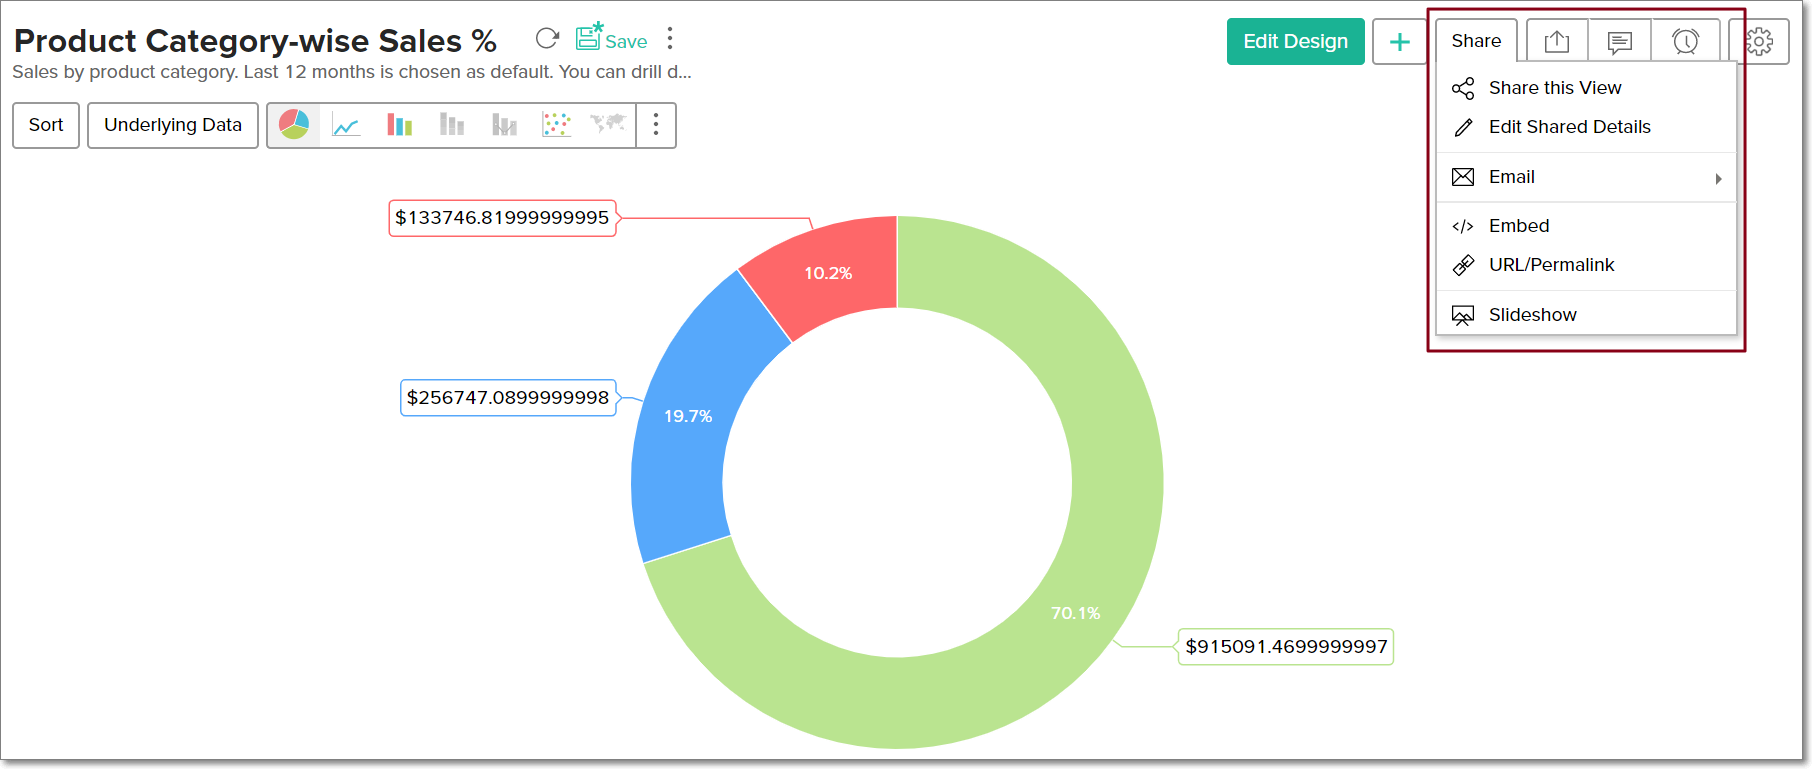
2. You can now email filtered views to multiple users and groups. Click here to learn more about emailing views.
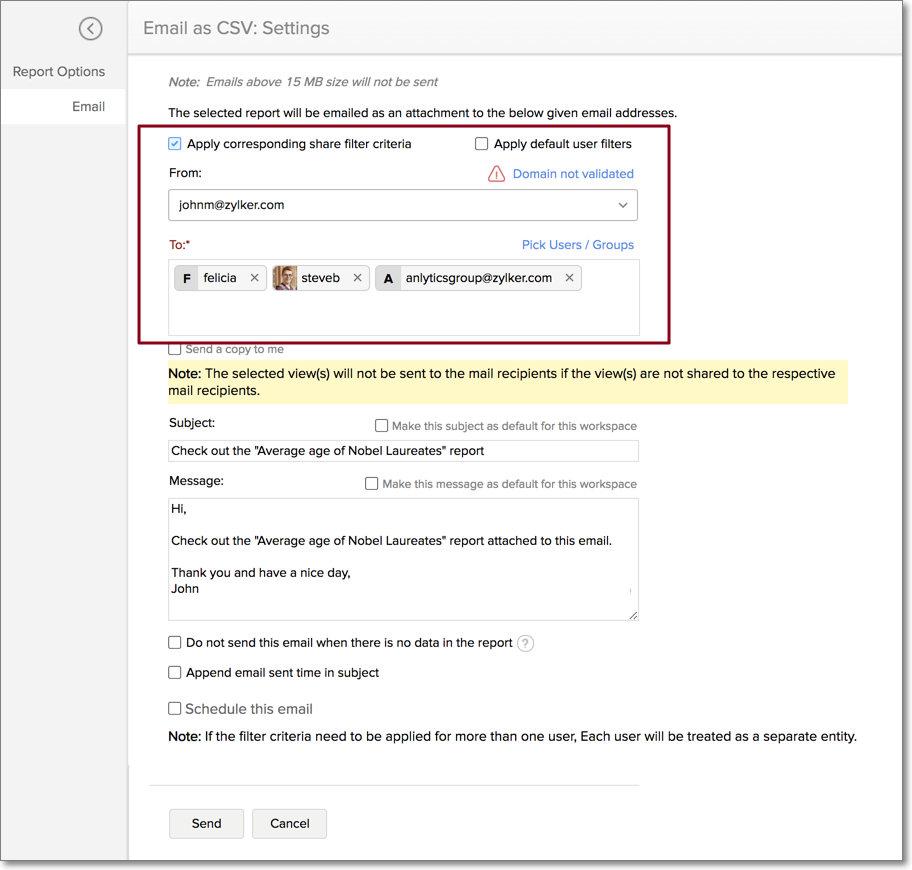
3. The Embed and Publish URL screen has been revamped to facilitate easy access.
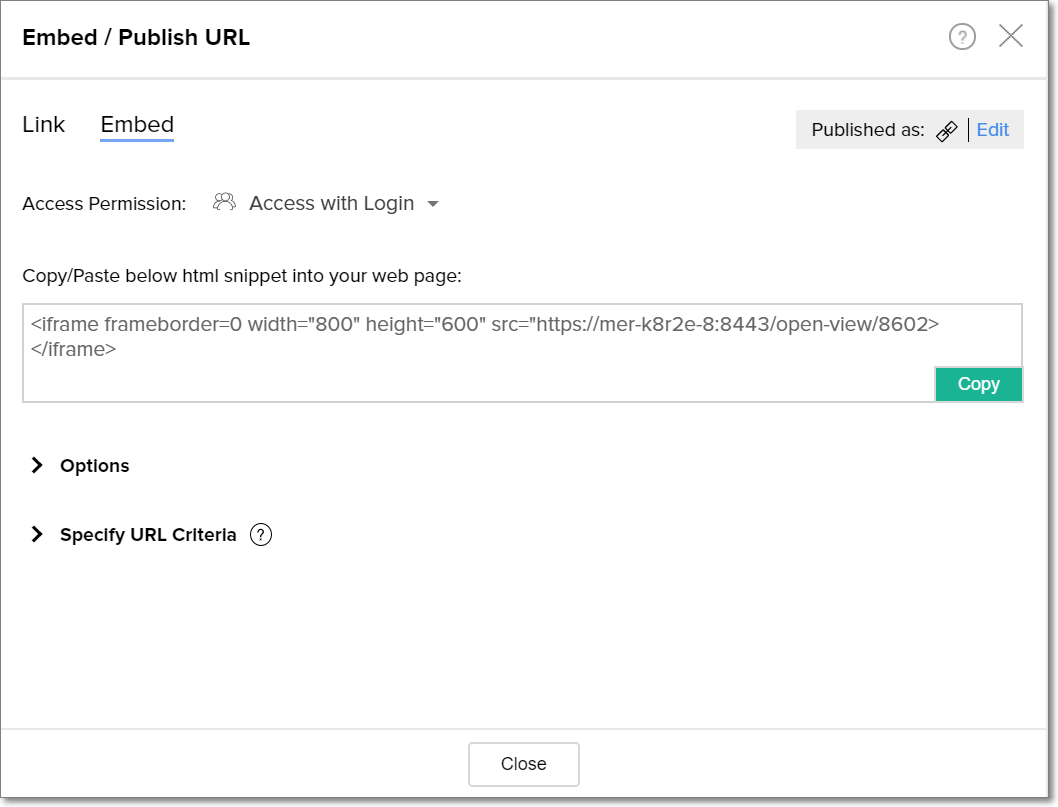
Issues fixed
Issues fixed- The authentication process for the Endpoint Central, Mobile Device Manager Plus, and Patch Manager Plus integrations has been changed. Click the corresponding links to know more.
- The issue that stopped the integration of Analytics Plus with OpManager build 12.4 and above is fixed.
- The issue that prevented the re-synchronization of ServiceDesk Plus, in the event of synchronization failure, is now fixed.
- On renaming the source tables imported using the live connect option, the changes will be reflected in the corresponding Analytics Plus tables on synchronization.
- Missing filters in the "Software Issues Due Today" report in Jira Software integration have been added.
- You can now expand and collapse views displayed in the grid format, from the Explorer page.
- The issue that removed the OJDBC and JTDS jars after upgrading to build 4350 and above is now fixed.
May
Build Number: 4460 (Release on: May 07, 2020)
Introducing out-of-box integration with Jira Software
NewAnalytics Plus seamlessly integrates with Jira Software Cloud and Jira Software Server, to provide a detailed analysis of your project data. Click here to learn more.
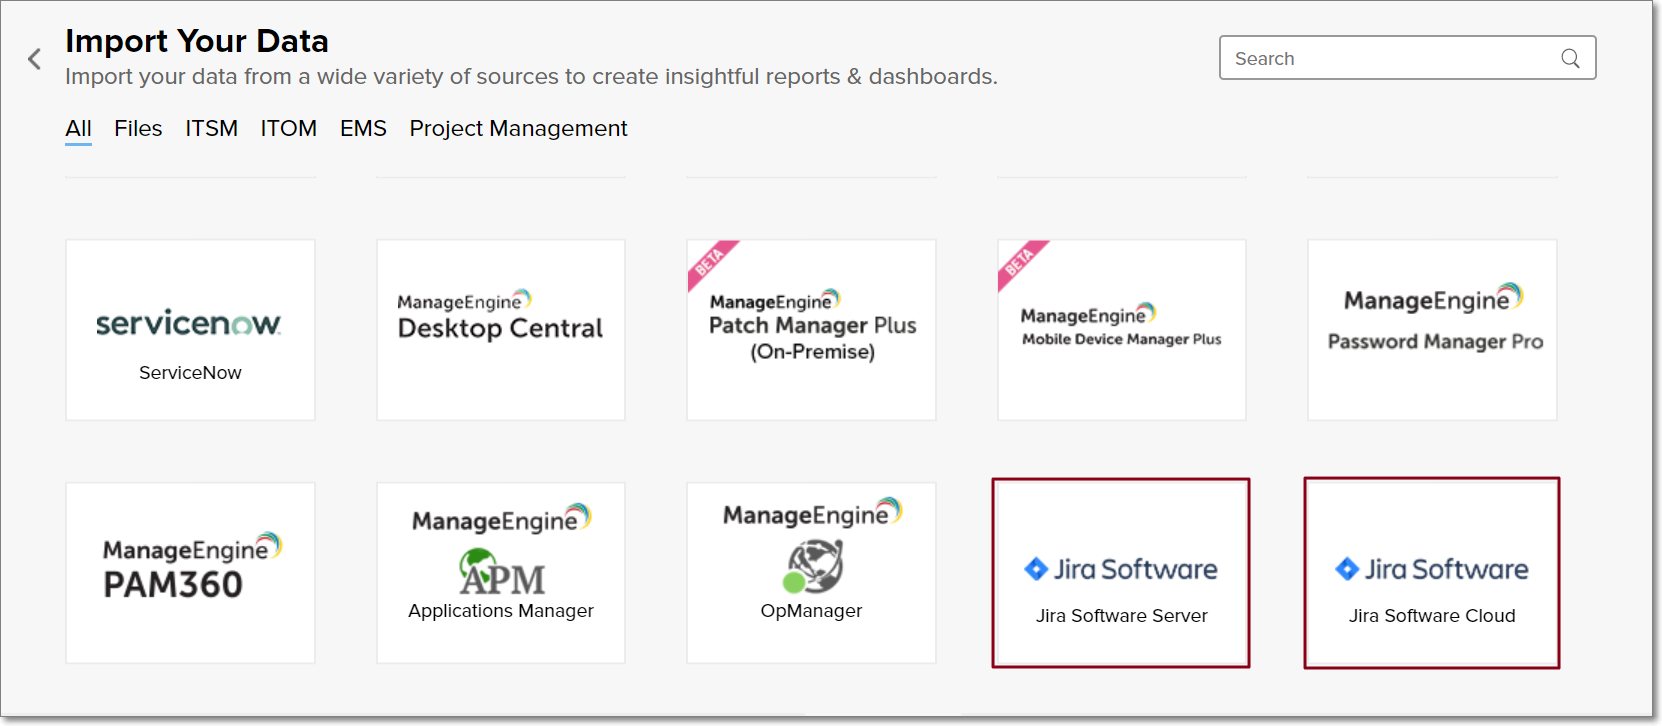
April
Build Number: 4450 (Release on: April 21, 2020)
Issues fixed
Issues fixed- Issues in Patch Manager Plus integration, due to unwanted tables being imported during the setup, have now been fixed.
April
Build Number: 4440 (Release on: April 16, 2020)
Introducing out-of-box integration with Zendesk
NewAnalytics Plus seamlessly integrates with Zendesk to facilitate out-of-the-box analytics on your help desk data. Click here to learn more.
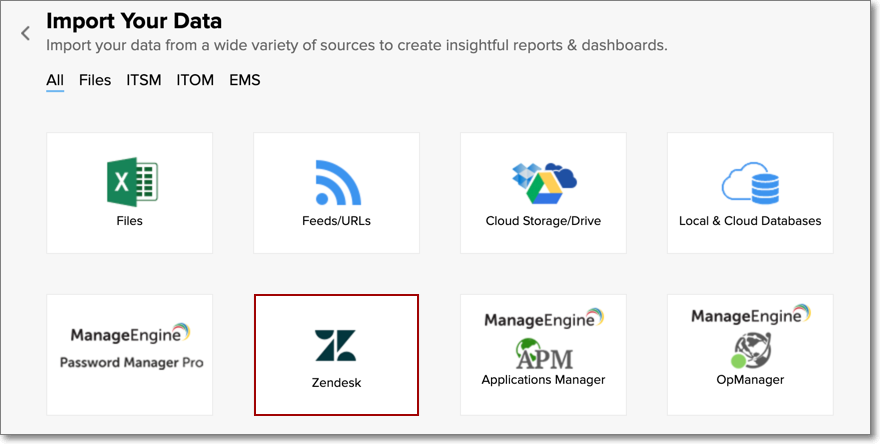
Launching advanced analytics for Applications Managers' SLA module
NewAnalytics Plus now offers out-of-the-box analytics for availability reports and the SLA module in Applications Manager. Click here to learn more.
April
Build Number: 4430 (Release on: April 06, 2020)
Introducing out-of-box integration with Patch Manager Plus (Beta)
NewAnalytics Plus integrates out-of-the-box with Patch Manager Plus, to provide a detailed analysis of your deployed patches. This is a Beta release. Click here to learn more.
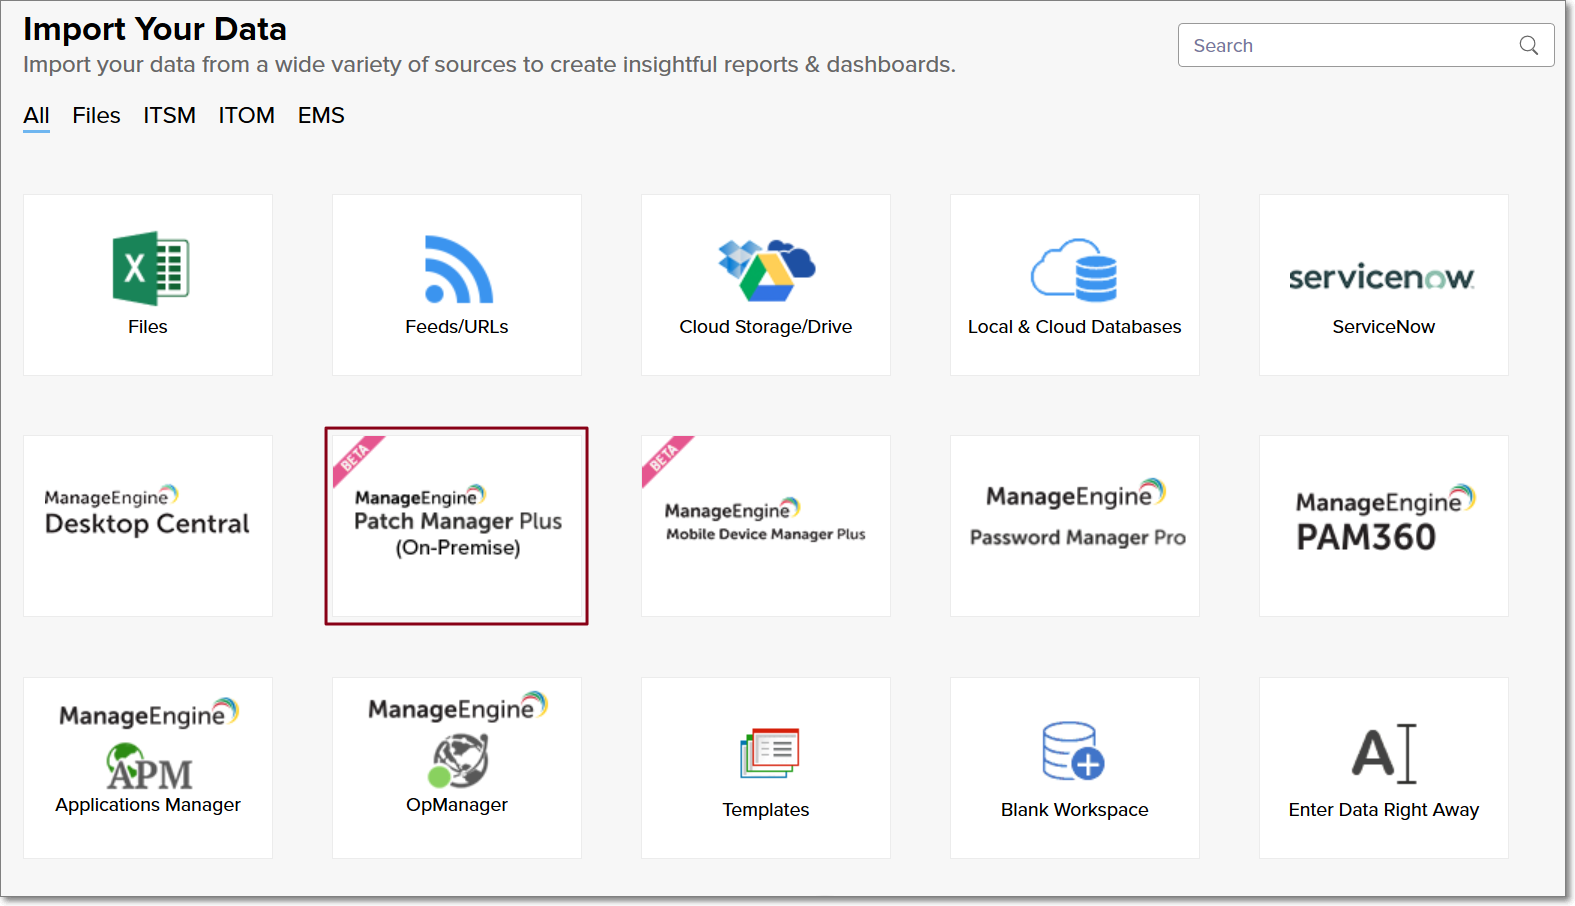
March
Build Number: 4420 (Release on: March 18, 2020)
Introducing out-of-box integration with Mobile Device Manager Plus (Beta)
NewAnalytics Plus seamlessly integrates with Mobile Device Manager Plus, to provide an in-depth analysis of your managed devices. This is a Beta release. Click here to learn more.
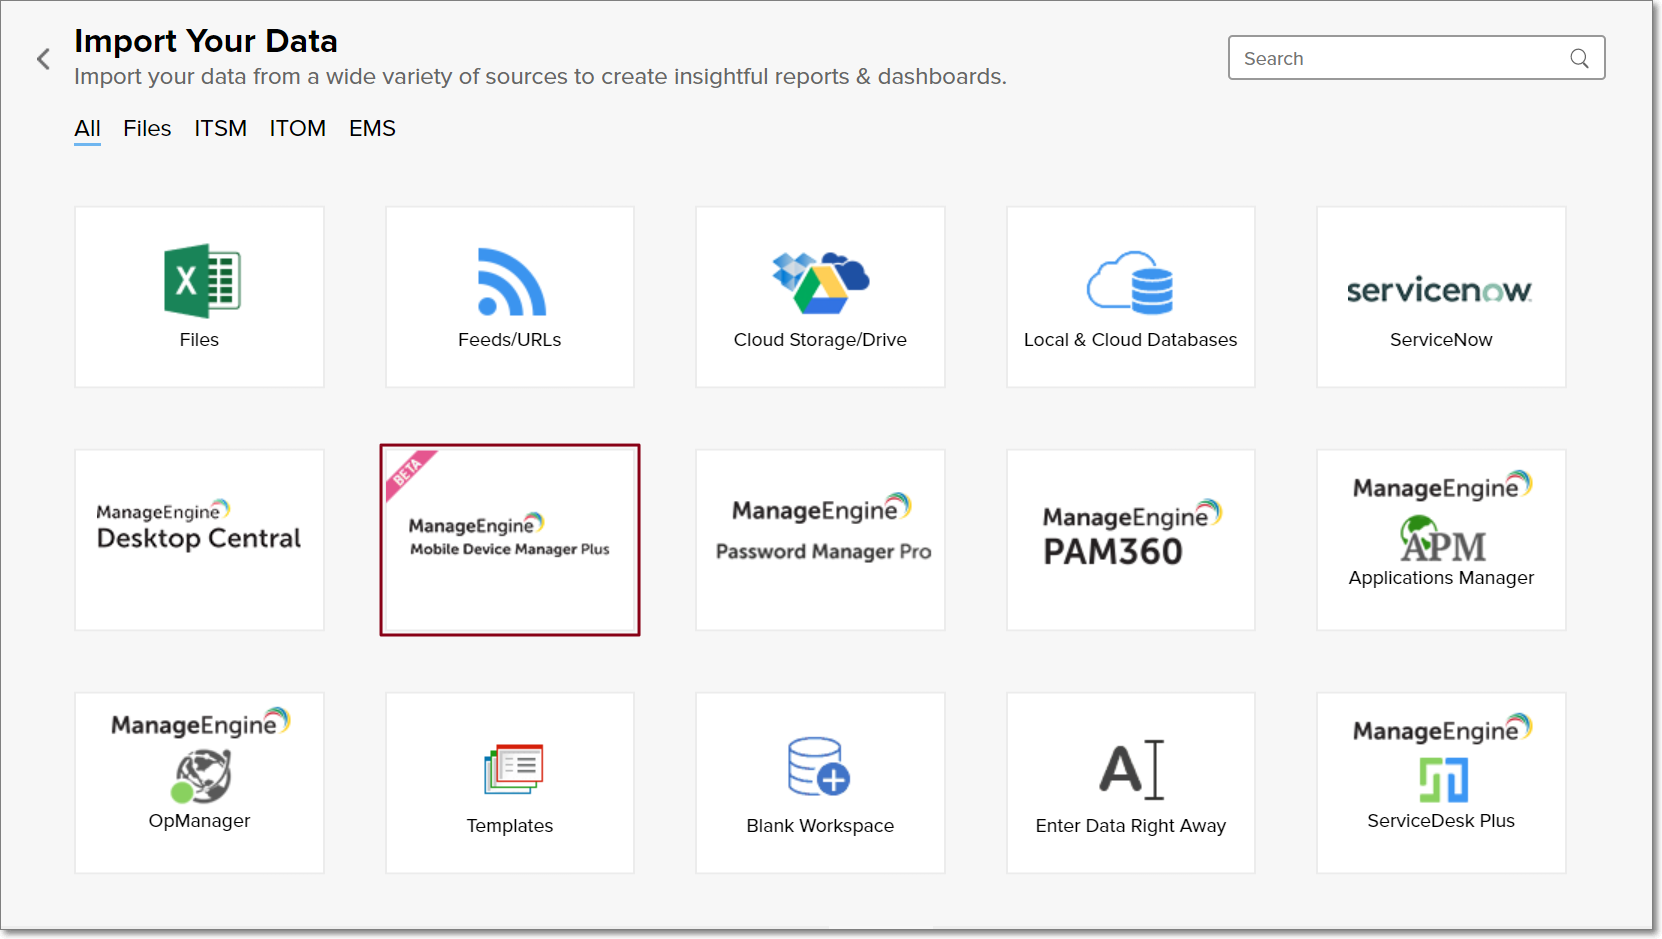
Feb
Build Number: 4410 (Release on: February 24, 2020)
Import Active Directory users
NewYou can now import users from your Active Directory, and configure single sign-on. Click here to learn more.
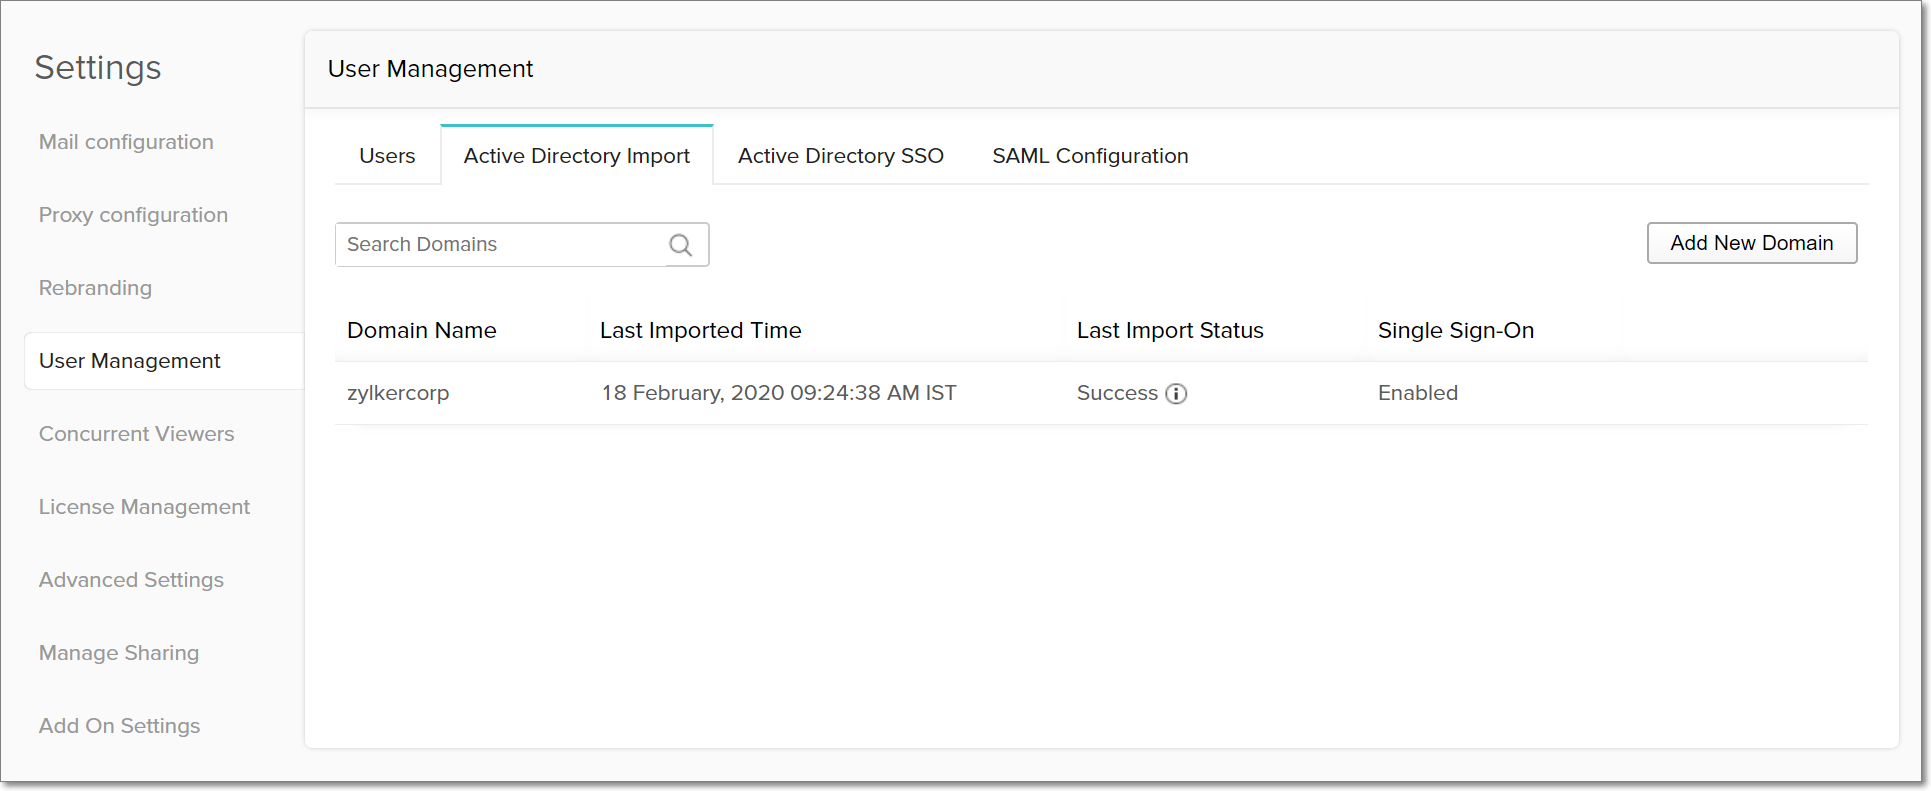
Issues fixed
Issues fixed- Issues in creating folders and sub-folders within your workspace are now fixed.
Feb
Build Number: 4400 (Release on: February 07, 2020)
Introducing Data Snapshots
NewData Snapshots in Analytics Plus allow you to capture and maintain a timeline of changes in metrics, thereby facilitating true historical report creation and analysis. Click here to learn more.
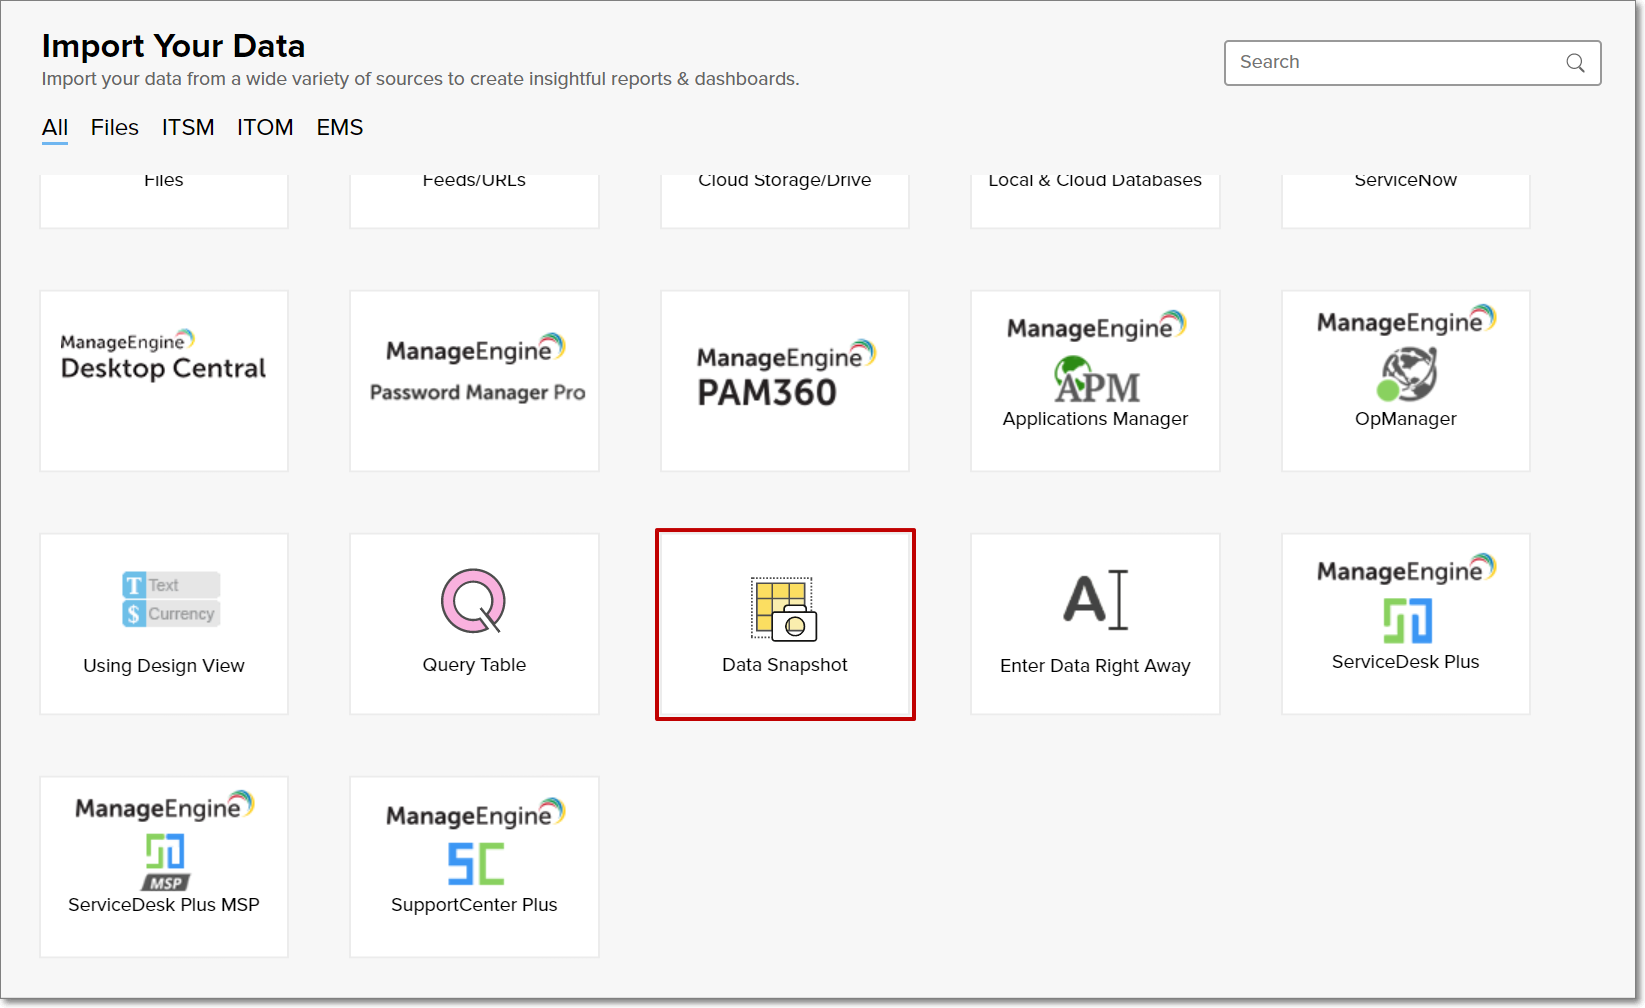
More authentication types supported for import from web feeds
EnhancementAnalytics Plus now supports the following authentication types while importing data from web feeds.
- AWS Signature
- Digest Authentication
- Hawk Authentication
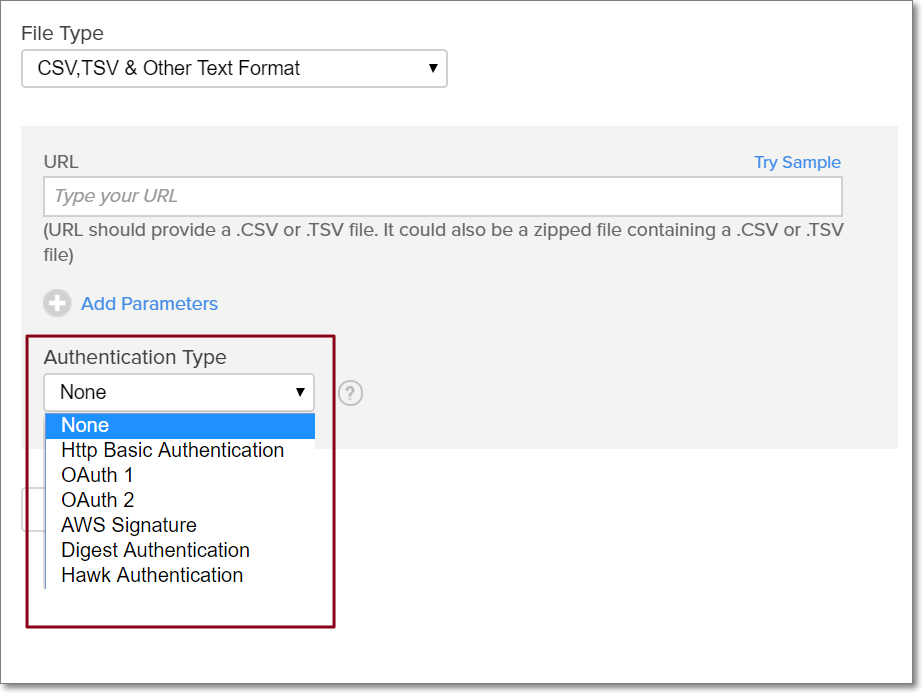
Click here to learn more.
View dependency details
EnhancementYou can now view the dependency details of a report or a table in Analytics Plus easily. Click here to learn more.
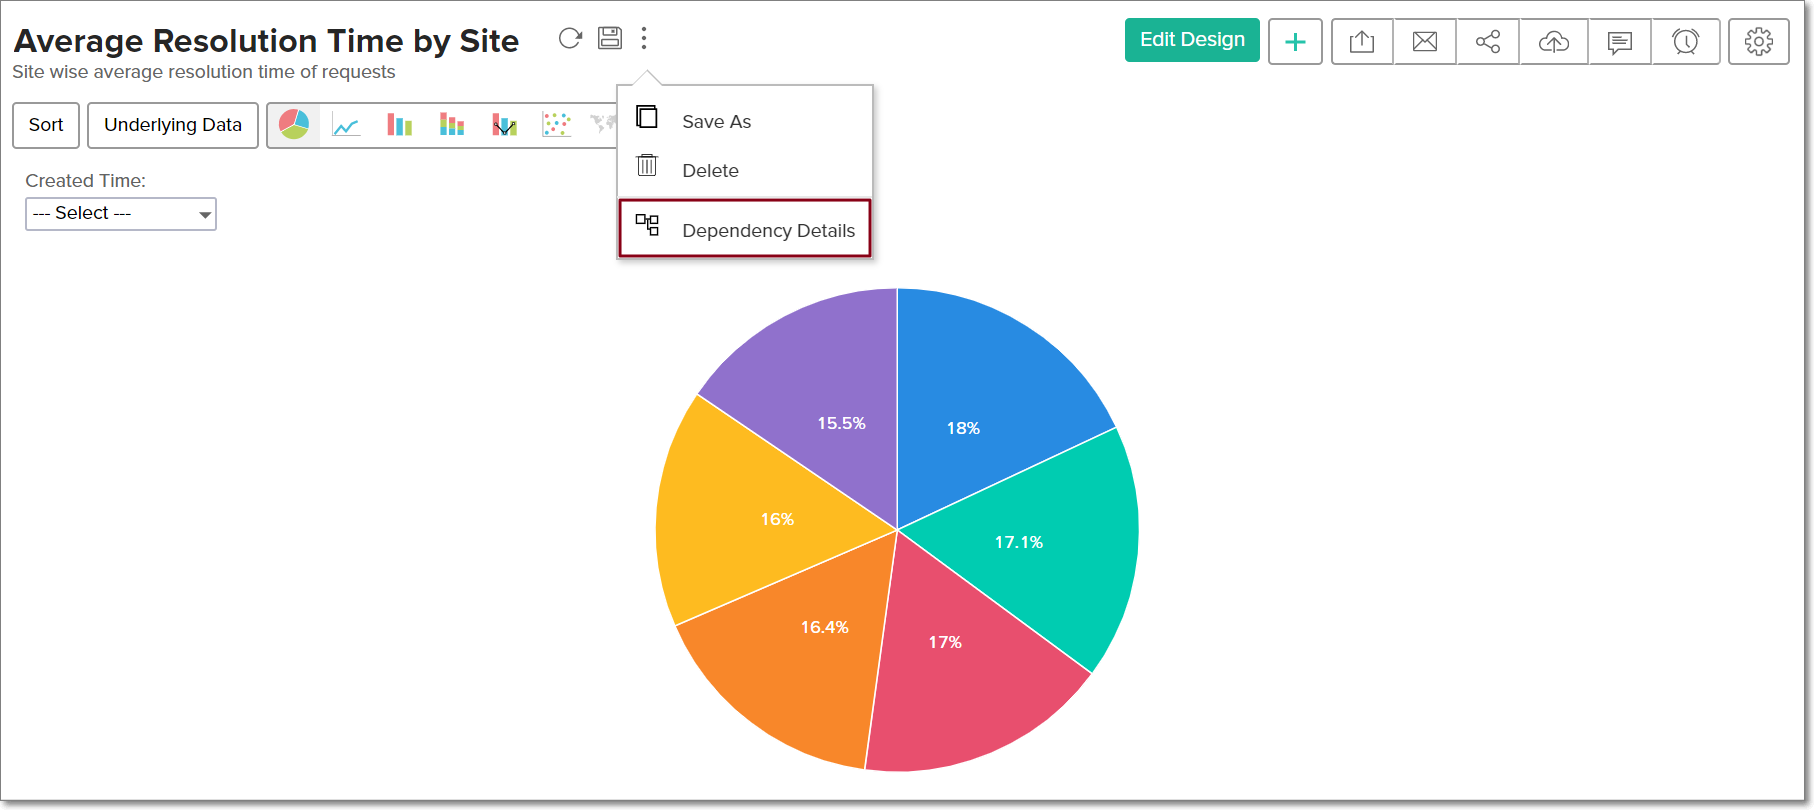
Create sub-folders in your workspace
EnhancementAnalytics Plus allows you to group views into sub-folders in your workspace, helping in better organization. Click here to learn more.
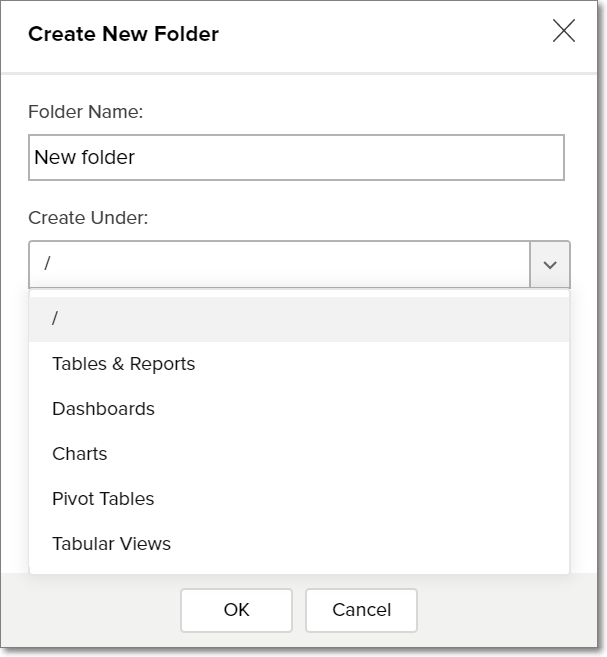
Filter dashboards using a report's data
EnhancementYou can now dynamically filter dashboards based on the data points in a report. Click here to learn more.
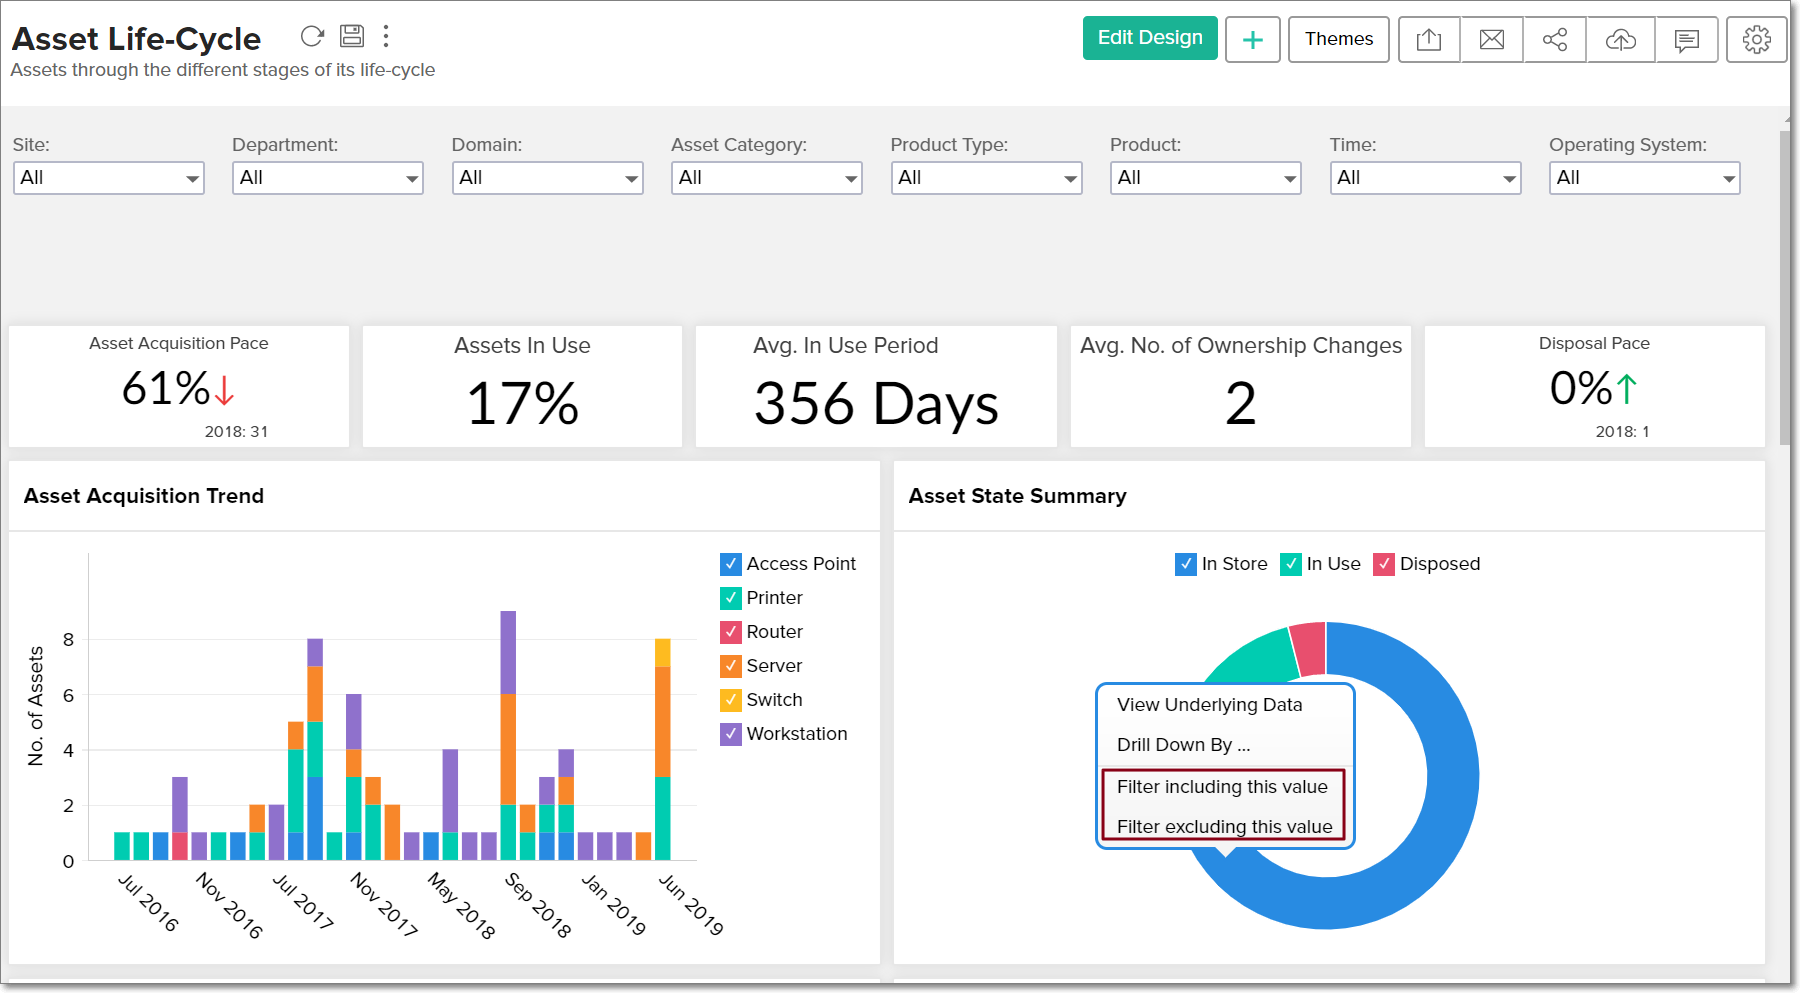
A compact pivot layout
EnhancementAnalytics Plus now allows you to customize the pivot layout, to attain a more compact outlook. Click here to learn more.
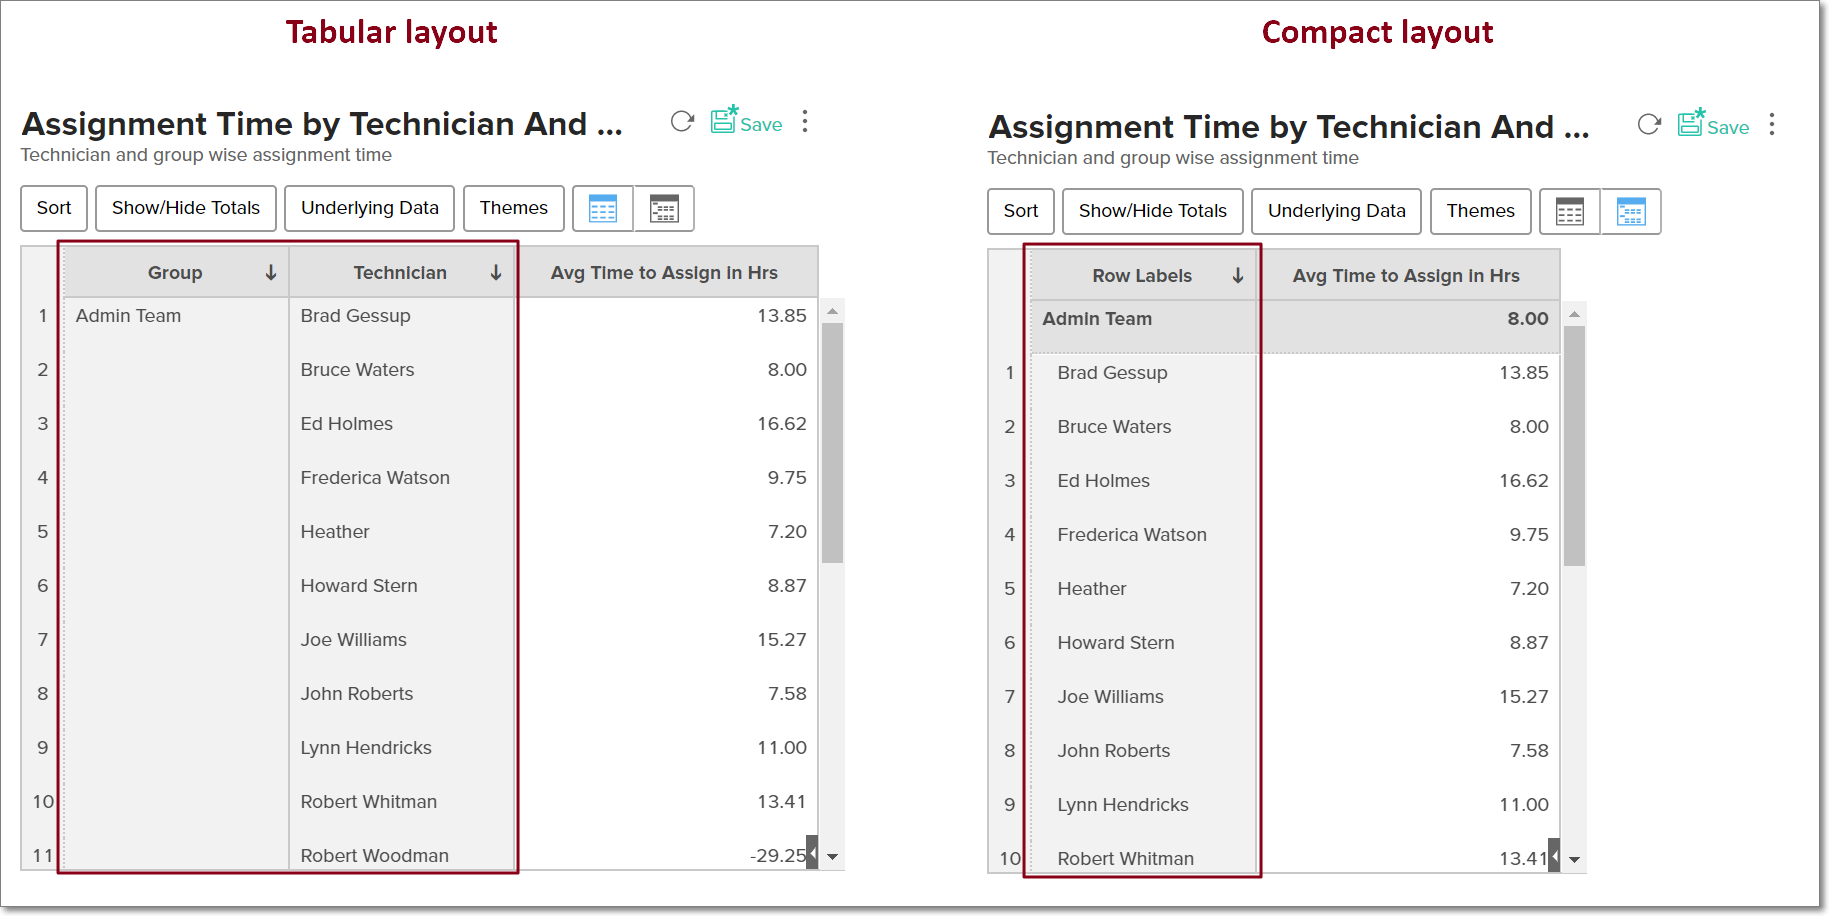
Improved Manage Groups UI
EnhancementManaging groups in Analytics Plus is now easier with the enhanced UI. Click here to learn more.
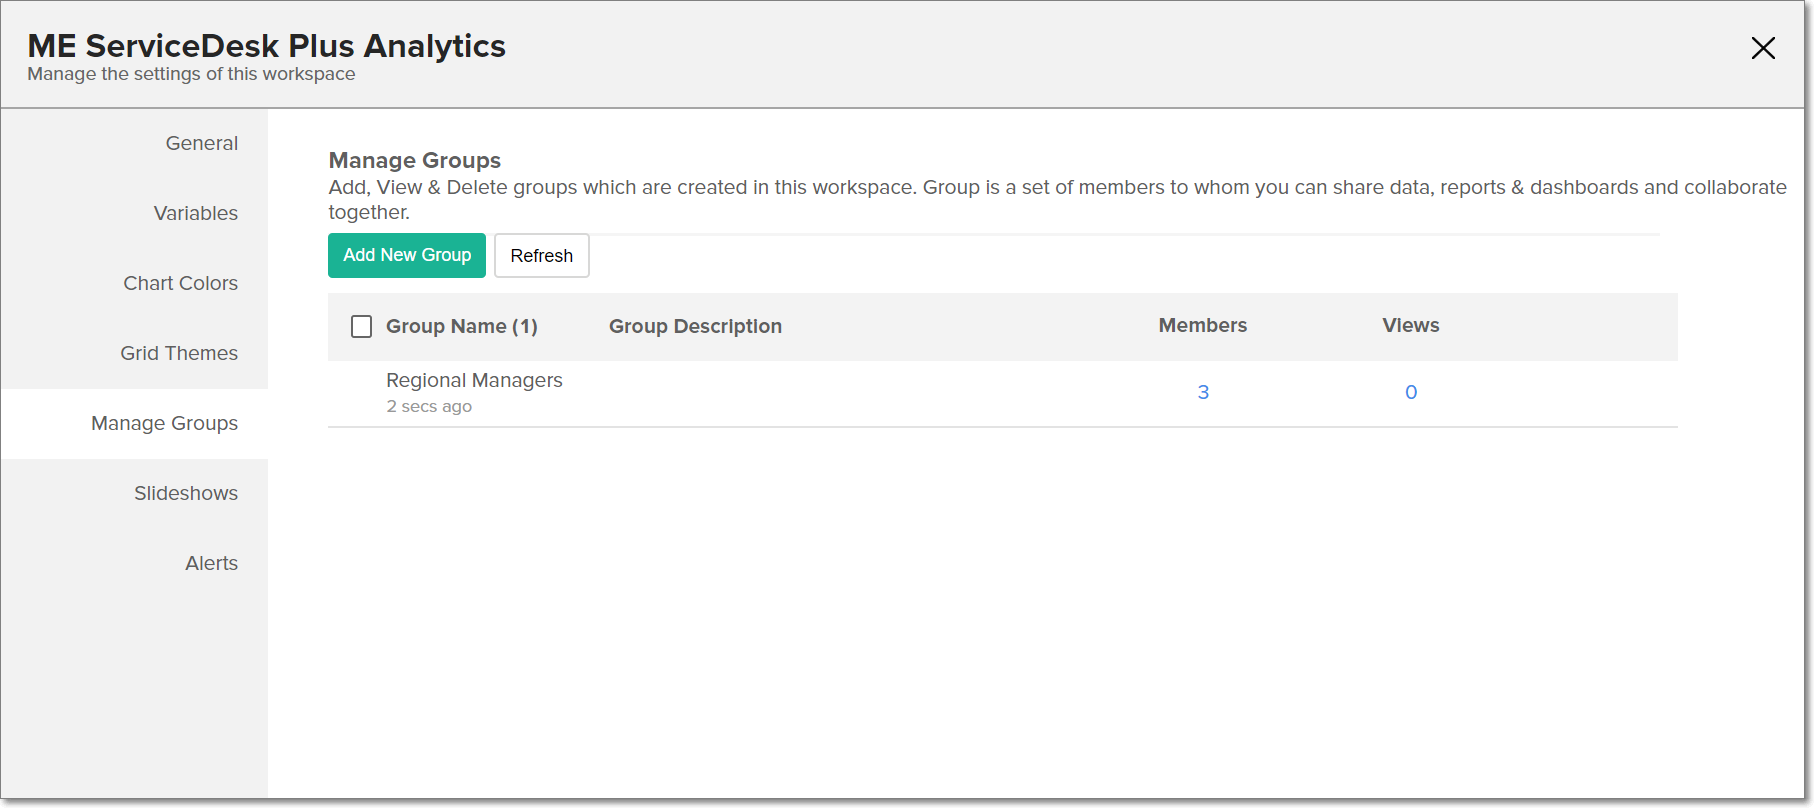
Introducing enhancements to the sort functionality in charts
Enhancement1. By default, new pie charts will be sorted in the descending order based on the distribution of values.
2. A chart with its top or bottom 'N' values filtered will also be sorted in the ascending or the descending order accordingly.
3. If a custom sort is configured as the default for a column in a table, new reports created over that column will also be sorted in the same manner.
2019
Dec
Build Number: 4350 (Release on: December 02, 2019)
Introducing Butterfly charts, and new variant to Geo Map charts
New1. Butterfly charts in Analytics Plus are useful while comparing two different data sets, by plotting data in the form of two horizontal bars with the X-axis in the center. Click here to learn more.
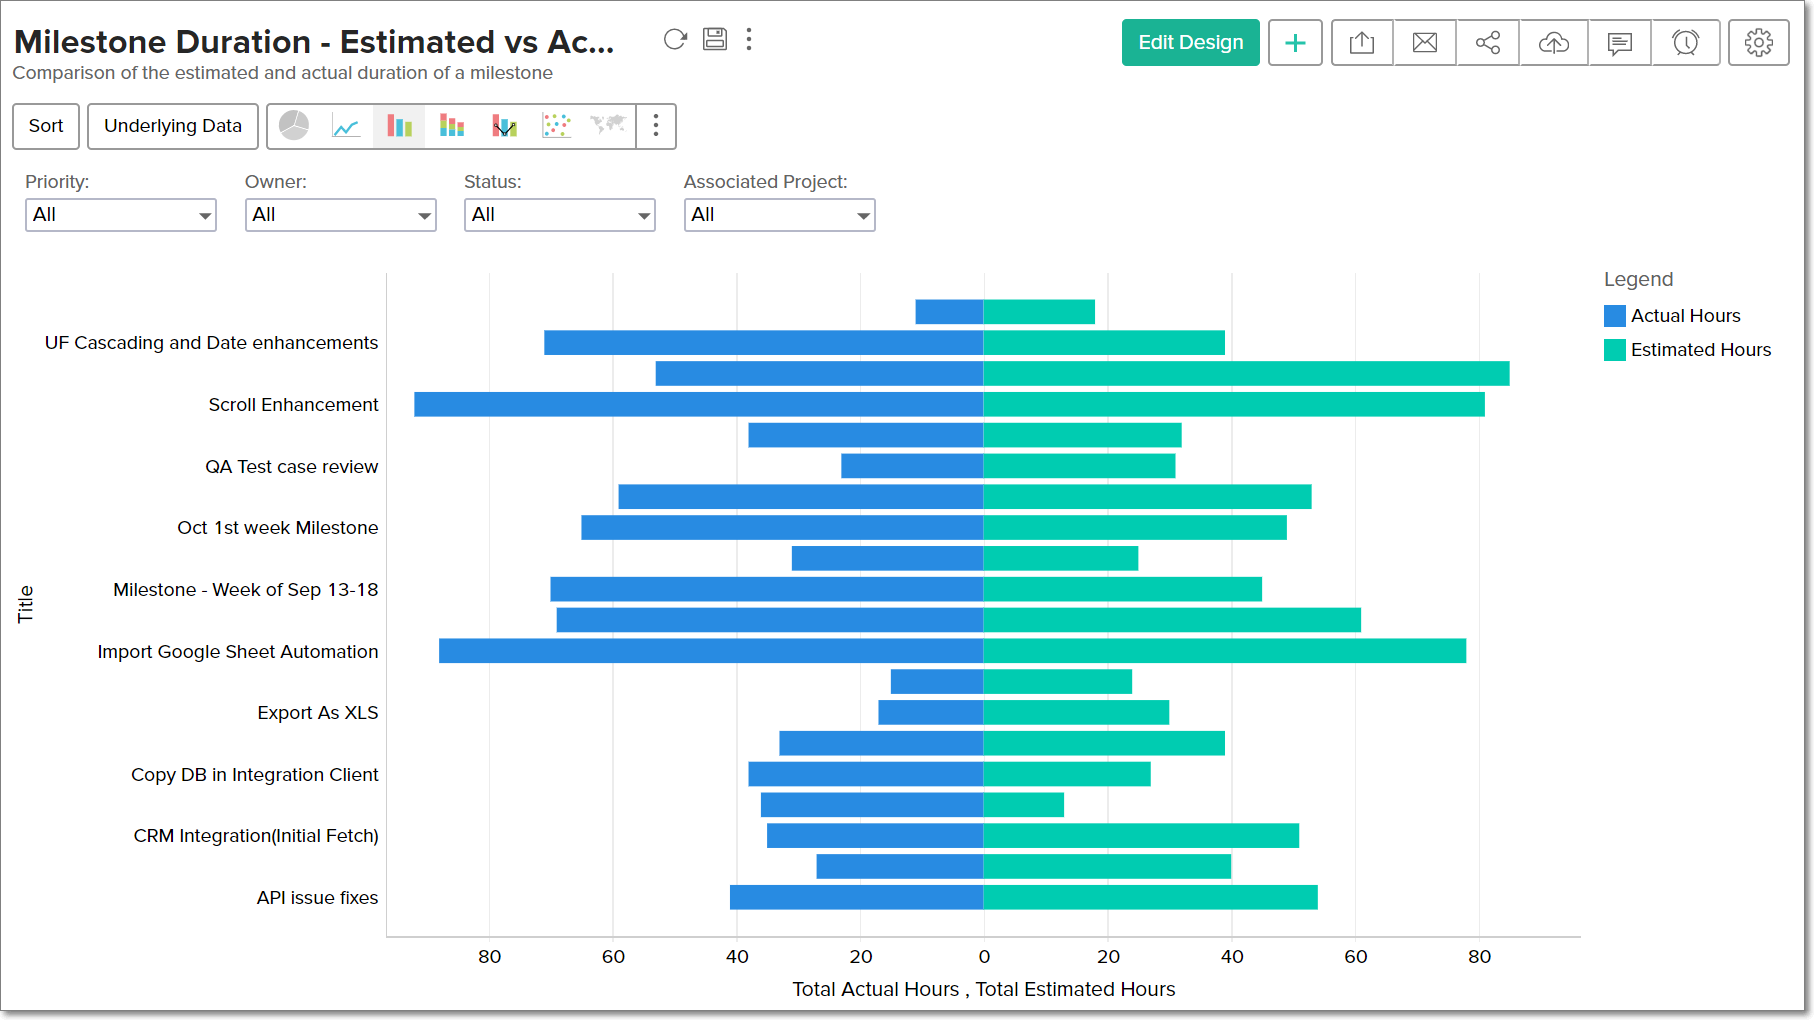
2. Analytics Plus introduces Geo Heat Map charts, as a new variant to the Geo map charts. You can now plot Geo data on a map, color coded based on the density of the data points. Click here to learn more.
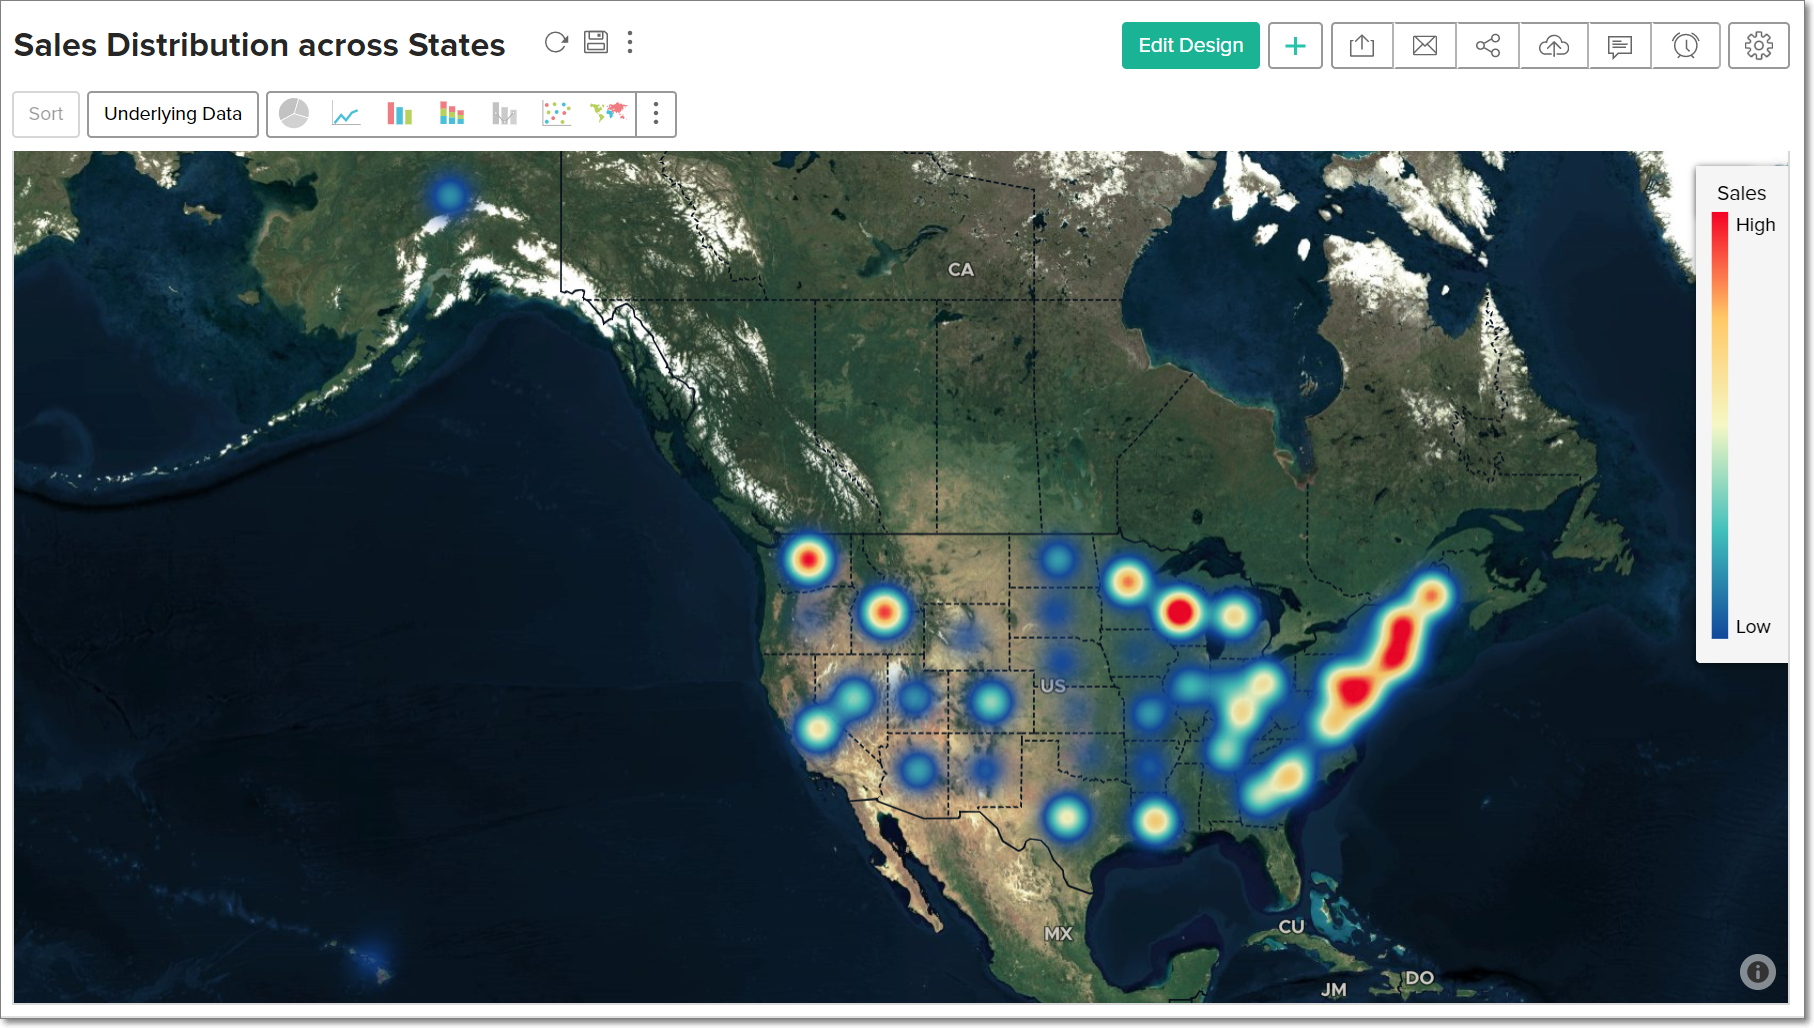
Import data from more local databases
EnhancementYou can now import data into Analytics Plus from the following local databases:
- DB2
- Exasol
- Greenplum
- Vertica
- Actian Vector
- Denodo
- Pervasive SQL
- Any Database supporting JDBC Connection
Click here to learn more.
Import from Statistical Files
NewYou can now import data from Statistical Files, generated by statistical applications like SAS (*.sas7bdat), SPSS (*.sav), and R (*.rdata), that is stored in local drives, FTP servers and web feeds. Click here to learn more.
Customize Pivot Summary Position
EnhancementAnalytics Plus now allows you to customize the positioning of the column and row summaries in Pivot Tables. Click here to learn more.
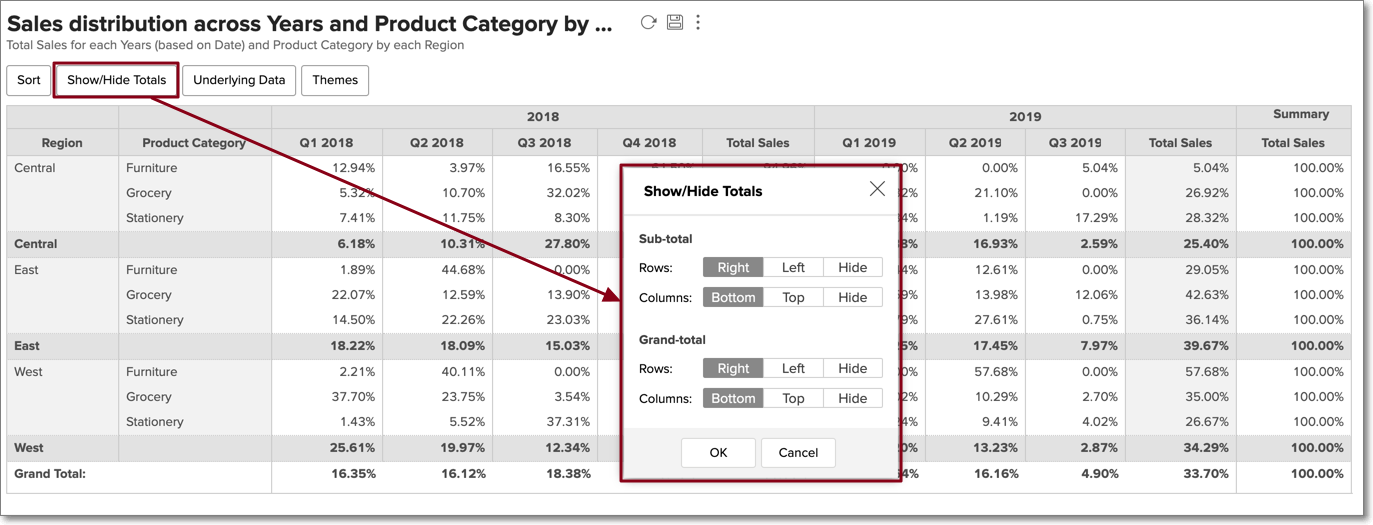
Enhancement in Report Formula
EnhancementAnalytics Plus' report-specific formula builder is enhanced to support logical (AND, OR) and comparison operators (>, <, >=, <=, =, and !=). Click here to learn more about Report Formulas.
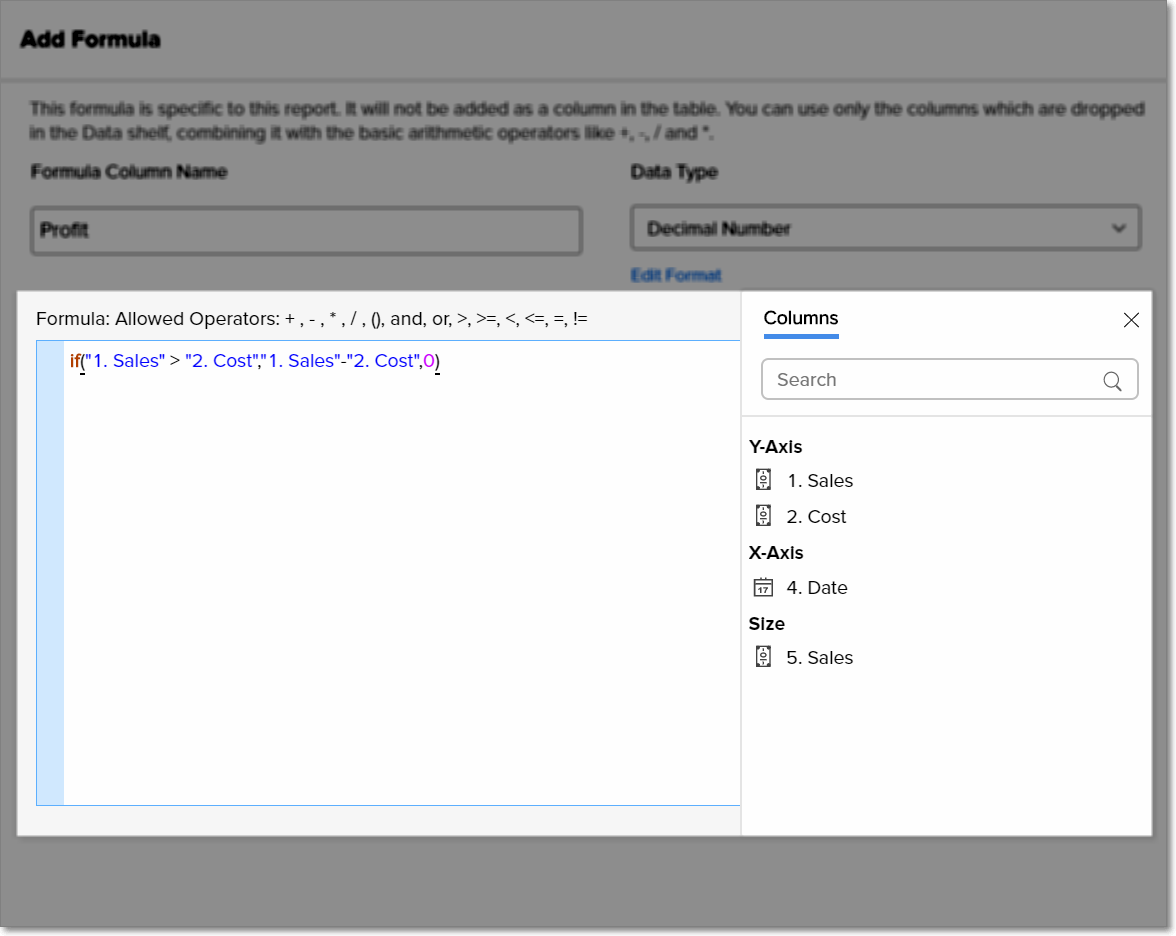
Apply Parent Table's Filter Criteria
EnhancementYou can now apply the parent table's filter criteria while sharing dashboards with users. Click here to learn more.
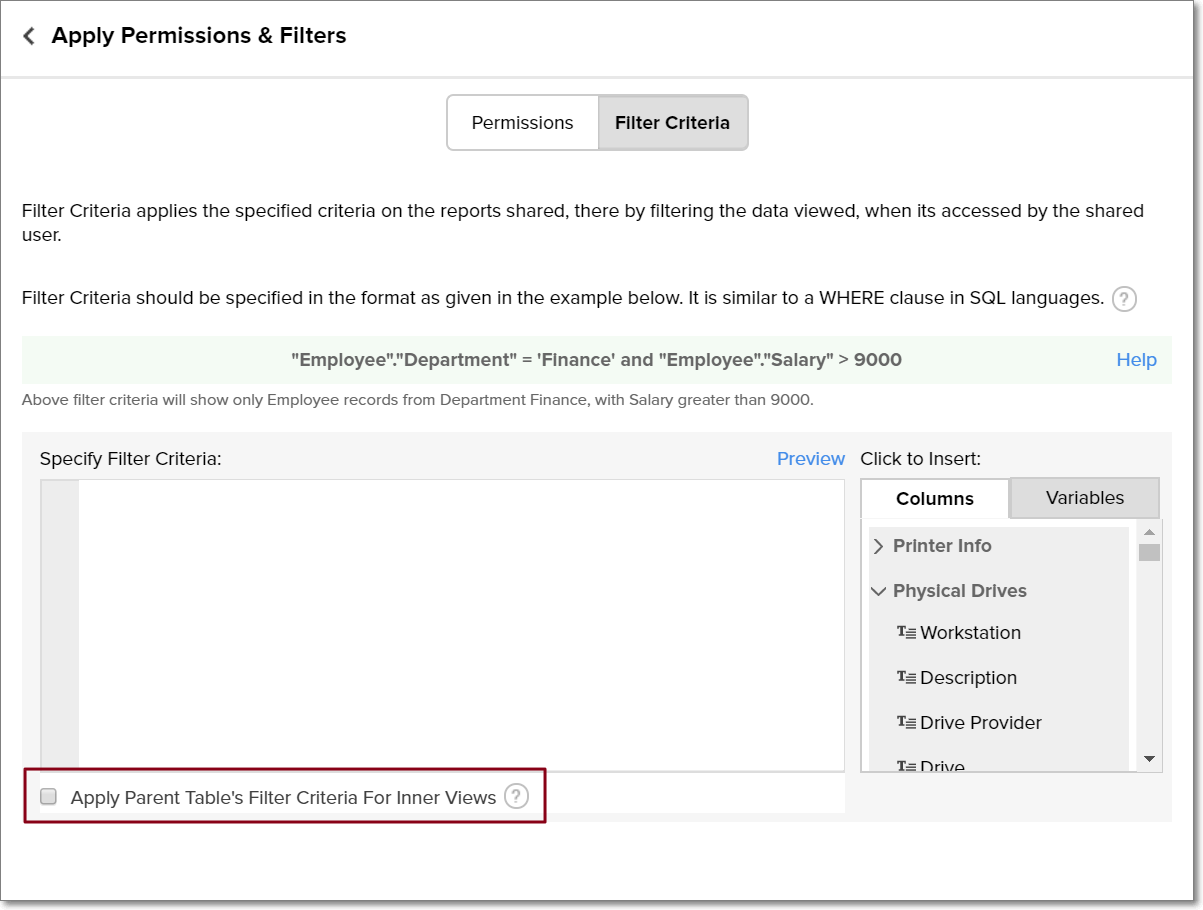
Unsubscribe from shared workspaces
NewAnalytics Plus users can now easily unsubscribe from workspaces that are shared to them. Click here to learn more.
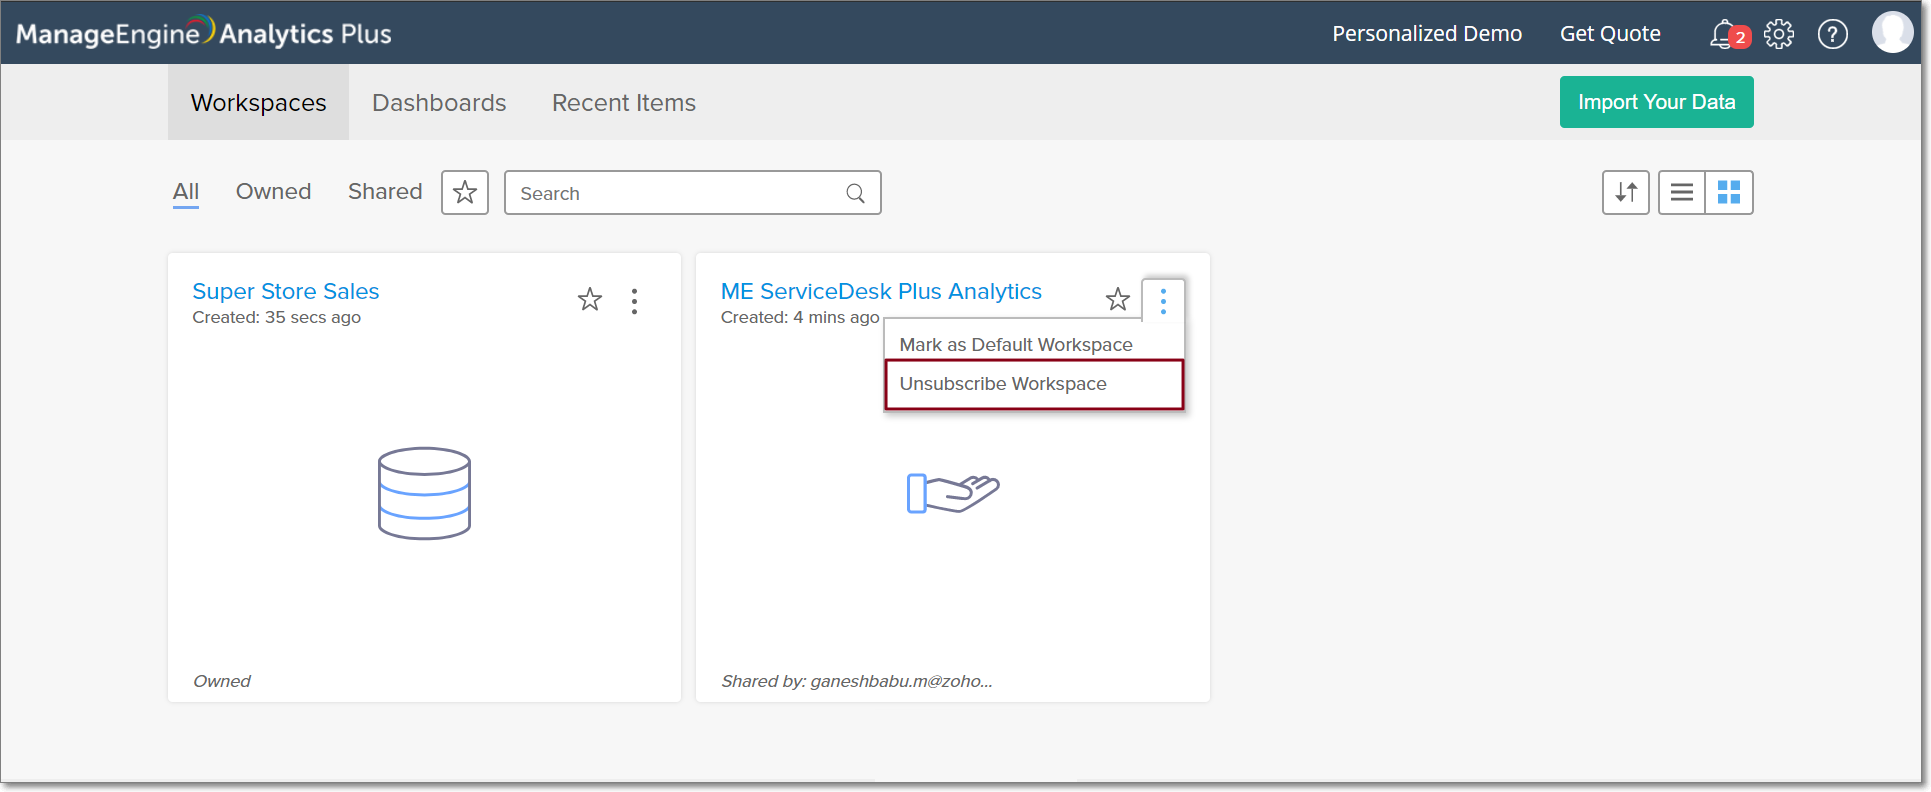
Enhanced emailing options
EnhancementYou can now include up to 25 users in each email schedule. The Pick Users / Groups option also lets you pick groups from a list, instead of having to type all the email addresses individually. Click here to learn more.
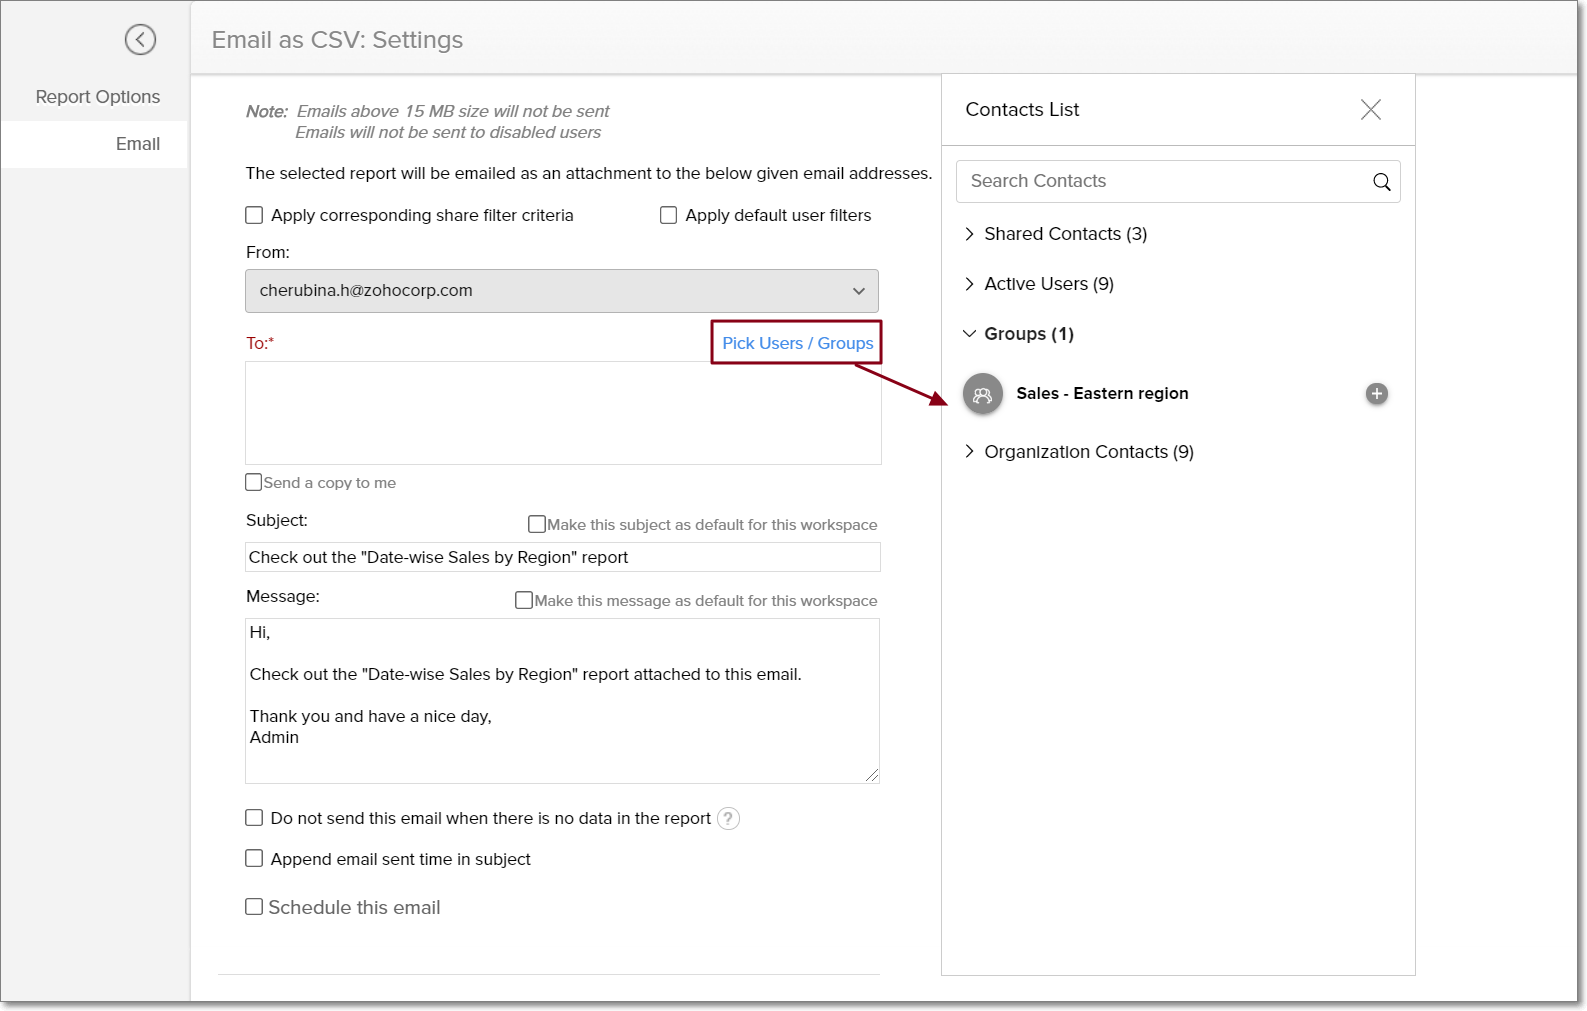
Introducing enhancements to the Explorer view
Enhancement1. Use the Shift + Select option (hold down the shift key during view selection) to choose several views at a time.
2. Clicking the speech bubble icons in the Explorer View will take you to the comments section of each view.
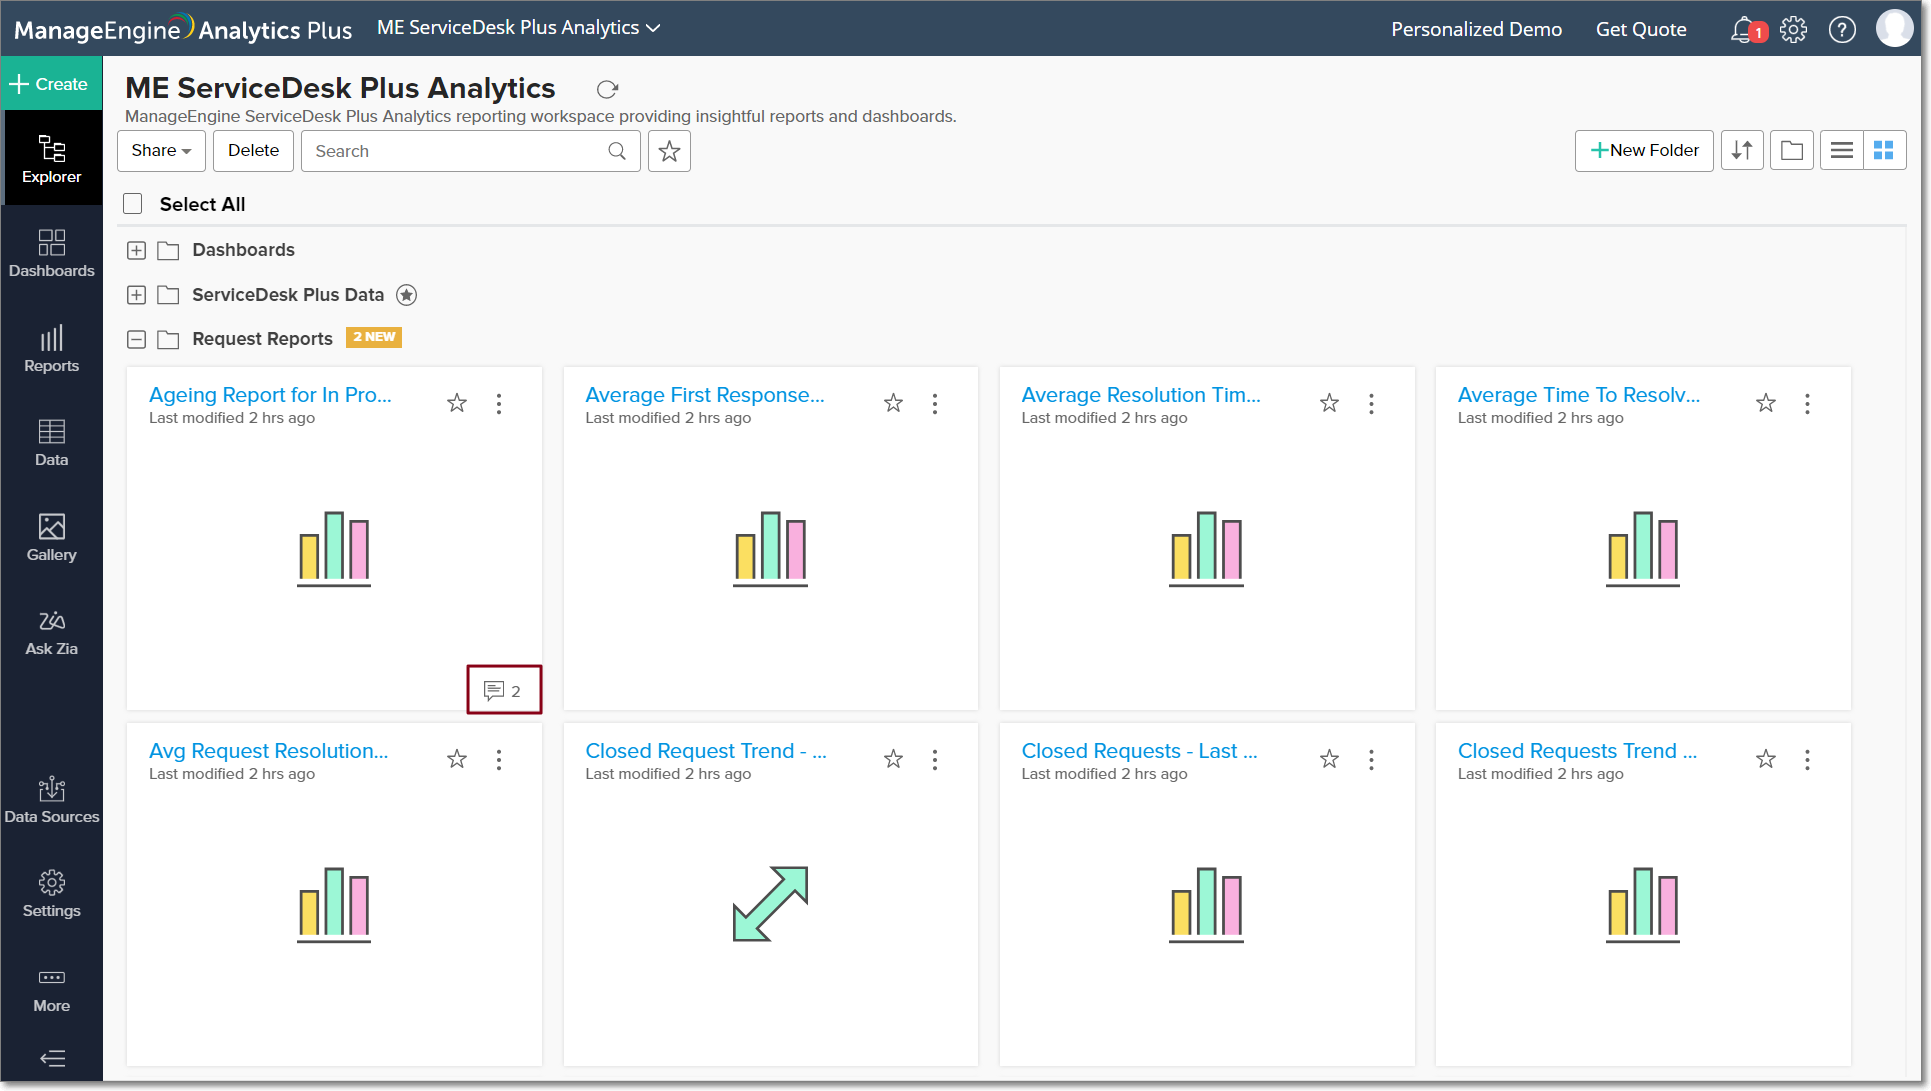
Issues fixed
Issues fixed- The security issue that resulted in a Remote Code Execution (RCE) vulnerability has been fixed.
- An Out-of-band XML External Entity (OOB-XXE) vulnerability that allowed users to read arbitrary files and scan internal ports is now fixed.
Oct
Build Number: 4310 (Release on: October 04, 2019)
Introducing out-of-box integration with PAM360
NewAnalytics Plus now integrates out-of-the-box with ManageEngine PAM360, to provide an in-depth analysis of your privileged account activities. Click here to learn more.
Sep
Build Number: 4300 (Release on: September 09, 2019)
Introducing out-of-box integration with Password Manager Pro
NewAnalytics Plus now integrates out-of-the-box with ManageEngine Password Manager Pro, to provide in-depth analytics on privileged account access. Click here to learn more.
Import data from more cloud databases
EnhancementYou can now import data into Analytics Plus from the following cloud databases:
- Amazon Aurora PostgreSQL
- Amazon Athena
- Microsoft Azure
- MySQL
- PostgreSQL
- Maria DB
- SQL Database
- SQL Data Warehouse
- Google BigQuery
- Google Cloud
- SQL
- PostgreSQL
- Snowflake
- Rackspace Cloud
- MySQL
- Maria DB
- Oracle Cloud
- IBM Cloud
- Panoply
Click here to learn more.
Specify accuracy levels while forecasting
EnhancementAnalytics Plus' forecasting engine has now been enhanced, allowing you to define accuracy levels in your forecast reports. Click here to learn more.
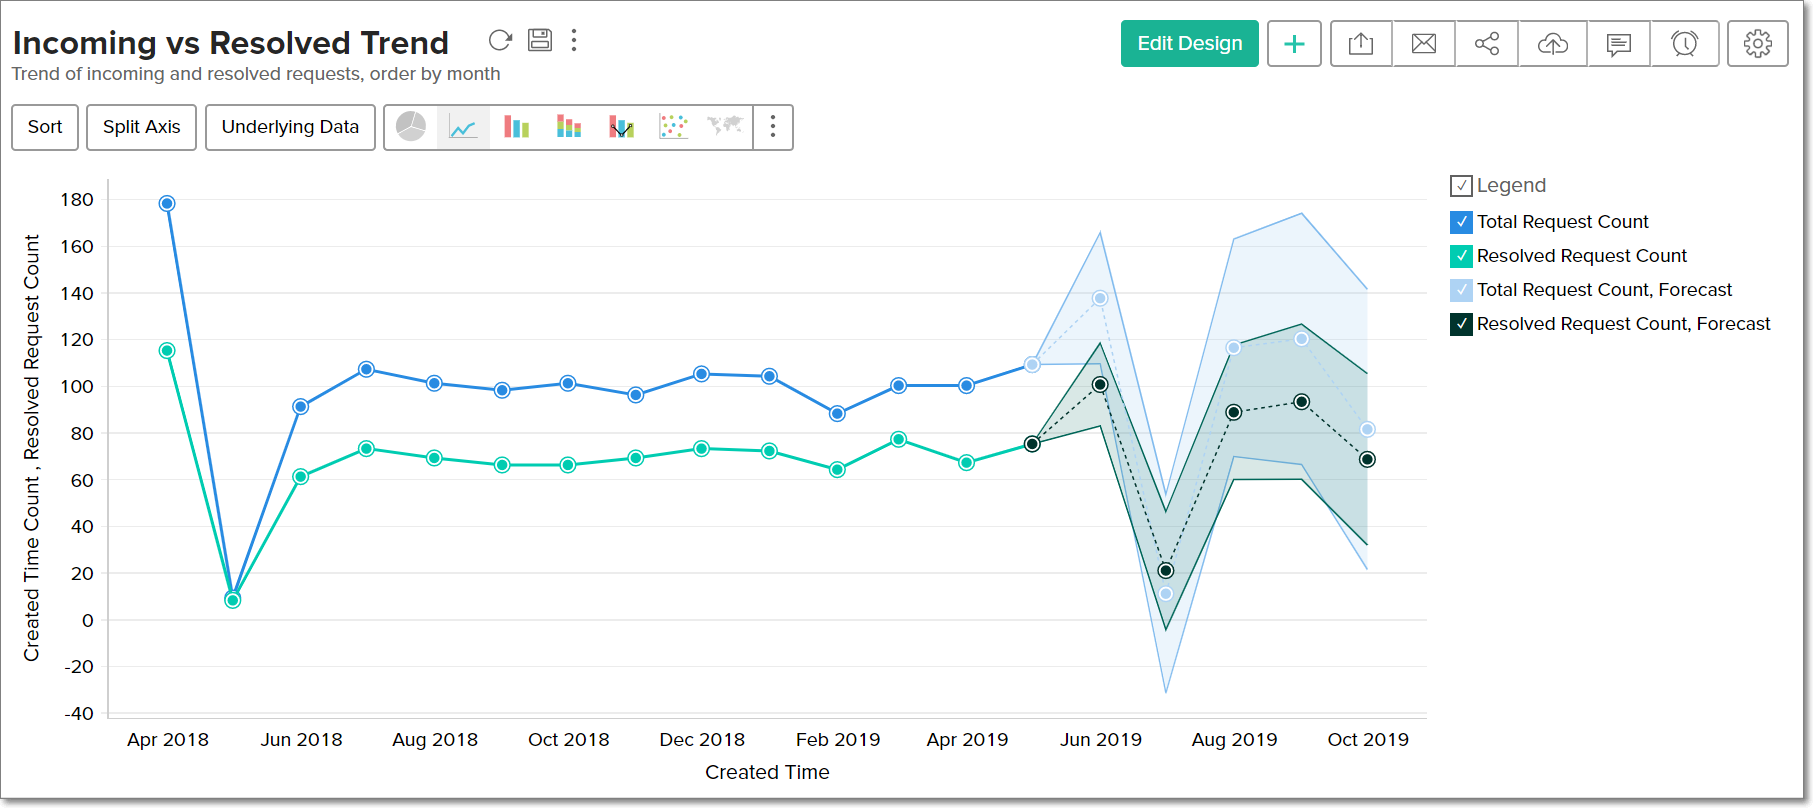
Introducing Bubble Pie charts, and new variants to Combination charts
New1. The new Bubble Pie chart in Analytics Plus allows you to compare data with multiple variables, using a combination of pie and bubble charts. Click here to learn more.
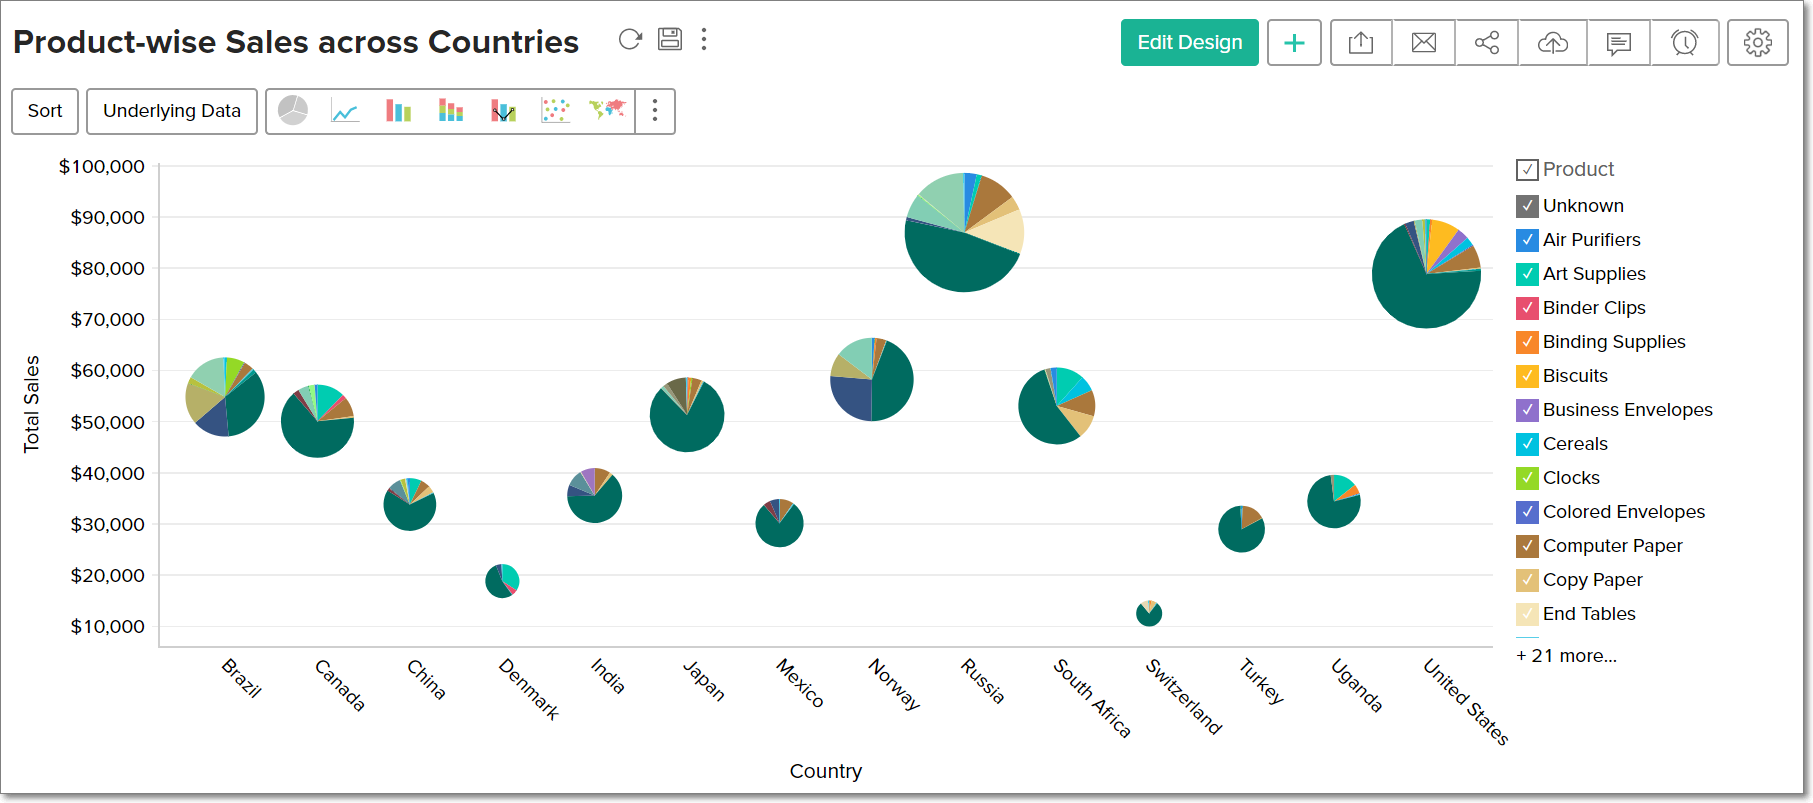
2. Analytics Plus now allows you to create new variants of Combination charts by combining any of the following chart types: Bar chart, Stacked Bar chart, Line chart, Smooth Line chart, Step Line chart, Area chart, Stacked Area chart, Bubble chart and Bubble Pie chart. Click here to learn more.
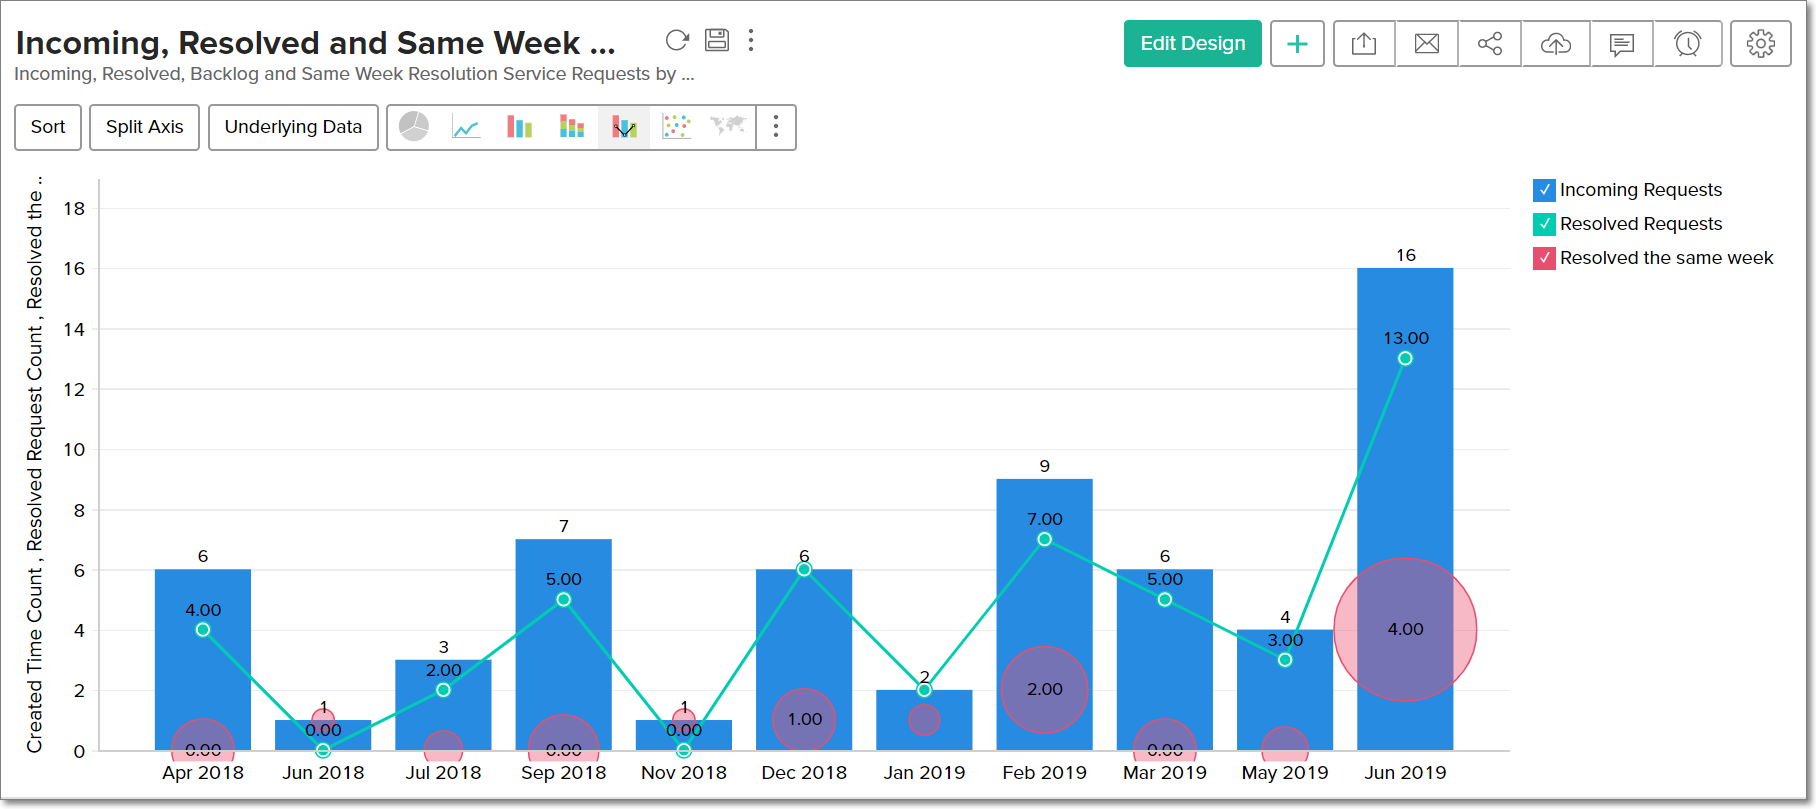
Enhancements in Geo Map charts
EnhancementThe following enhancements are now offered in Geo map charts:
1. New themes have been introduced for map charts- Satellite theme and custom theme. Using the Satellite theme you can now plot a Geo map chart over a satellite view of the area, while the Custom theme allows you to design a customized theme to fit your requirements.
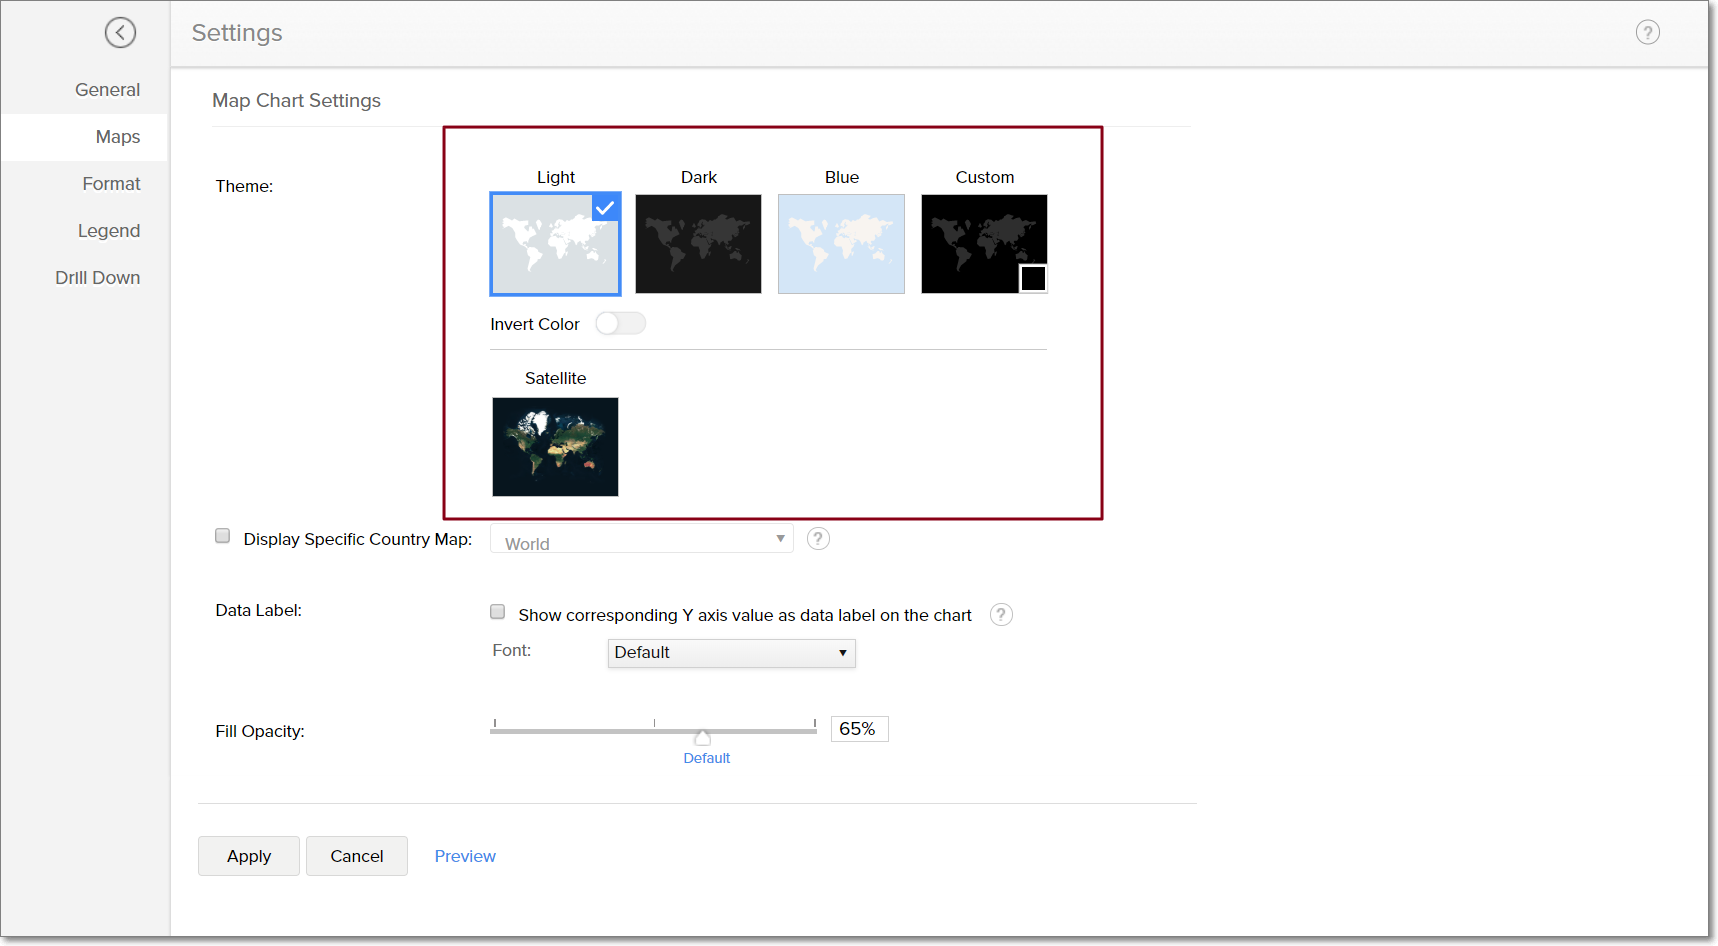
You can invert the colors in your map chart using the Invert Color toggle button. This is not applicable for Geo maps using a Satellite theme. A continuous color range legend can also be applied on map charts. Click here to learn more.
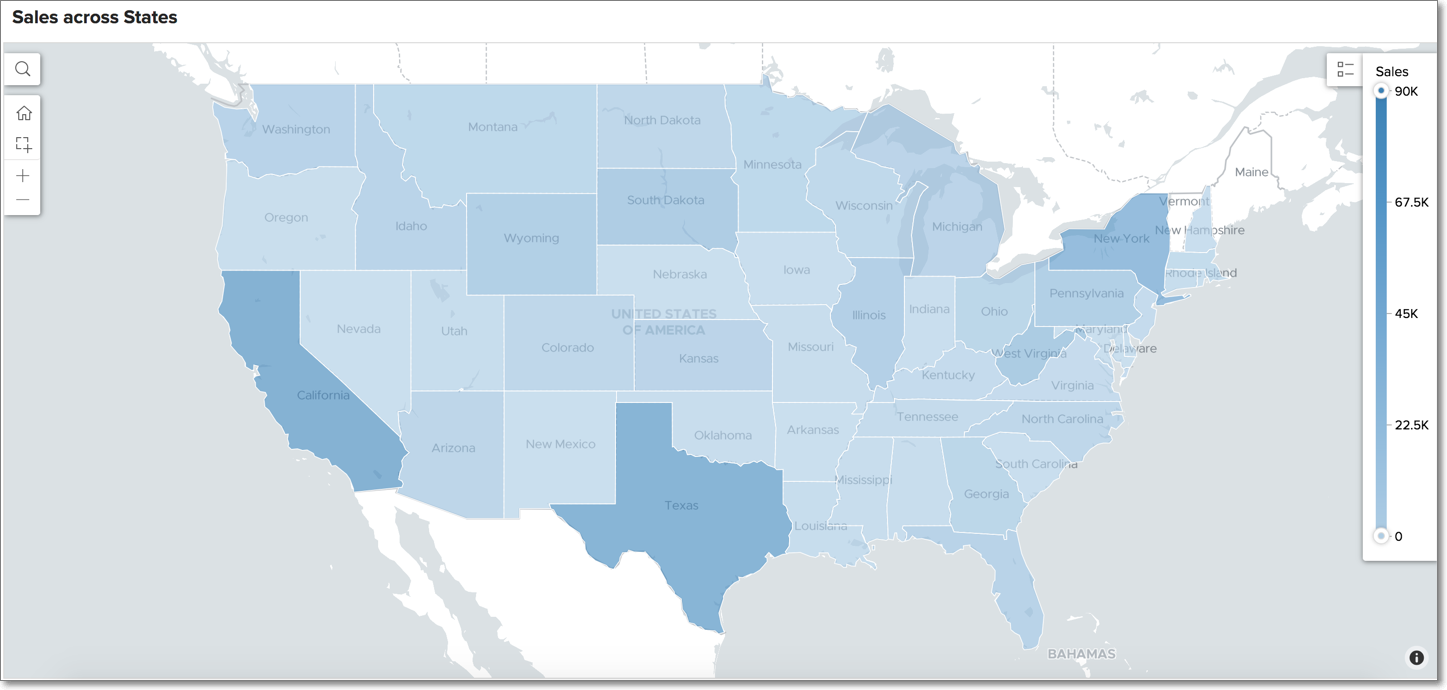
2. You can now create map charts in Analytics Plus using Airport IATA codes.
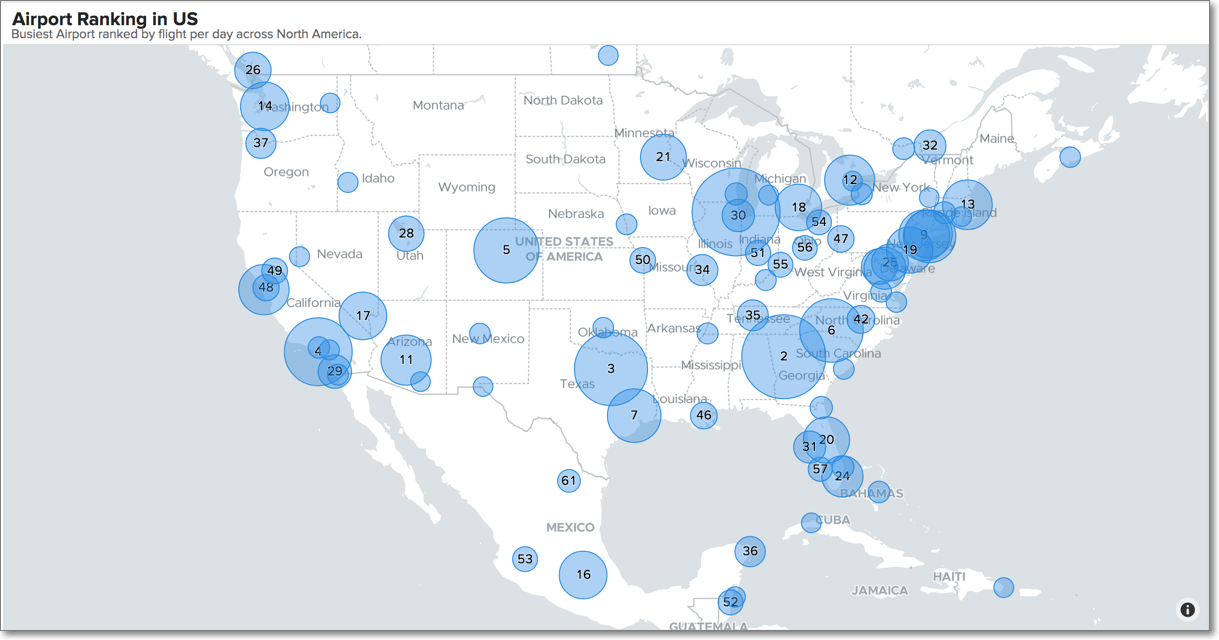
3. Country-specific map charts can also be created, where you can display chosen countries and hide the rest. Click here to learn more.
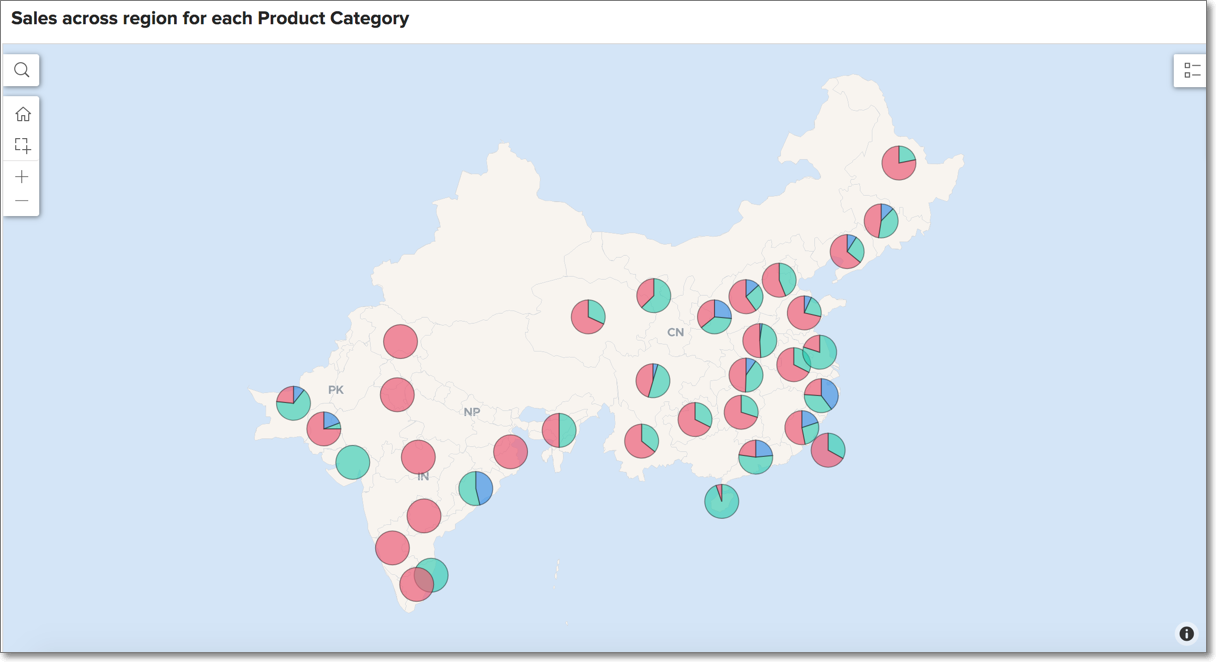
Revamped data import screen
EnhancementThe import from Files and Feeds option has now been split into separate tiles in Analytics Plus, to simplify the import process.
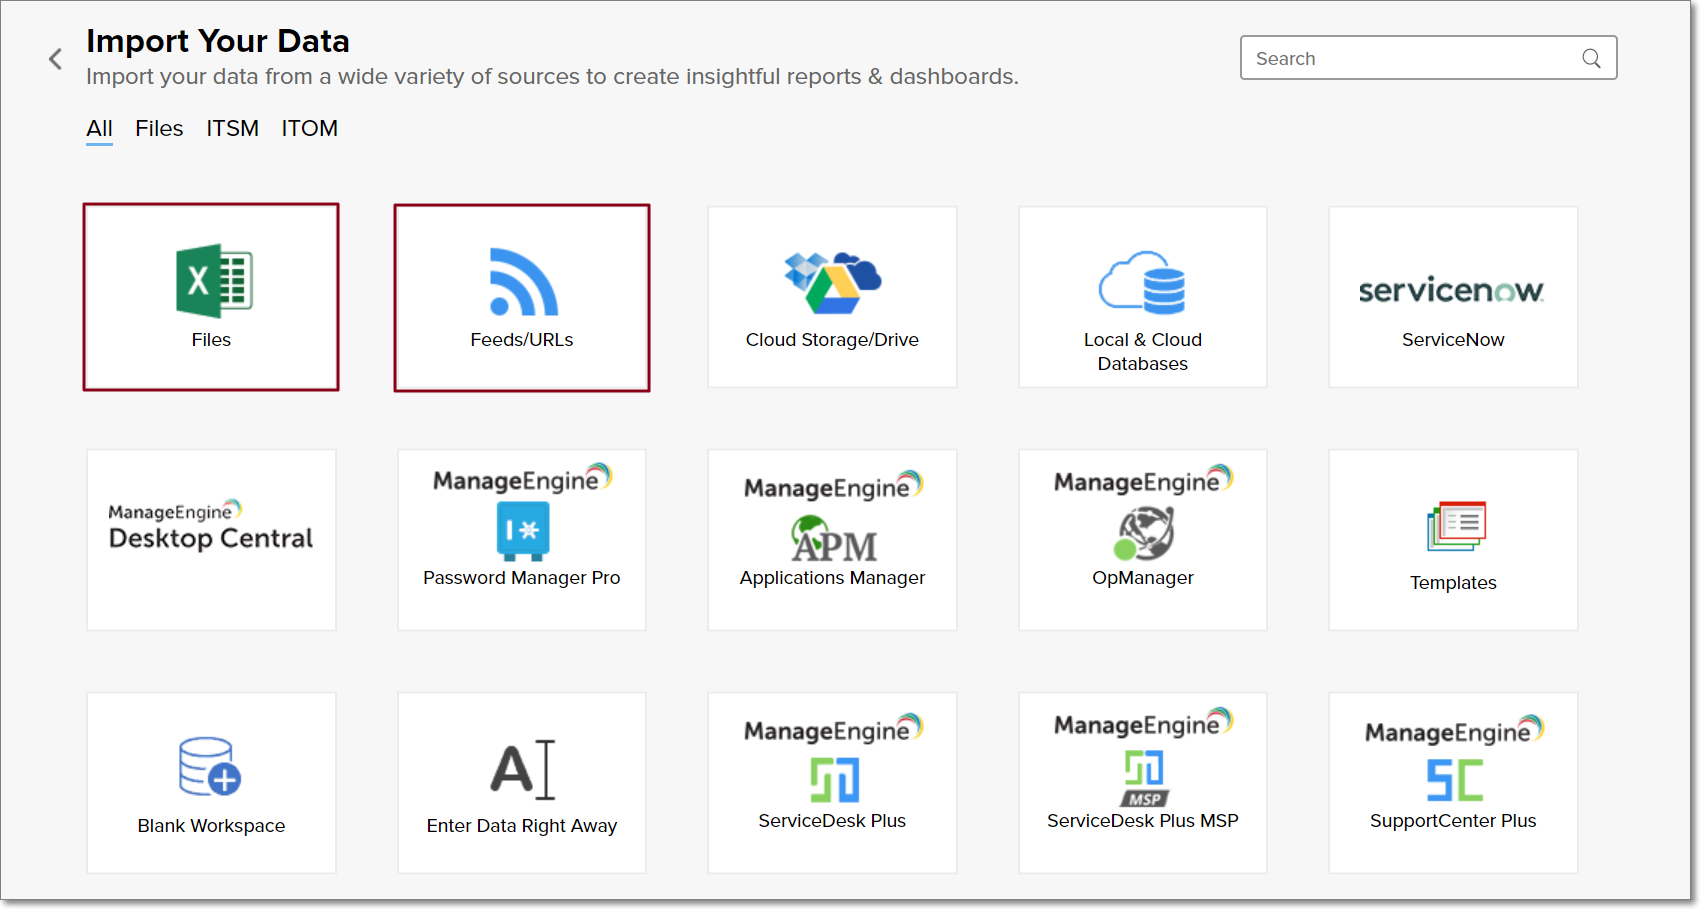
Enhanced dashboard editor
EnhancementAnalytics Plus has introduced new functionalities to the dashboard editor to facilitate easy customization. The following enhancements are available:
- Re-organize multiple components together in a dashboard.
- Re-size multiple components at the same time.
- Apply uniform dimensions to several components.
- Apply proportionate width to selected components.
- Fill empty spaces in the dashboard layout by re-sizing components.
- Export specific reports in the dashboard.
- Maximize embedded reports easily.
Improved Chart Color Palette section
EnhancementThe Chart Color Palette section has now been enhanced to facilitate easy access. Click here to learn more.
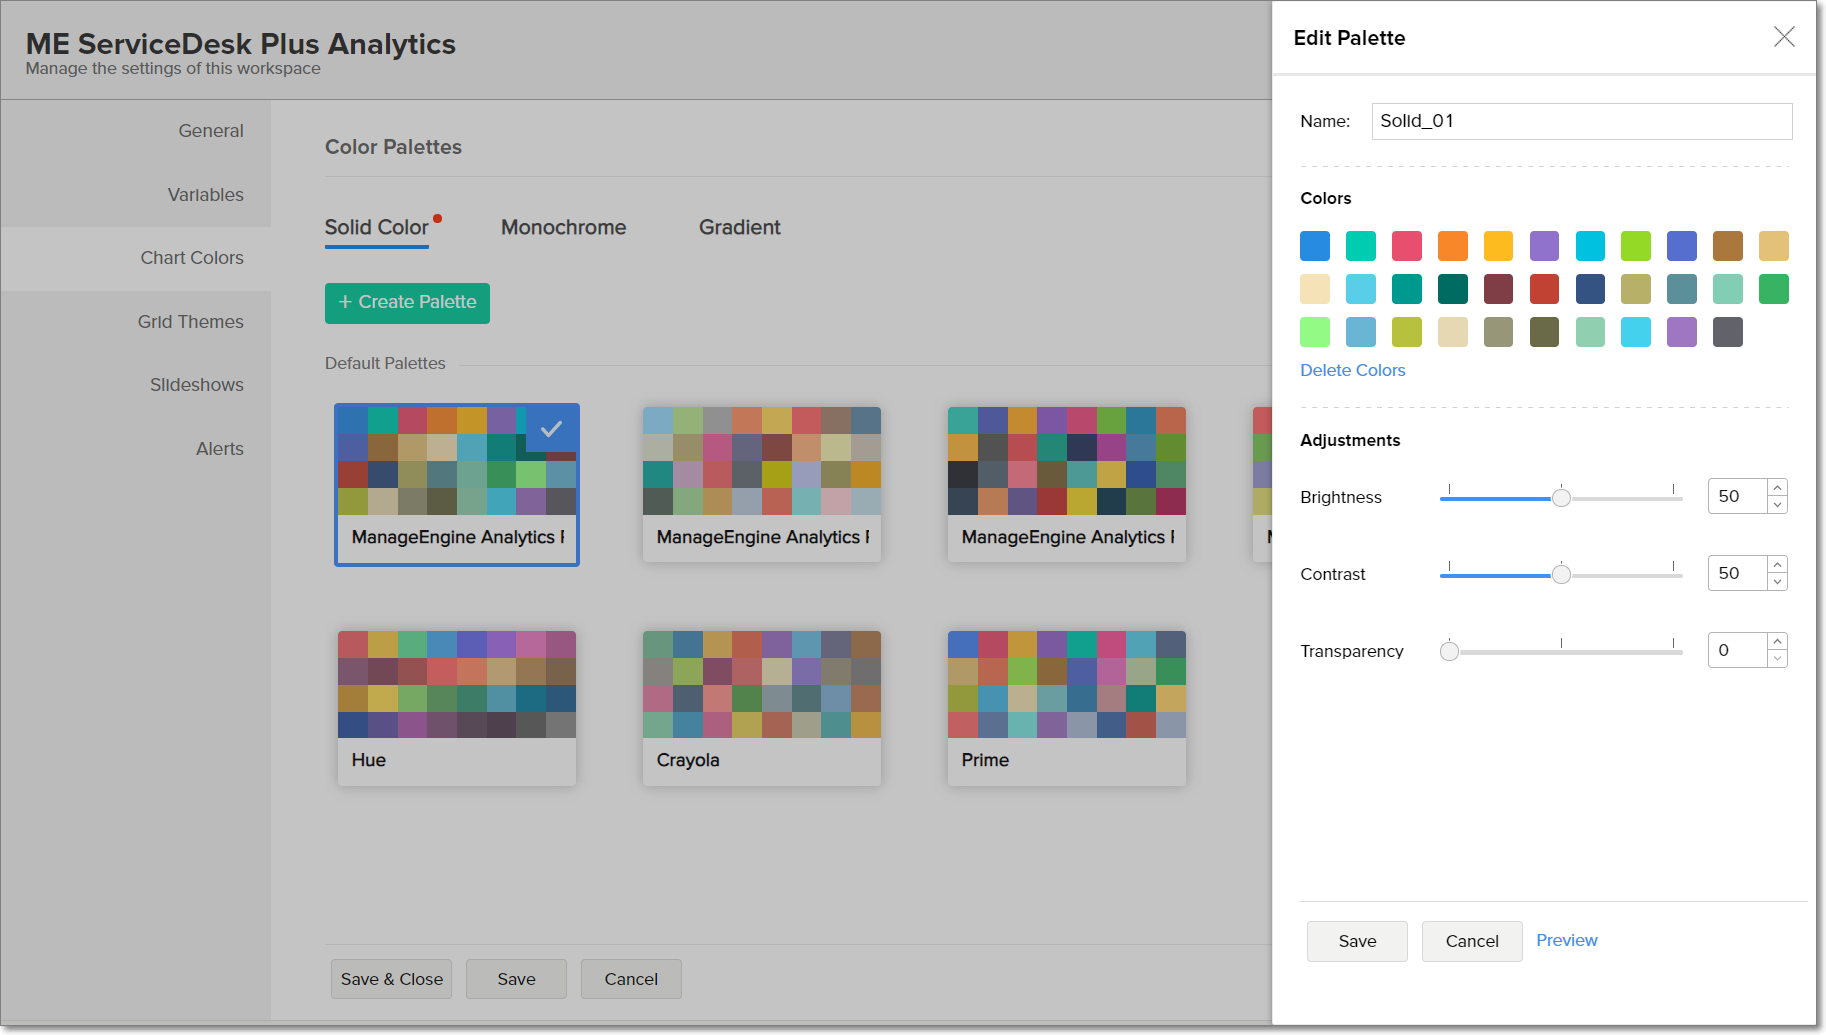
Enhancements in drill down options
EnhancementYou can now ignore the value in the Color tile and drill down on the entire data present in the chart. Click here to learn more.
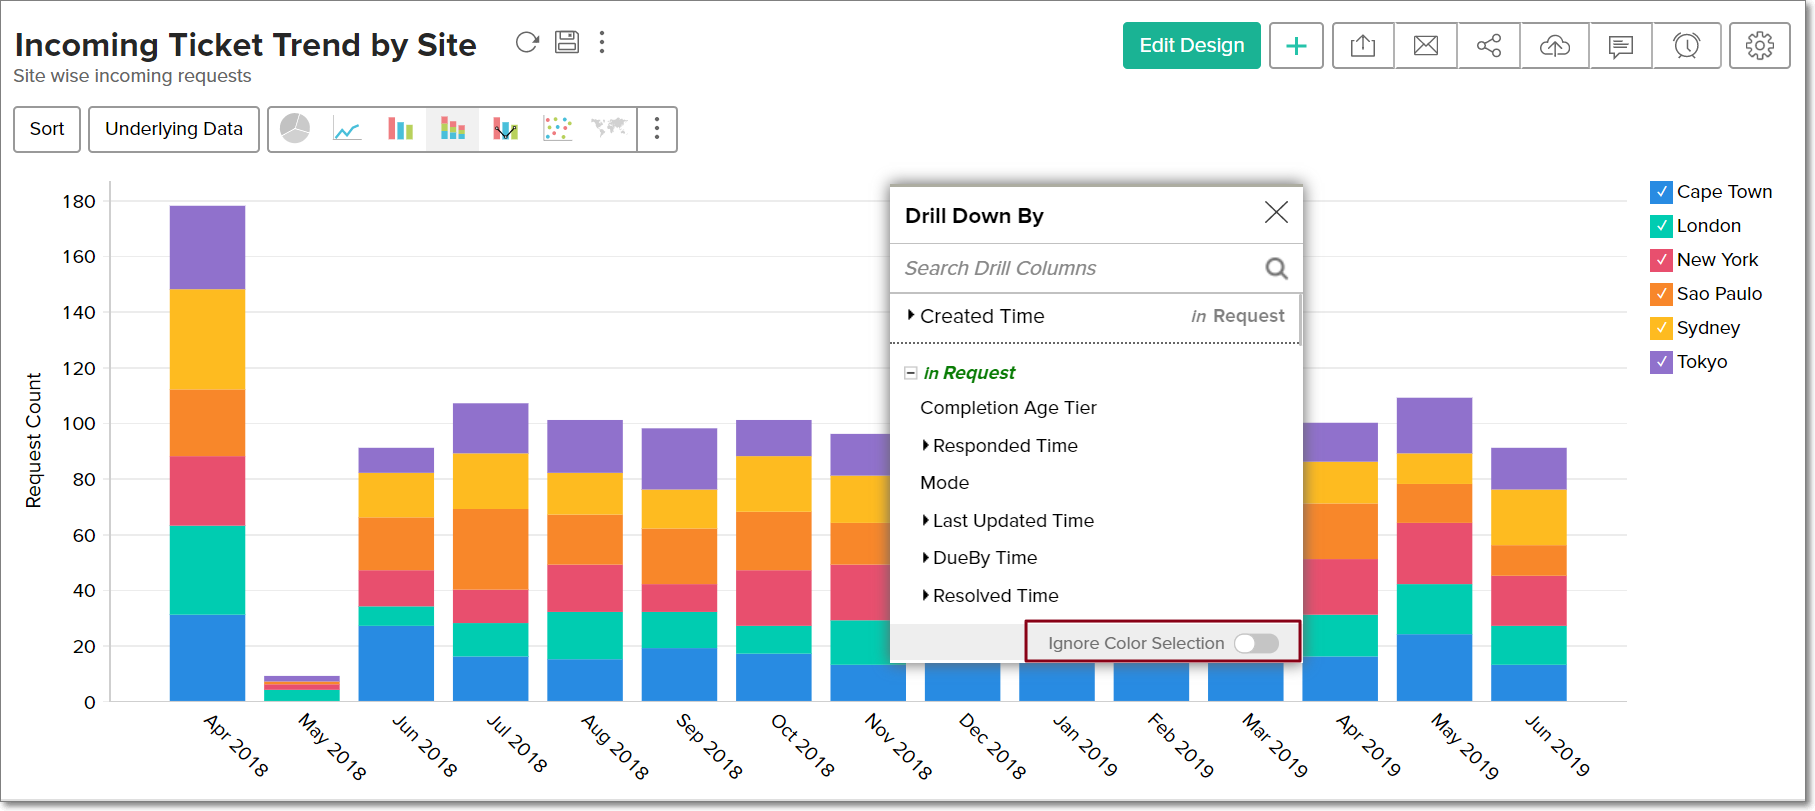
Organize views from your side panel
EnhancementYou can now change the dashboard and report listing style (folder view, type view or related view) using Analytics Plus' side panel.
Rename columns easily
EnhancementAnalytics Plus now allows you to rename the columns in a table by simply double-clicking the column header.
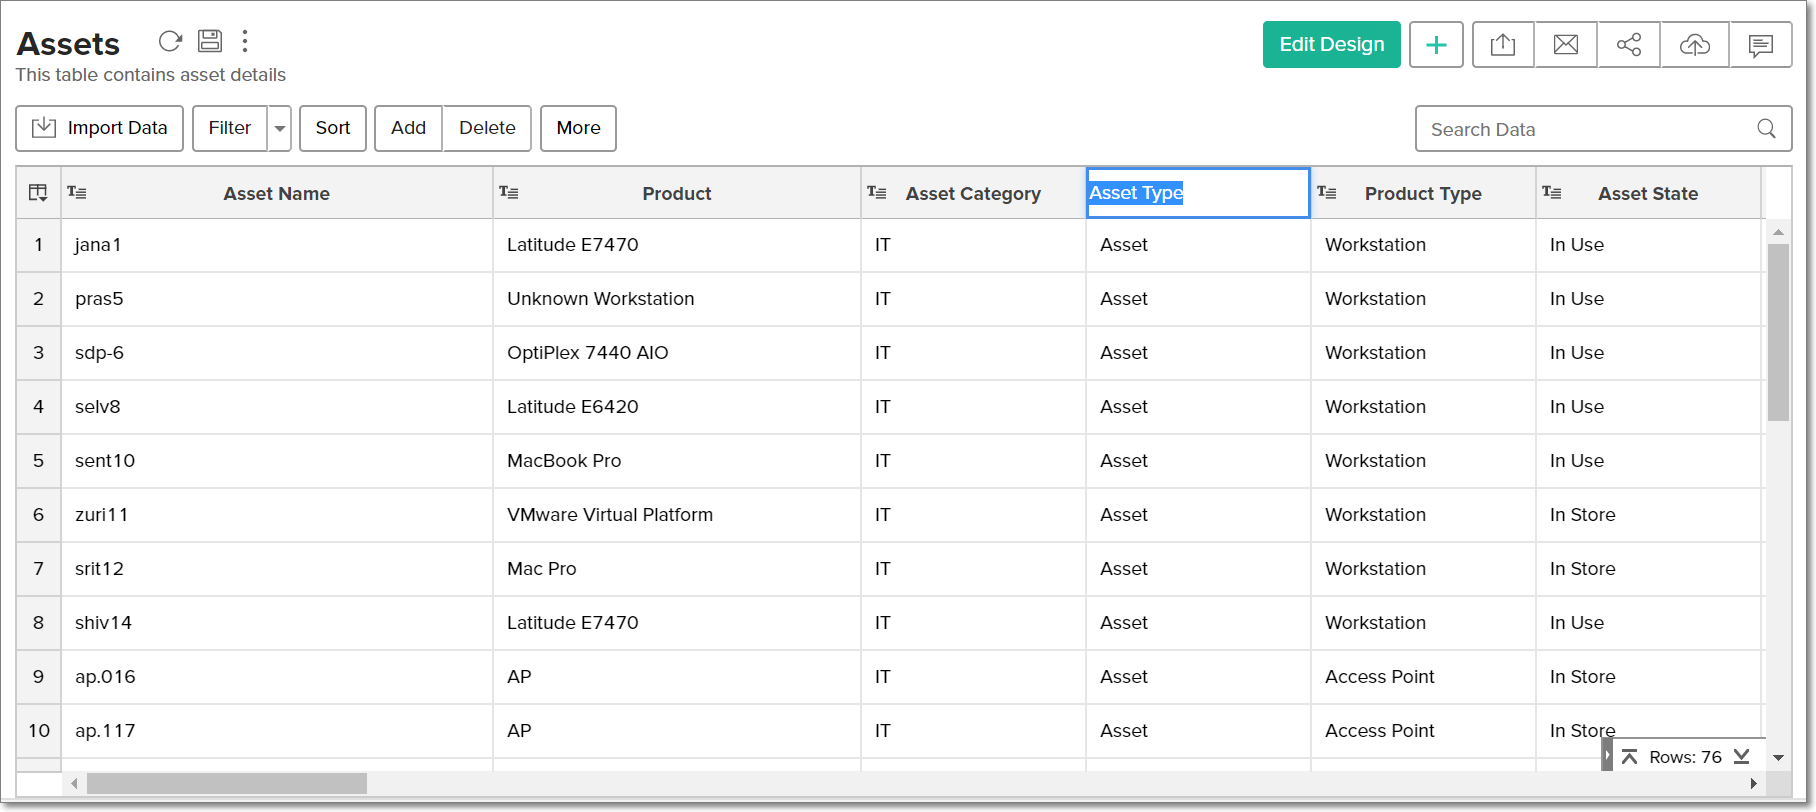
July
Build Number: 4280 (Release on: July 22, 2019)
Introducing Ask Zia
NewZia, the intelligent report assistant is enabled with Natural Language Processing (NLP) to understand users' questions in plain english and offer powerful insights immediately, in the form of relevant visualizations. Click here to learn more.
Support for single sign-on using SAML
NewAnalytics Plus now provides support for single sign-on with any third party application that supports SAML authentication. Click here to learn more.
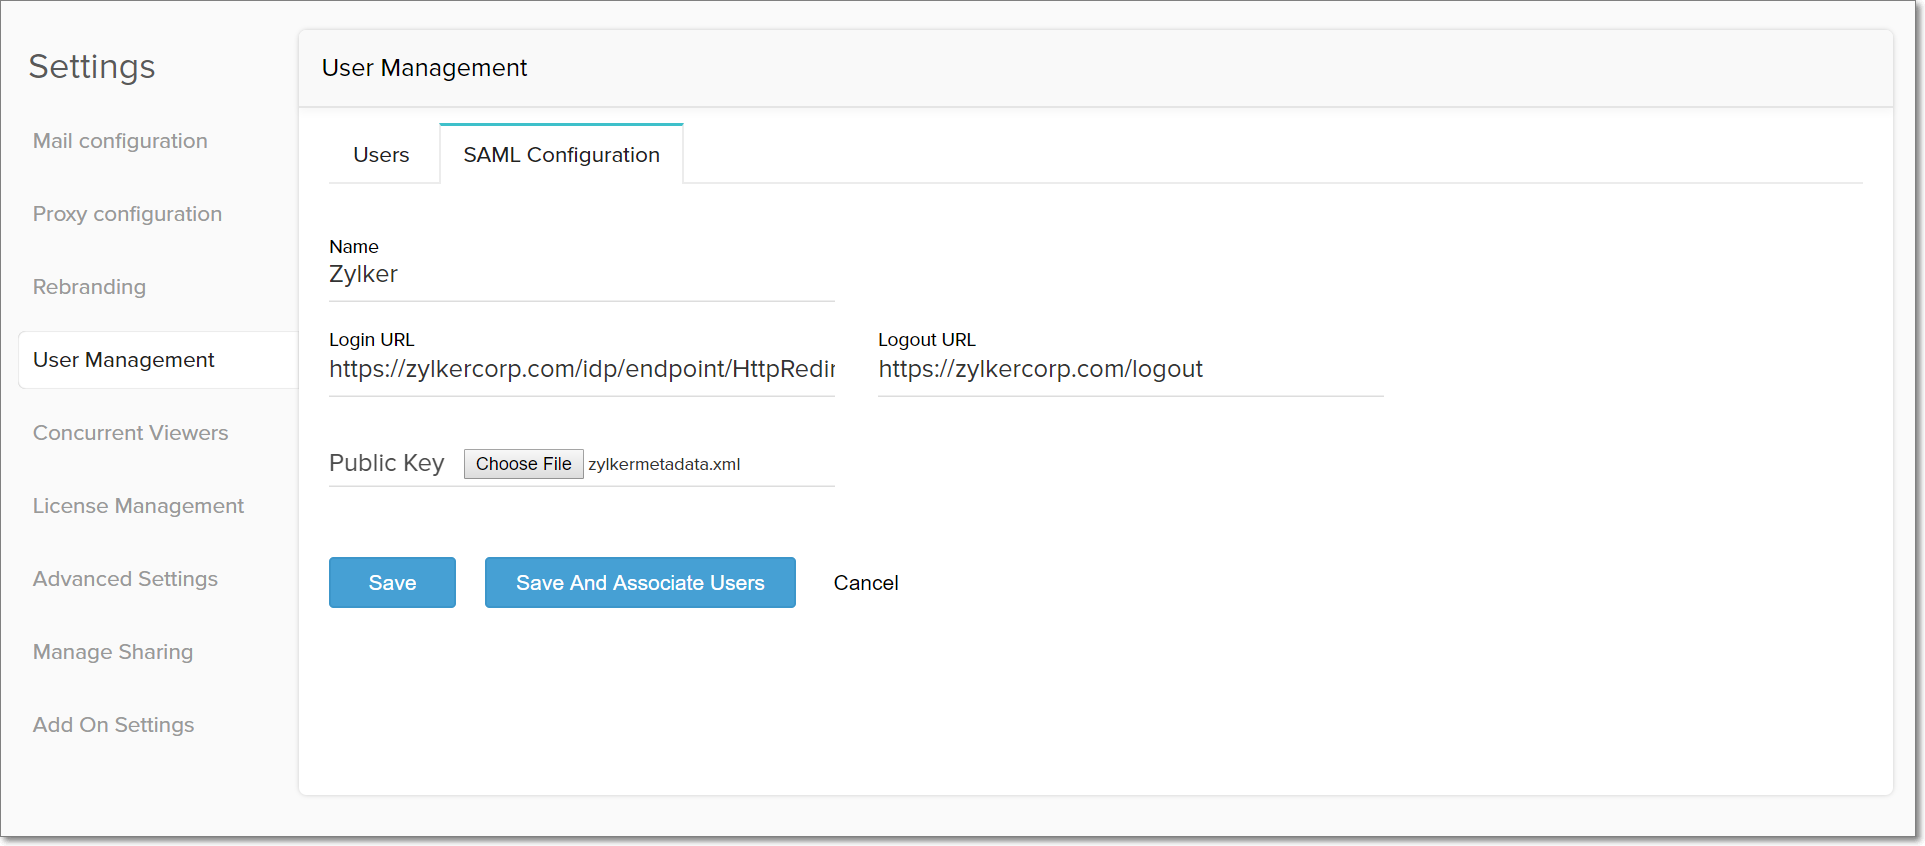
June
Build Number: 4270 (Release on: June 20, 2019)
Launching advanced analytics for ServiceDesk Plus' asset module
NewAnalytics Plus now offers out-of-the-box analytics for ServiceDesk Plus asset module. Click here to learn more.
Note: Existing Analytics Plus users should upgrade to Analytics Plus build 4270 and ServiceDesk Plus build 10504 to enable these reports.
Issues fixed
Issues fixed- Page loading and alignment issues faced by some customers upon upgrading to build 4260 have been fixed.
June
Build Number: 4260 (Release on: June 04, 2019)
Launching advanced analytics for ServiceDesk Plus MSP's request history, projects, and knowledge base management modules
NewAnalytics Plus now offers out-of-the-box analytics for ServiceDesk Plus MSP's request history, projects, and knowledge baseanagement modules.
Note: Existing Analytics Plus users should upgrade to Analytics Plus build 4270 and ServiceDesk Plus build 10504 to enable these reports.
May
Build Number: 4250 (Release on: May 13, 2019)
Introducing out-of-box integration with ServiceNow
NewAnalytics Plus seamlessly integrates with ServiceNow to facilitate out-of-the-box analytics on Incident management. Click here to learn more.
Support to connect live with Amazon Aurora - MySQL database
EnhancementAnalytics Plus now supports live connections for Amazon Aurora - MySQL database, allowing you to work with real-time data. Click here to learn more.
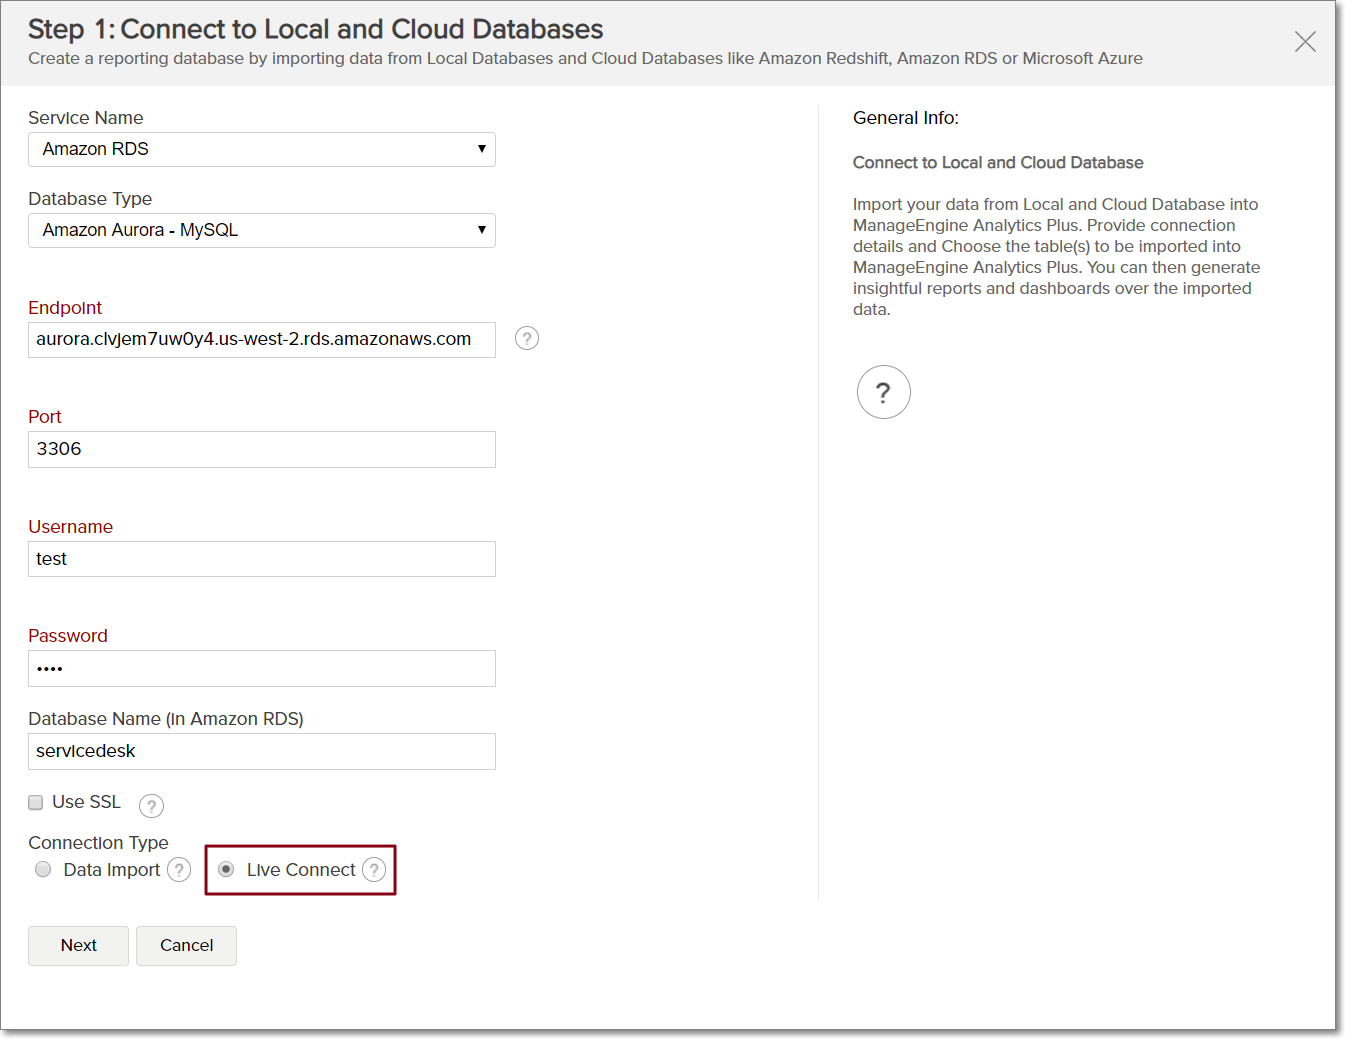
Import data from MongoDB database
NewYou can now import data from your MongoDB on-premise database into Analytics Plus. Click here to learn more.
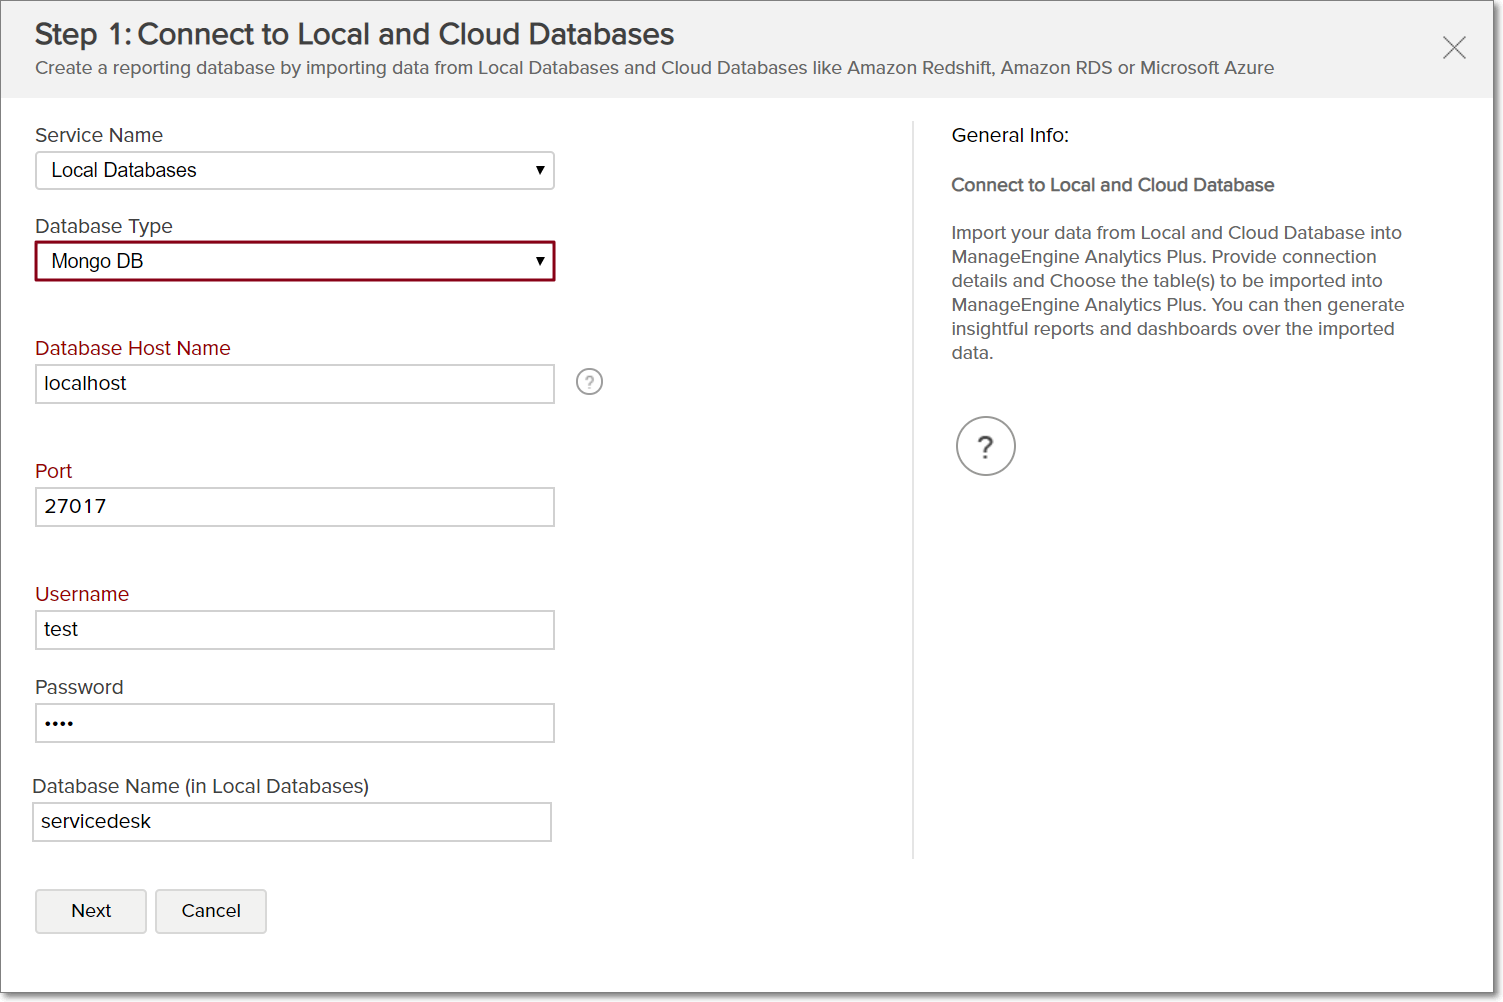
Issues fixed
Issues fixed- Issues in Endpoint Central integration, due to domain authentication or special characters in the password, have now been fixed.
March
Build Number: 4200 (Release on: March 27, 2019)
Introducing Live Connect for MySQL databases
NewAnalytics Plus has introduced a simple way to connect live with your MySQL databases, allowing you to work with real-time data from your databases. Click here to learn more.
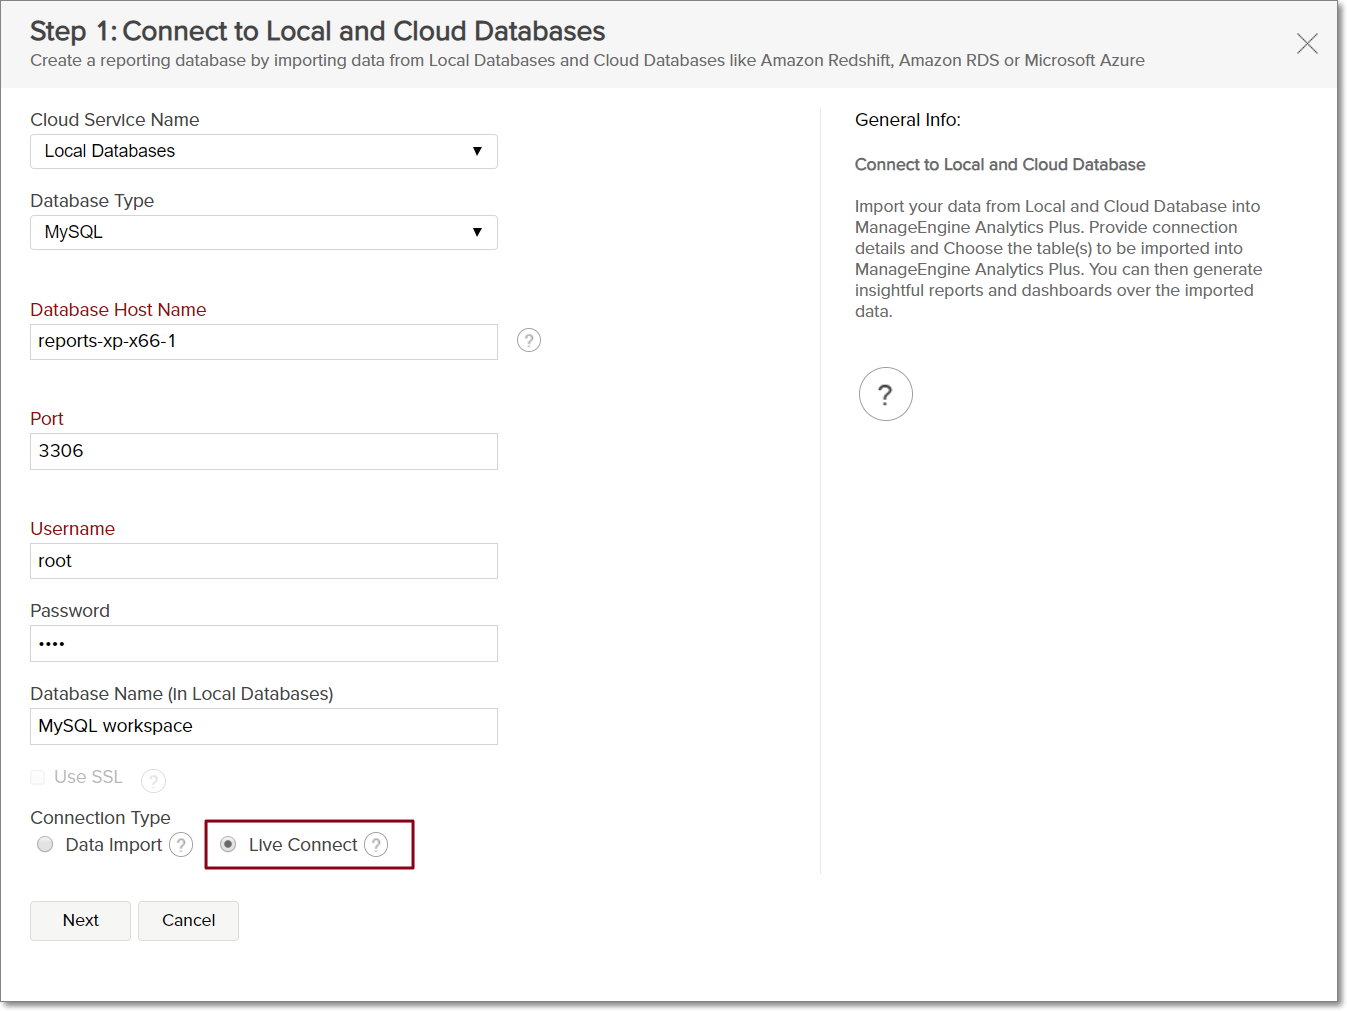
Support to choose multiple lookup columns
EnhancementYou can now select multiple lookup columns to join two tables. This lets you combine related tables using more than one condition. Click here to learn more.
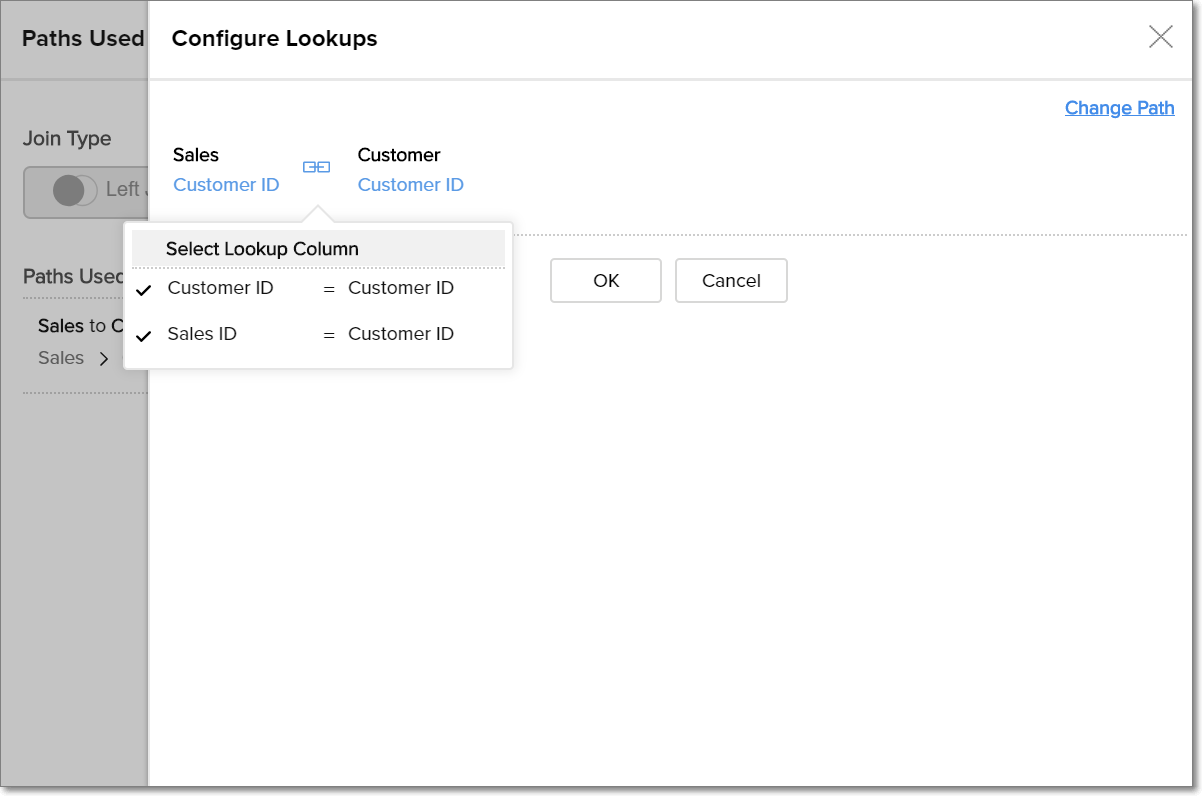
Denote numeric columns in lakhs and crores
EnhancementAnalytics Plus now supports the formatting of numeric columns as lakhs and crores. This will especially be useful for users from the Indian subcontinent.
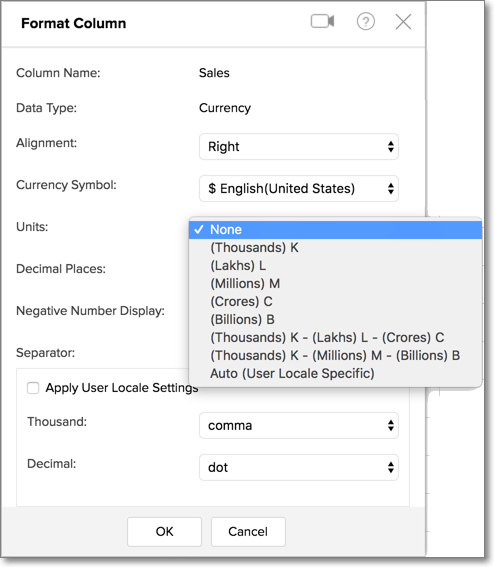
The following are the new options added to format numeric columns.
- Lakhs (L) - Data will be formatted in lakhs.
- Crores (C) - Data will be formatted in crores.
- Thousands (K) - Lakhs (L) - Crores (C)- Data will be auto formatted as thousands, lakhs and crores based on the range the value falls in.
- Thousands (K) - Millions (M) - Billions (B) - Data will be auto formatted as thousands, millions and billions based on the range the value falls in.
- Auto (User Locale Specific) - Data will be auto formatted to the unit value as per the users' locale settings i.e., Data will be formatted in K-L-C, if the user locale is from Indian subcontinent, and K-M-B for all other regions.
Click here to learn more.
Generating AuthTokens
EnhancementThe AuthToken required for using the Analytics Plus APIs is now just a click away.
Issues fixed
Issues fixed- Alignment issues while exporting dashboards as PDF has now been fixed.
Feb
Build Number: 4150 (Release on: February 09, 2019)
Introducing out-of-box integration with Endpoint Central
NewAnalytics Plus now integrates with ManageEngine Endpoint Central to provide detailed reports on computers, patch deployments, patch scans, and much more. Click here to learn more.
2018
Dec
Build Number: 4100 (Release on: December 24, 2018)
In-memory columnar engine for faster analytics
Enhancement- In-memory columnar engine has been integrated into Analytics Plus for high performance at scale. Now experience analytics at speed with faster rendering of reports and dashboards.
Note: The in-memory columnar engine is available only for the Linux platform of Analytics Plus.
- Actian Vector (community and commercial versions available) columnar engine is now supported as a plug-able option for high performance at scale. Users can use this as an alternative to the inbuilt columnar engine.
Note: Actian vector columnar engine is supported in both Linux and Windows platform.
Get in touch with analyticsplus-support@manageengine.com for more details.
Nov
Build Number: 4000 (Release on: November 15, 2018)
Revamped home page
EnhancementAnalytics Plus home page has been completely revamped for easy navigation.
1. Dashboards can now be accessed with a single click using the preview cards.
2. The main navigational elements are made bigger and bolder now, with the analytics elements organized into three categories (dashboards, reports & data) for easy accessibility.
3. Analytics Plus now allows theme customization, enabling you to change the look and feel of the entire application with a single click.
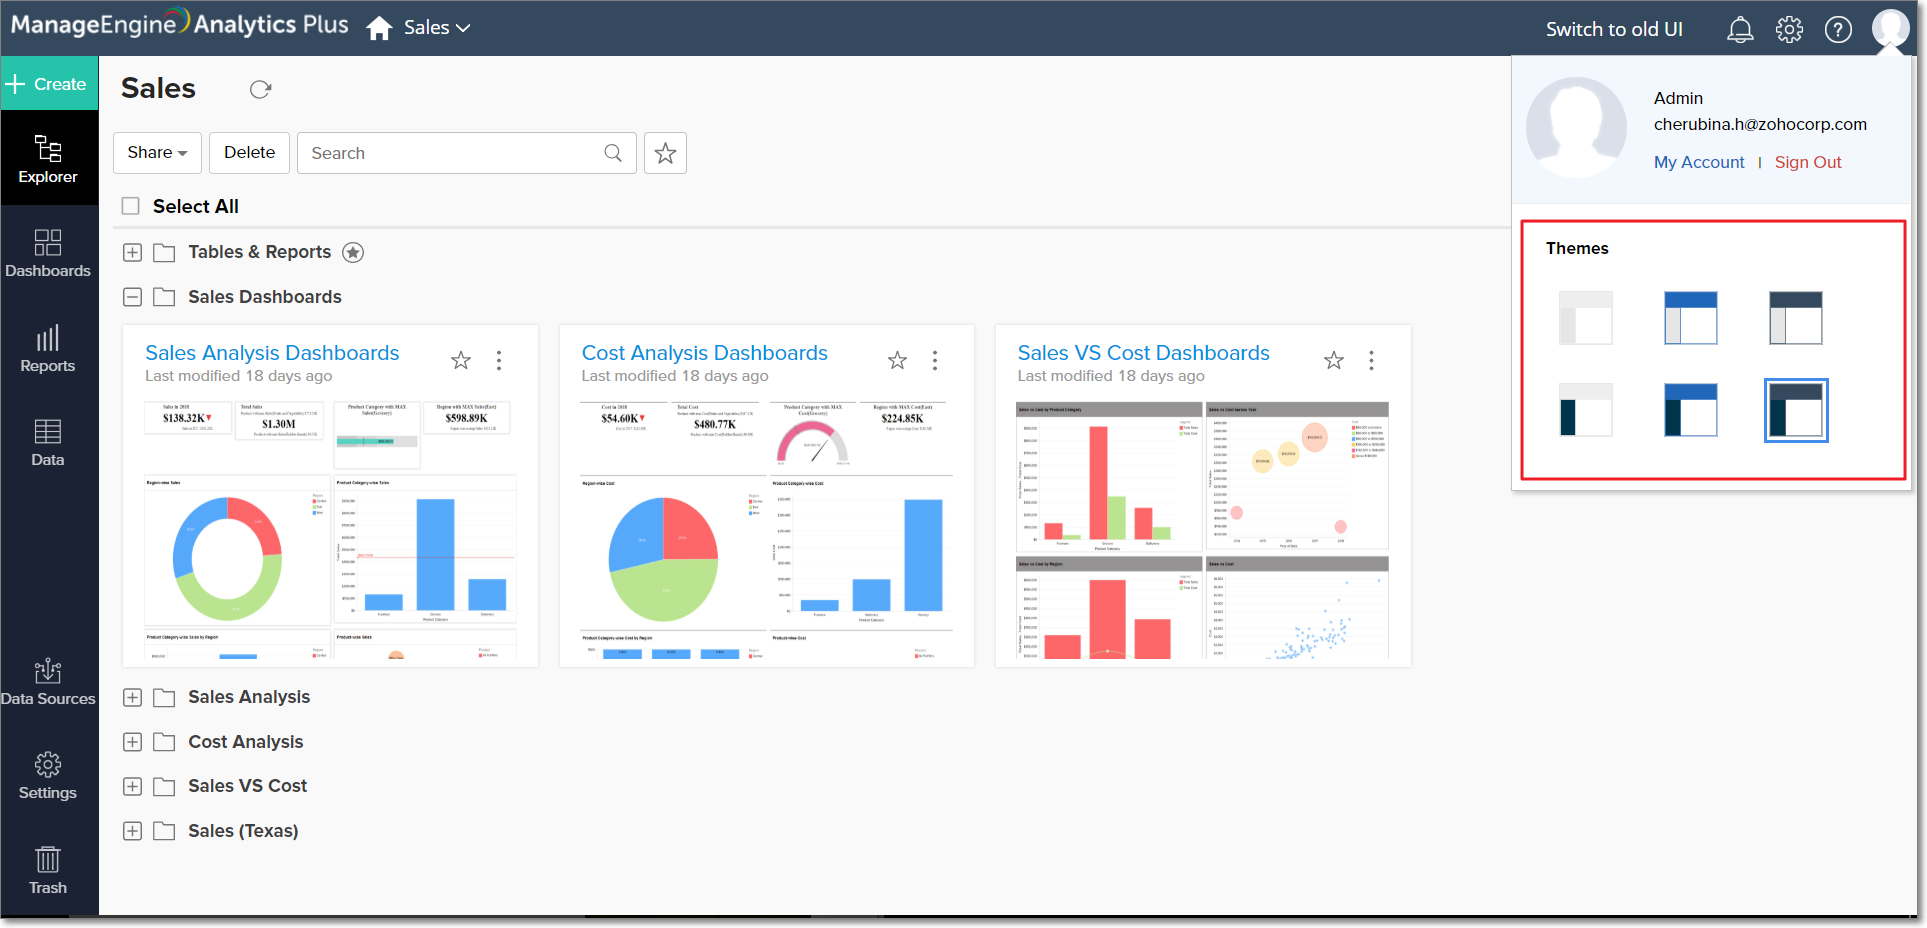
Introducing Report Commenting
NewInsert comments in your reports and reach consensus with your team regarding key metrics without ever leaving your Analytics Plus console.
Click here to learn more.
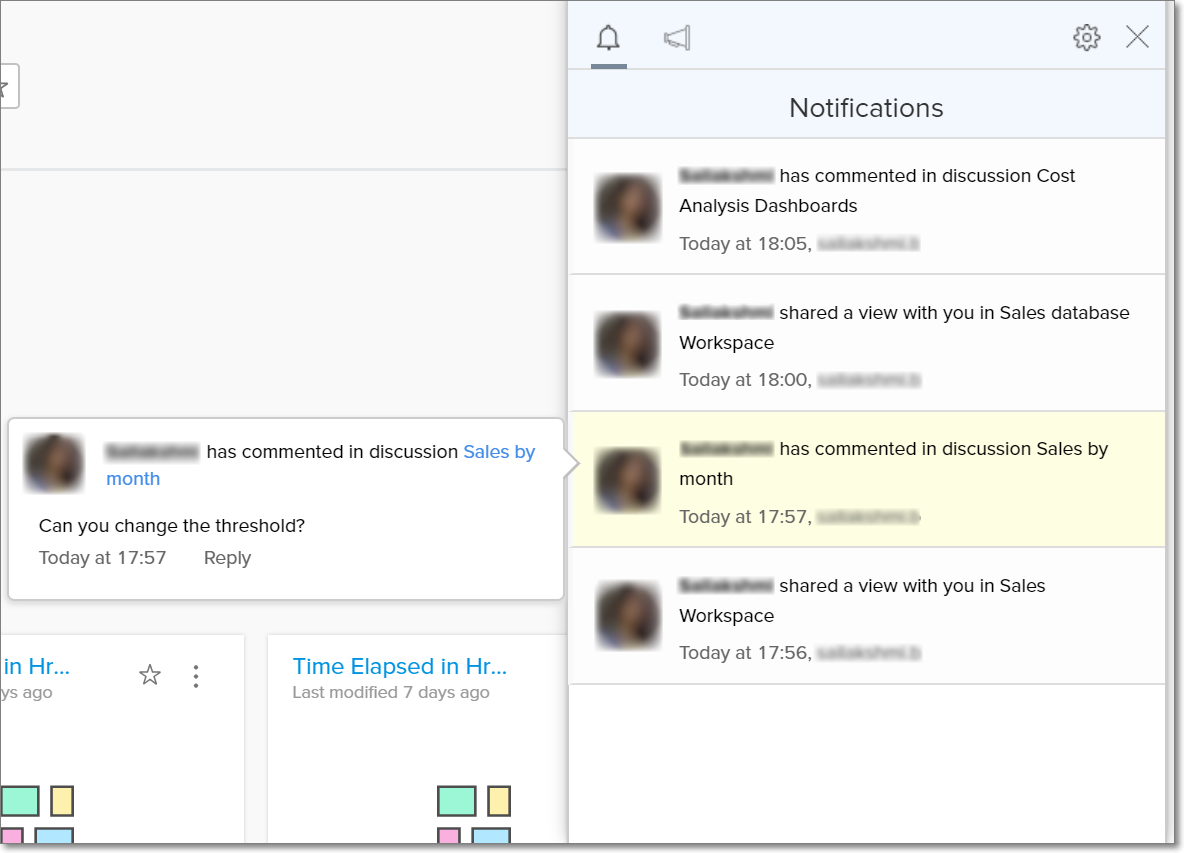
Import data from cloud sources
NewAnalytics Plus now supports importing data from cloud sources such as Google Drive, Box, Dropbox, and OneDrive. Click here to learn more.
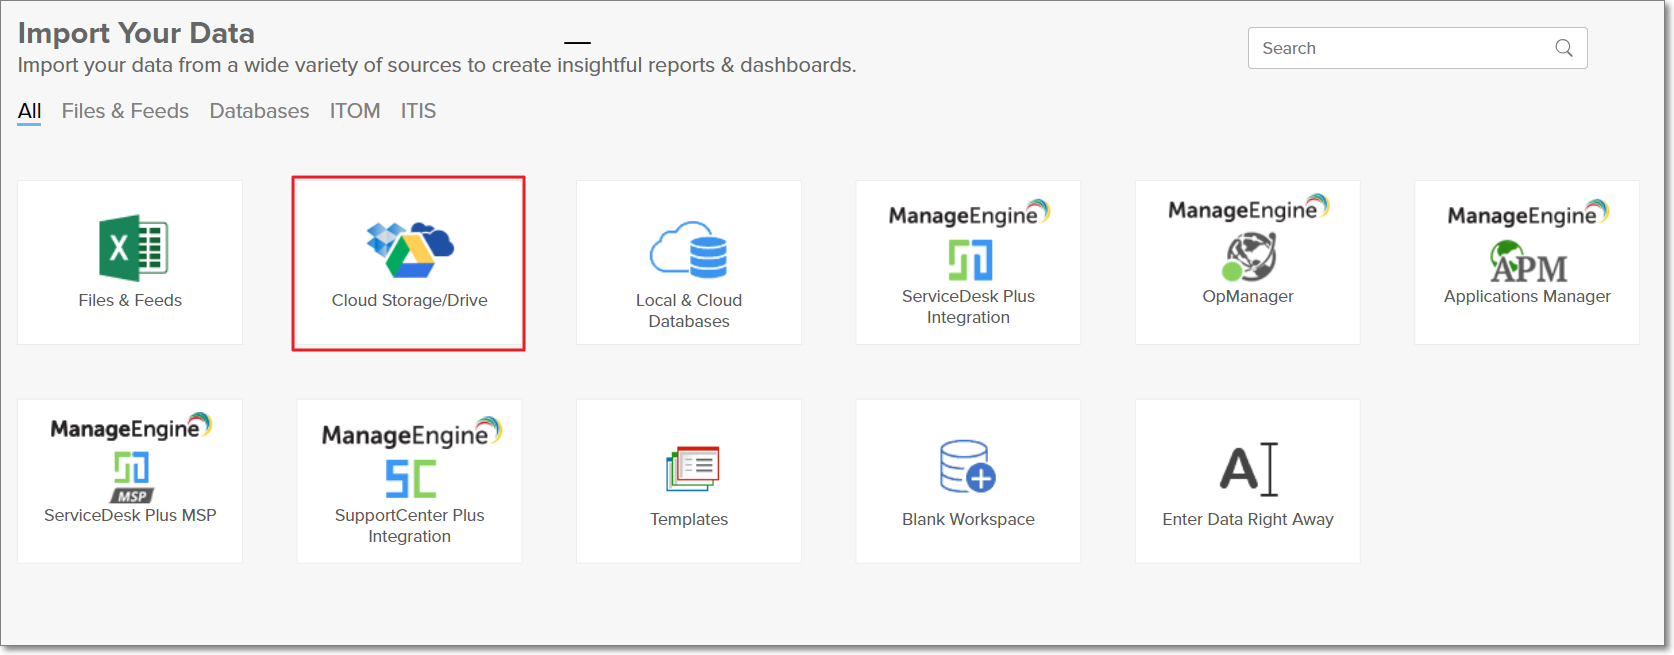
Introducing new themes for dashboards
NewAnalytics Plus has introduced six new preset themes for dashboards. You can now apply specific colors to each element in the dashboard with a single click.
Click here to learn more.
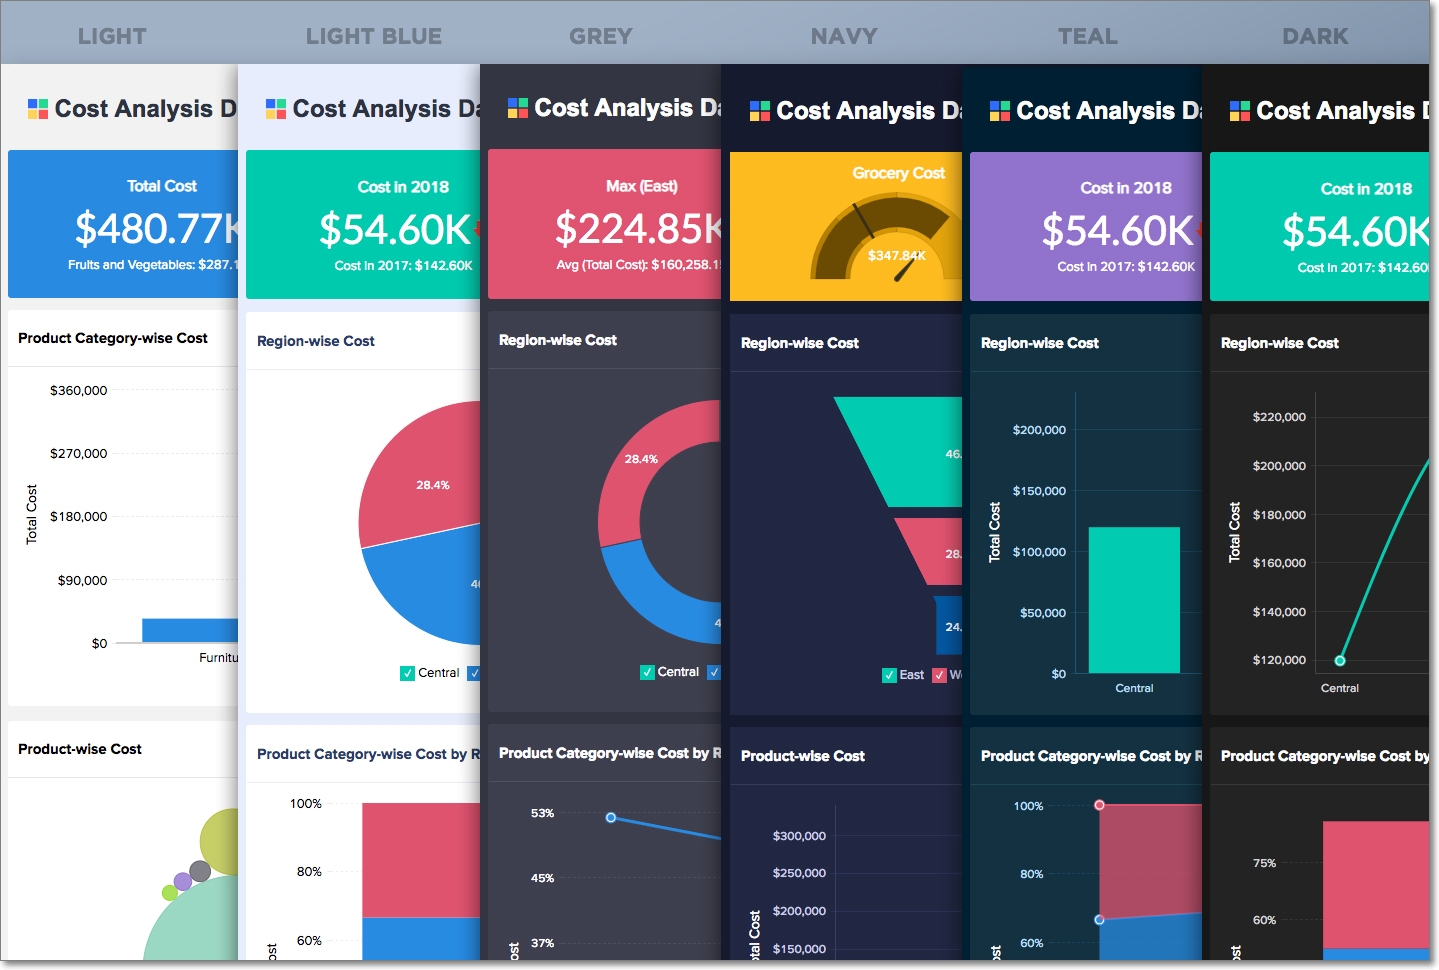
Advanced summarizing functions for pivot table
EnhancementAnalytics Plus now supports the following advanced summarizing functions in pivot table.
- % of Row in Group - Displays the data in each cell as a percentage of the total value, of each row within a group.
- % of Column in Group - Displays the data in each cell as a percentage of the total value, of each column within a group.
- Lookup Value - Displays the data in each cell by fetching value from any of Previous/Next/First/Last cell, based on the Base Field selected.
Click here to learn more.
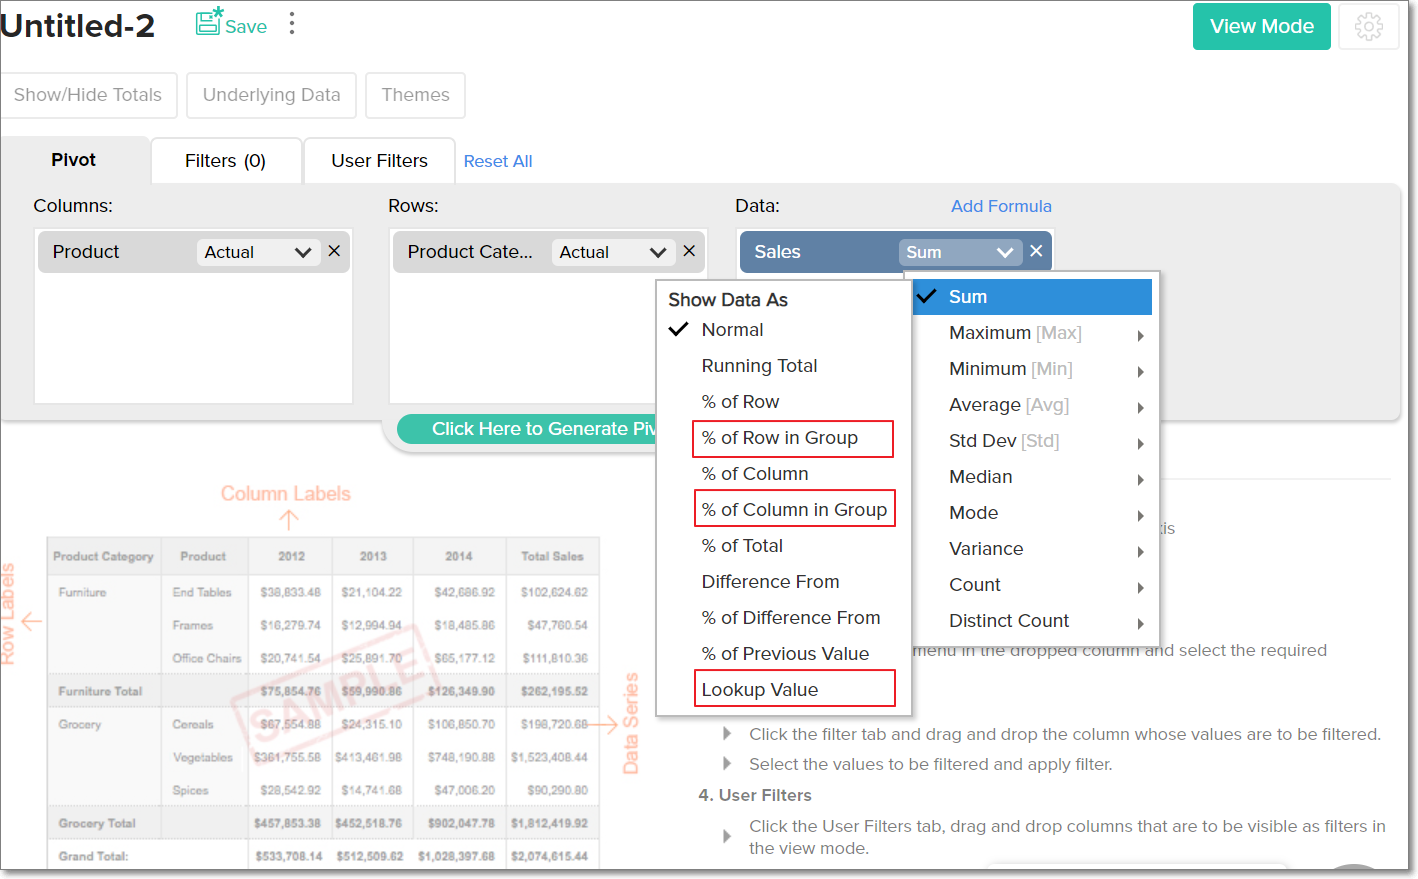
Share selective columns from tables
EnhancementWhile sharing tables, you can now exclude columns with personal data to ensure data security and GDPR compliance.
Click here to learn more.
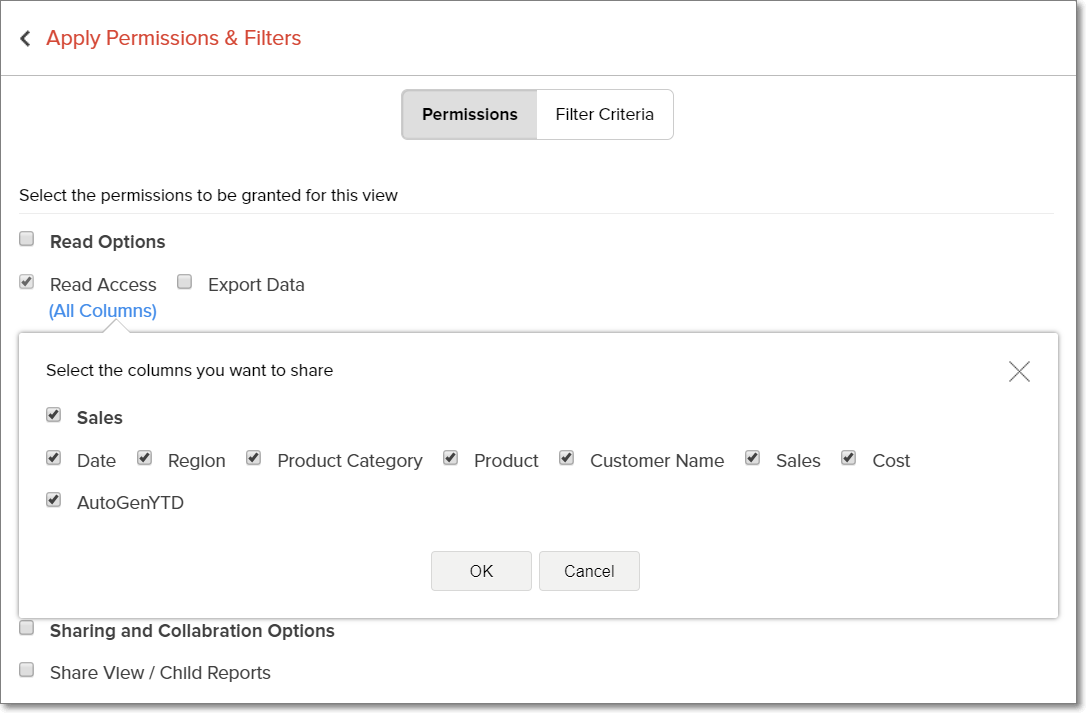
Configure lookup relationships
EnhancementAnalytics Plus now allows you to customize your reports by revising the default lookup relationship between tables used in creating the report.
Click here to learn more.
Customized dashboard interactions
EnhancementYou can now enable or disable the following interactions in your dashboard:
- Drill Down in charts
- View Underlying Data in reports
- Sort Menu in grid views
- Show/Hide Columns in tabular views
- Contextual options menu on hover
- Smart Align charts
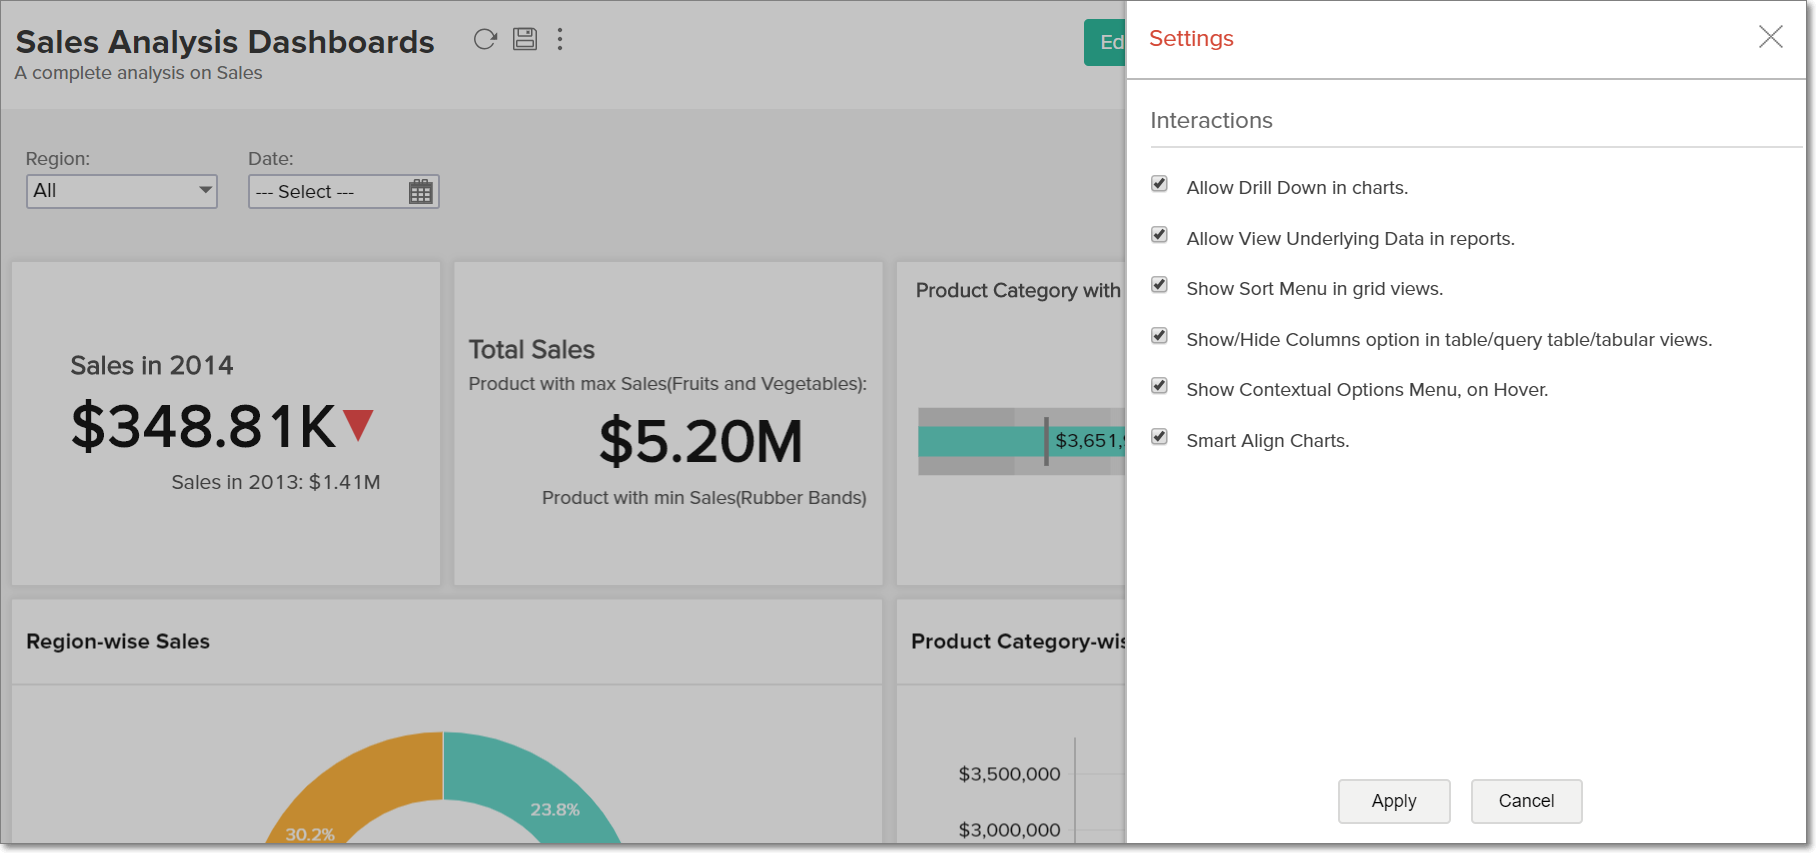
Colored KPI Widgets
NewUsing the new widget color options you can select specific colors for each widget in your dashboard. Click here to learn more.
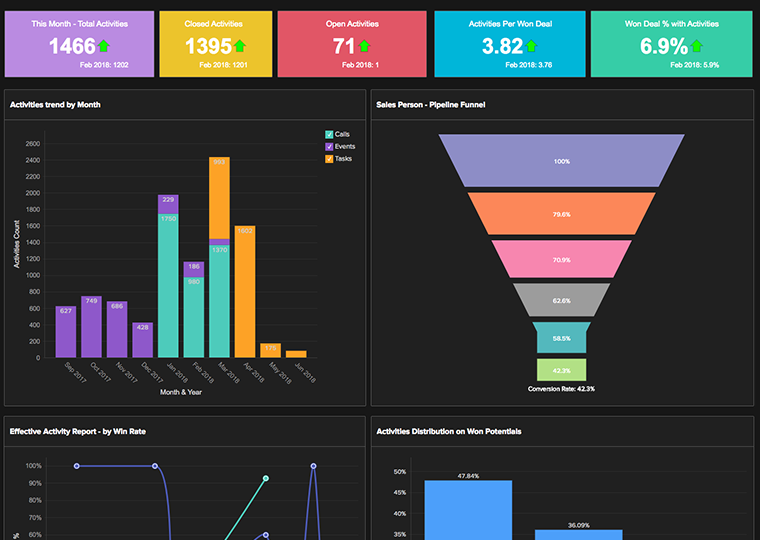
Data Alerts
NewAnalytics Plus now allows you to create alerts and get notified via email or in-app notifications when data points breach a threshold.
To learn more, refer the Data Alerts section.
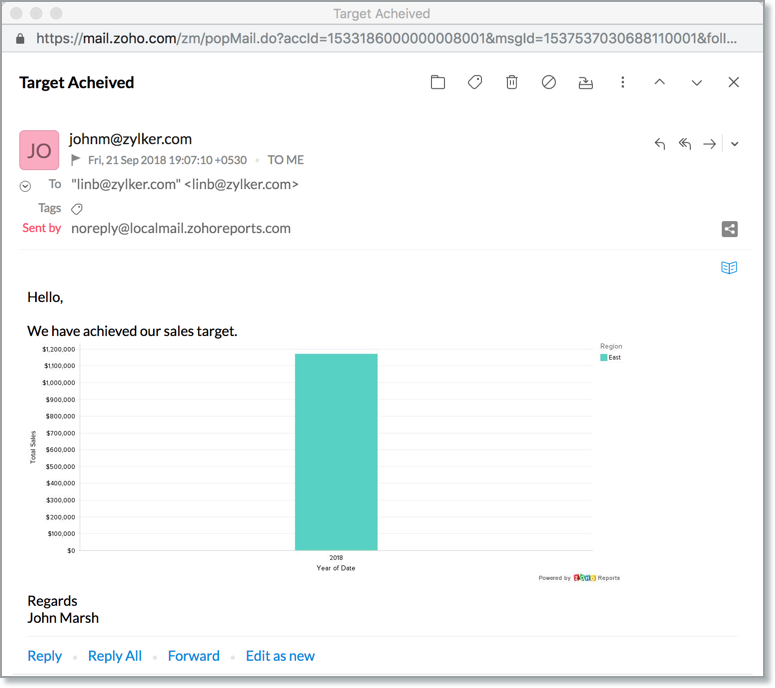
Oct
Build Number: 3950 (Release on: October 12, 2018)
Launching advanced analytics for ServiceDesk Plus' request history, projects, and knowledge base management modules.
NewAnalytics Plus now offers out-of-the-box analytics for ServiceDesk Plus' request history, projectsand knowledge base management modules.
Note: Existing Analytics Plus users should upgrade to Analytics Plus build 3950 and ServiceDesk Plus build 9422 to enable these reports.
Issues fixed
Issues fixed- The 60-character limitation on column names in tables integrated out-of-the-box from ServiceDesk Plus has now been removed.
Sep
Build Number: 3900 (Release on: September 18, 2018)
Change in terminology
Enhancement- Henceforth, the Reporting Database will be referred to as Workspace. You can learn more about Workspaces here.
- A Database Owner or DB Owner will be referred to as a Workspace Admin.
Note: The name change will not affect any existing functionality. If you have any questions, please write to us at analyticsplus-support@manageengine.com.
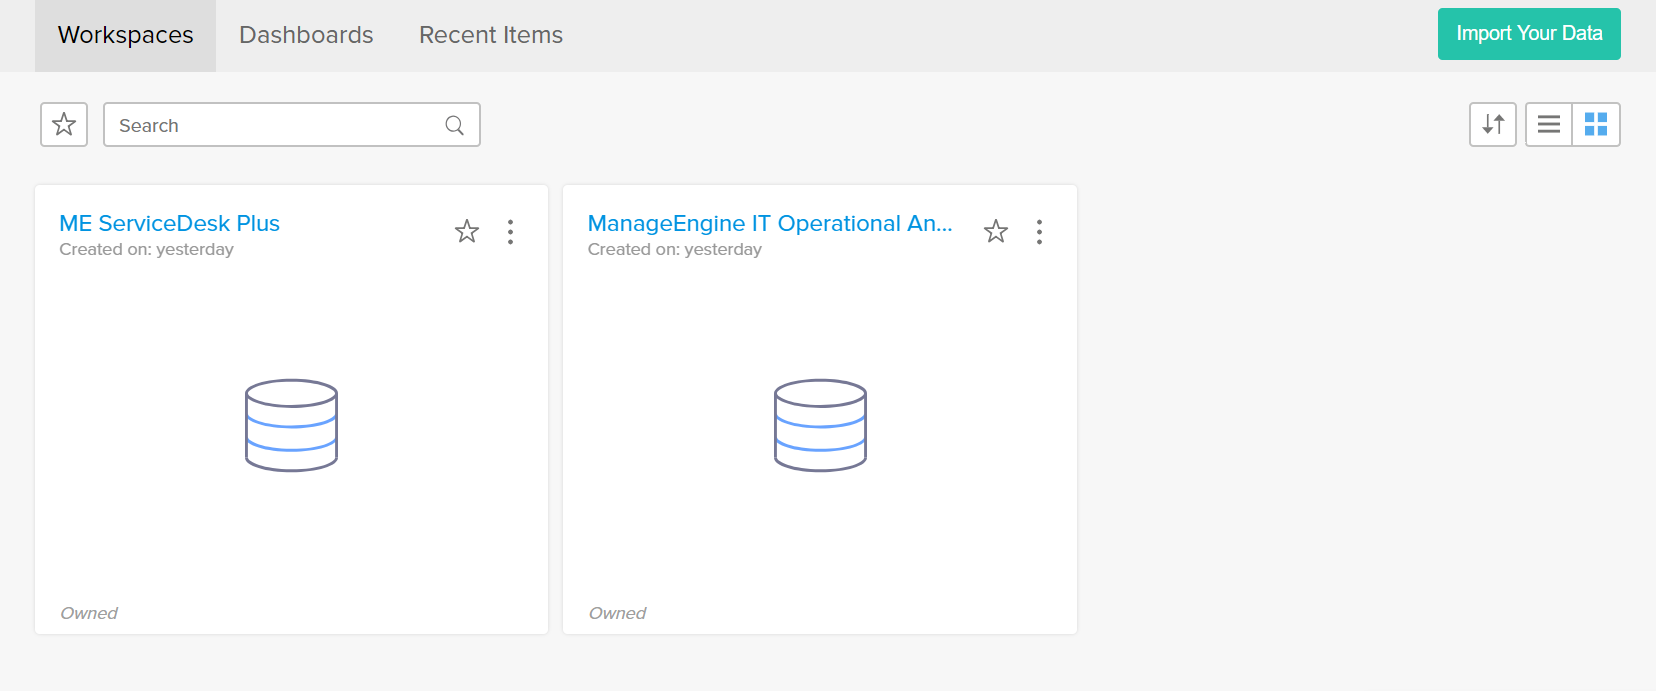
Merging User Filters
EnhancementAnalytics Plus now allows you to merge duplicate user filters from different tables as one common filter. The below animation shows the merging of user filters.
The option to merge user filters comes in handy when you have a dashboard with reports created over common columns (columns with the same name) from multiple tables. Click here to learn more.
Aug
Build Number: 3800 (Release on: August 17, 2018)
Data Protection and GDPR compliance
NewAnalytics Plus rolls out its next phase of updates in compliance with GDPR. With this update, columns marked as 'personal data' will be excluded during export operations. Users can opt to include these columns manually using the column picker. Click hereto learn more.
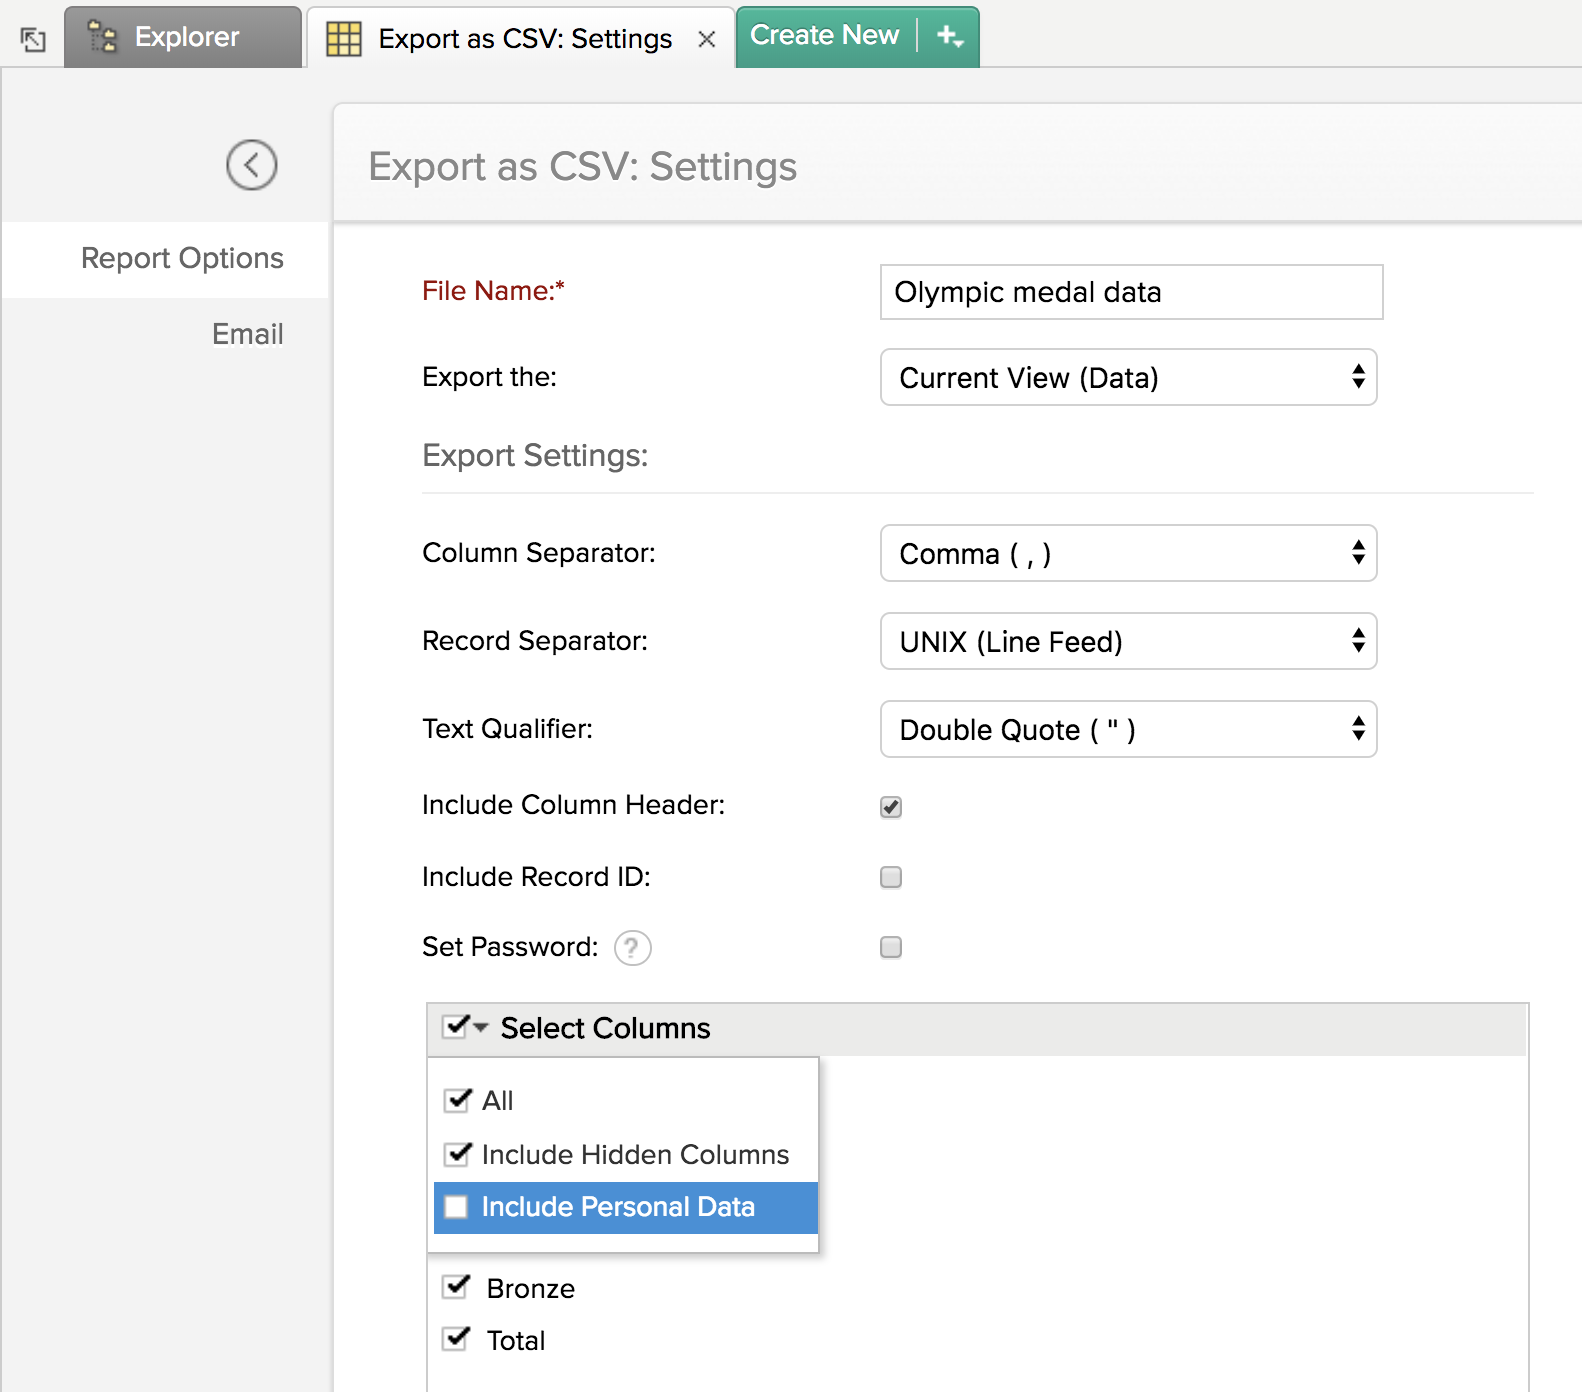
Enhacements in dashboard user filters
EnhancementDashboard user filters will now be anchored to the explorer bar to allow users to apply filters to reports from any section of the dashboard. Users no longer have to scroll to the top of the dashboard to access the filters.
Updated geo location picker for maps
EnhancementYou can now use the updated geo location picker to resolve unidentified locations on map charts. Until now, users had to provide latitude and longitude of the unidentified location. Click here to learn more.
Enhanced data prep option for tables
EnhancementYou can now use the split column option to effortlessly split text-based columns using separators such as comma, space, ampersand, etc., This can be used to extract user ID's from email addresses, separate first and last names, etc., Click here for more information.
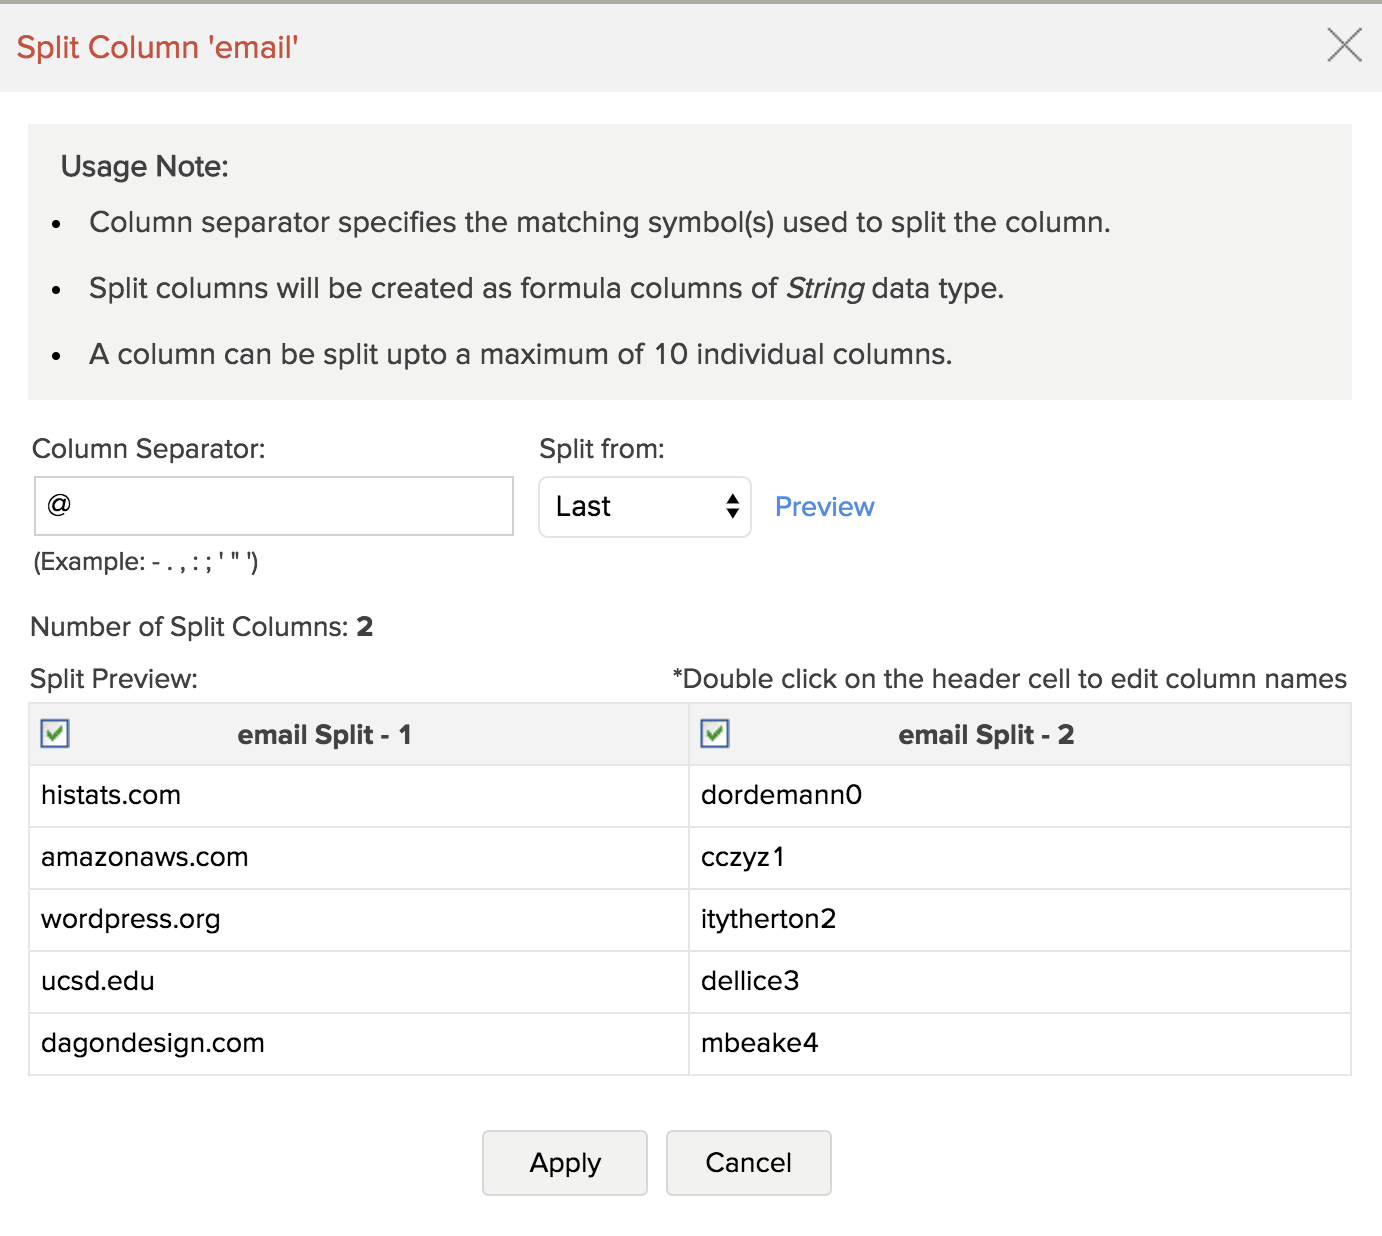
Introducing support for MS Access Database
NewYou can import data from MS access database into Analytics Plus using local drives, FTP servers, cloud drives, and web links of MS Access Database. Click here more information.
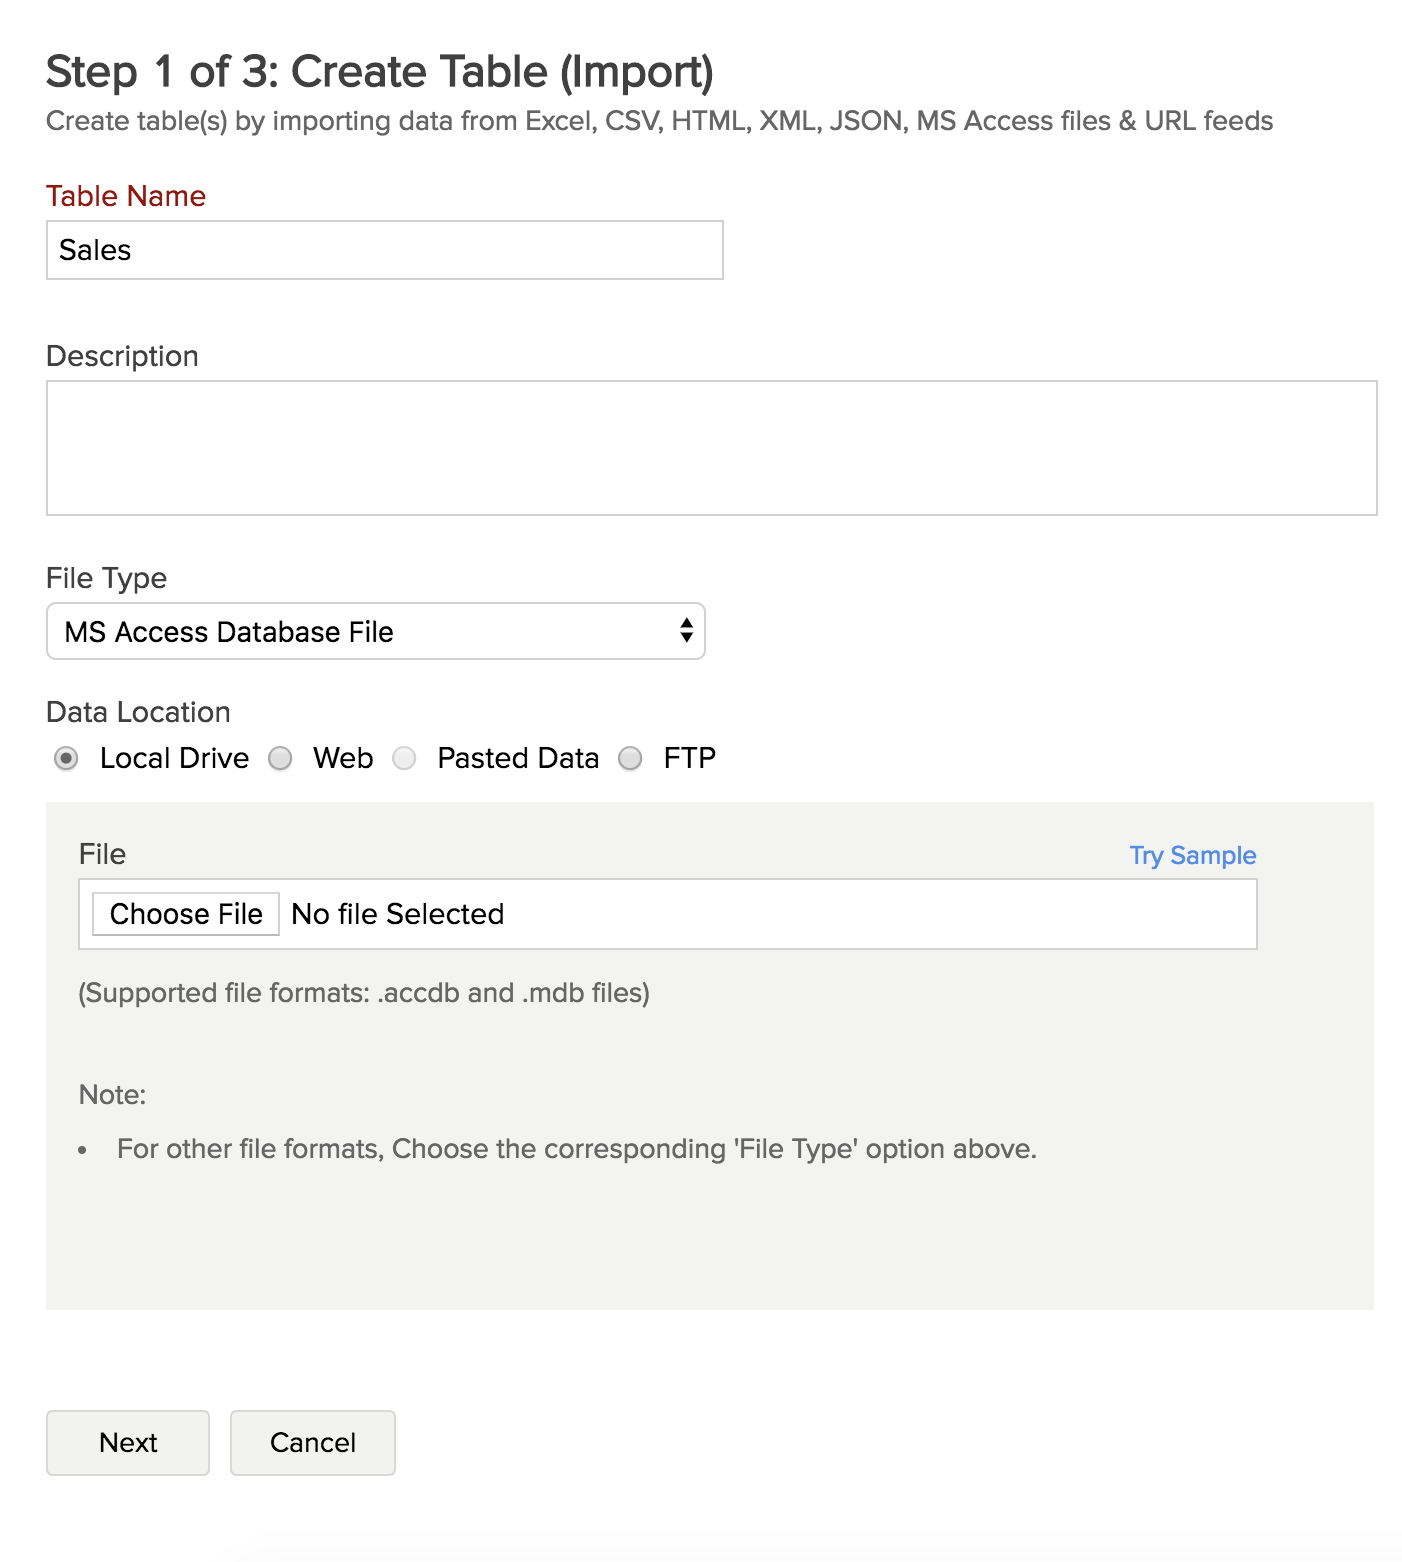
Introducing support for dynamic parameter for web URL imports
EnhancementWith this update, you can pass dynamic parameter values such as current date, time, and current date and time, while importing data from web URLs.
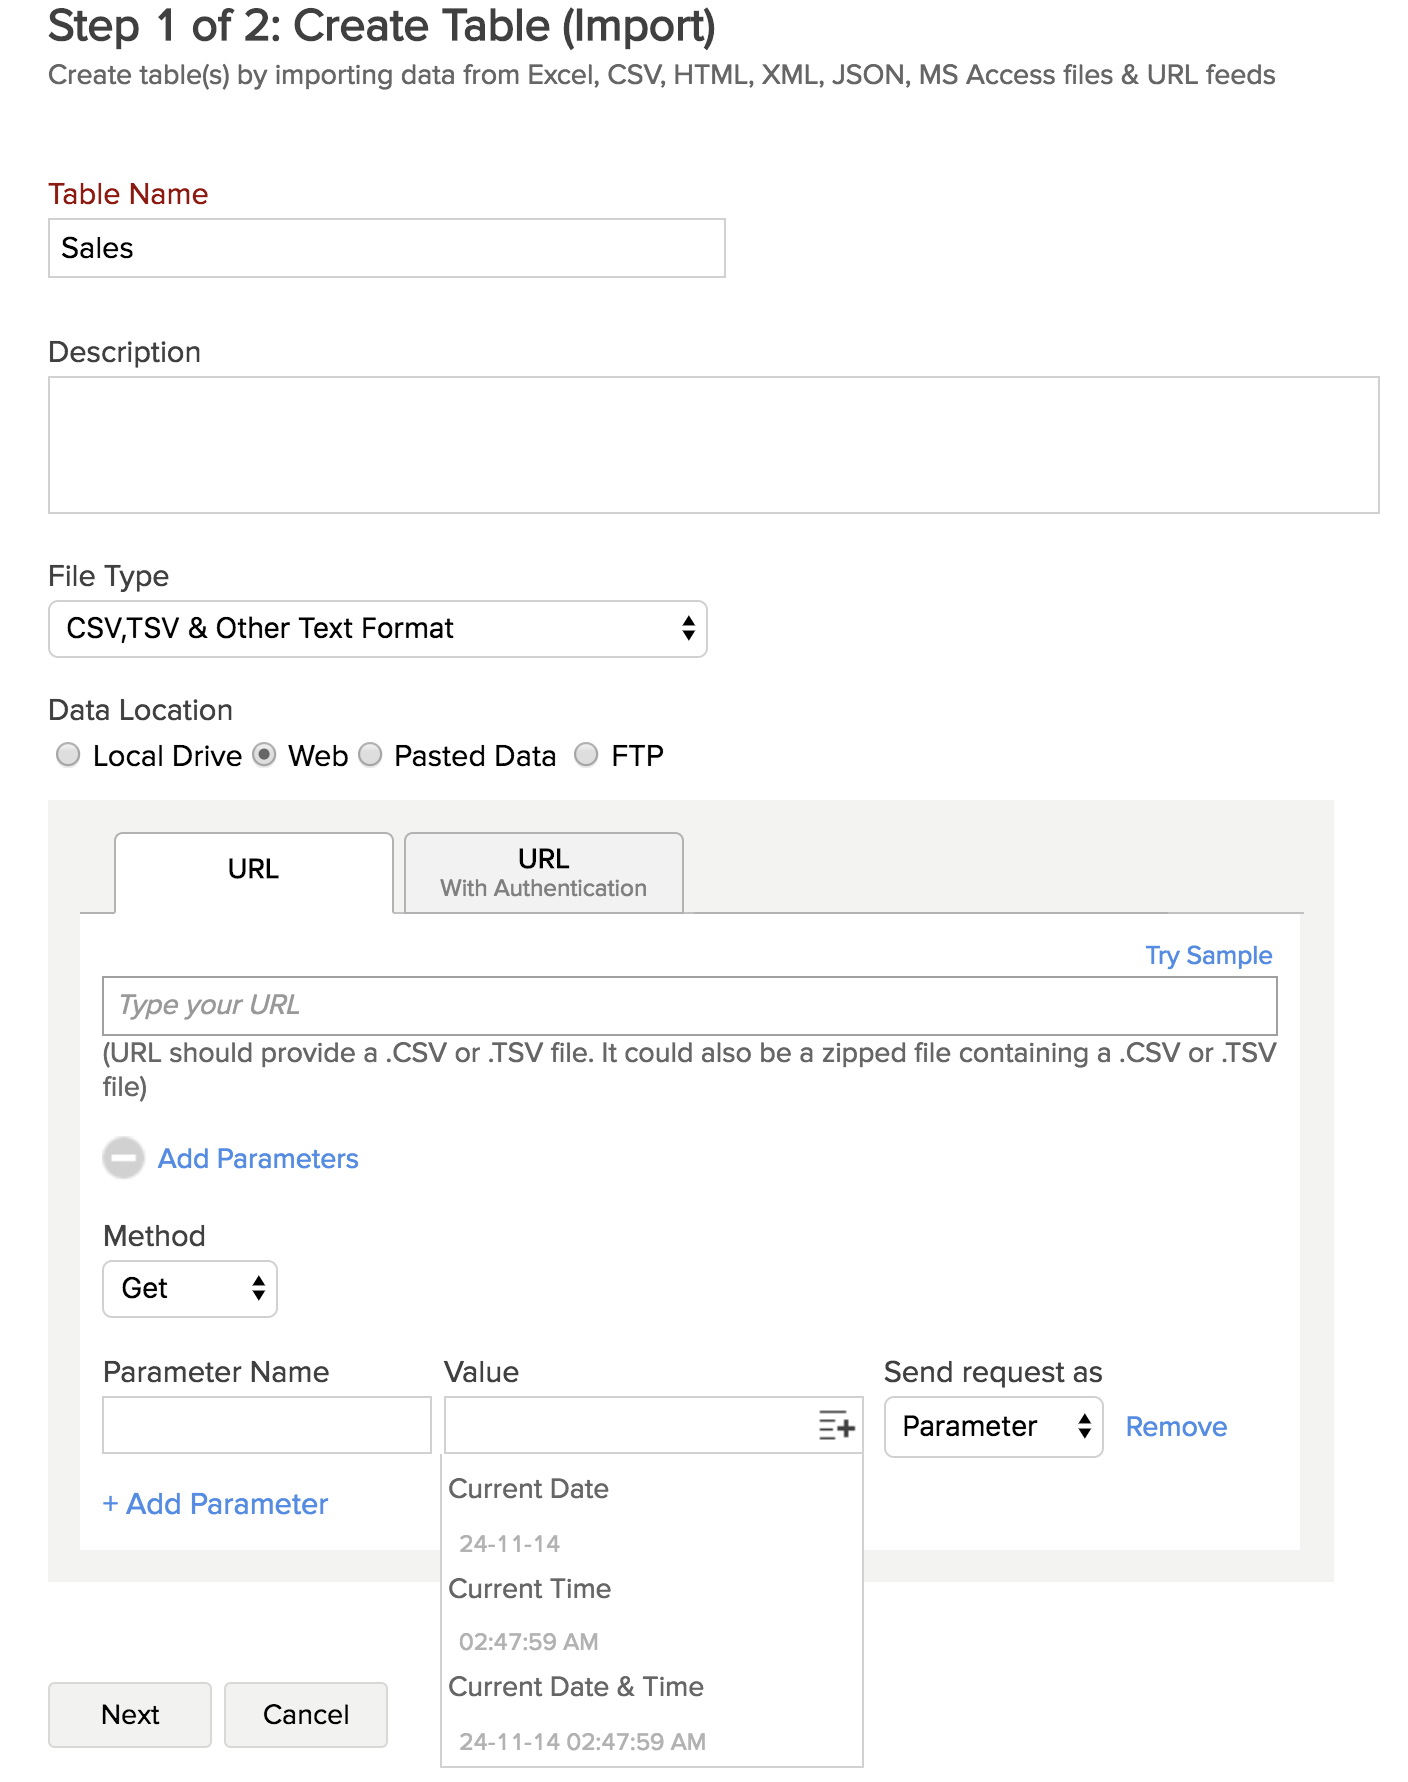
Introducing support for multiple date formats during import
EnhancementImport tables that have date columns in different formats. Earlier, all date columns needed to be in a single date format for proper categorization.
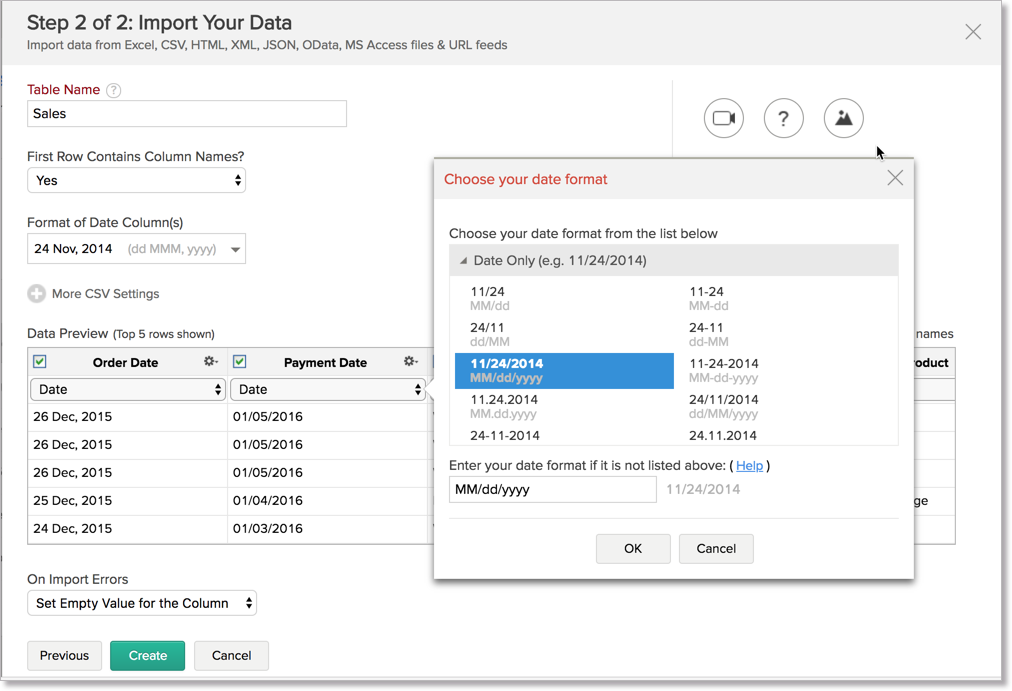
Introducing support for importing data from secured web URL using OAuth authentication
EnhancementAnalytics Plus now supports importing data from web links using OAuth 1.0 and OAuth 2.0 authentication protocol.
June
Build Number: 3700 (Release on: June 11, 2018)
Data protection and GDPR compliance
NewWith this release, we roll out our first phase of updates to make Analytics Plus GDPR (General Data Protection Regulation) compliant. You now have options to ensure data safety, especially during sharing and collaboration.
Password protection for your exports and email attachments
NewYou can now choose to set a password for files exported or emailed from Analytics Plus. Click here to learn more about securing your emails and exports.

Safely publish your dashboards
EnhancementYou can now safely publish your dashboards and other views using password protection. Click here to know more about protected publishing.
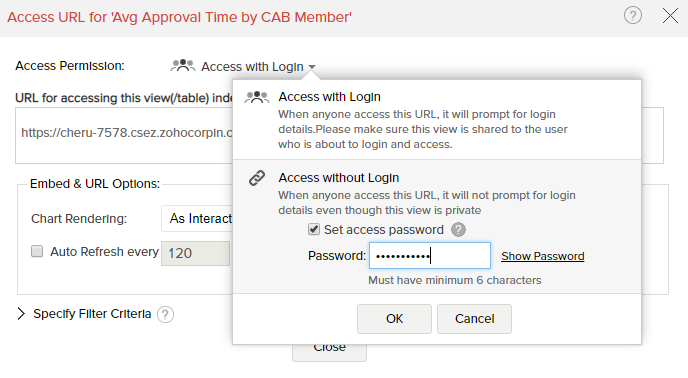
Feature updates
New map chart variants
NewMap chart now supports three more types: Map - Bubble, Map - Pie, and Map - Bubble Pie. Click here to know more about enhanced map charts.
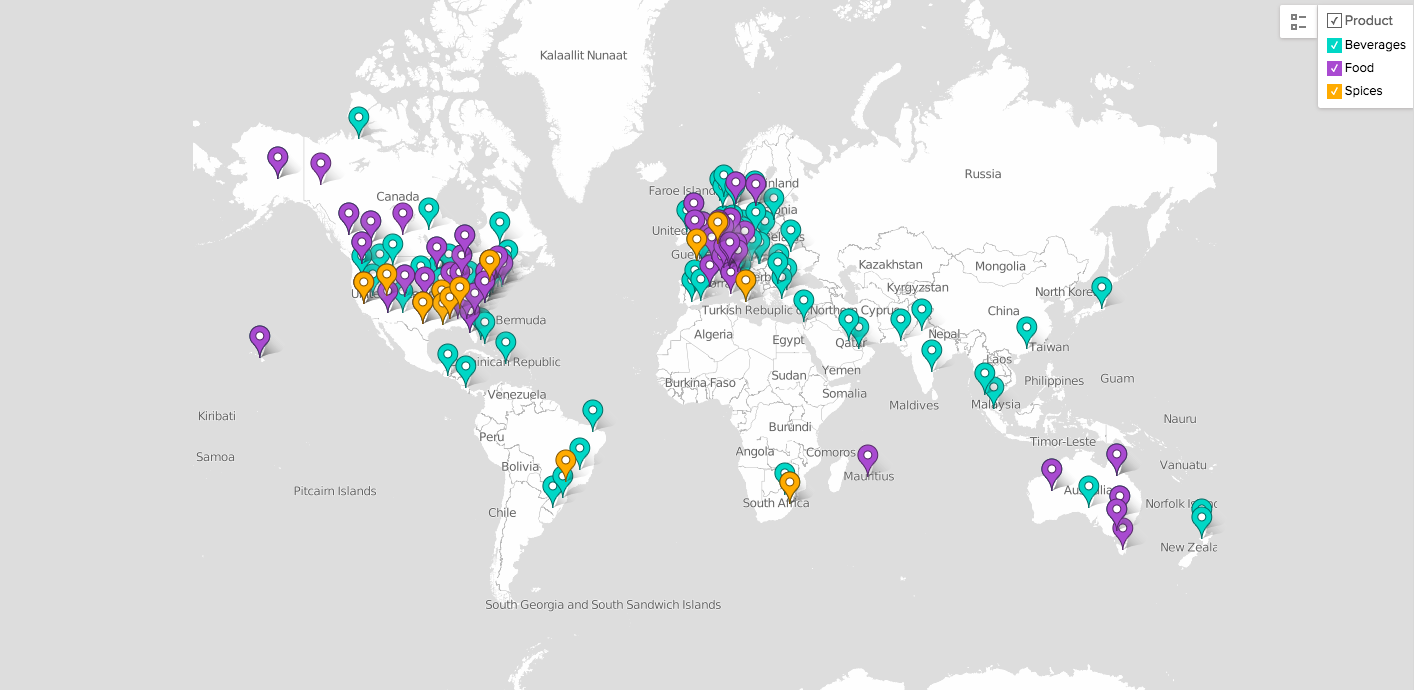
Customize KPI widgets and charts
EnhancementAnalytics Plus provides quick formatting options in KPI Widgets. You can also customize the X axis, Y axis, color, and tooltip components in charts.
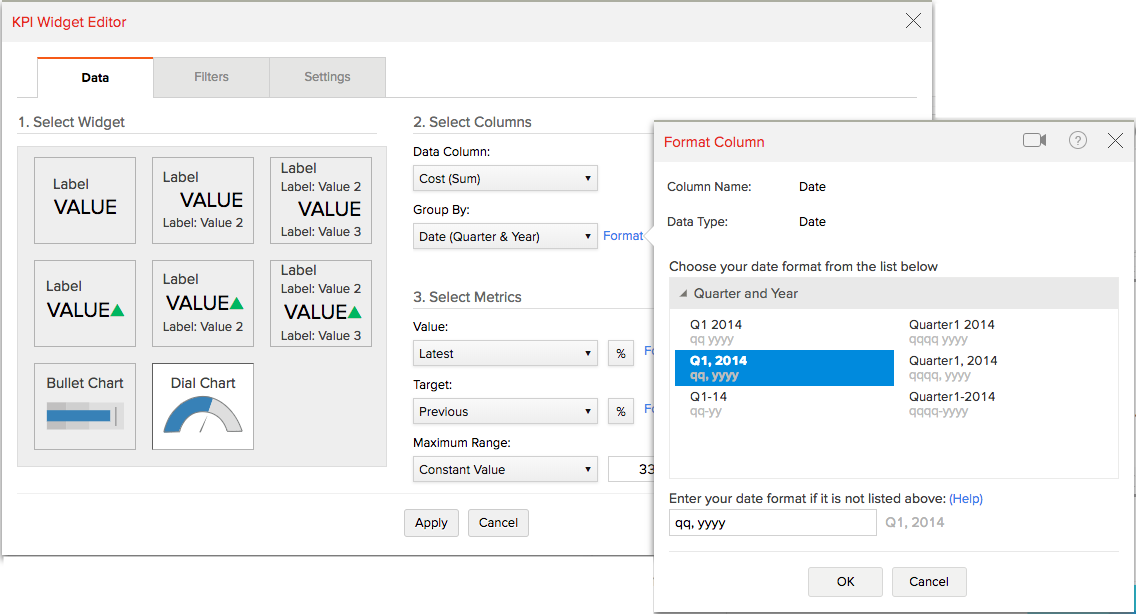
May
Build Number: 3600 (Release on: May 18, 2018)
Enhancements to the Analttics Plus architecture
EnhancementArchitectural changes to enable easy access over the internet and local networks.
May
Build Number: 3500 (Release on: May 18, 2018)
Introducing a unified data sources page to manage all your data imports
NewThe Data Sources page enables users to view and manage all data sources within the same workspace from a single location. You can view details such as data source, table name, last imported time, and next import schedule. A Sync Now option lets you synchronize the data source on an ad-hoc basis.
This page can be accessed by clicking on the Data Sources button at the buttom left of the screen.
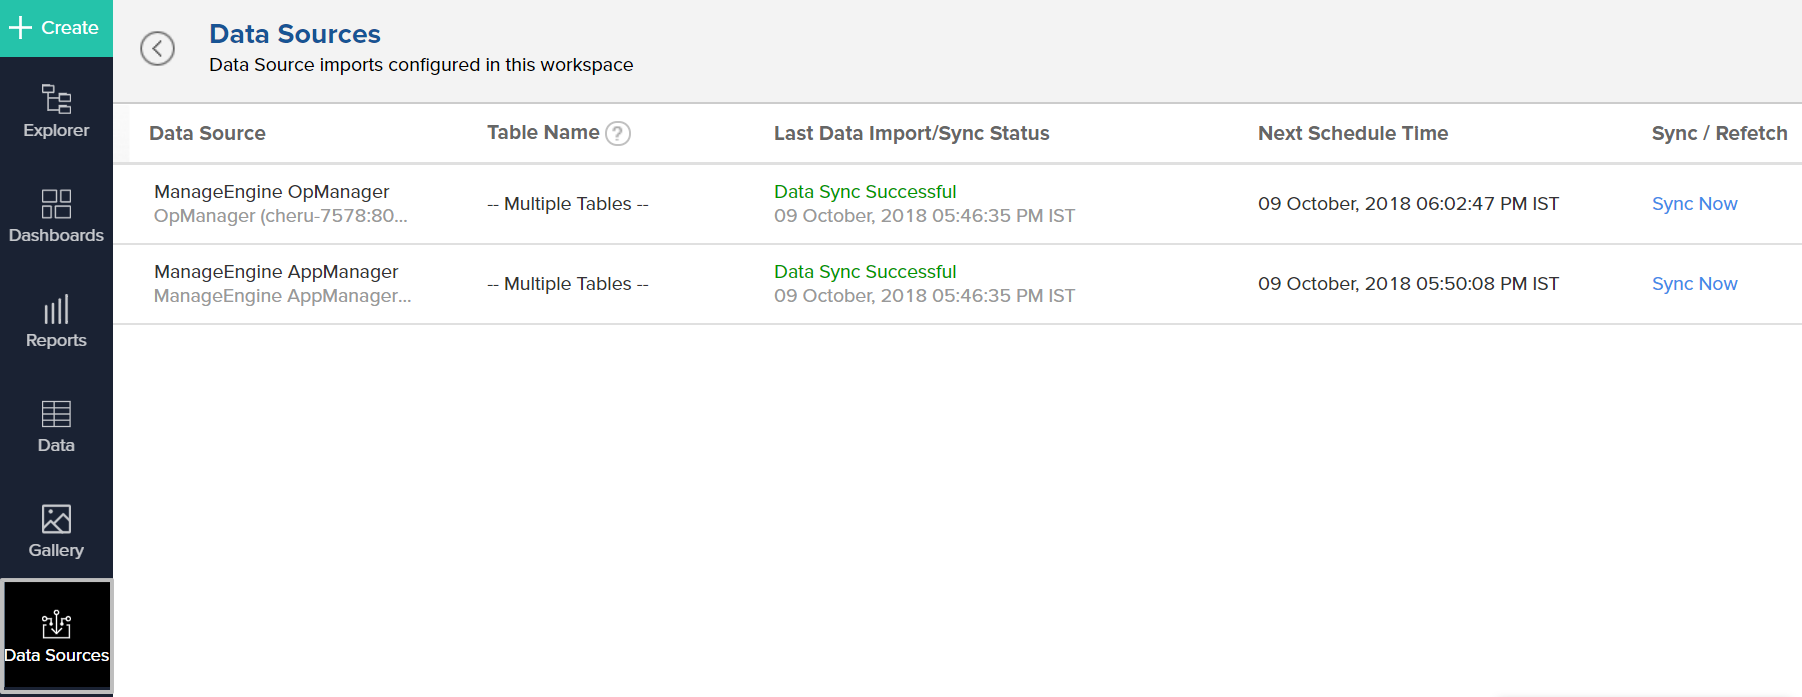
Enhanced e-mail scheduler for sharing reports and dashboards
EnhancementAn enhanced e-mail scheduler allows users to schedule e-mails containing reports and dashboards on the last day of the month, as opposed to manually choosing the last date of each month.
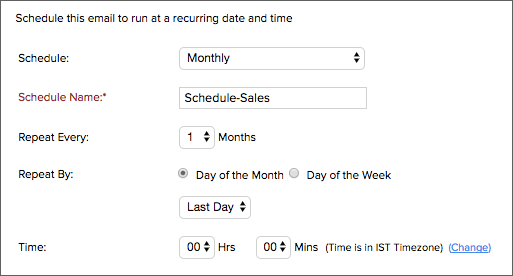
Enhancements in summary function
EnhancementSummary function in pivot tables enhanced to include average, minimum, and maximum values in the sub-total and the grand total rows. Learn more.
Introducing dynamic threshold for charts
EnhancementWe've upgraded the chart threshold feature to include dynamic values such as sum, average, minimum or maximum.
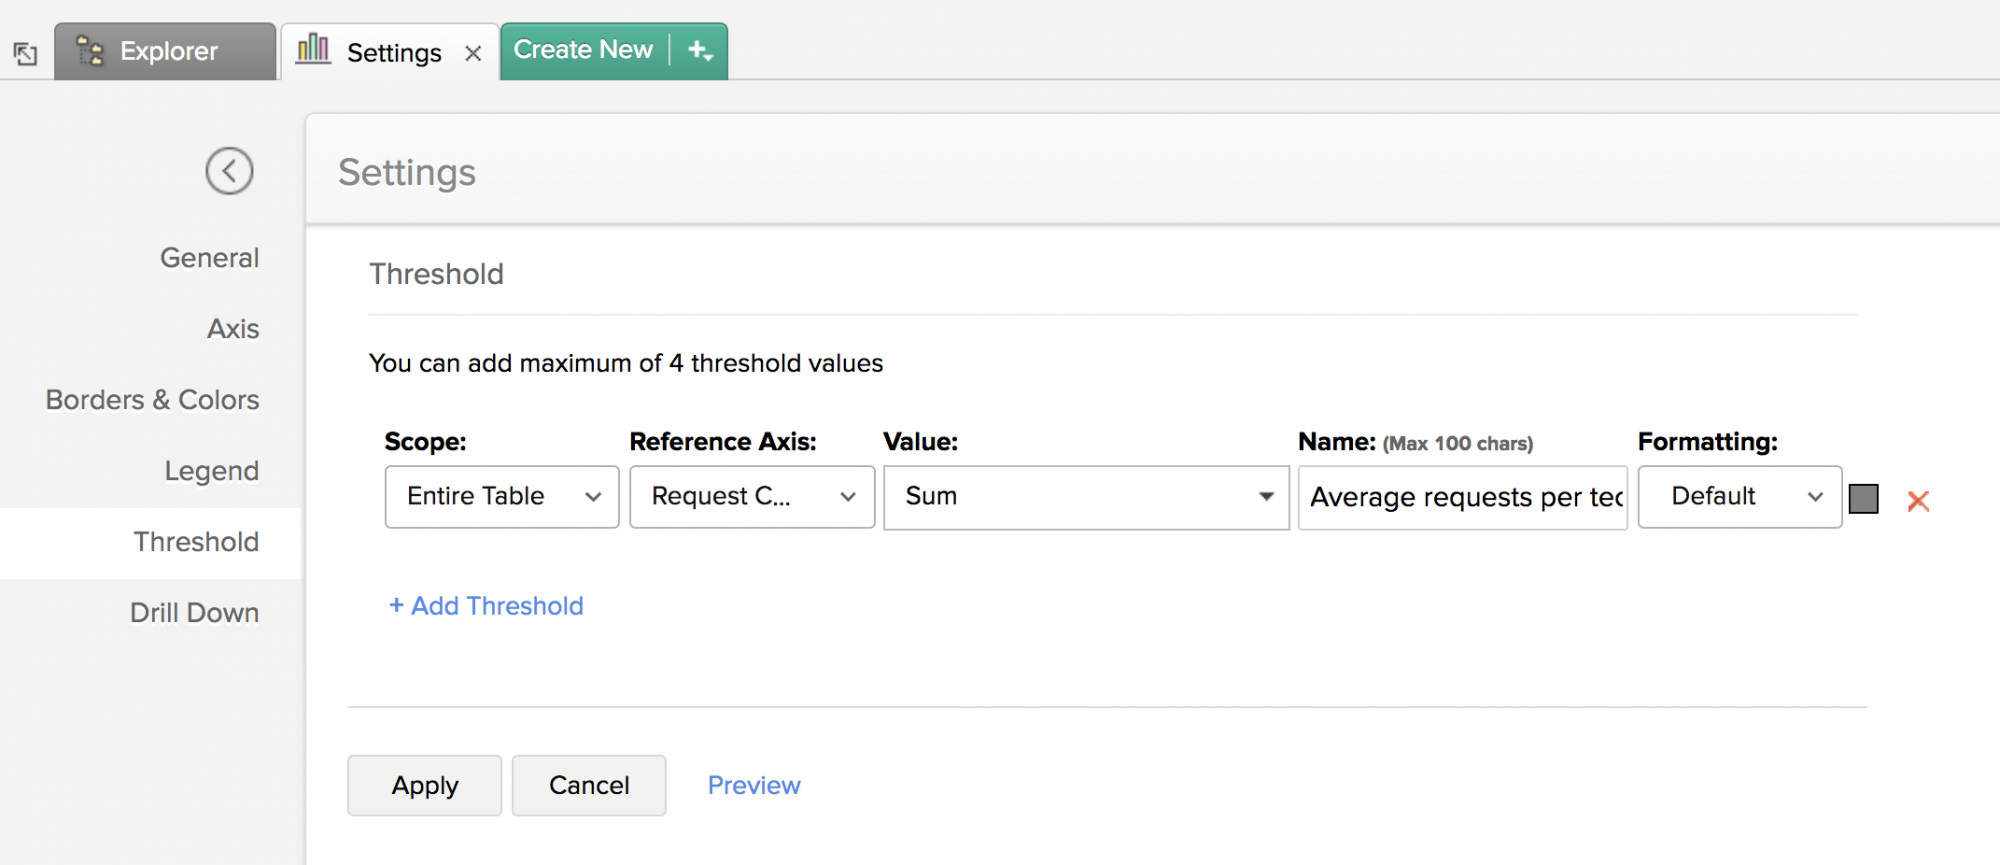
Users can also choose the scope of the threshold - a single threshold line for the entire chart, or multiple threshold lines for each data point in a chart.
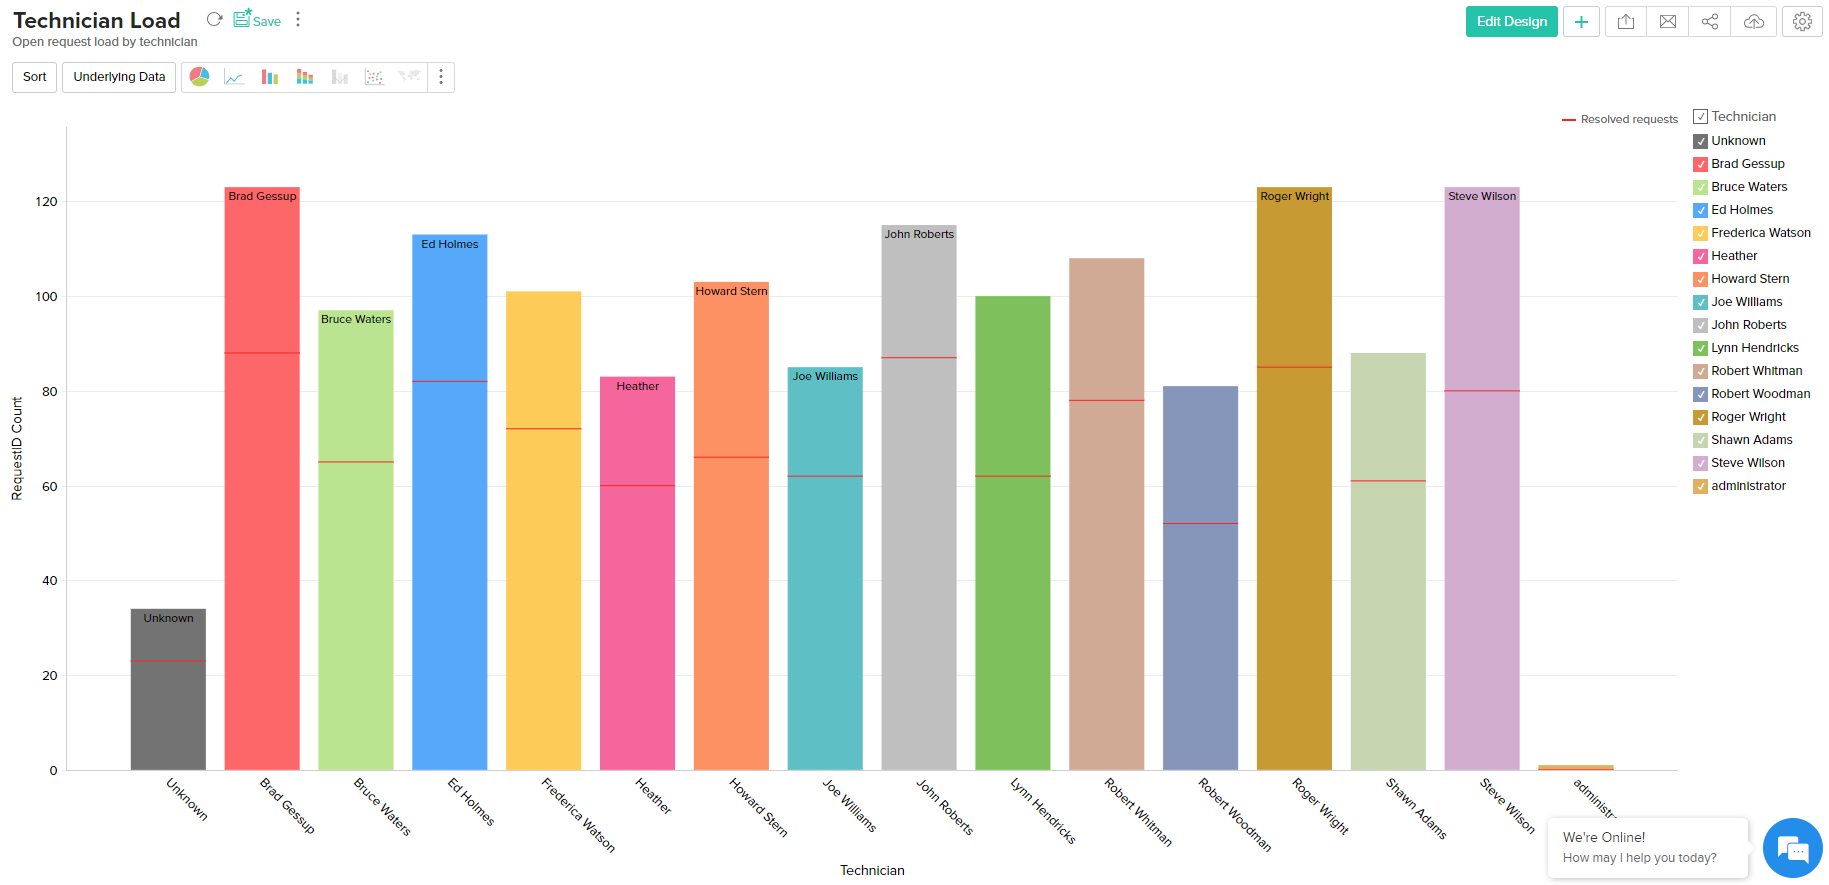
Enhanced grid themes for workspaces
EnhancementUsers can select a common color theme for all tabular views in a workspace. Tabular views include Pivot and Summary reports.
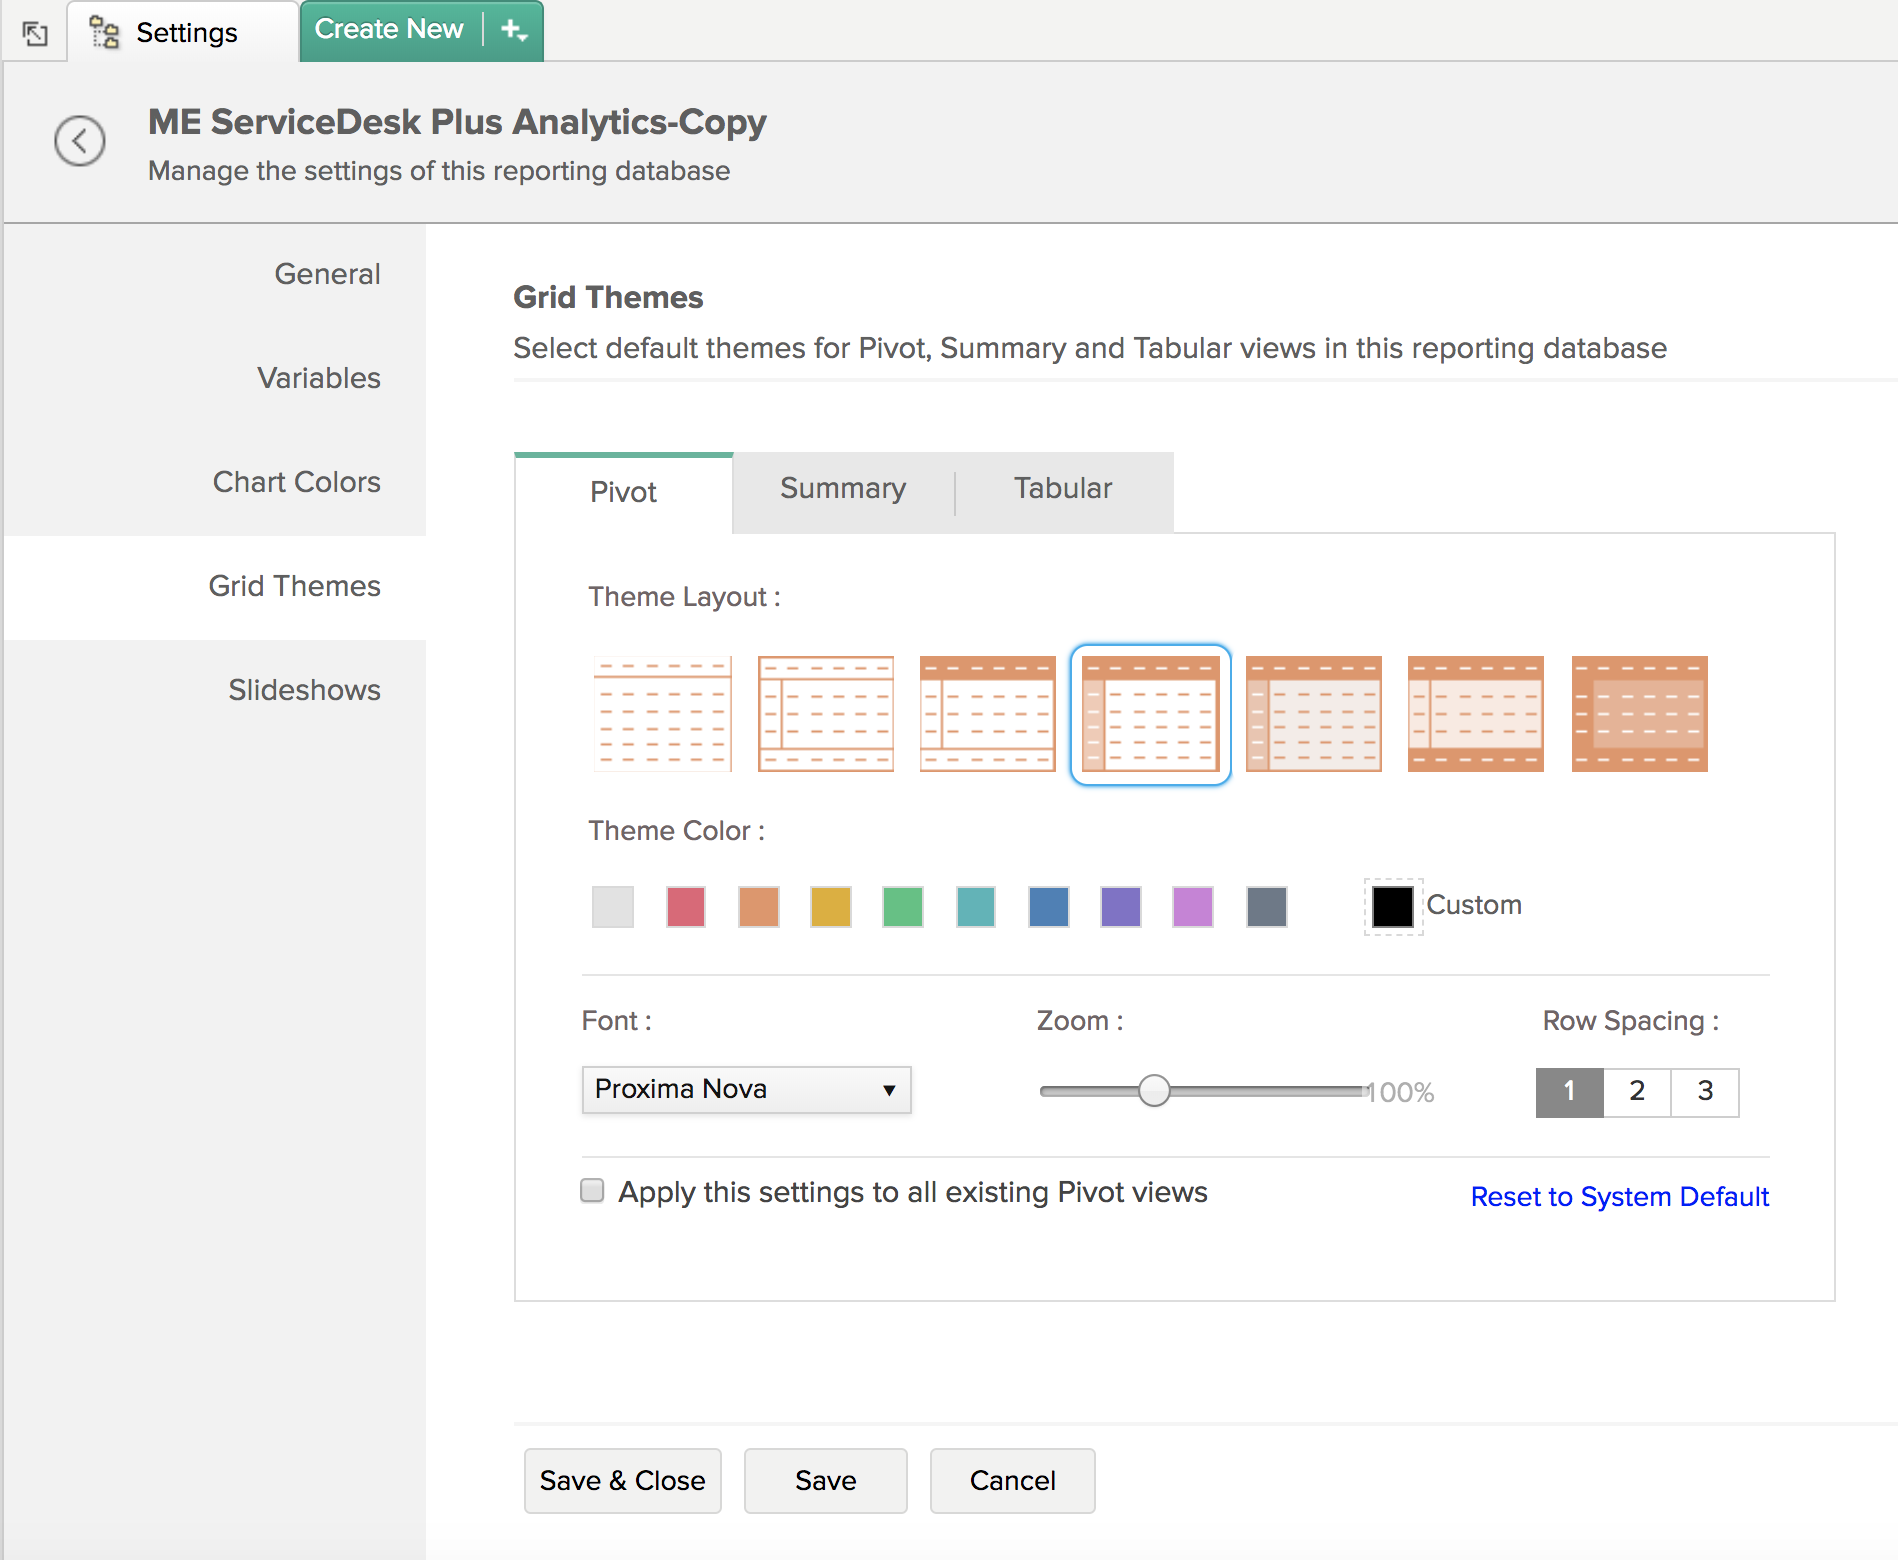
Click here to learn more.
New UI for 'User Filters' dialog box
EnhancementThe UI for the User Filters dialog box has been enhanced to help users quickly customize reports to represent derived metrics.
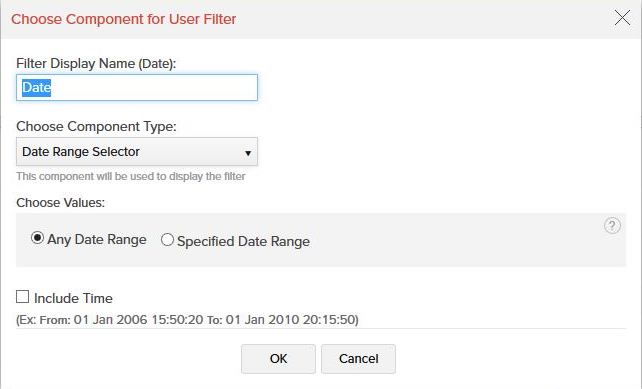
Support for Importing OData feeds
NewImport data into Analytics Plus using the weblinks of OData feeds. learn more.
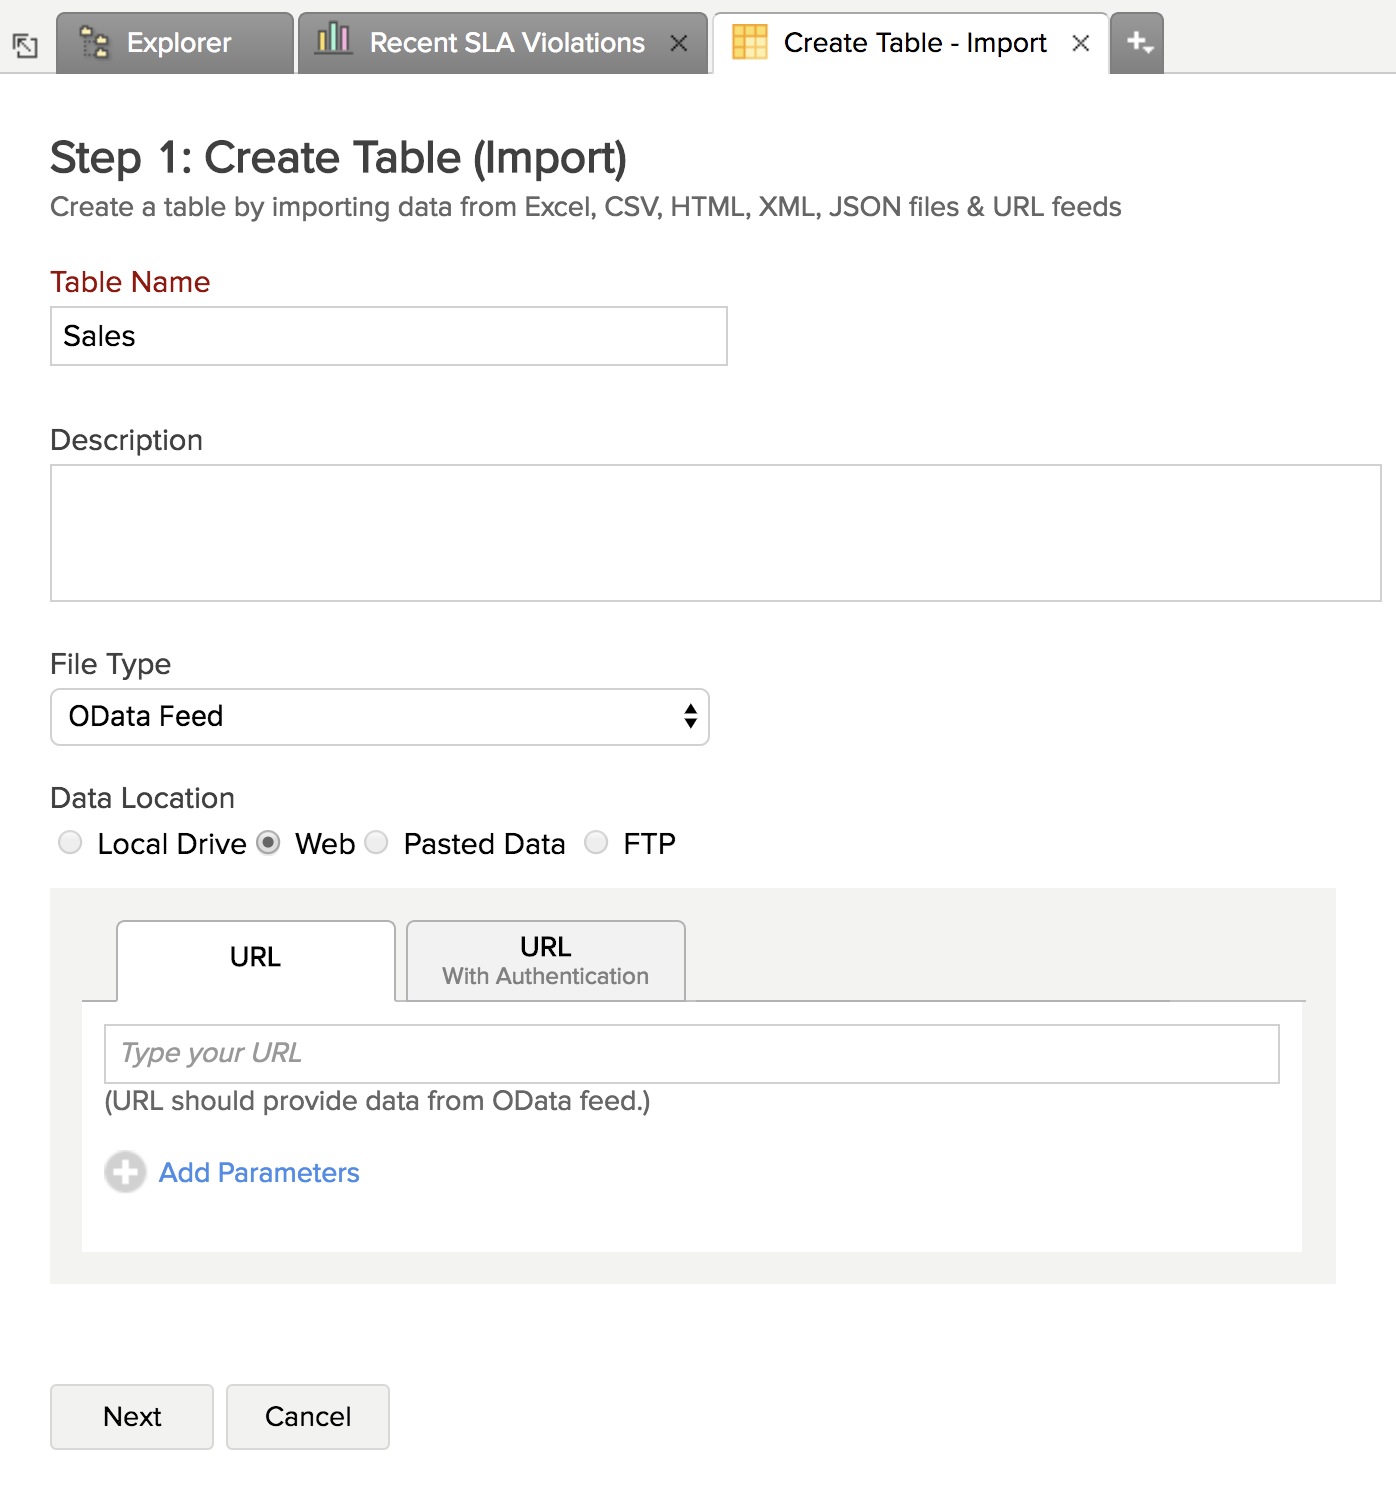
Shortened Embed/Permalink URL
EnhancementThe Embed/Permalink URL generated for reports and dashboards has been shortened to facilitate easy sharing of reports and dashboards.
Please note that all previously generated URLs will continue to work without any glitch.
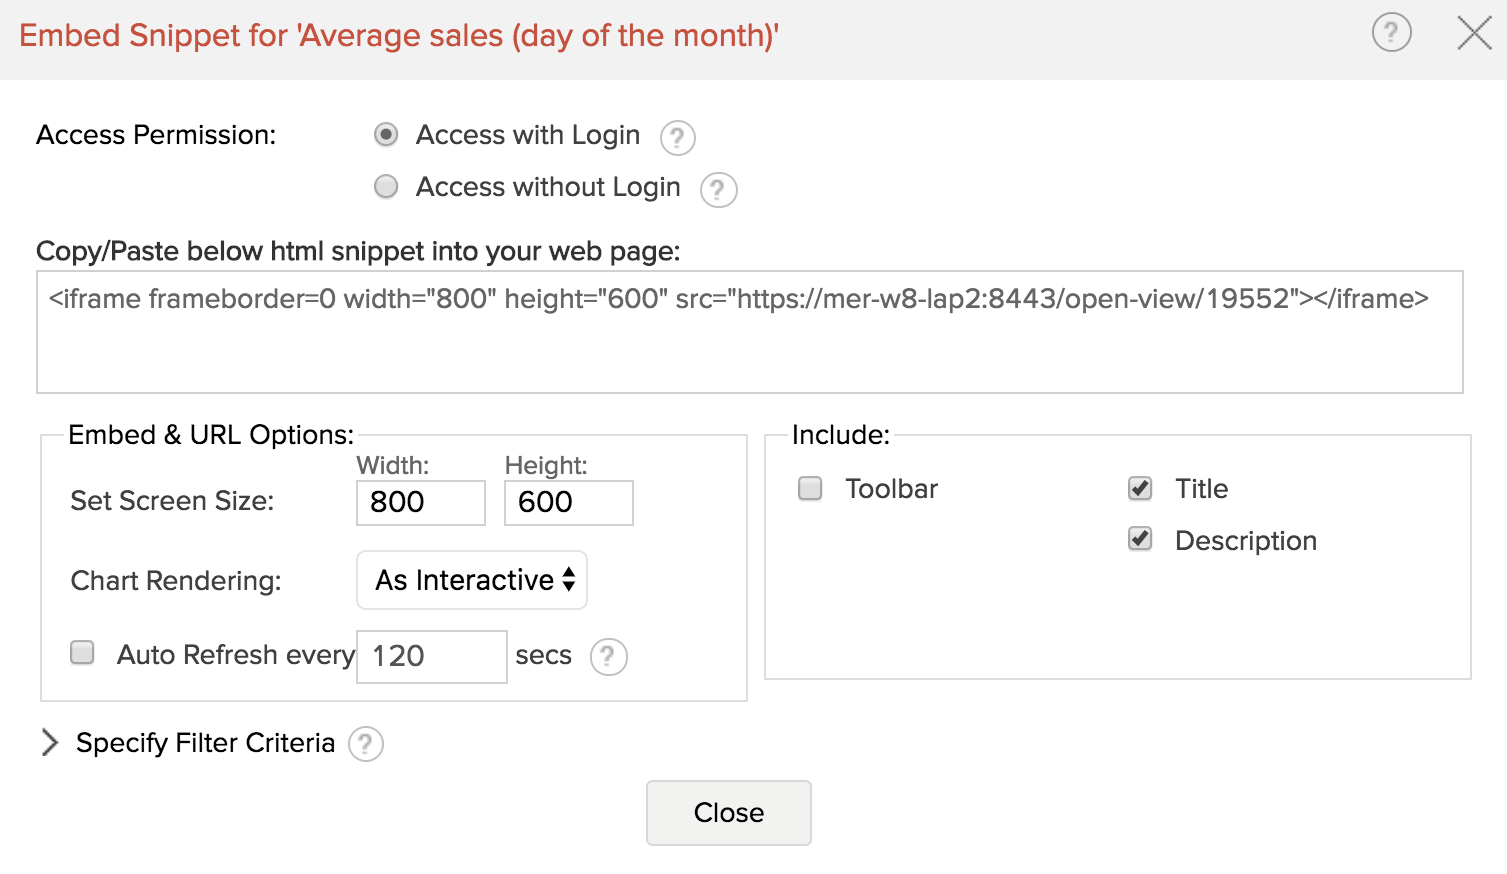
Enhancements in dashboard themes
EnhancementThe new update lets you customize the font style, size, and color for the dashboard title and description.
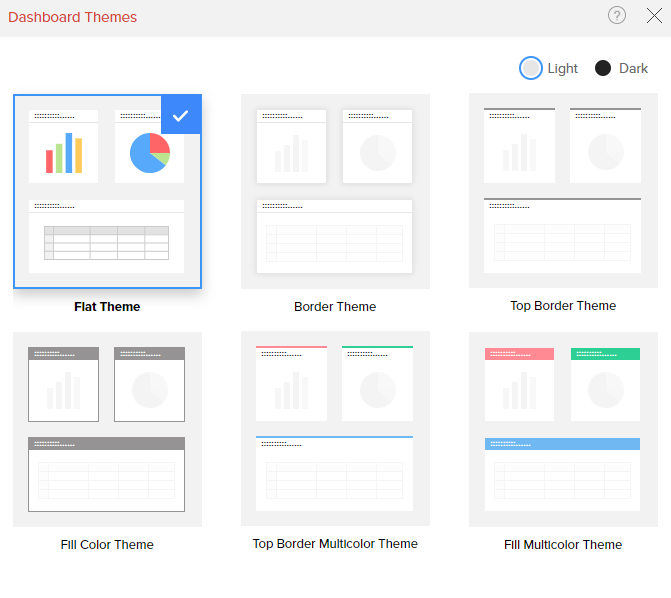
Support for filled map chart
EnhancementColor-code countries, cities or regions on a geographical map based on values in the report legend.
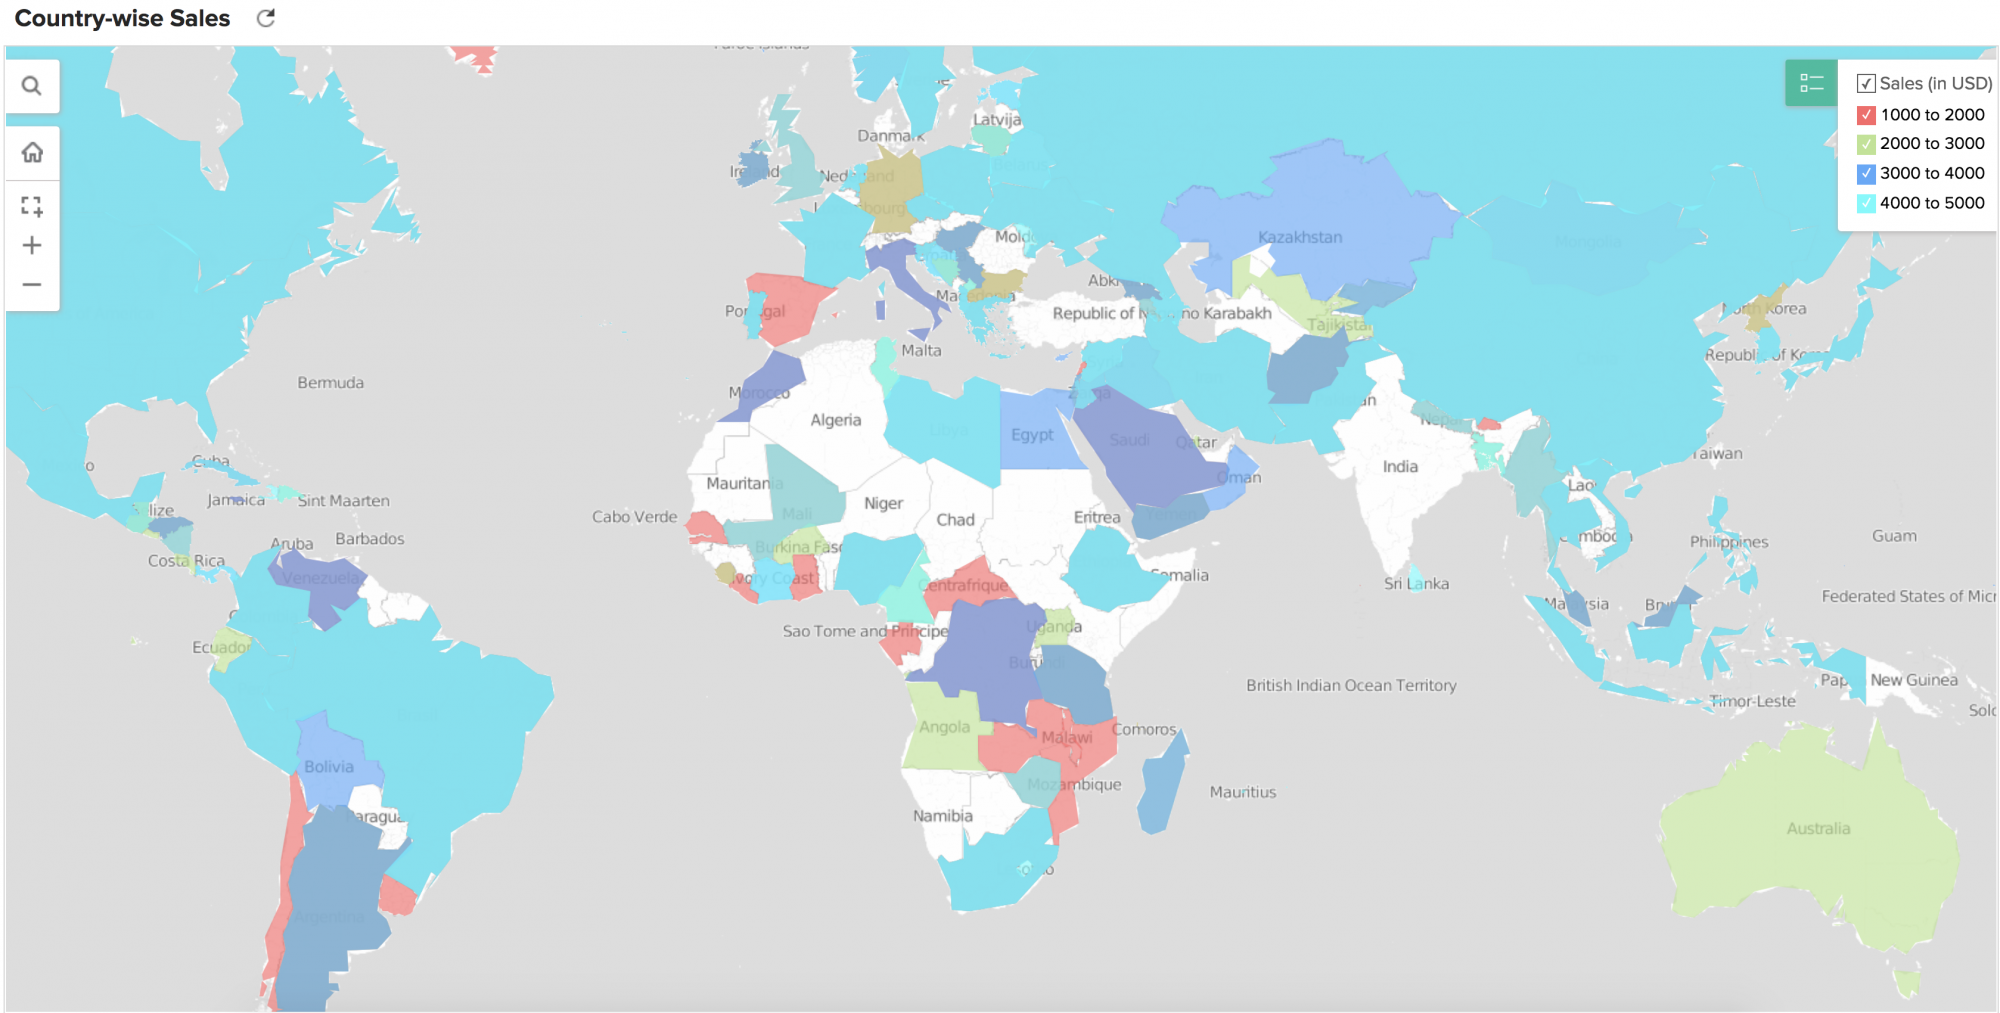
Introducing support for median and mode functions
EnhancementYou can now represent Median or Mode of numeric fields in your reports.
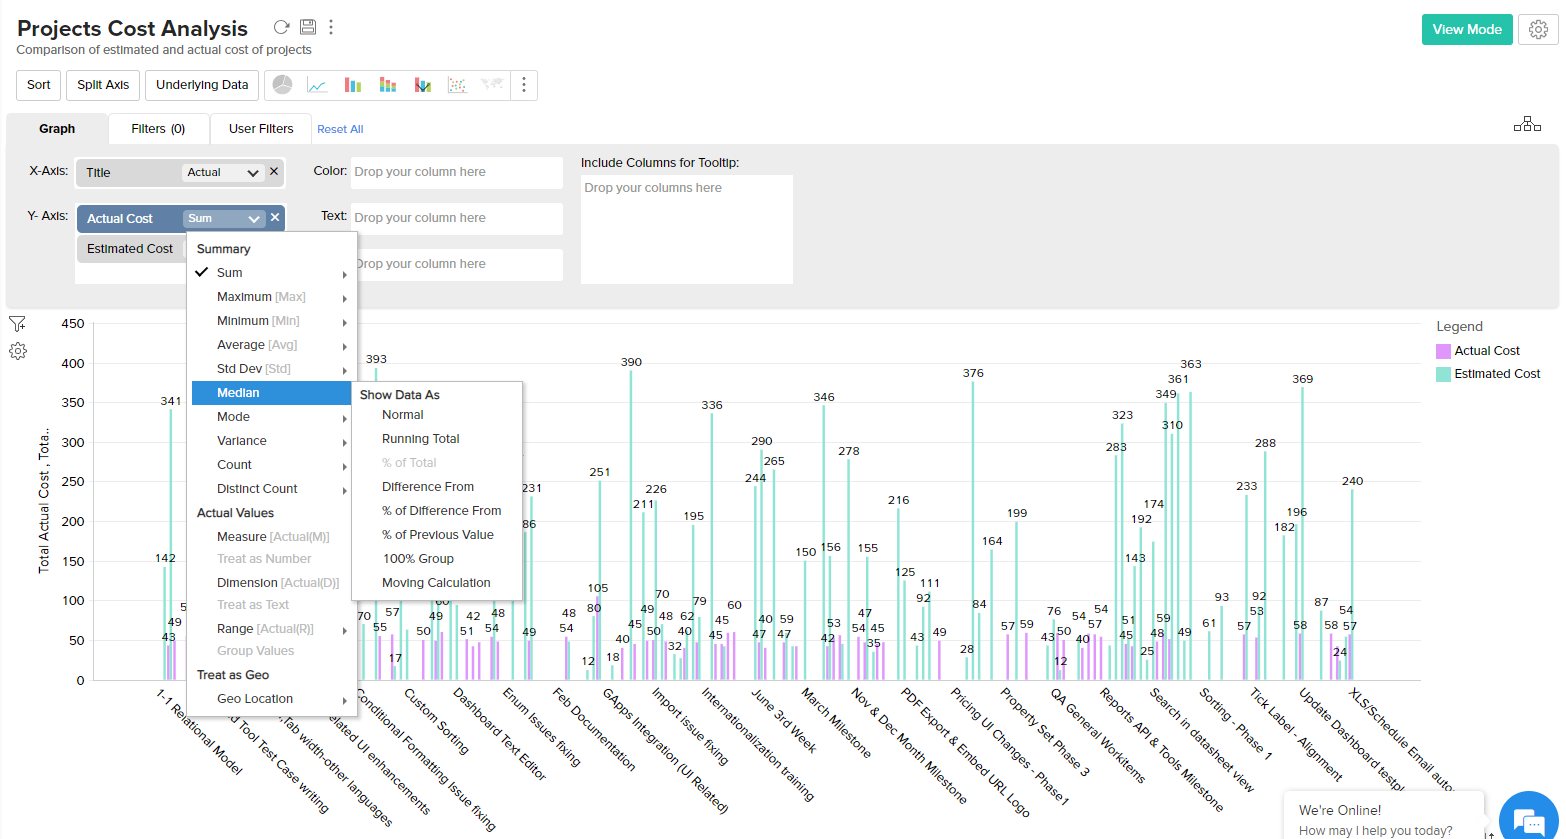
Import data from multiple sheets in an Excel workbook simultaneously
EnhancementTo make it convenient for users to import data from Excel, we've introduced an option to import data from multiple sheets of an Excel workbook at one go. Each of these sheets will be stored as independent tables in your workspace.
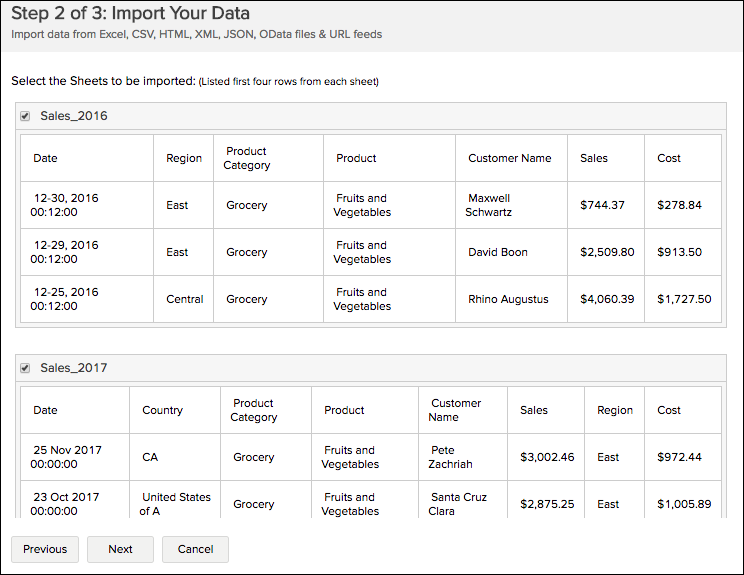
March
Build Number: 3450 (Release on: March 31, 2018)
Enhancement to Dashboard Viewer license category
EnhancementThe Dashboard Viewer license category undergoes a functionality change and will now be called Concurrent Viewers. This license category will work based on concurrent user sessions. Click here to know more.
Introducing new fields in the Applications Manager integration
EnhancementTwo new fields have been introduced as part of the Applications Manager integration. Users can create monitor group reports using Type and Group Type fields.
March
Build Number: 3400 (Release on: March 15, 2018)
Support for map chart
NewAnalytics Plus now supports map charts. Your metrics can now be tagged against geographical locations on a map view. The below map chart shows the country-wise split of total sales for Europe. Click here for more information about map charts.
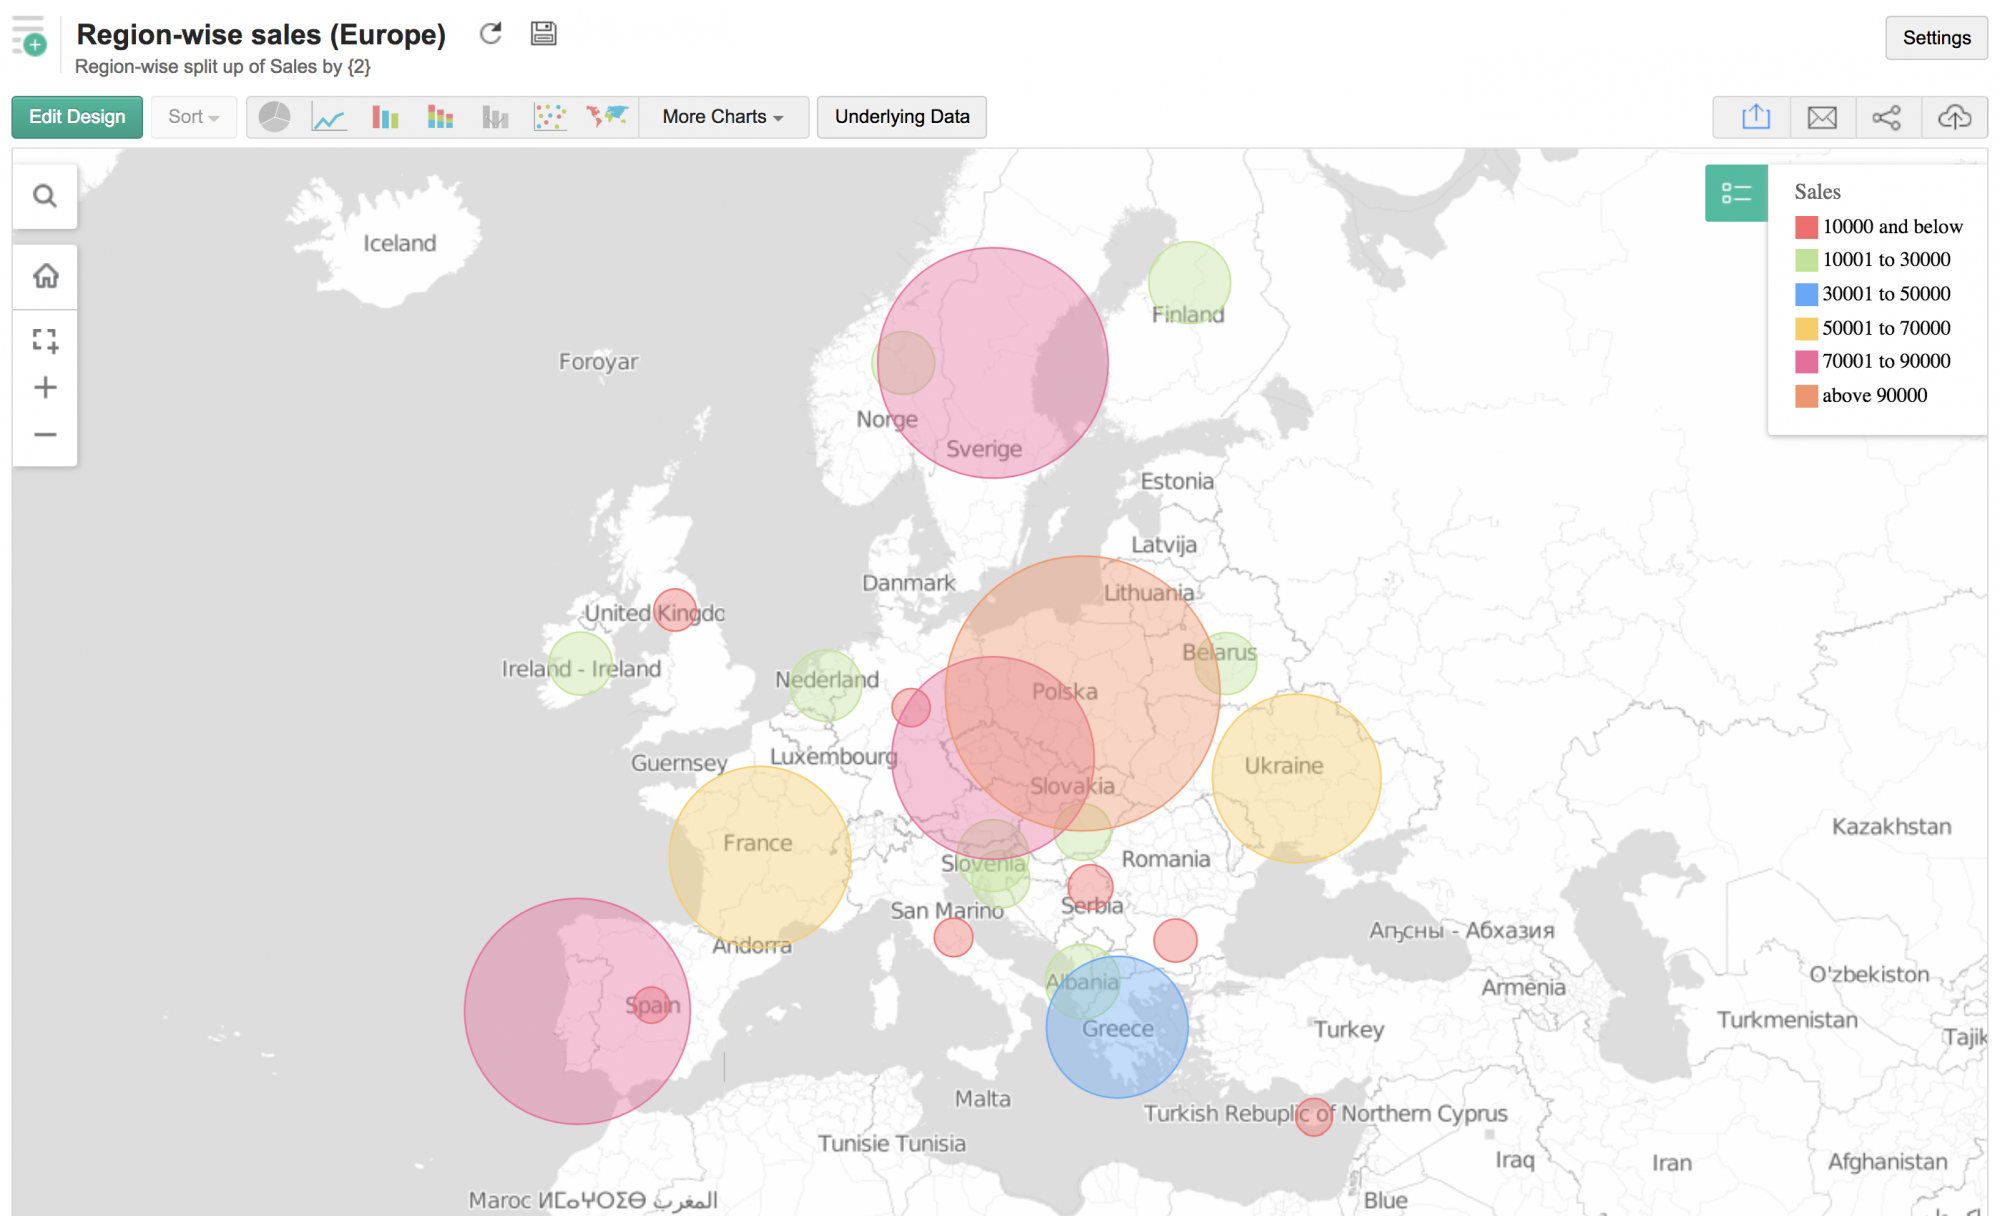
Support for API integration
NewA wide range of APIs allows you to perform actions such as user addition, export reports, share reports and much more. Click here for more information.
Support for Windows authentication
NewAnalytics Plus now supports Windows authentication for importing data from in-house MSSQL servers. Click here for details on how to import data from in-house MSSQL servers using Windows authentication.
Email notifications for license expiry
EnhancementAutomated license expiry alerts will now be sent to admins via email, in addition to in-product notifications.
Issues fixed
Issues fixed- Issues in accessing Add text and Add image option while creating dashboards has been fixed.
- Some users reported losing their re-branded logo and dashboard images after a service pack upgrade. This issue has now been addressed.
- Issues related to date format conversion has been fixed.
- Issues in displaying the footer image when views are exported in JPEG or PNG format has been fixed.
2017
Dec
Build Number:: 3310-(Release on: December 14, 2017)
Issues fixed
Issues fixed- Sync-related issues with 3300 has been fixed.
- Issues in selecting sync intervals has been addressed.
Dec
Build Number:: 3300-(Release on: December 04, 2017)
Introducing support for change management module in ServiceDesk Plus MSP
NewAnalytics Plus now supports change management module for out-of-the-box integrations with ServiceDesk Plus MSP.
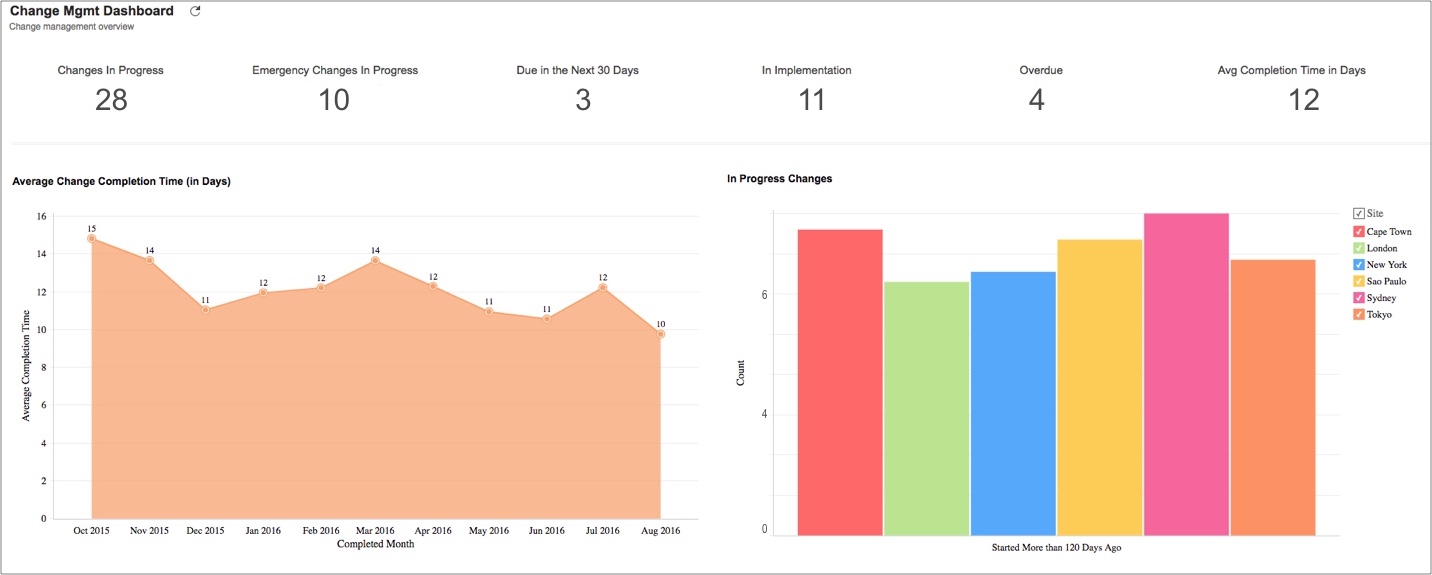
Note: You should be on the ServiceDesk Plus MSP build 9303 or above to get these reports.
Introducing new chart types for widgets
NewThe new version of Analytics Plus supports two new chart types for widgets.
Bullet Chart: A horizontally inclined graph that lets you compare the performance of a single, primary parameter against a predefined target.
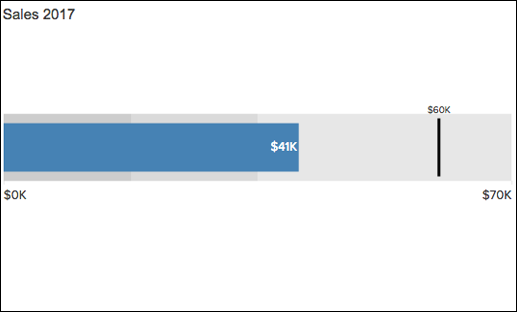
Dial Chart: Also known as a speedometer chart, dial chart is a semicircle featuring numbers at the arc and a needle that represents the real-time count of your metric.
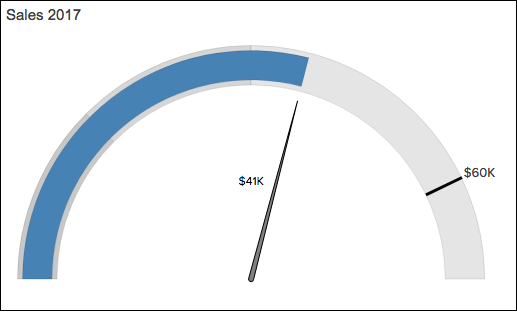
Issues fixed
Issues fixed- Issues in changing the date format in pivot tables have been addressed.
- Issues in adding images to dashboards have been fixed.
- Login errors caused by browser cookies have been addressed.
Oct
Build Number:: 3250-(Release on: October 10, 2017)
Introducing a New Gallery Option
NewThe Gallery option features reports and dashboards from the latest Analytics Plus releases. The featured report templates can be copied on to your own database. This feature is only available for the out-of-the box integrations such as ServiceDesk Plus, OpManager etc.
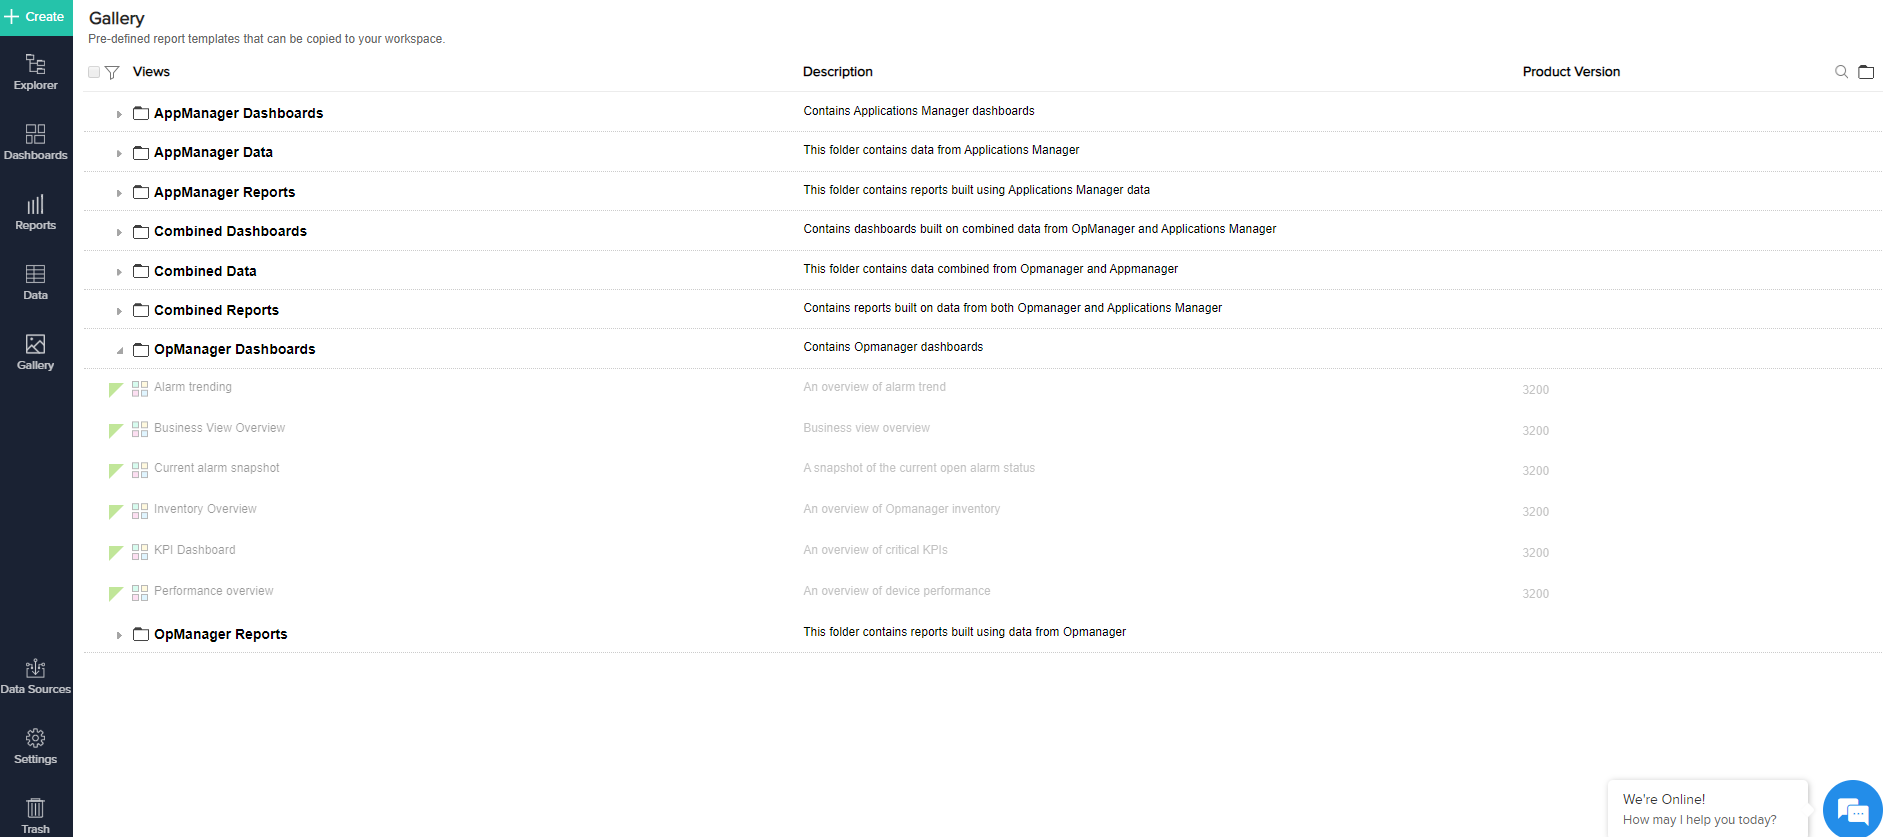
The Gallery lets you preview and copy new reports to your own database:
- Gallery List View
Filter reports by type, related views, product version, import status and more from the list view.
- Multiple Import Options
You can import reports from the Gallery, either individually, or in bulk using the multi-select option.
- Report Preview
Use the preview feature to view a live sample before import.
- New Reports
Newly added reports will automatically move to their respective folders and are labelled as "New".
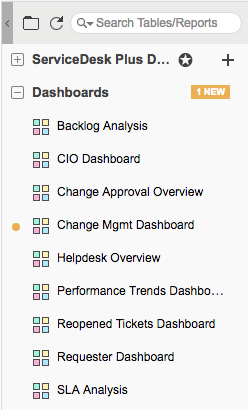
New Report Alerts
Alerts about new dashboards or reports added to the gallery will now be available as in-product notifications. Users can view new reports or dashboards templates by clicking the notification.
![]()
Issues fixed
Issues fixed- Issues in synchronizing Applications Manager performance metrics with Analytics Plus build 3200 has been addressed.
Aug
Build Number:: 3200-(Release on: August 25, 2017)
Homepage Gets a Facelift with all Import Options in a Single Page
EnhancementNow you can see all the import options in a single view, unlike the older version where you had a running banner displaying multiple import options.
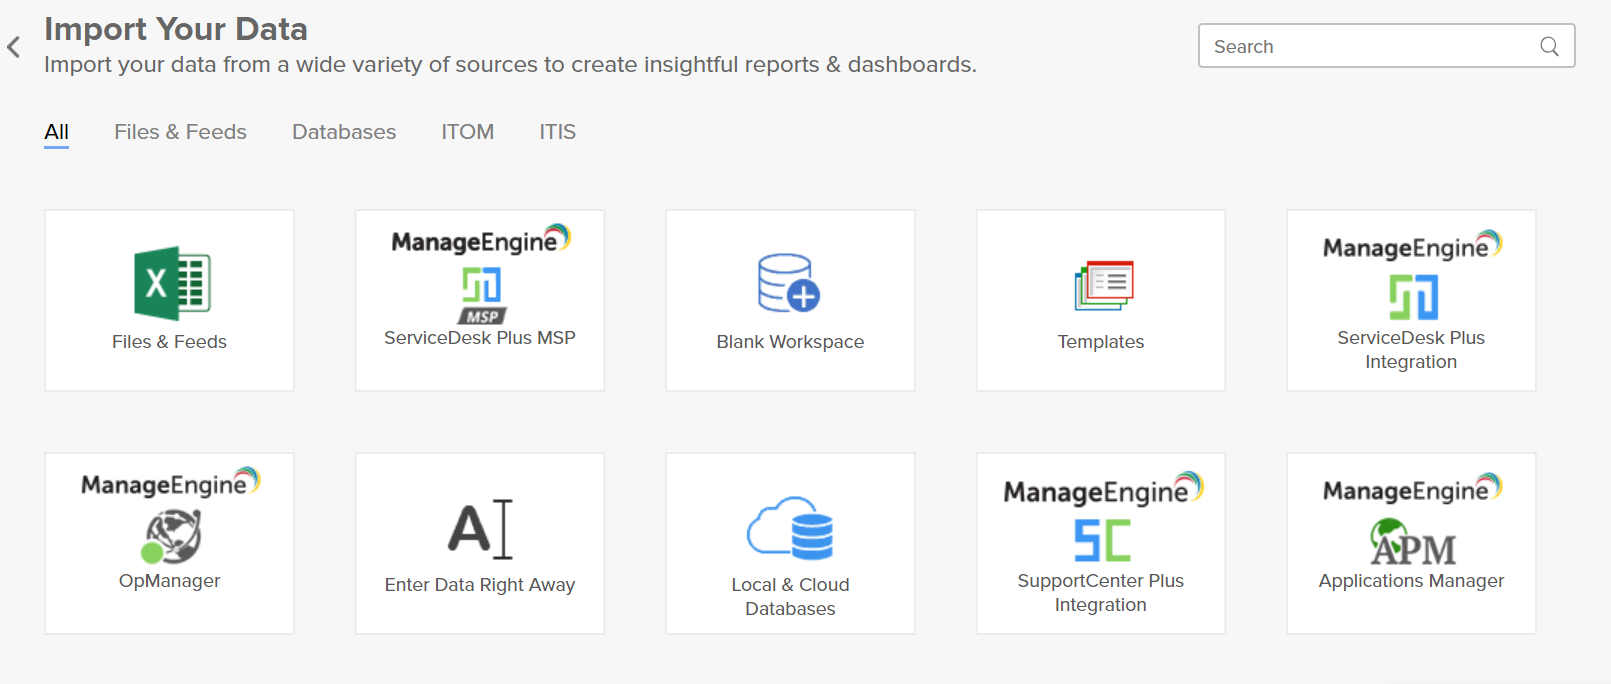
Support for Packed Bubble Chart
NewAnalytics Plus now support packed bubble charts. This chart is similar to the bubble chart except that the bubbles are all tightly packed together to make efficient use of space. Size of each bubble represents the values it represents.
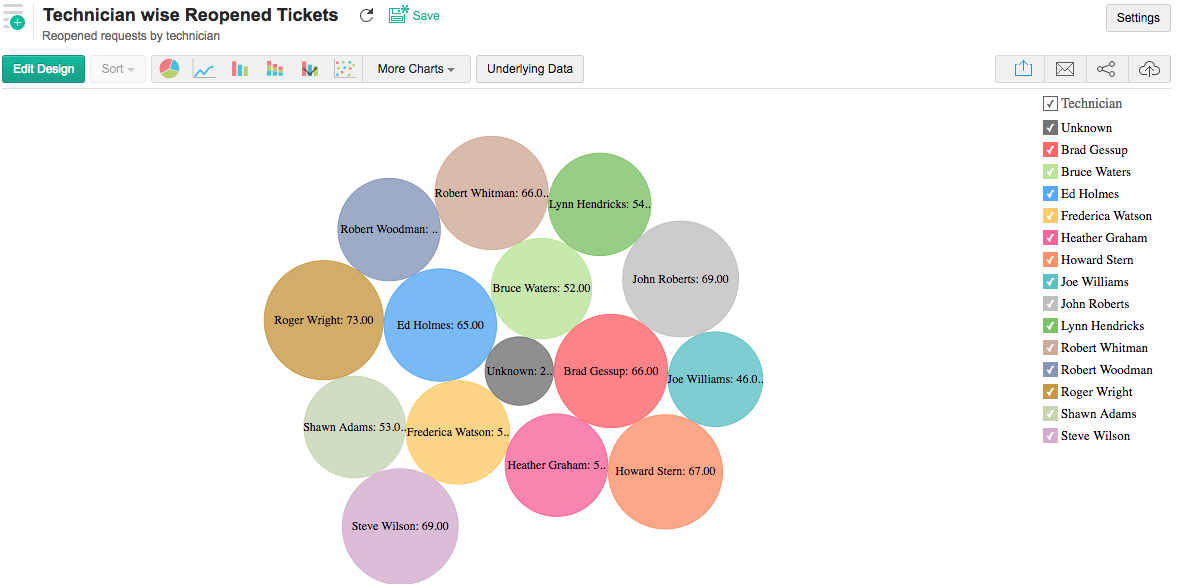
Enhanced Chart Chooser for Dashboards
EnhancementAn enhanced Chart Chooser dialog box not only displays all your chart options but also lets you switch between charts real fast.
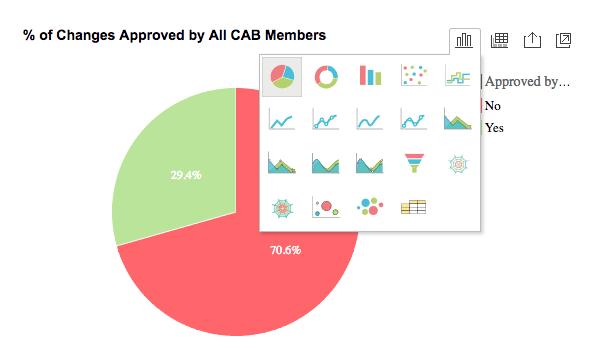
New "Edit" Option in Explorer
EnhancementYou can now use the new Edit option in the explorer window to launch reports in the edit mode directly.
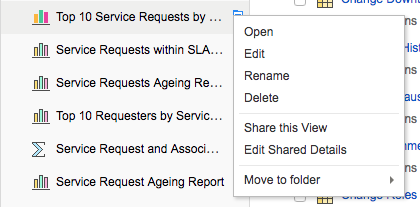
Note: This option is not available for tables.
Improvements in scalability
EnhancementWe've made scalability improvements to increase the efficiency of the application. For example- older versions supported export of only up to 1 million cells at a time, but the new version lets you export tabular views with up to 3 million data cells, at one go.
Enhancements in Chart Colors to Include more Colors
EnhancementThe Chart Colors option introduced under database settings lets you pick your chart colors from the custom color palettes, where you can choose amongst solid, monochrome or gradient color options.
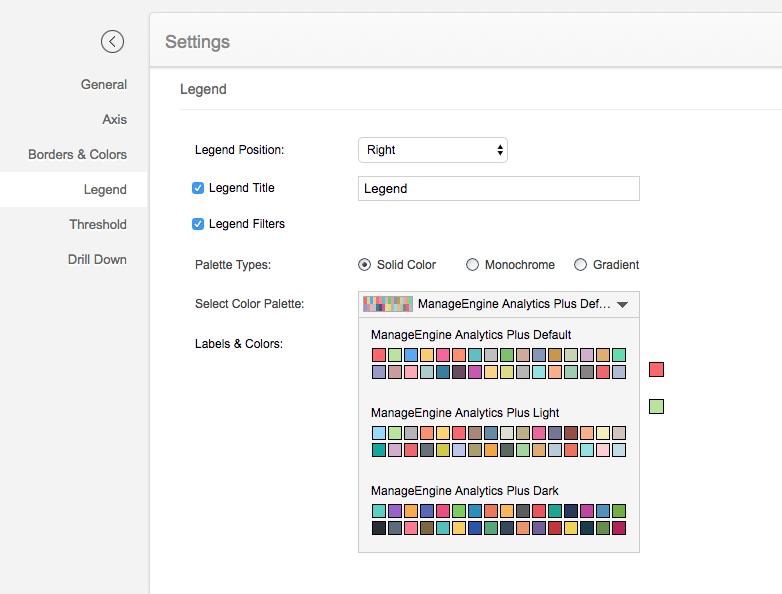
New UI for Edit Email Schedules
EnhancementMake changes to your scheduled emails easily with interactive icons for edit, delete, pause and send now options. To use this feature, click on the email icon at the top right corner of your report and opt for Edit Email Schedules.
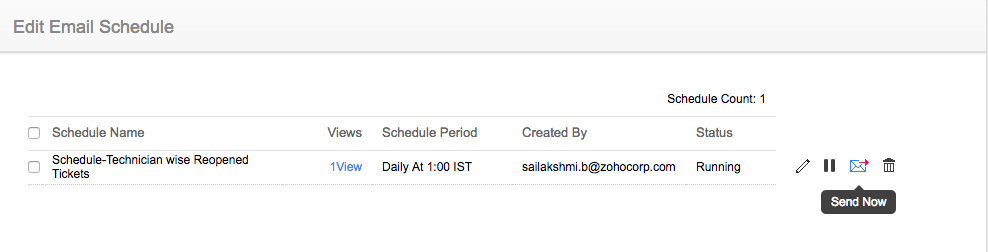
Data Import – Support for Google Cloud SQL and Heroku PorstgreSQL
NewThe new update extends data import options to include Google cloud SQL and Heroku PorstgreSQL cloud databases. To import data using these databases, use the Local & Cloud Databases tile on your homepage.
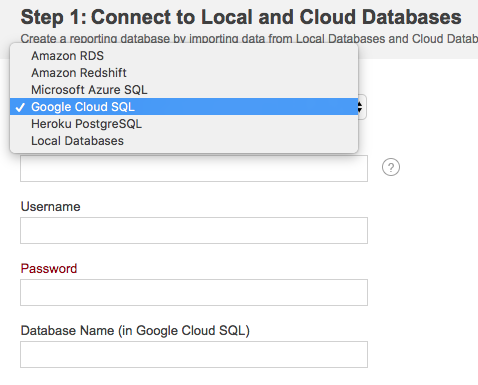
Enhancements in the Lookup Feature
EnhancementWe’ve made some changes to the Lookup Column feature to enhance its usability.
Lookup column over another looked up column: You can now configure a cascading look up. The parent column that you are looking up can in turn be looking up another column from a different table. This is equivalent to using multiple JOINS in an SQL statement.
Specify data types for the lookup column: Up until now, when you configure lookups, the child column inherits the data type of the parent column. With new update, you can now pick a different data type for the child column from a drop-down menu.
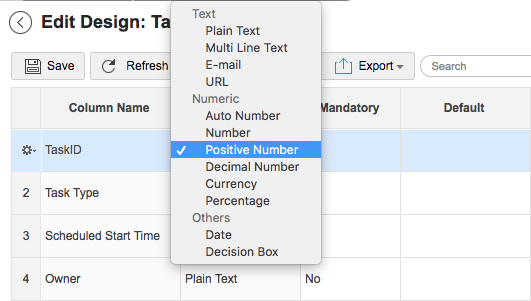
Support for default and mandatory Values: You can now specify default and mandatory values for a lookup column in the Edit Design window.
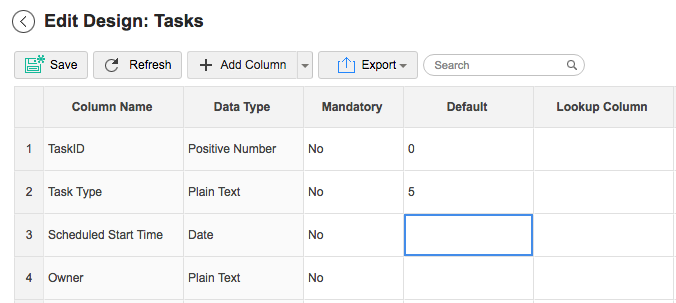
Enhancements in Mouse-over Effects for Charts
EnhancementHovering your mouse over sections of the report highlight the corresponding value on the legend.
Improved View Underlying Data Feature for Related Tables
EnhancementThe View Underlying Data feature in Analytics Plus has been updated so that you can now toggle between data from related tables. Earlier, this feature only supported individual tables. So, if you had a report created using data from two related tables, and wanted to view the underlying data, you could only see the tables separately. But now, you could view the individual table in addition to the related table.
Note: By default, when you click the View underlying data option, you get the base table joined with columns from the related table. You could always select the individual table separately to view data from that table.
Before this update:
Below is a screenshot from the older version, that shows how you could only view underlying data from individual tables, i.e., tasks and request.
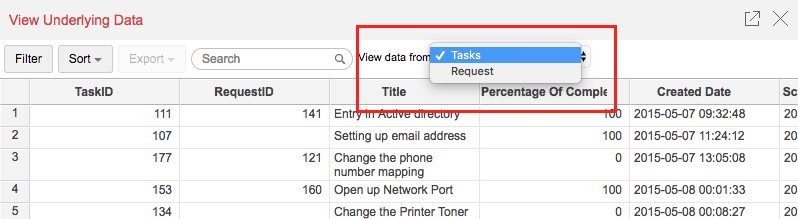
After this update:
This screenshot shows how you can view data from the individual table as well as the related table, i.e., tasks and related tables, and request.
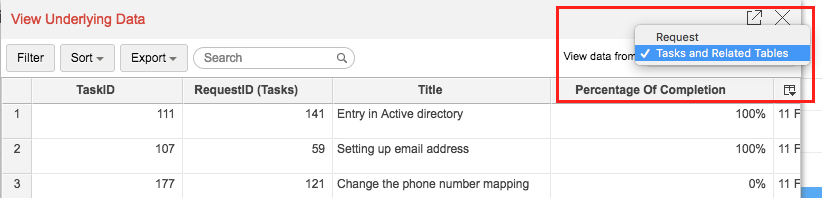
Issues fixed
Issues fixed- General scalability improvements.
- Service Desk Plus synchronization errors that occur as a result of backslash character (\) in field names has been fixed.
April
Build Number:: 3110-(Release on: April 20, 2017)
Issues fixed
Issues fixed- Addressed synchronization issues with ServiceDesk Plus installations that have more than 8 request additional fields.
- Fixed issues in exporting dashboards that contain widgets.
March
Build Number:: 3100-(Release on: March 09, 2017)
Enhanced Formula Editor with Suggestions
EnhancementAnalytics Plus formula editor has been enhanced to support features such as keyword highlights, suggestions, error messages etc.
In this update the following features have been supported:
- Suggestion: Provides you possible suggestions as you type your formula.
- Keyword Highlight: Highlights the keywords in the formula for better readability and understanding.
- Warning/Error notification: Displays intuitive warning in the case of inaccuracies or errors in formulas.
Click to learnabout creating formula columns.
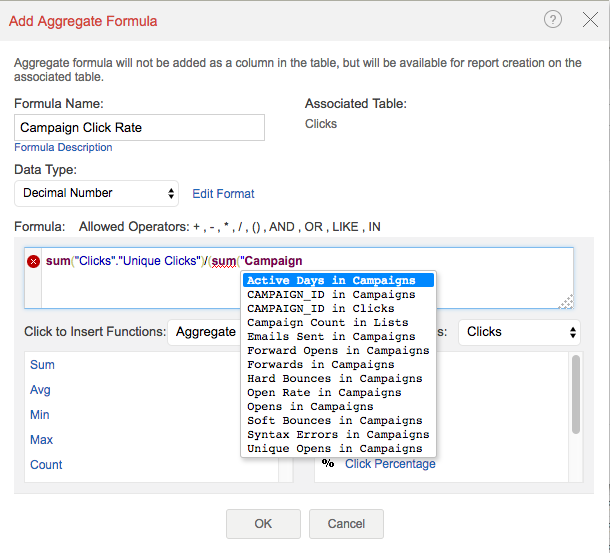
Introducing Variables Feature in Analytics Plus
NewAnalytics Plus has introduced a new feature called Variables. Variables are placeholders that helps database owners assign dynamic values for individual users of the database.
You can use these variables as a part of the Sharing filter criteria to filter reports dynamically based on the user who has logged in. You can currently use variables in Sharing Filter criteria. We plan to support variables in features such as user filters, formulas etc. very soon.
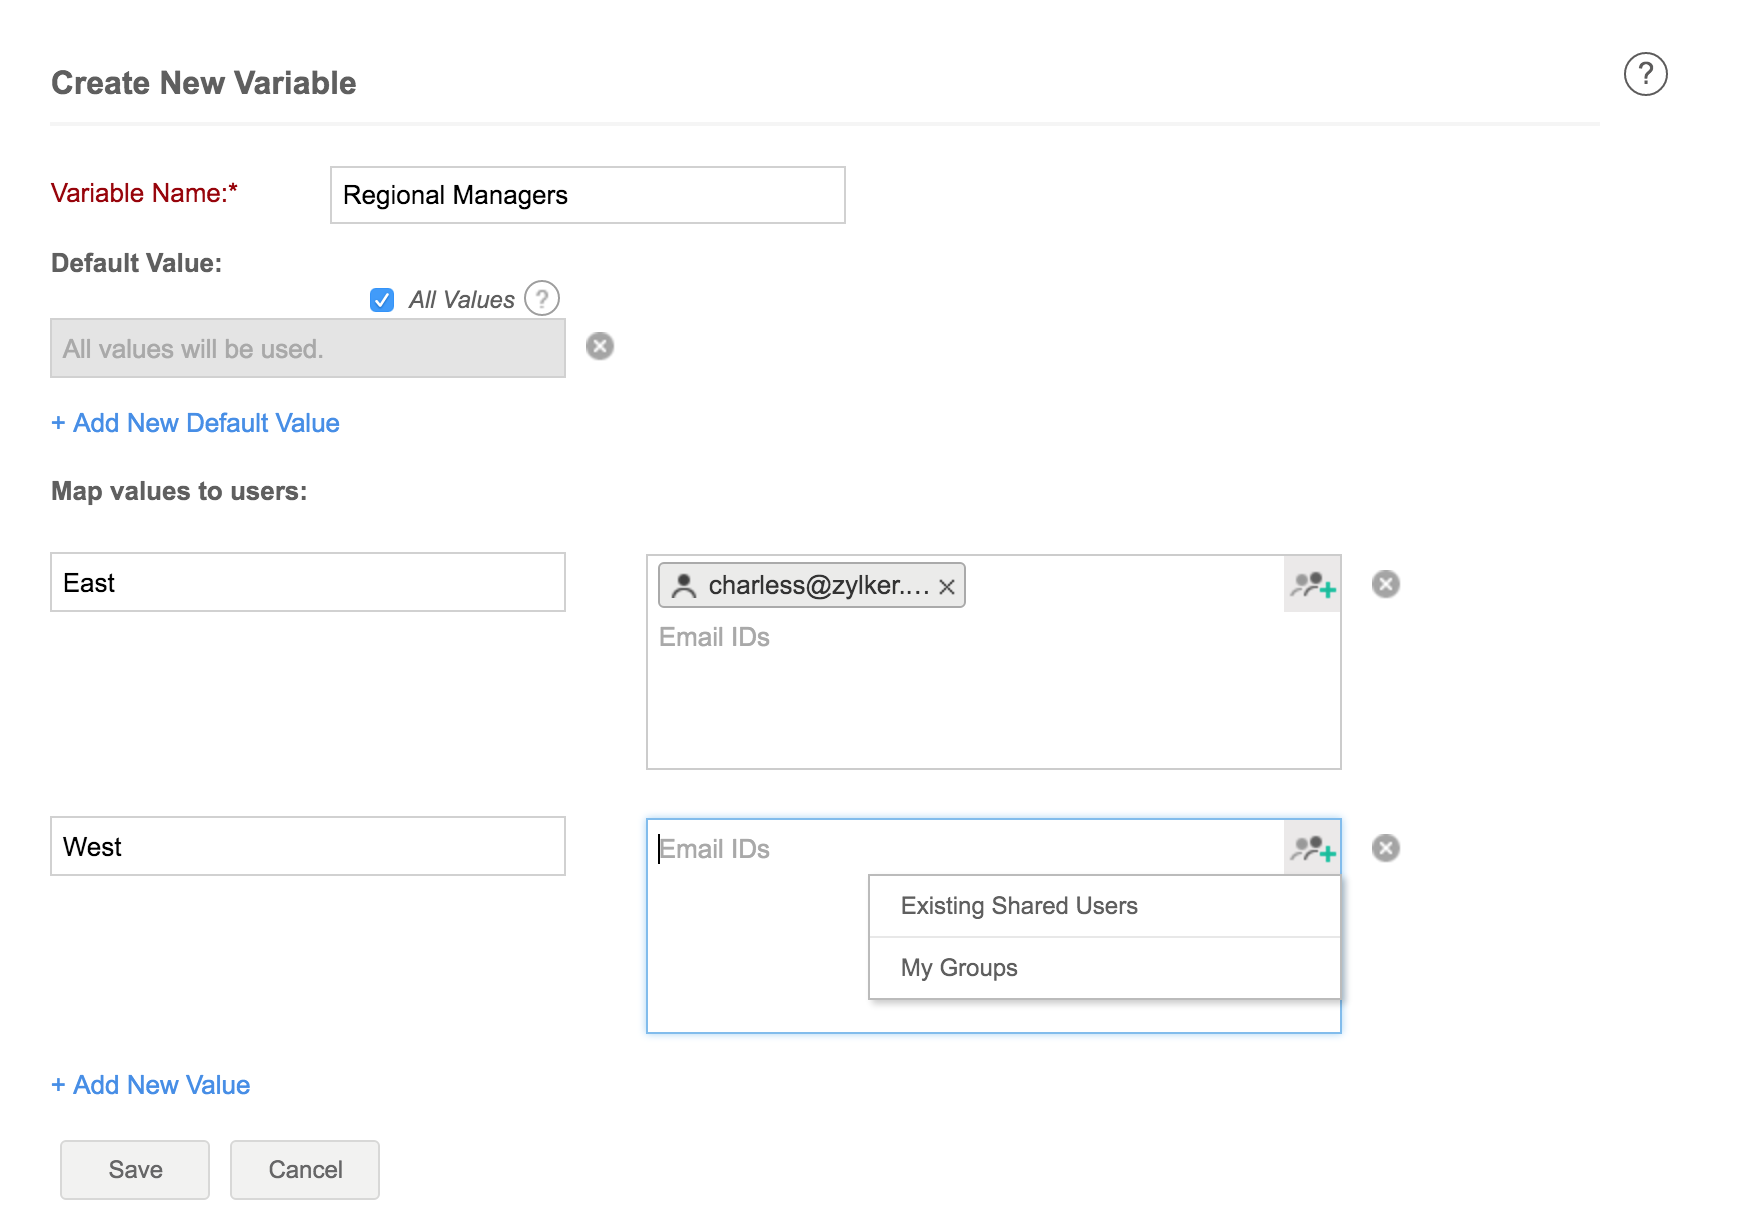
You can create and manage variables from the Variables tab in the Settings page.
Click hereto know more.
Support for Bubble Charts
NewAnalytics Plus now supports Bubble Charts. These charts are useful to visually represent values based on the size of the bubble. You can use a bubble charts instead of a Scatter plot, where scatter points are replaced by bubbles. The size of the bubble will be determined by the field placed in the Size section of the chart designer.
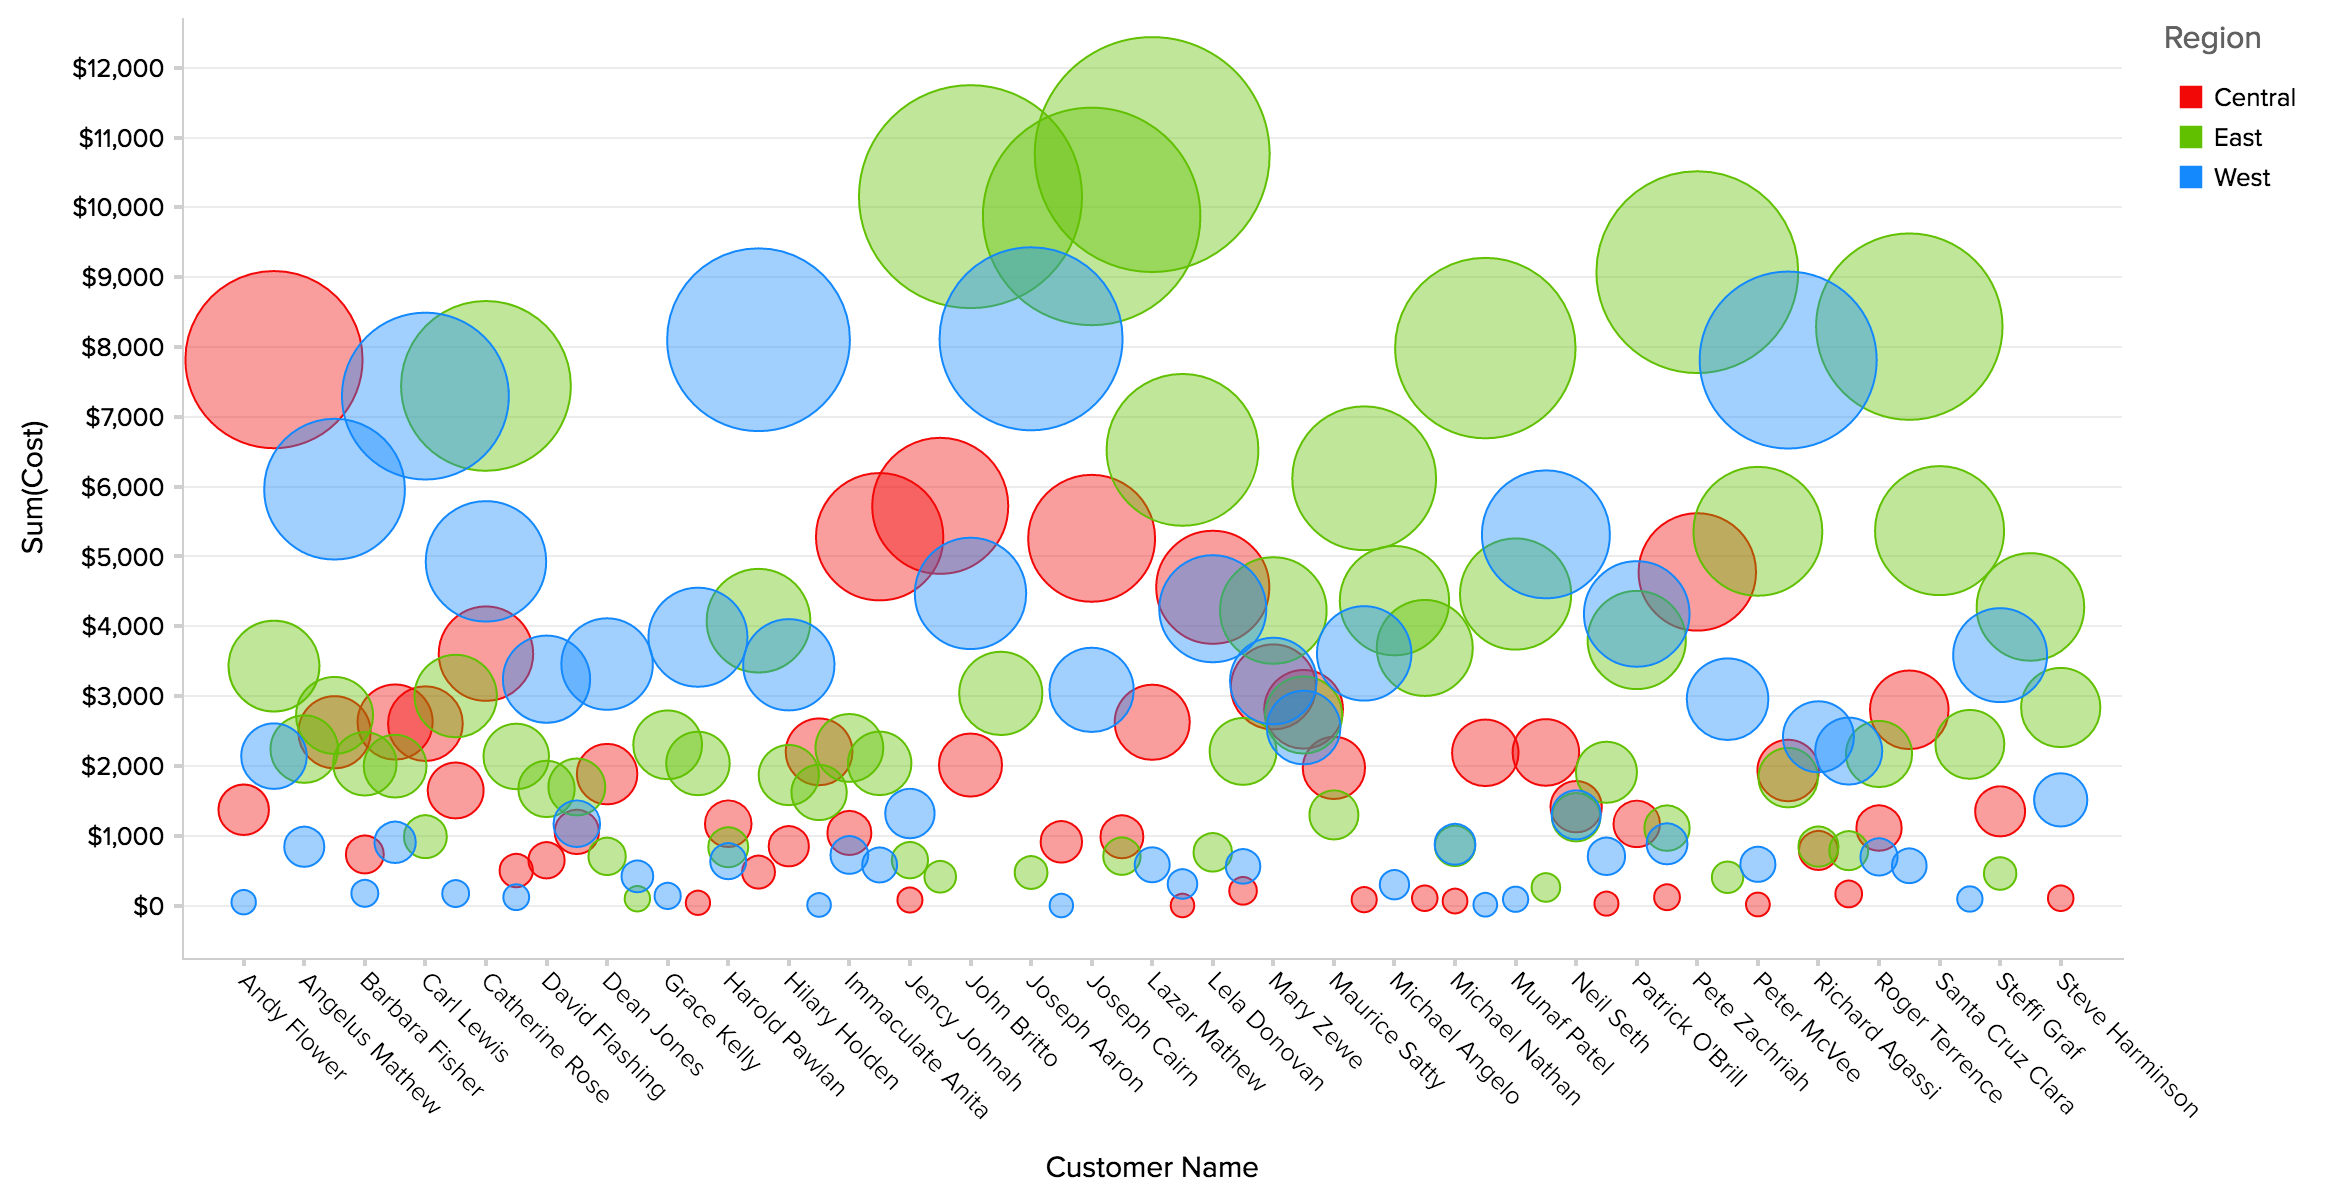
Support to Set 'Column Width Ratio' while Exporting as PDF
EnhancementAnalytics Plus now gives you options to set the column width ratio while exporting any tabulated report (Pivots, Tabular View and Summary View) as a PDF. You can choose to either export the report with
- Equal width for all columns, or
- Maintain the same width proportion used in the report
Enhancements in User Filters
EnhancementIn continuation with our updates on the user filter feature (Timeline Filter), we have once again come up with a list of enhancements to improve usability.
In this update, the following features have been supported:
Highlighting applied filters:
This feature automatically highlights the user filter that has been applied on your report/dashboard with a subtle green color. This helps you quickly identify the filter that has been applied.
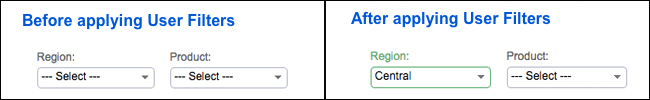
Filter Level Reset:
You can now reset individual user filters on reports and dashboards. To reset individual filters, click the reset link available above the corresponding filter.
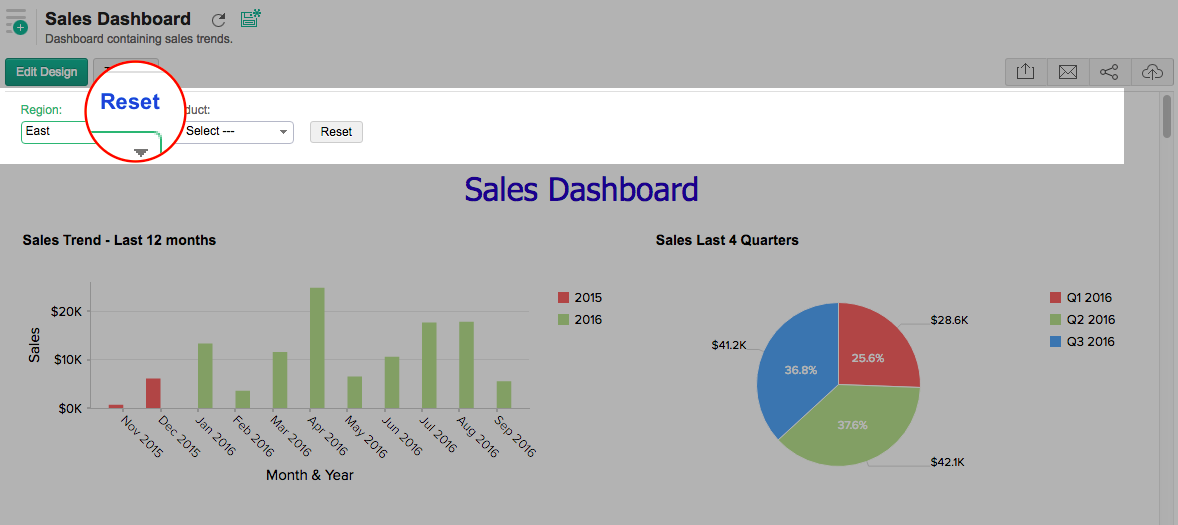
Excluding Dashboard Filters:
Exclude specific reports (in a dashboard) from being effected by dashboard filters.
To exclude,
- Click the Options icon of the report in the dashboard designer
- Select Exclude Dashboard Filters.
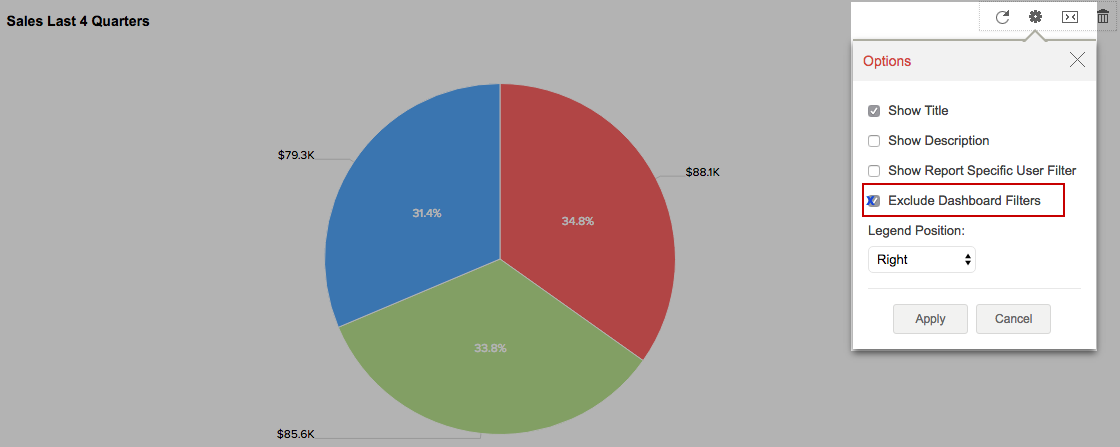
Default Value in Timeline Filter:
You can now set a default value for the timeline filter too.
To set a default value,
- Click the Edit icon on your timeline filter
- In the selected values, click the Star icon that appears on mouse over to mark the value as default.
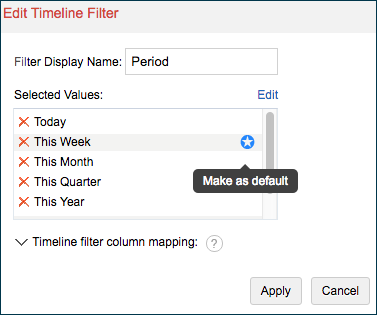
Timeline Date Column mapping:
You can now map a date column to be used for a timeline filter at a report level.
- Click the Options icon of the report in the dashboard designer (in edit mode).
- Select the date column from the Mapping Timeline Filter drop-down.
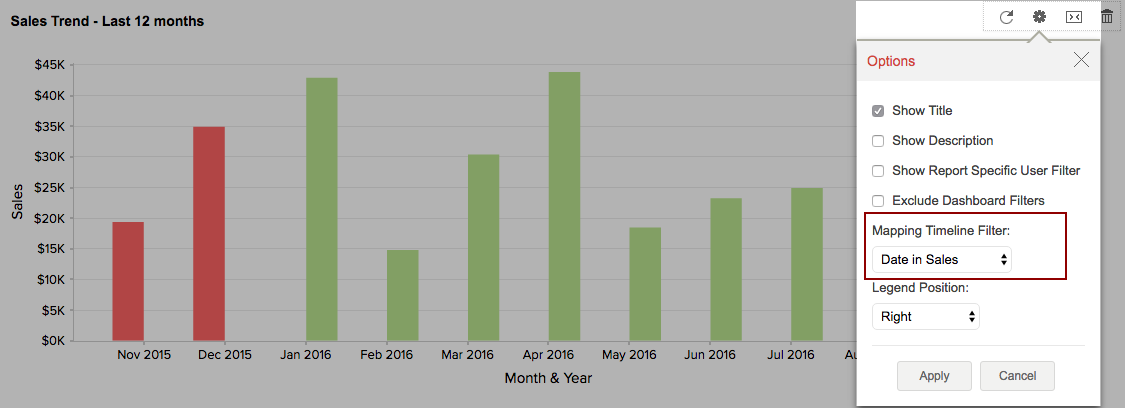
Improved Drill Down Feature
EnhancementAnalytics Plus now allows you to dynamically select the drill down path from the chart interface. Earlier, when you define a drill down path, you will be allowed to traverse only through the defined path. Now, all the related columns will be listed in a drop down and you can choose the drill down path on the fly.
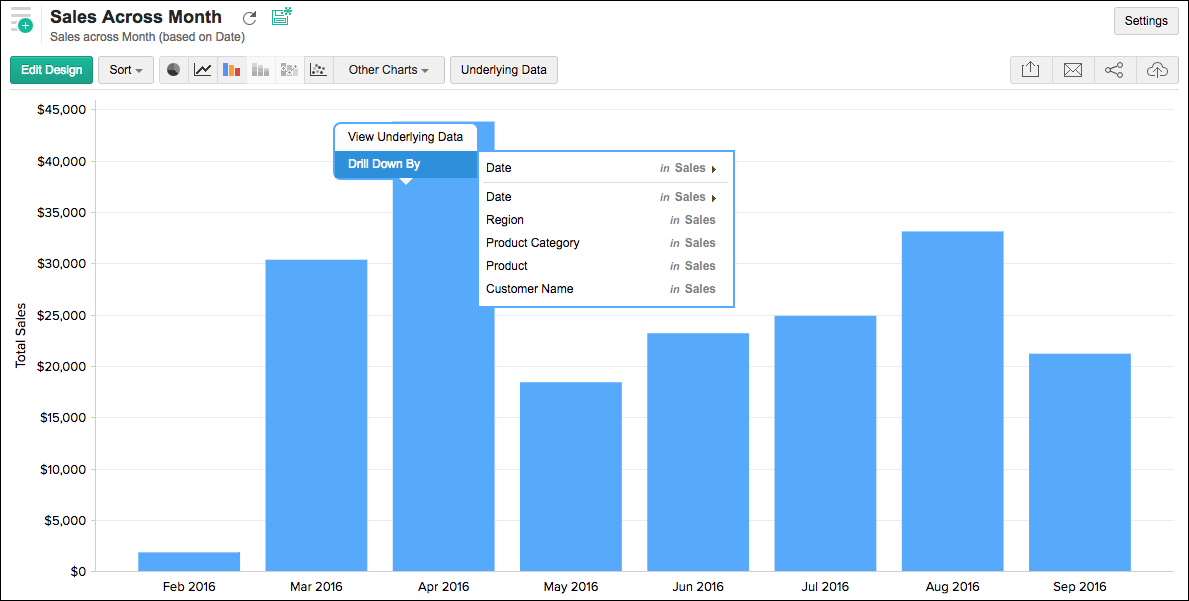
You can also configure the list of additional columns that are to be listed as a part of the drill down while sharing a chart.
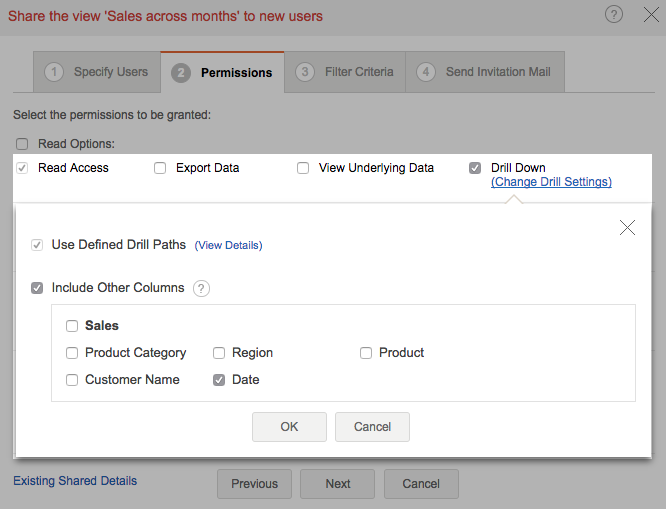
In order to dynamically drill-down, click on the chart area and select Drill Down by.
Week Settings at Database Level
EnhancementYou can now update the week settings such as start day of the week, week format and week mode at the database level. All the reports in the database will use this week setting.
To do this,
- Login to Analytics Plus
- Open the corresponding workspace
- Click Settings > General
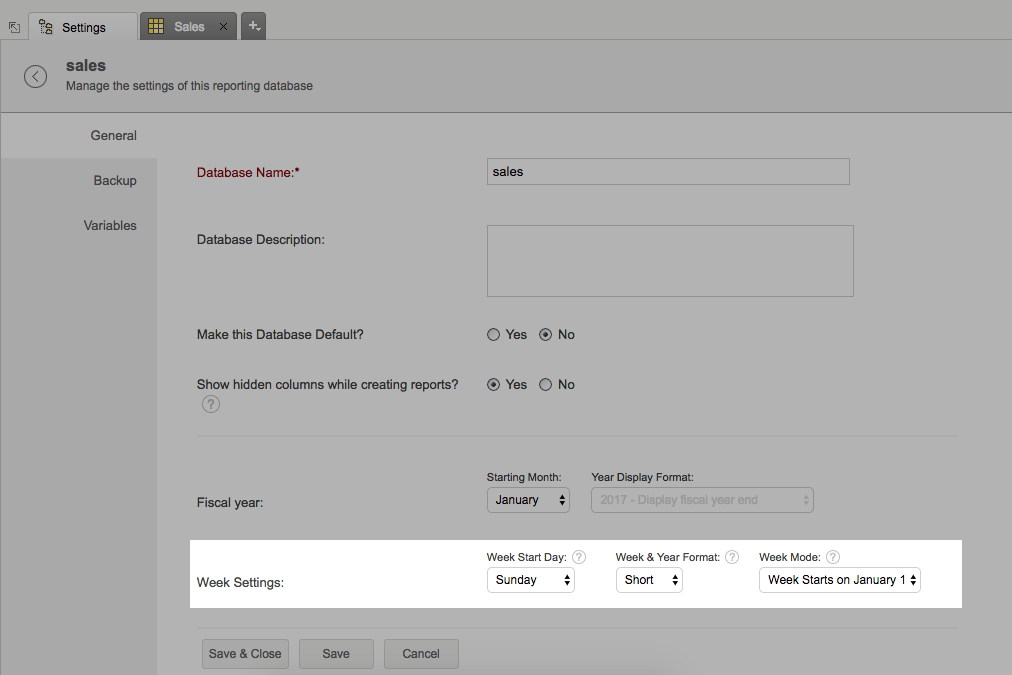
Live Connect with Amazon Redshift Database
NewWe have released a new and simple method to import data directly from various cloud databases such as Amazon RDS, Amazon Redshift, Microsoft SQL Azure into Analytics Plus. In addition to that we are introducing an option to live connect with your Amazon Redshift database.
In this method data will not be imported from Amazon Redshift and stored in Analytics Plus. Instead for every report that you create, Analytics Plus will generate appropriate queries to fetch the required data from Amazon Redshift at the time of report creation. Click here to know more.
Note:
- The live connect feature is available only in Analytics Plus paid plans.
- The feature is currently available only for Amazon Redshift.
Issues fixed
Issues fixed- Errors while changing the datatype of a column from decimal to plain text.
- Exceptions while changing the datatype of a column from plain text to URL. Other general exceptions when modifying the data type of a column have been handled.
- Data corruption that occurs when adding a new formula column.
- Issues related to auto-identification of lookup columns.
- Data from the "Created by" field in the request module of ServiceDesk Plus is pushed to Analytics Plus.
- Fixed issues in displaying accurate underlying data when fields are used in the "color" section of a report.
- Synchronization issues resulting from changing the default ServiceDesk Plus database name.
- Errors resulting from changing the data type from positive number to plain text.
- Display error on using the "Show Missing Values" feature.
- Conditional formating issues with summary and pivot tables.
- Problems with not being able to add more than 5 users in one email schedule.
- Synchronization issues between ServiceDesk Plus version 9226 and Analytics Plus 3010, Personal edition.
- Mismatch in underlying data when aggregate formulas are used in charts.
- Errors in exporting dashboards with images.
- Failure in sharing reports with new users from the explorer window (using the edit share details option) with filter criteria specified.
- Restriction on the length of the domain name of the Analytics Plus host has been relaxed.