APM Insight - An Overview
Overview
Get complete, code-level visibility into how every web transaction behaves, from the moment a request hits your server to the database query that finally resolves it. Applications Manager's APM Insight traces performance issues to their root cause automatically, so your IT operations, development, and application teams can fix problems before end users ever notice them.
APM Insight Architecture
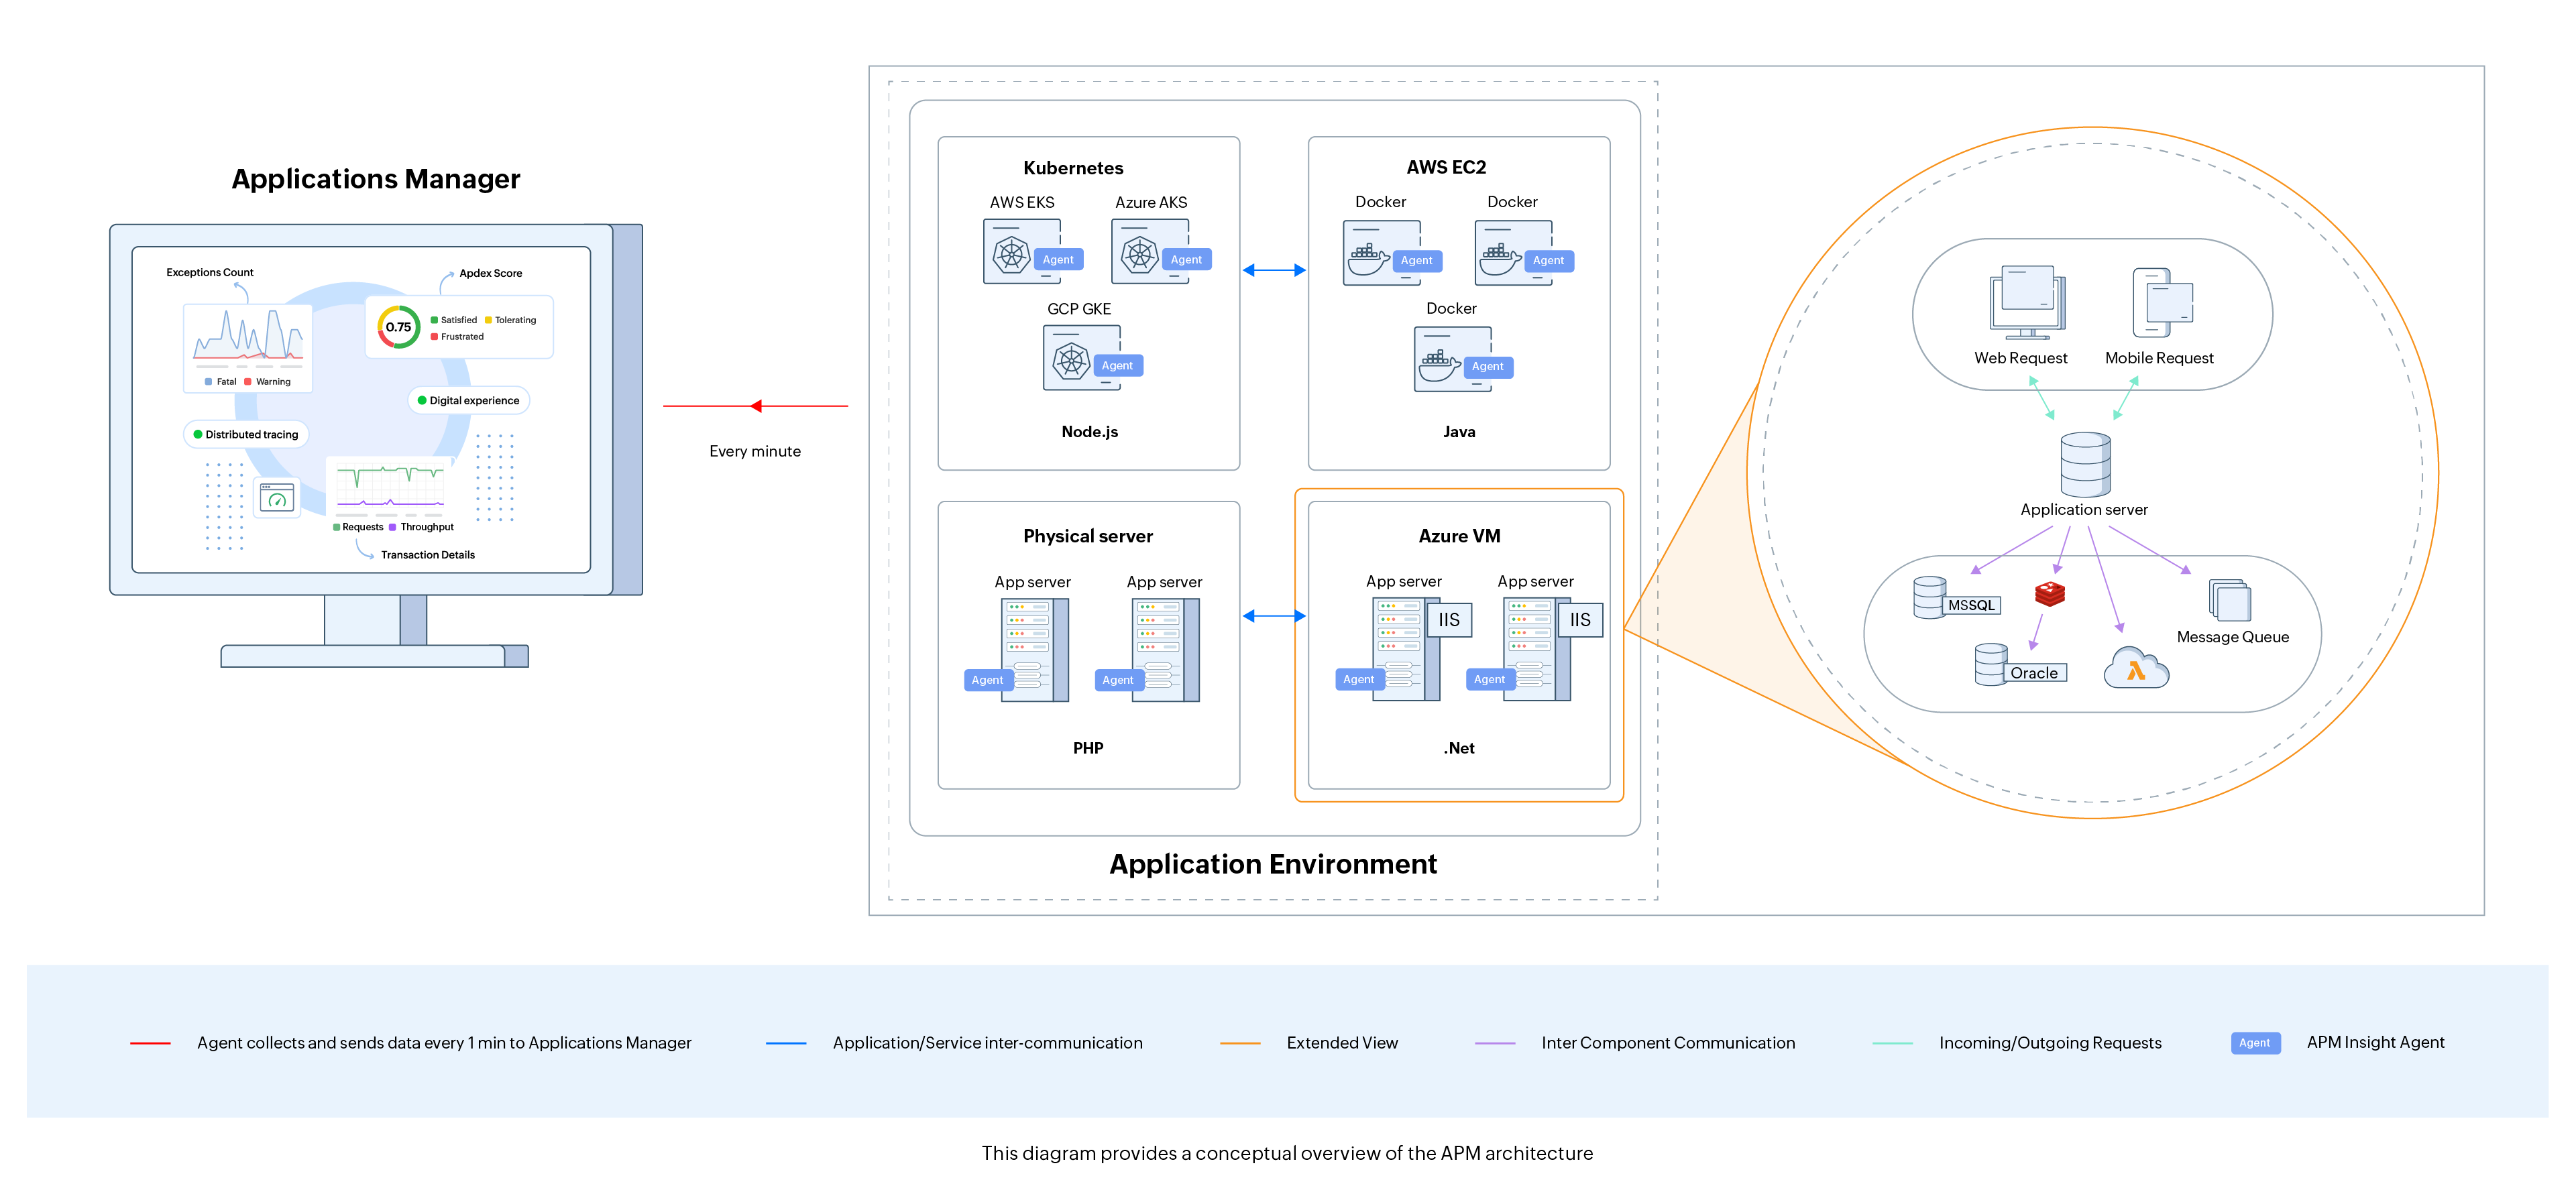
The Applications Manager's APM Insight Agent needs to be downloaded and installed on every app server. Data collection happens every minute through a one-way HTTPS connection, and the collected data gets pushed to Applications Manager's Data Collector. This also ensures incessant agent-server communication. In the case of the .NET agent, the agent sends the collected metrics to the Windows service, which, in turn, pushes the data to the Data Collector. Using the data, users can keep track of application response time, identify slow database queries, measure user satisfaction levels using Apdex scores, isolate slow invocations in code, and keep track of individual method traces, etc.
Working
To learn how APM Insight works in Applications Manager, refer here.
Supported platforms
Gain deep insight into your application's performance with Applications Manager's APM Insight. Supported platforms include Java, .NET, Ruby on Rails, PHP, Node.js, and Python application monitoring. Click on your application's language below for step-by-step install instructions and the minimum supported version:
| APM Insight agent | Minimum supported version |
|---|---|
| Java | Java 8 or above. |
| .NET | Microsoft .NET Framework version 4.0 or above hosted on IIS 7.0 or above. |
| Ruby | Ruby - 1.8.7 or above, Rails - 3.0 or above, Sinatra - 1.4.0 or above. |
| PHP | PHP 7.0 or above. |
| Node.js | Node.js version 16.20.2 or above. |
| Python | Python 3.7 or above. |
Instant application monitoring with AutoProfiler
Skip the manual agent setup. APM Insight AutoProfiler automatically discovers Java, .NET, and other supported applications running on your server and starts monitoring them right away, a fast path to visibility without hunting down the right install steps for every framework.
Note: When you install the Applications Manager Full-Stack Agent with APM Insight enabled, the APM Insight AutoProfiler service is installed automatically.
Learn more about how Application Process Discovery works, or check the AutoProfiler release notes for Windows and Linux.
Metrics and configuration
Optimize your application performance by understanding the key metrics of APM Insight, and tune the agent configuration to fit your environment.
- Getting Started with APM Insight - New to APM Insight? Start here for a full orientation to how it works.
- Monitored Metrics - Understand the basic terminologies and parameters used in APM Insight.
- APDEX Scores - Understand how APDEX scores measure user satisfaction with your application's response time.
- Web Transactions - Understand how individual web transactions are traced end to end.
- Overall Response Time - Understand the correlation between individual component response times and your application's overall response time.
- Application Components - Understand how your application components connect and communicate with each other, and their impact on performance.
- Track Background Transaction - Understand how background transactions are monitored and configure them to your needs.
- Business Transactions - Mark your most business-critical transactions, set dedicated thresholds and alarms just for them, and drill into Root Cause Analysis the moment one breaches.
- Business Transaction Grouping - Group related transactions under a shared name and apply thresholds, filters, and naming patterns across multiple endpoints.
- Custom Instrumentation - Monitor custom transactions, classes, methods, and frameworks using custom instrumentation for code-level insights.
- Handling Autoscaling - Understand how APM Insight handles autoscaling for cloud-based applications.
- Data Exporter for Windows - The Data Exporter is an independent process that communicates application metrics and traces to the Applications Manager server on Windows.
- Data Exporter for Linux - The Data Exporter is an independent process that communicates application metrics and traces to the Applications Manager server on Linux.
- Configuration Profile - Customize your APM Insight agent configuration profile and set thresholds for key parameters of web and background transactions.
Note: For Applications Manager v15060 and below, agent configuration settings can be set up only in the apminsight.conf file. Learn more
Additional features
Go beyond the basics with capabilities built for complex, cloud-native, and distributed environments.
- Distributed Tracing - Track transaction traces made from one application to another with distributed tracing.
- Service Maps - Use service maps to gain a topological view of your application components along with their connection to other dependent resources in your infrastructure.
- App Parameters - Monitor important metrics in your application using app parameters.
- Thread Profiling - Use thread profiling to identify and eliminate bottlenecks in your code.
- Autoscaling - Efficiently monitor instances using autoscaling for cloud-based applications.
OpenTelemetry integration
Already instrumenting with OpenTelemetry? Bring that data straight into Applications Manager. Our OpenTelemetry integration turns your existing traces into actionable performance insights, dependency mapping, root-cause analysis, and cross-service visibility, without re-instrumenting a single line of code.
Note: Currently supported telemetry includes traces, transactions, response times, errors/exceptions, external calls, and SQL execution. Metrics and logs support is planned for a future release.
RUM integration
See the full picture, from backend transaction performance to real user experience in the browser, in one place. Auto RUM Injection adds real user monitoring alongside your APM agent automatically, no manual script management required. Learn more about Auto RUM Injection.
Mobile App Monitoring
Track the real-world performance of your mobile apps alongside your backend. Applications Manager's Mobile App Monitor covers Android and iOS, from app launch to network calls, so you can catch crashes and slow screens before users complain. Learn more about Mobile App Monitoring.

