Ensure 24/7 uptime with synthetic monitoring: Simulate user journeys, prevent issues
Applications Manager's synthetic monitoring tool acts as a virtual user, meticulously traversing your website or application and mimicking real user journeys. By simulating critical interactions and page loads across major desktop browsers, you can:
- Simulate user load: Use Selenium scripts and REST API checks to mimic multiple users and track performance under load.
- Identify issues proactively: Detect potential problems before they affect real users, ensuring seamless performance.
- Pinpoint root causes: Isolate performance bottlenecks—database queries, scripts, network issues—for swift resolution.
- Ensure cross-browser compatibility: Monitor performance across major browsers (Chrome, Firefox, Safari) for a consistent user experience.
Go beyond basic metrics with Applications Manager's synthetic monitoring tools
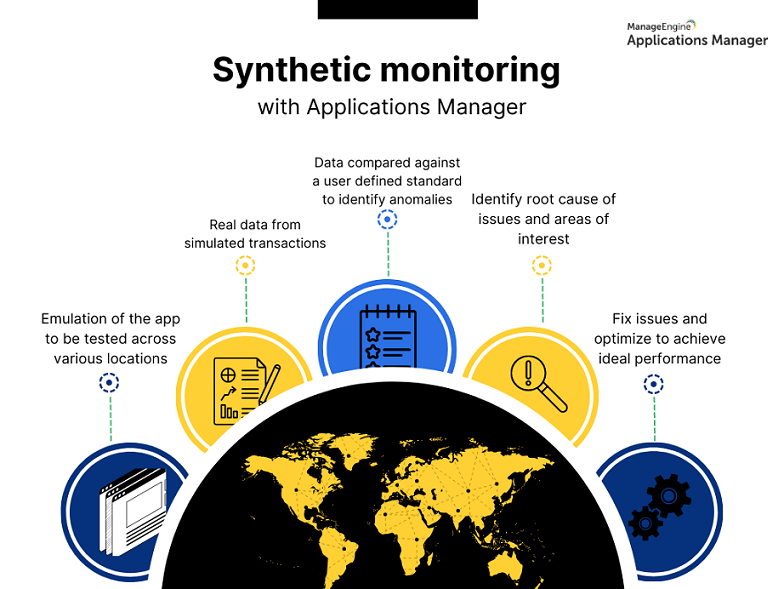
Applications Manager's synthetic monitoring tools help you get answers to questions like:
- Is my website available 24x7? How fast is my website at this moment?
- Are my key business transactions working?
- How are the third-party components operating?
- Is there a failure or slowdowns anywhere?
Applications Manager goes beyond just answering questions. It also empowers you to:
- Proactively prevent downtime and SLA breaches.
- Boost user satisfaction and conversion rates.
- Minimize costs associated with performance issues.
Experience your web app like a user with the power of synthetic testing
Unpredictable application performance can cripple the user experience and hurt your business. Applications Manager's synthetic monitor is your weapon to combat these challenges: Proactively simulate real user journeys, identify hidden bottlenecks, and ensure consistent performance across all touchpoints. Gain actionable insights into user behavior, optimize resource allocation, and deliver exceptional experiences that drive customer satisfaction and business growth. With Application Manager:
- Track critical components and metrics
- Replicate user journeys
- Get comprehensive details about your URL sequences
- Understand website behavior across global locations
- Track key webpage components
- Detect and resolve performance anomalies with accurate RCA
- Evaluate and analyze application performance with intelligent reports
Track critical components and metrics
Elevate your user experience with Applications Manager's Real Browser Monitor(RBM). This sophisticated tool transcends traditional synthetic transaction monitoring by mimicking real user behavior through automated scripts, precisely replicating the journeys your customers take on your website.
The RBM utilizes two powerful components to enable synthetic transaction monitoring:
- End User Monitoring (EUM) agents: Strategically deploy these agents across diverse geographic locations to simulate user journeys from multiple perspectives, enabling you to gain granular insights into performance from anywhere in the world.
- Web Transaction (RBM) Recorder Browser Extensions: Capture your application's user flow with ease, recording every click, scroll, and interaction to build realistic browser scripts. These recordings, which capture user actions from actual browsers, can also be revisited at a later time in the recorder tool.
Replicate user journeys
Applications Manager's Web Transaction (RBM) Recorder browser Extension provides a robust solution for the meticulous capture and analysis of user journeys, enabling proactive identification and resolution of performance issues within web applications. Analyze entire user flows, and get insights into critical paths and interactions that might be missed by traditional URL-based monitoring.
Precise user flow replication: The Web Transaction Recorder precisely records simulated user transactions, capturing HTTPS and HTTP request URLs in their exact sequence to mirror real-world interactions and uncover potential bottlenecks.
Real-time response code monitoring: The Web Transaction Recorder detects bad response codes instantly, triggering proactive alerts for swift resolution and minimizing negative impacts on the user experience.

Get comprehensive details about your URL sequences
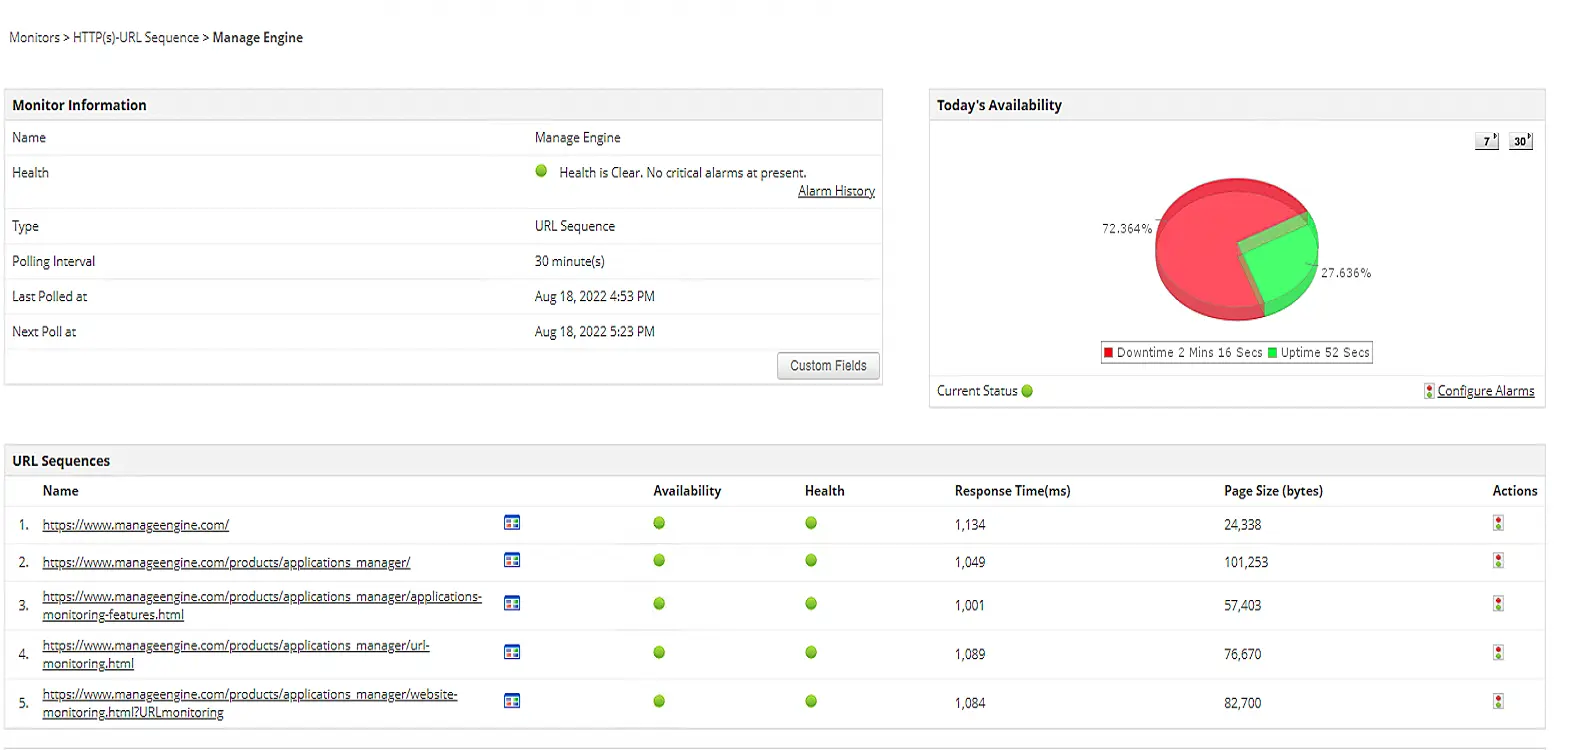
Gain granular control over your website's performance with Applications Manager's comprehensive synthetic web monitoring service. Beyond basic availability checks, Applications Manager provides in-depth insights into critical metrics like:
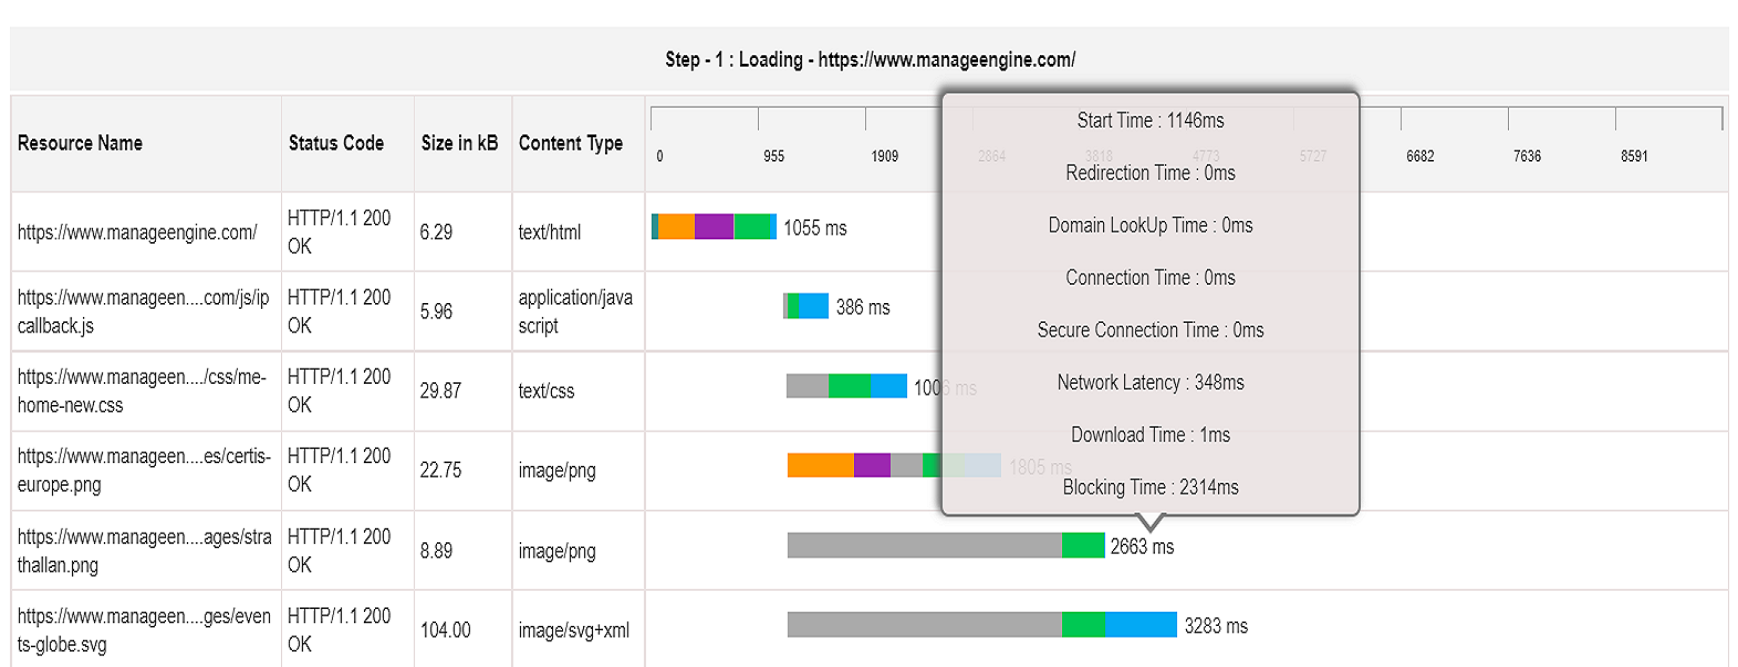
- Individual URL and page response times: Identify performance bottlenecks at the granular level, pinpointing slow elements and optimizing page load speeds.
- DNS resolution times: Uncover potential DNS bottlenecks and optimize domain resolution for faster website access.
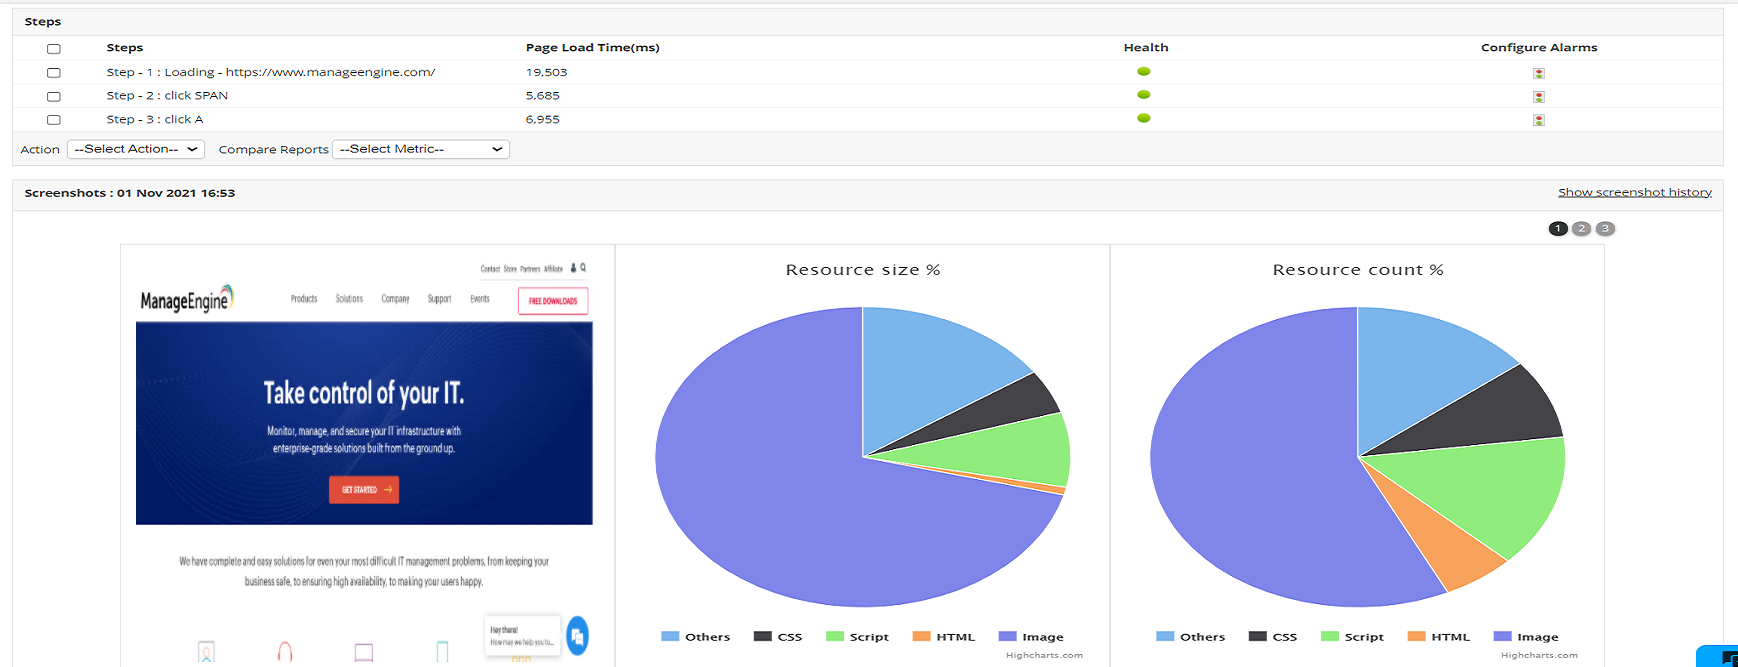
- Page size analysis: Analyze page size distribution and identify resource-intensive elements for efficient website optimization.
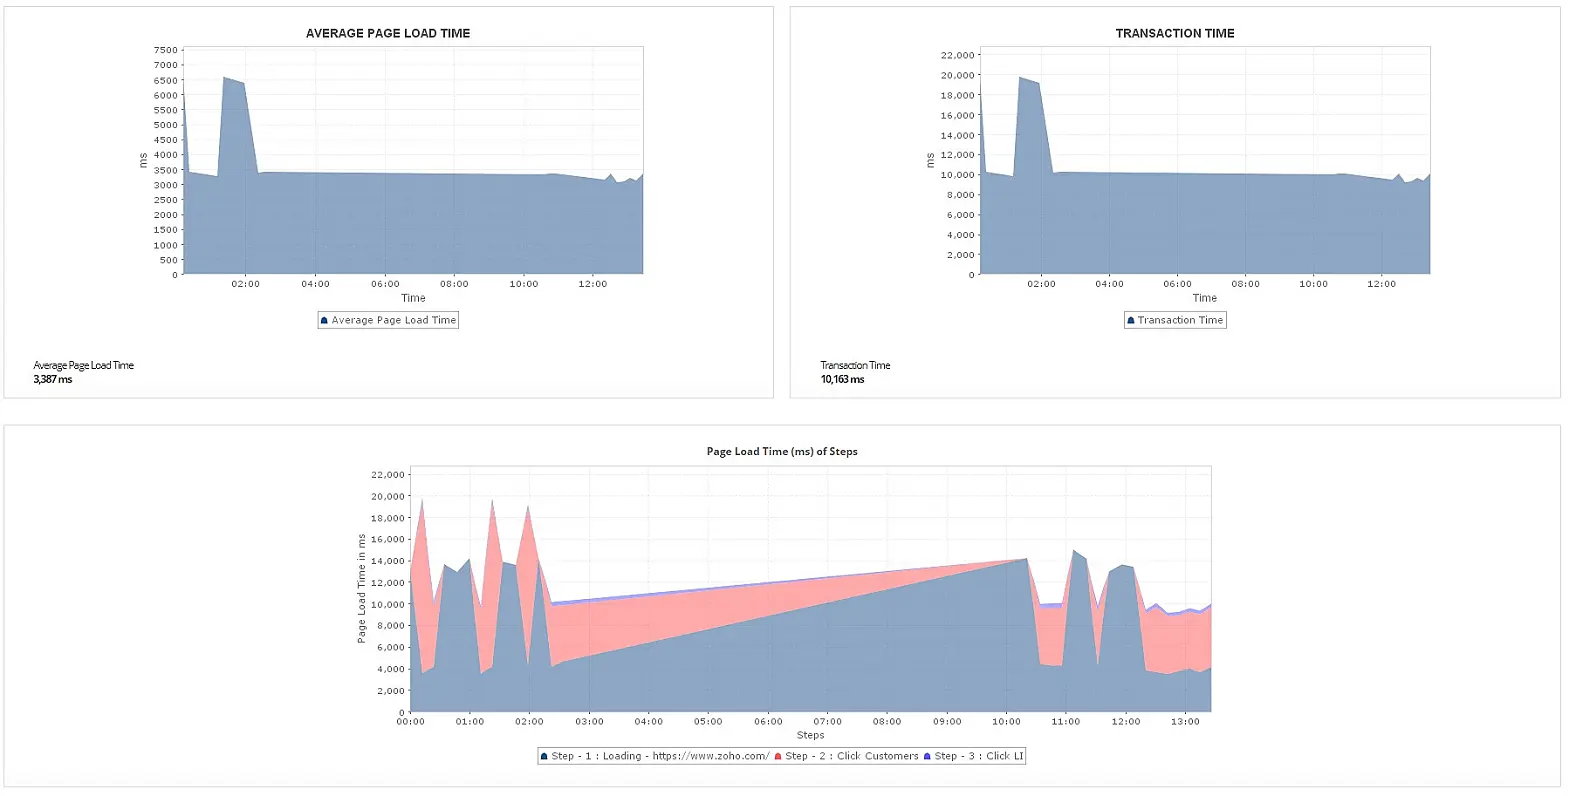
The synthetic monitor allows you to capture screenshots of your transaction to gain better insights, especially during downtime. Additional details about the captured webpage, such as the types of resources used and the time taken to load each resource, are also provided.
Understand website behavior across global locations
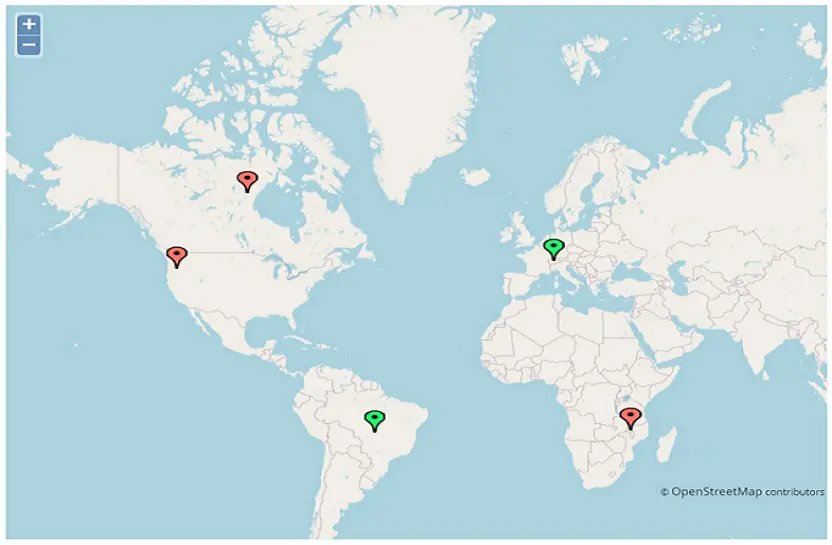
Go beyond limited performance metrics and gain a global understanding of your user experience with Applications Manager's synthetic monitoring platform. You can install our EUM agents in locations of your choice—enterprise branch offices, actual customer locations, or on AWS instances. Our powerful synthetic monitoring system empowers you to:
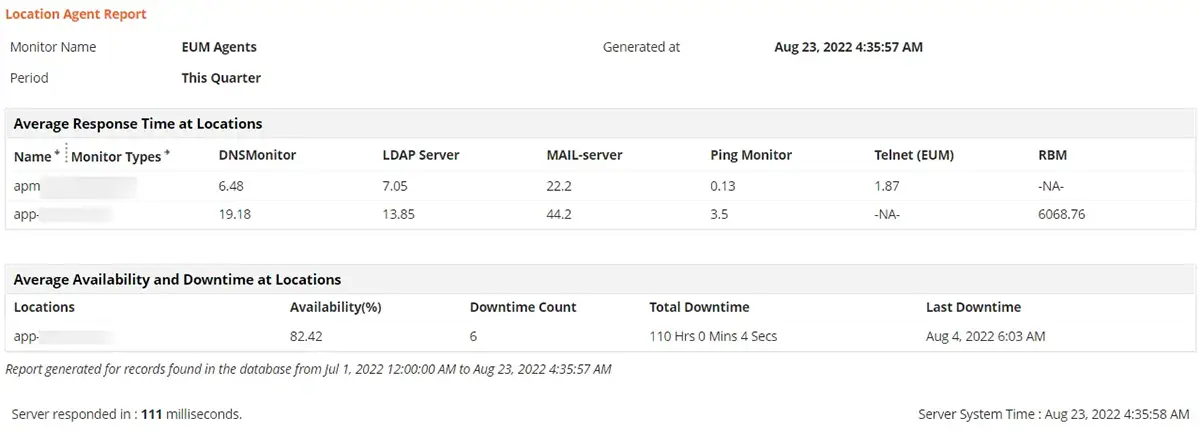
- Measure regional performance variations: Pinpoint latency issues and bottlenecks impacting users in specific locations, ensuring consistent performance across the globe.
- Gauge localized user experience: Understand how language, cultural preferences, and infrastructure differences affect user journeys, allowing you to personalize and optimize experiences.
- Gain critical insights into service health: Monitor the vital signs of your applications and services, including health, availability, and status, ensuring consistent performance across all regions.
Track key webpage components
While monitoring your web applications is crucial, Applications Manager's synthetic monitoring features empower you to go much further. Gain complete visibility into your entire digital infrastructure with comprehensive monitoring of:
- Web servers: Ensure optimal performance and uptime for your web servers, preventing outages and latency.
- Web services: Monitor the health and responsiveness of diverse web services, including DNS servers, ping, Telnet, TCP/IP ports, SNMP, NPS, UDP, and LDAP.
- REST APIs: Guarantee the smooth operation of your APIs, and prevent disruptions that could impact critical integrations.
- Email servers: Secure reliable email delivery with availability monitoring of SMTP and POP servers.
You can also supplement your synthetic website monitoring data with that of real user monitoring to keep track of frontend performance based on actual traffic.
Detect and resolve performance anomalies with accurate RCA
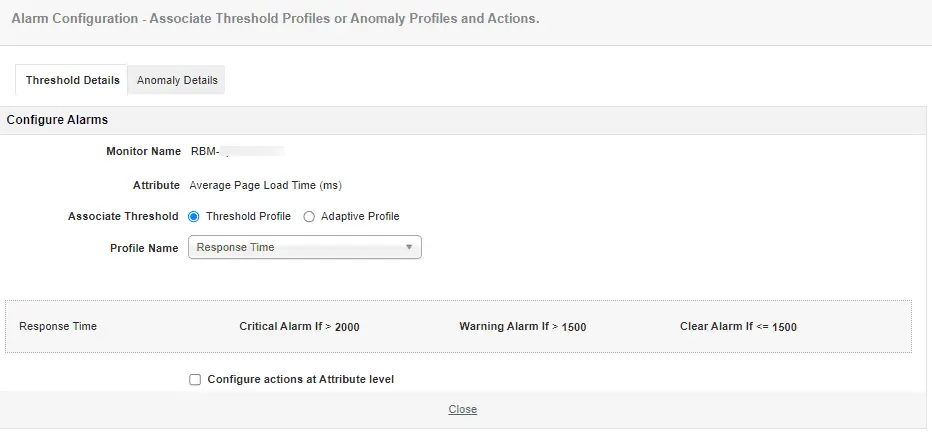
Detect issues in your web apps with synthetic testing and ensure incident resolution before they manifest to end users. Applications Manager's powerful fault management system is equipped with anomaly detection and RCA capabilities that accurately pinpoint the root cause of slow performance and errors. It also comes with automated actions that can be triggered in case of admittable threshold violations. This helps slash your mean time to identify (MTTI) and mean time to resolve (MTTR) and reduce manual interventions in case of errors.
Evaluate and analyze application performance with intelligent reports
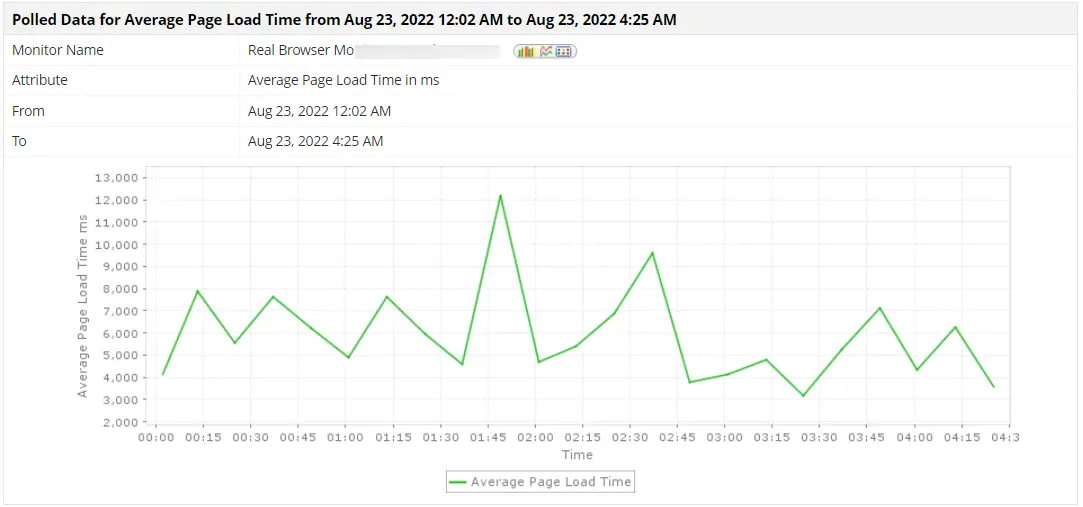
Transform your synthetic monitoring efforts with Applications Manager's data-driven application analytics and historical trend analysis. Analyze historical data on critical parameters like availability, response times, and load times across all components of your services. This empowers you to identify emerging trends, anticipate potential bottlenecks, and make informed decisions for continuous performance optimization.
Looking to simulate and monitor your user interactions?
Get started with our 30-day free trial now to experience all the features of our synthetic monitoring tool.
More on synthetic performance monitoring
What is synthetic monitoring?
The process of simulating a user's journey through a web application and monitoring it to detect any latency-increasing elements is widely known as synthetic monitoring or synthetic testing. A synthetic monitor can also be employed from various locations around the globe remotely.
What is synthetic monitoring tool?
A synthetic monitoring tool simulates user interactions with an application or website to monitor performance and availability. It runs scripted transactions at regular intervals to detect issues such as slow load times or downtime before real users are affected.
What is synthetic API monitoring?
Synthetic API monitoring is a proactive approach that involves simulating API requests from various locations and under different conditions to test and track API performance, functionality, and availability. By proactively identifying and addressing potential issues before they impact real users, synthetic API monitoring helps organizations maintain high levels of API reliability and performance.
Why do we need synthetic monitoring?
To ensure a seamless experience for your end-users, synthetic performance monitoring is imperative. It helps you understand how the user interacts with the web application, and ensure the functionality of critical elements in it.
What are the types of synthetic monitoring?
Synthetic monitoring usually involves three types of tests:
- Availability monitoring: Enables you to confirm that a site or application is available and responding to requests.
- Web performance monitoring: Enables you to look at page load speed and the performance of specific elements on a web page.
- Transaction monitoring: Enables you to complete specific transactions such as logging in, filling form, searching, adding items to shopping cart, check out, etc.
What is the best tool used for synthetic monitoring?
There are various synthetic monitoring solutions available on the market. ManageEngine's Applications Manager is one such solution that can be used to perform synthetic testing, among other capabilities. By keeping a 24x7 close watch on your web application, it can help identify performance issues before they affect end users. The synthetic monitoring platform comes with a web transaction recorder, real browser monitor, EUM agent and other end user monitoring capabilities to provide a thorough monitoring experience.
How do you implement synthetic monitoring?
To start monitoring synthetic transactions using Applications Manager, an EUM agent and a Web Transaction Recorder must be installed. You can then add your workflows that need to be monitored and configure various settings to monitor your web applications effectively.
