- Free Edition
- What's New?
- Key Highlights
- Suggested Reading
- All Capabilities
-
Log Management
- Event Log Management
- Syslog Management
- Log Collection
- Agent-less Log Collection
- Agent Based Log collection
- Windows Log Analysis
- Event Log Auditing
- Remote Log Management
- Cloud Log Management
- Security Log Management
- Server Log Management
- Linux Auditing and Reporting
- Auditing Syslog Devices
- Windows Registry Auditing
- Privileged User Activity Auditing
-
Application Log Management
- Application Log Monitoring
- Web Server Auditing
- Database Activity Monitoring
- Database Auditing
- IIS Log Analyzer
- Apache Log Analyzer
- SQL Database Auditing
- VMware Log Analyzer
- Hyper V Event Log Auditing
- MySQL Log Analyzer
- DHCP Server Auditing
- Oracle Database Auditing
- SQL Database Auditing
- IIS FTP Log Analyzer
- IIS Web Log Analyzer
- IIS Viewer
- IIS Log Parser
- Apache Log Viewer
- Apache Log Parser
- Oracle Database Auditing
-
IT Compliance Auditing
- ISO 27001 Compliance
- HIPAA Compliance
- PCI DSS Compliance
- SOX Compliance
- GDPR Compliance
- FISMA Compliance Audit
- GLBA Compliance Audit
- CCPA Compliance Audit
- Cyber Essentials Compliance Audit
- GPG Compliance Audit
- ISLP Compliance Audit
- FERPA Compliance Audit
- NERC Compliance Audit Reports
- PDPA Compliance Audit reports
- CMMC Compliance Audit
- Reports for New Regulatory Compliance
- Customizing Compliance Reports
-
Security Monitoring
- Threat Intelligence
- STIX/TAXII Feed Processor
- Threat Whitelisting
- Real-Time Event Correlation
- Log Forensics
- Incident Management System
- Automated Incident Response
- Linux File Integrity Monitoring
- Detecting Threats in Windows
- External Threat Mitigation
- Malwarebytes Threat Reports
- FireEye Threat Intelligence
- Application Log Management
- Security Information and Event Management (SIEM)
- Real-Time Event Alerts
- Privileged User Activity Auditing
-
Network Device Monitoring
- Network Device Monitoring
- Router Log Auditing
- Switch Log Monitoring
- Firewall Log Analyzer
- Cisco Logs Analyzer
- VPN Log Analyzer
- IDS/IPS Log Monitoring
- Solaris Device Auditing
- Monitoring User Activity in Routers
- Monitoring Router Traffic
- Arista Switch Log Monitoring
- Firewall Traffic Monitoring
- Windows Firewall Auditing
- SonicWall Log Analyzer
- H3C Firewall Auditing
- Barracuda Device Auditing
- Palo Alto Networks Firewall Auditing
- Juniper Device Auditing
- Fortinet Device Auditing
- pfSense Firewall Log Analyzer
- NetScreen Log Analysis
- WatchGuard Traffic Monitoring
- Check Point Device Auditing
- Sophos Log Monitoring
- Huawei Device Monitoring
- HP Log Analysis
- F5 Logs Monitoring
- Fortinet Log Analyzer
- Endpoint Log Management
- System and User Monitoring Reports
-
Log Management
- Product Resources
- Related Products
- Log360 (On-Premise | Cloud) Comprehensive SIEM and UEBA
- ADManager Plus Active Directory Management & Reporting
- ADAudit Plus Real-time Active Directory Auditing and UBA
- ADSelfService Plus Identity security with MFA, SSO, and SSPR
- DataSecurity Plus File server auditing & data discovery
- Exchange Reporter Plus Exchange Server Auditing & Reporting
- M365 Manager Plus Microsoft 365 Management & Reporting Tool
- RecoveryManager Plus Enterprise backup and recovery tool
- SharePoint Manager Plus SharePoint Reporting and Auditing
- AD360 Integrated Identity & Access Management
- AD Free Tools Active Directory FREE Tools
SonicWall log analyzer for auditing firewall logs
Native SonicWall tools show you what your firewall is doing right now. They don't retain months of data, correlate across devices, or produce audit-ready compliance evidence. Once traffic volume climbs past a few hundred sessions a minute, the built-in SonicOS log viewer stops being an analysis tool and becomes a live feed that nobody can reasonably drill into.
ManageEngine EventLog Analyzer sits downstream of that as a dedicated firewall log analyzer. The solution collects log data from SonicWall next-generation firewalls and applies them across prebuilt SonicWall reports out of the box, spread across four broad areas: security events, user auditing, traffic patterns, and firewall rule and policy changes.
Traffic analysis reports from SonicWall log data
Prebuilt traffic analysis reports break SonicWall log data down across:
- Source and destination IP: Top talkers inbound and outbound, with drill-down into per-session detail.
- Protocol and port: TCP, UDP, ICMP, and specific well-known ports; useful for spotting unexpected protocols on internal segments.
- Time: Trend visualisation for baseline drift and shift-based anomaly spotting.
The reports render as interactive graphs and tables. Traffic volume is broken out separately from traffic count. High packet counts on small payloads look different from a handful of connections moving substantial volumes, and both patterns matter for different threat types. Website traffic reports itemise HTTP and HTTPS destinations by domain, which surfaces both policy violations (personal browsing on segmented networks) and outbound connections to known-bad domains flagged by the built-in global IP threat database.
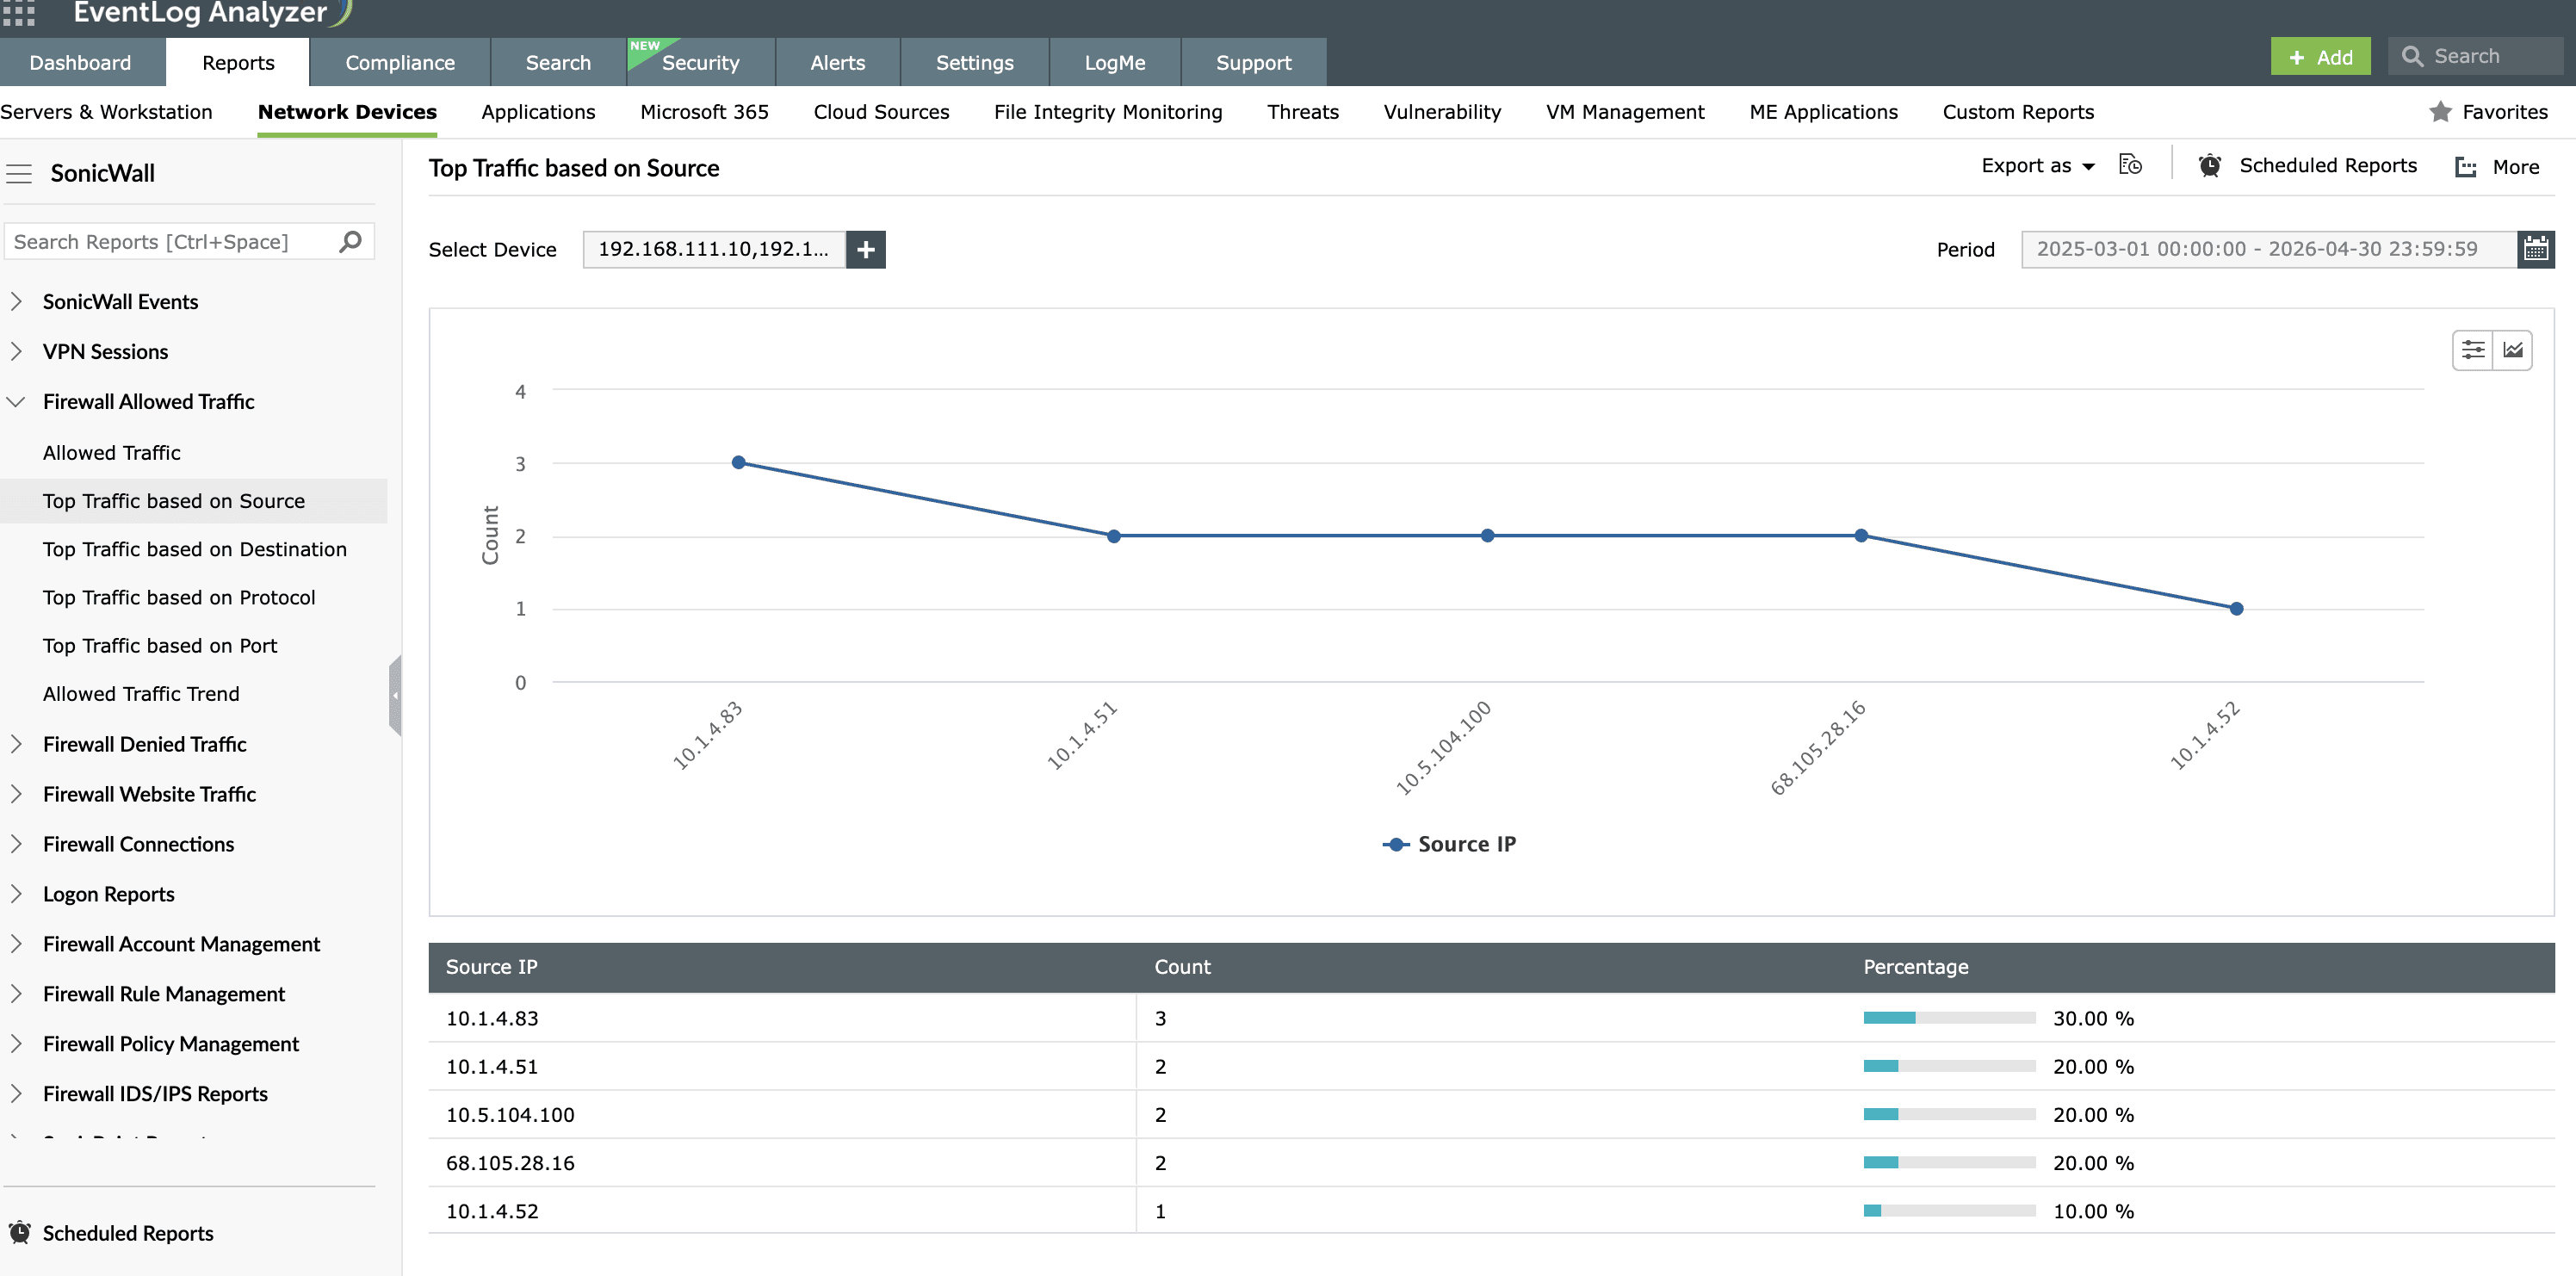
Figure 1: SonicWall Top Traffic trend report of allowed source IPs for traffic analysis
Firewall rule and policy change auditing
SonicWall configuration audit reports track every rule and policy change back to the administrator who made it, the timestamp, and the before-and-after state where SonicWall logs it. Rule additions, deletions, modifications, and reordering all surface as discrete events, so a quarterly policy review becomes a report-driven exercise instead of a diff-the-config exercise. The same reports pick up broader firewall configuration events: interface changes, NAT policy updates, VPN policy edits, and access-list modifications.
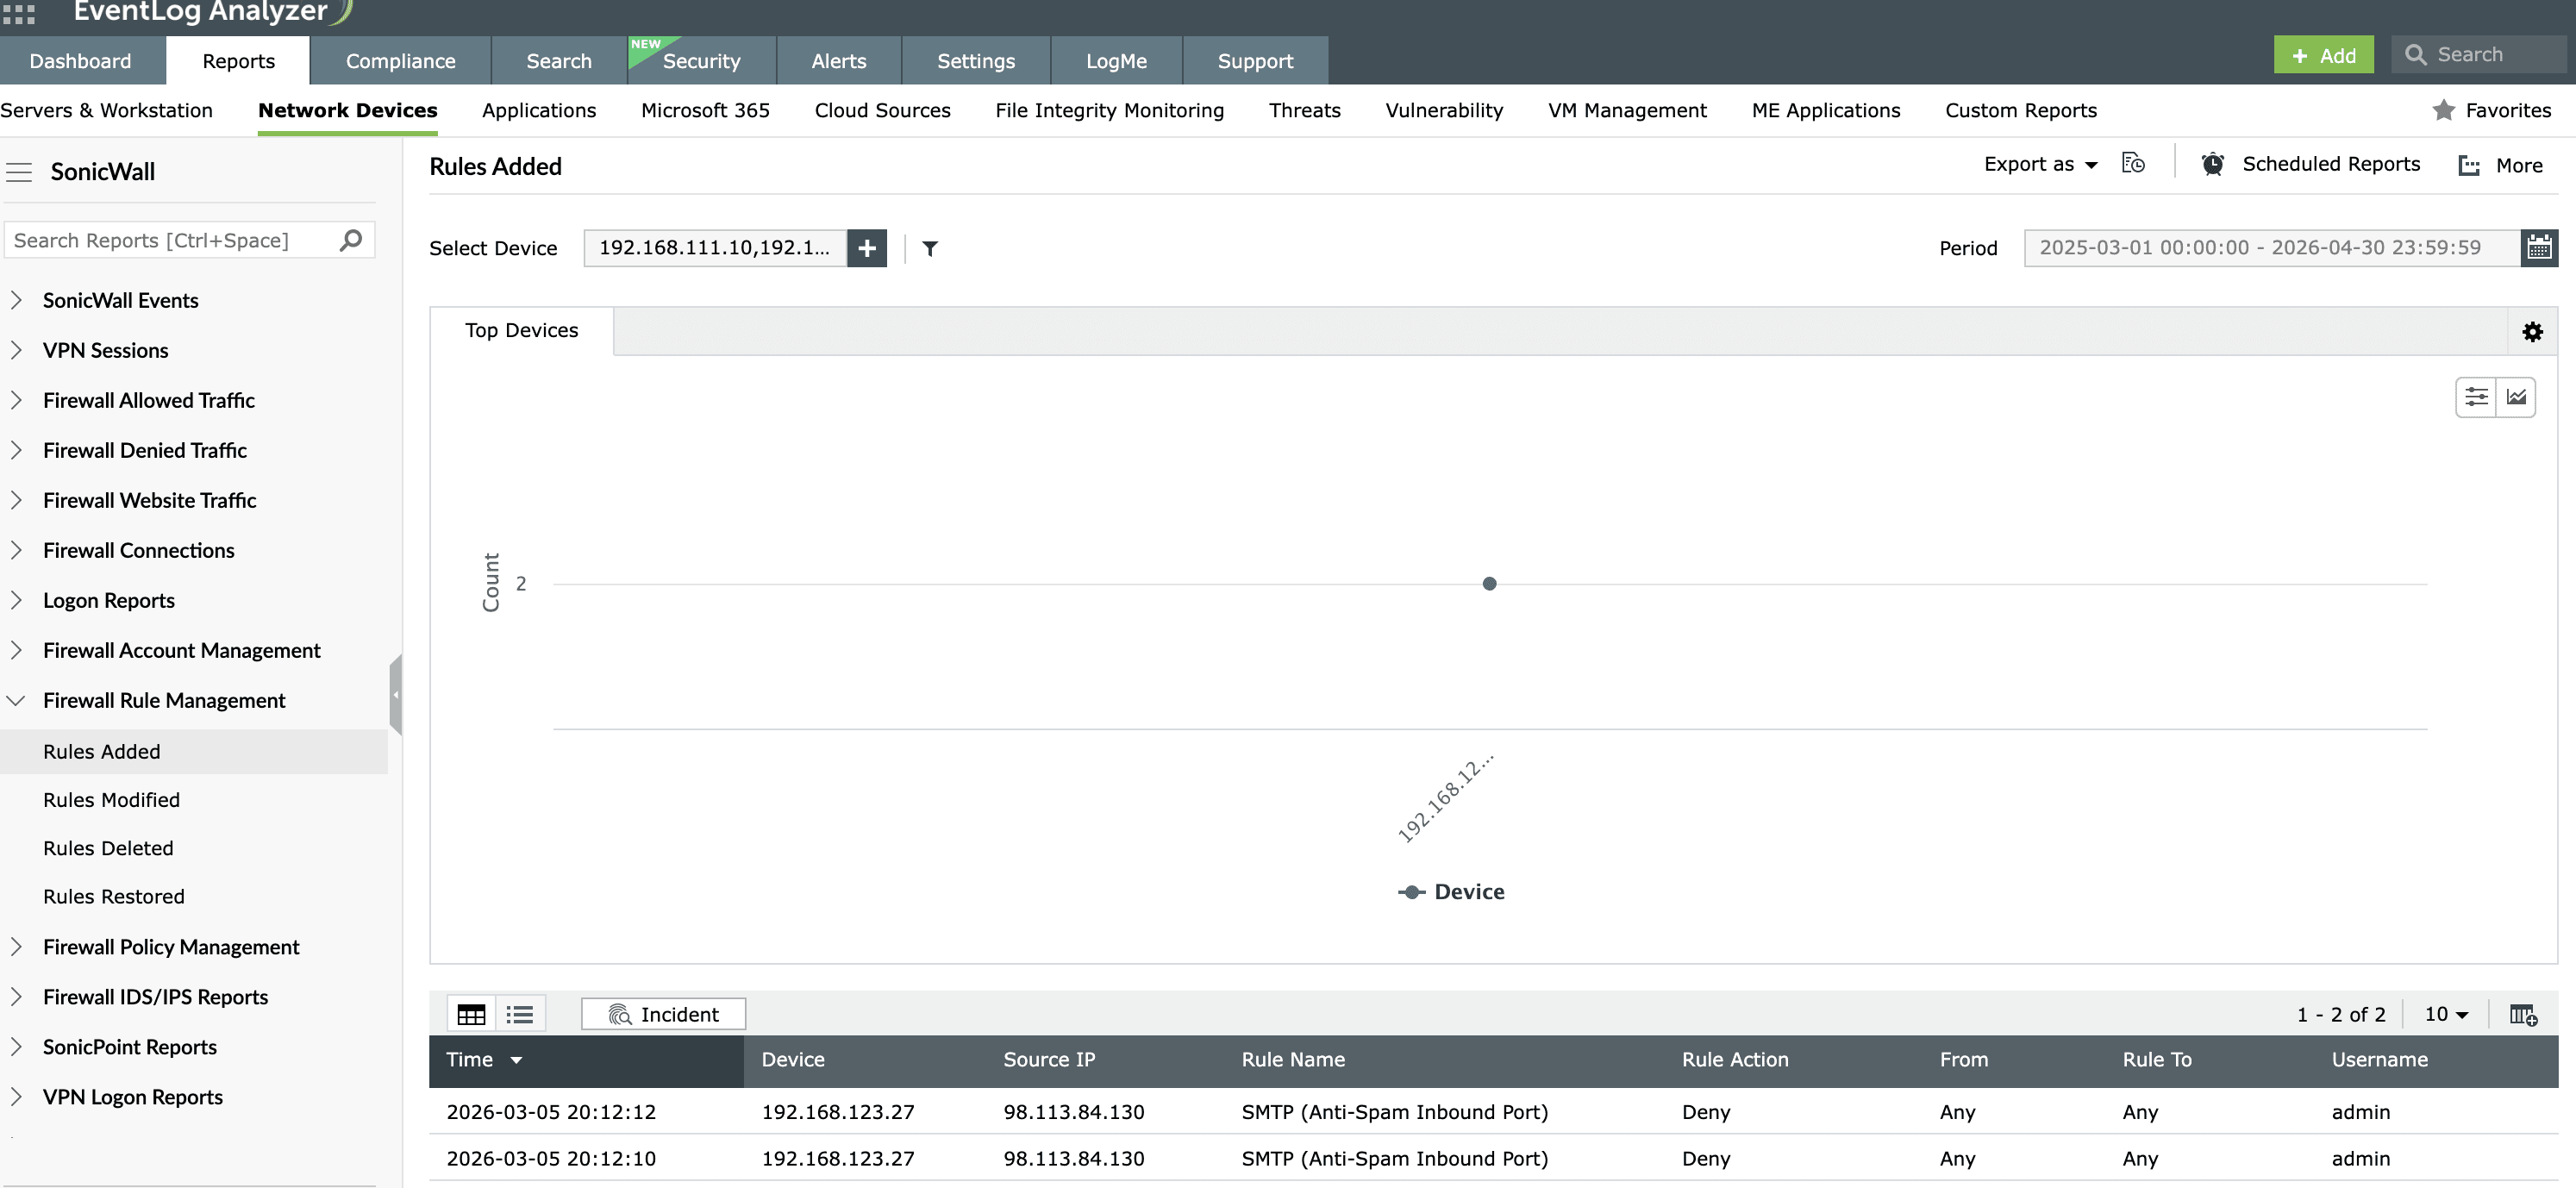
Figure 2: SonicWall firewall rule modification report for policy change auditing
User activity monitoring across SonicWall-protected networks
Most firewall investigations end at an IP. Who was actually behind that connection—which employee, which contractor, which service account—is a separate question, and one that IP-based logs can't answer on their own. When the answer matters (a suspected policy violation, a compromised account, or an insider risk investigation), the gap between we know the source IP and we know who was using that machine is the difference between an actionable finding and a dead end.
Predefined reports cover logon and logoff events on the firewall itself (administrators and end users), web access broken down by user, and denied connections attributed to specific accounts. A supervisor investigating a suspected policy violation can pull an individual user's full firewall activity for a stated window without writing a query: pick the user, pick the date range, and run.
Cross-source correlation of SonicWall events
An identity-tagged firewall event is useful. An identity-tagged firewall event correlated with what the same user did on the domain controller two seconds later is where an investigation actually begins. A user who authenticates through the VPN and immediately triggers a failed logon burst on a domain controller is a two-source pattern the firewall log alone will not tell you about. Neither is a logon on a workstation followed by a spike in outbound denied traffic from that same host. The firewall knows the host, the endpoint knows the user, and only the two together explain what's going on.
User session monitoring is EventLog Analyzer's cross-source view of the same identity. It threads firewall logons together with logons on connected systems (Windows workstations, Linux hosts, and application servers) and surfaces the linked events under a single incident timeline. Event alert profiles handle the real-time side: Save any search as an alert profile, and any future match generates an immediate notification, and optionally, a workflow that blocks the source IP through your automated response chain.
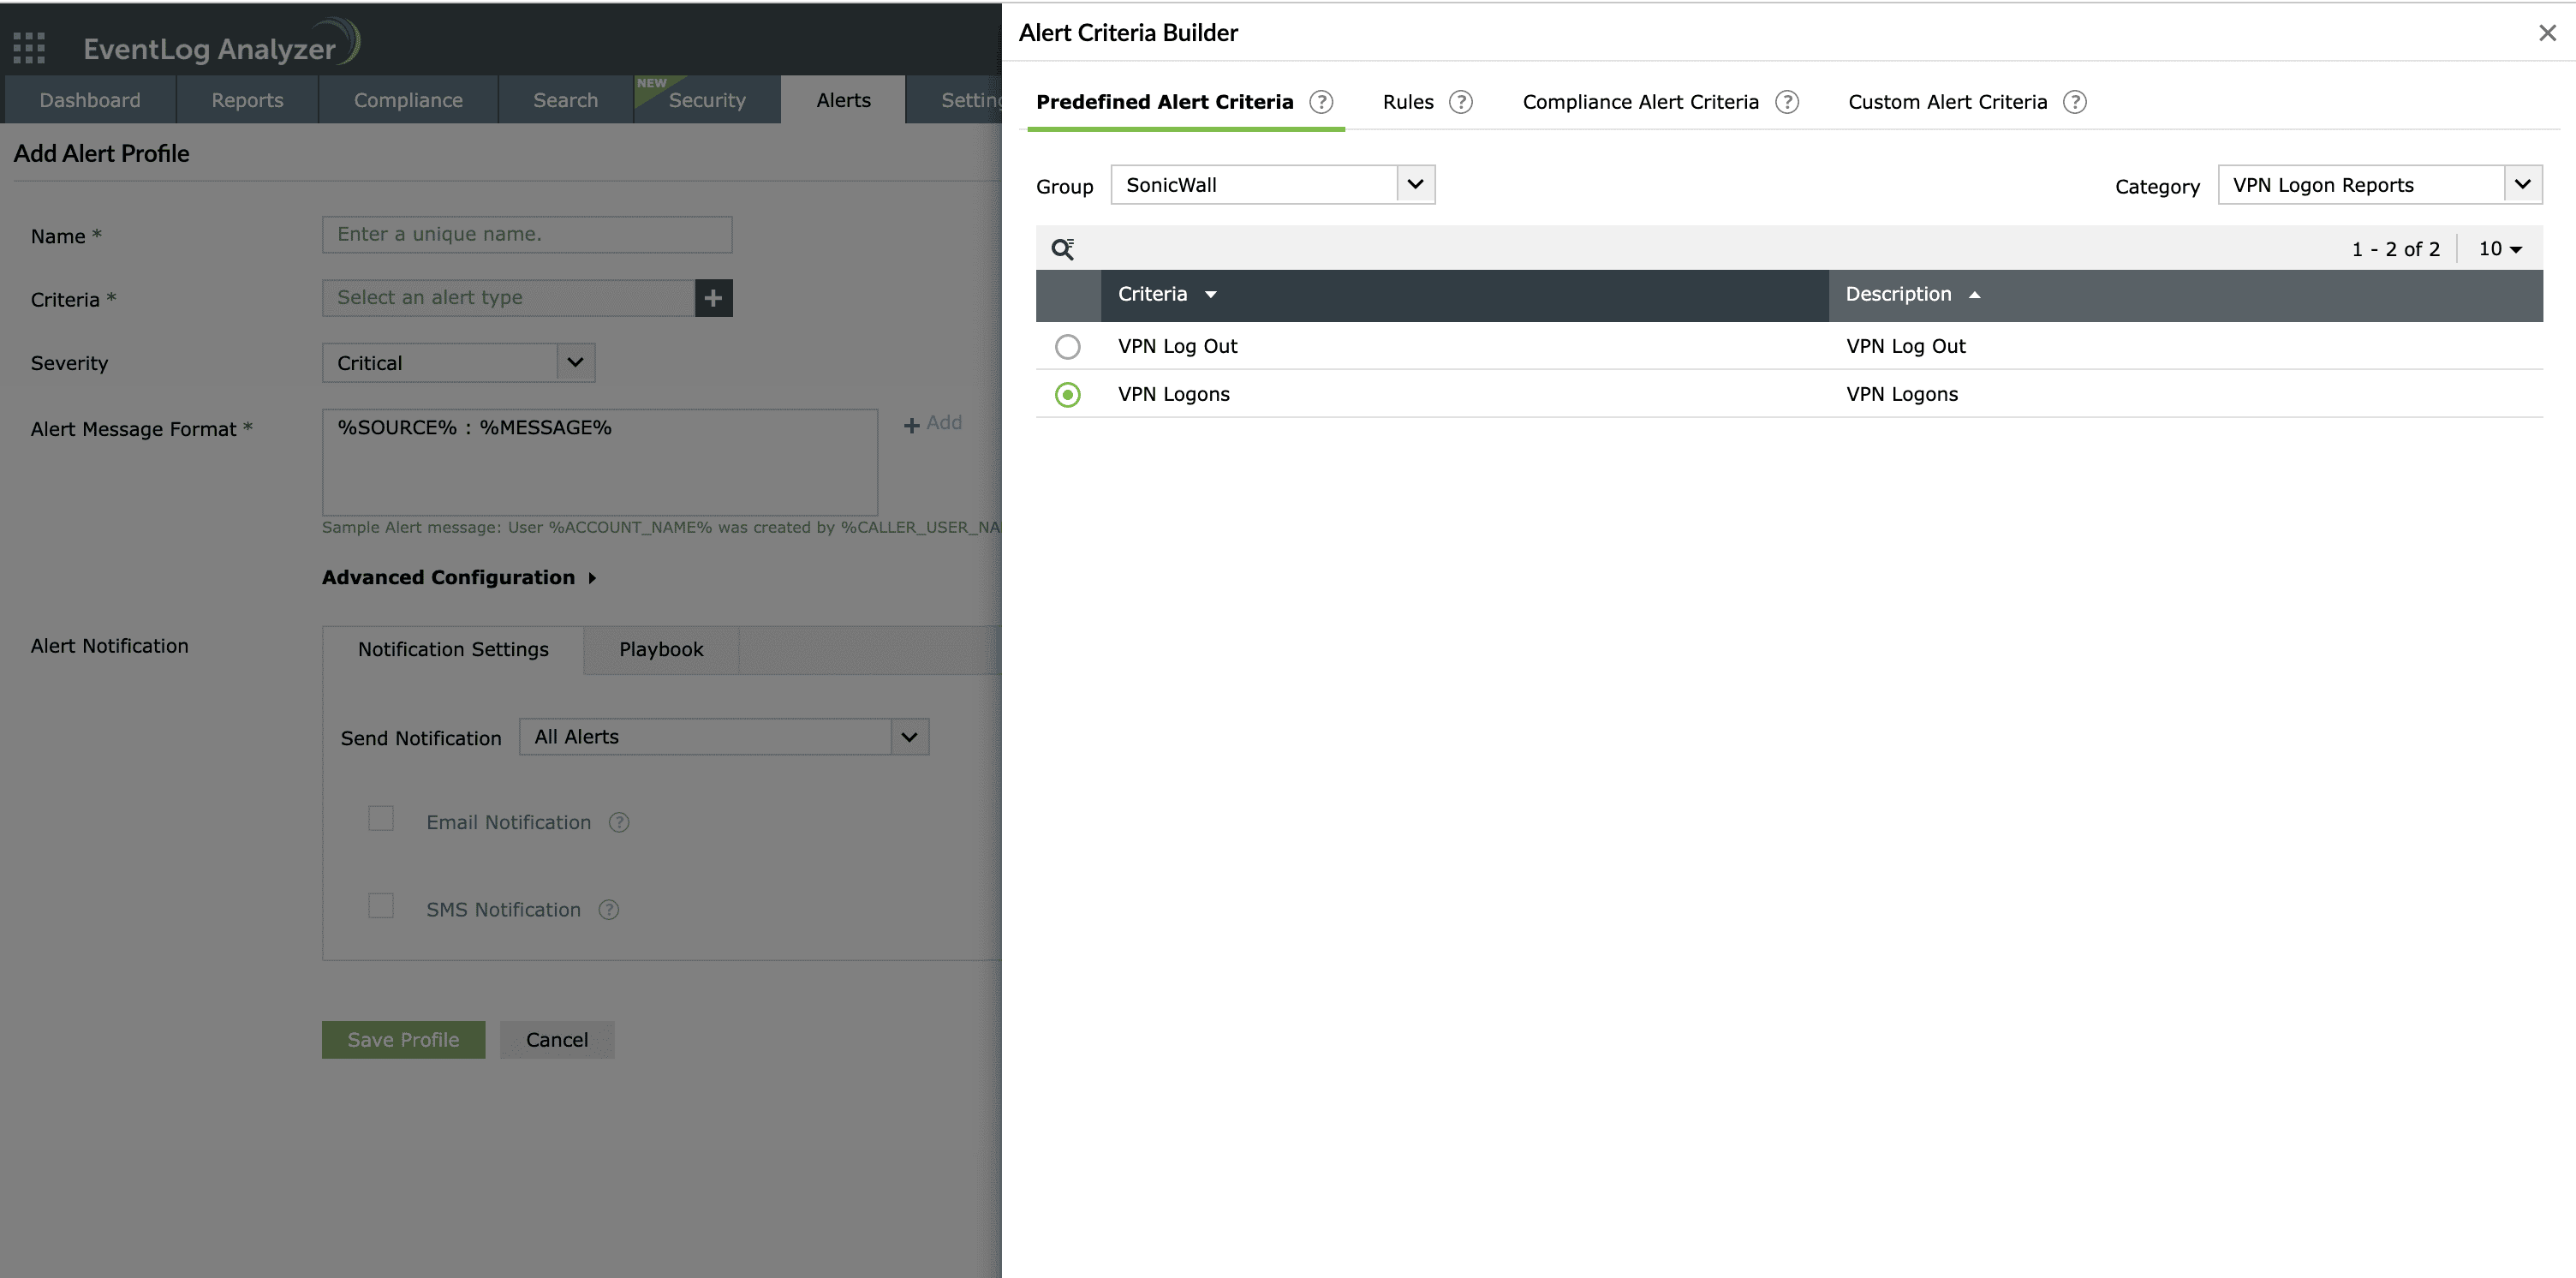
Figure 3: SonicWall VPN logon alert for active VPN access auditing
Network security monitoring for SonicWall firewalls
Firewall traffic isn't just about who got blocked. Most of the security-relevant signals live in what was allowed: which internal endpoints reached out to which external destinations, over which protocols, at which times, and how the pattern shifted week over week. EventLog Analyzer's Network Overview dashboard surfaces that signal at a glance.
The dashboard aggregates live event volume, top denied sources, top allowed destinations, protocol distribution, and severity-tagged event counts into a single view. Every panel is a link into the underlying data, click a spike on the event trend chart, and you land on the actual syslog messages behind it. Multiple SonicWall devices roll up into the same view, so a distributed firewall estate reads as one network rather than a set of isolated consoles.
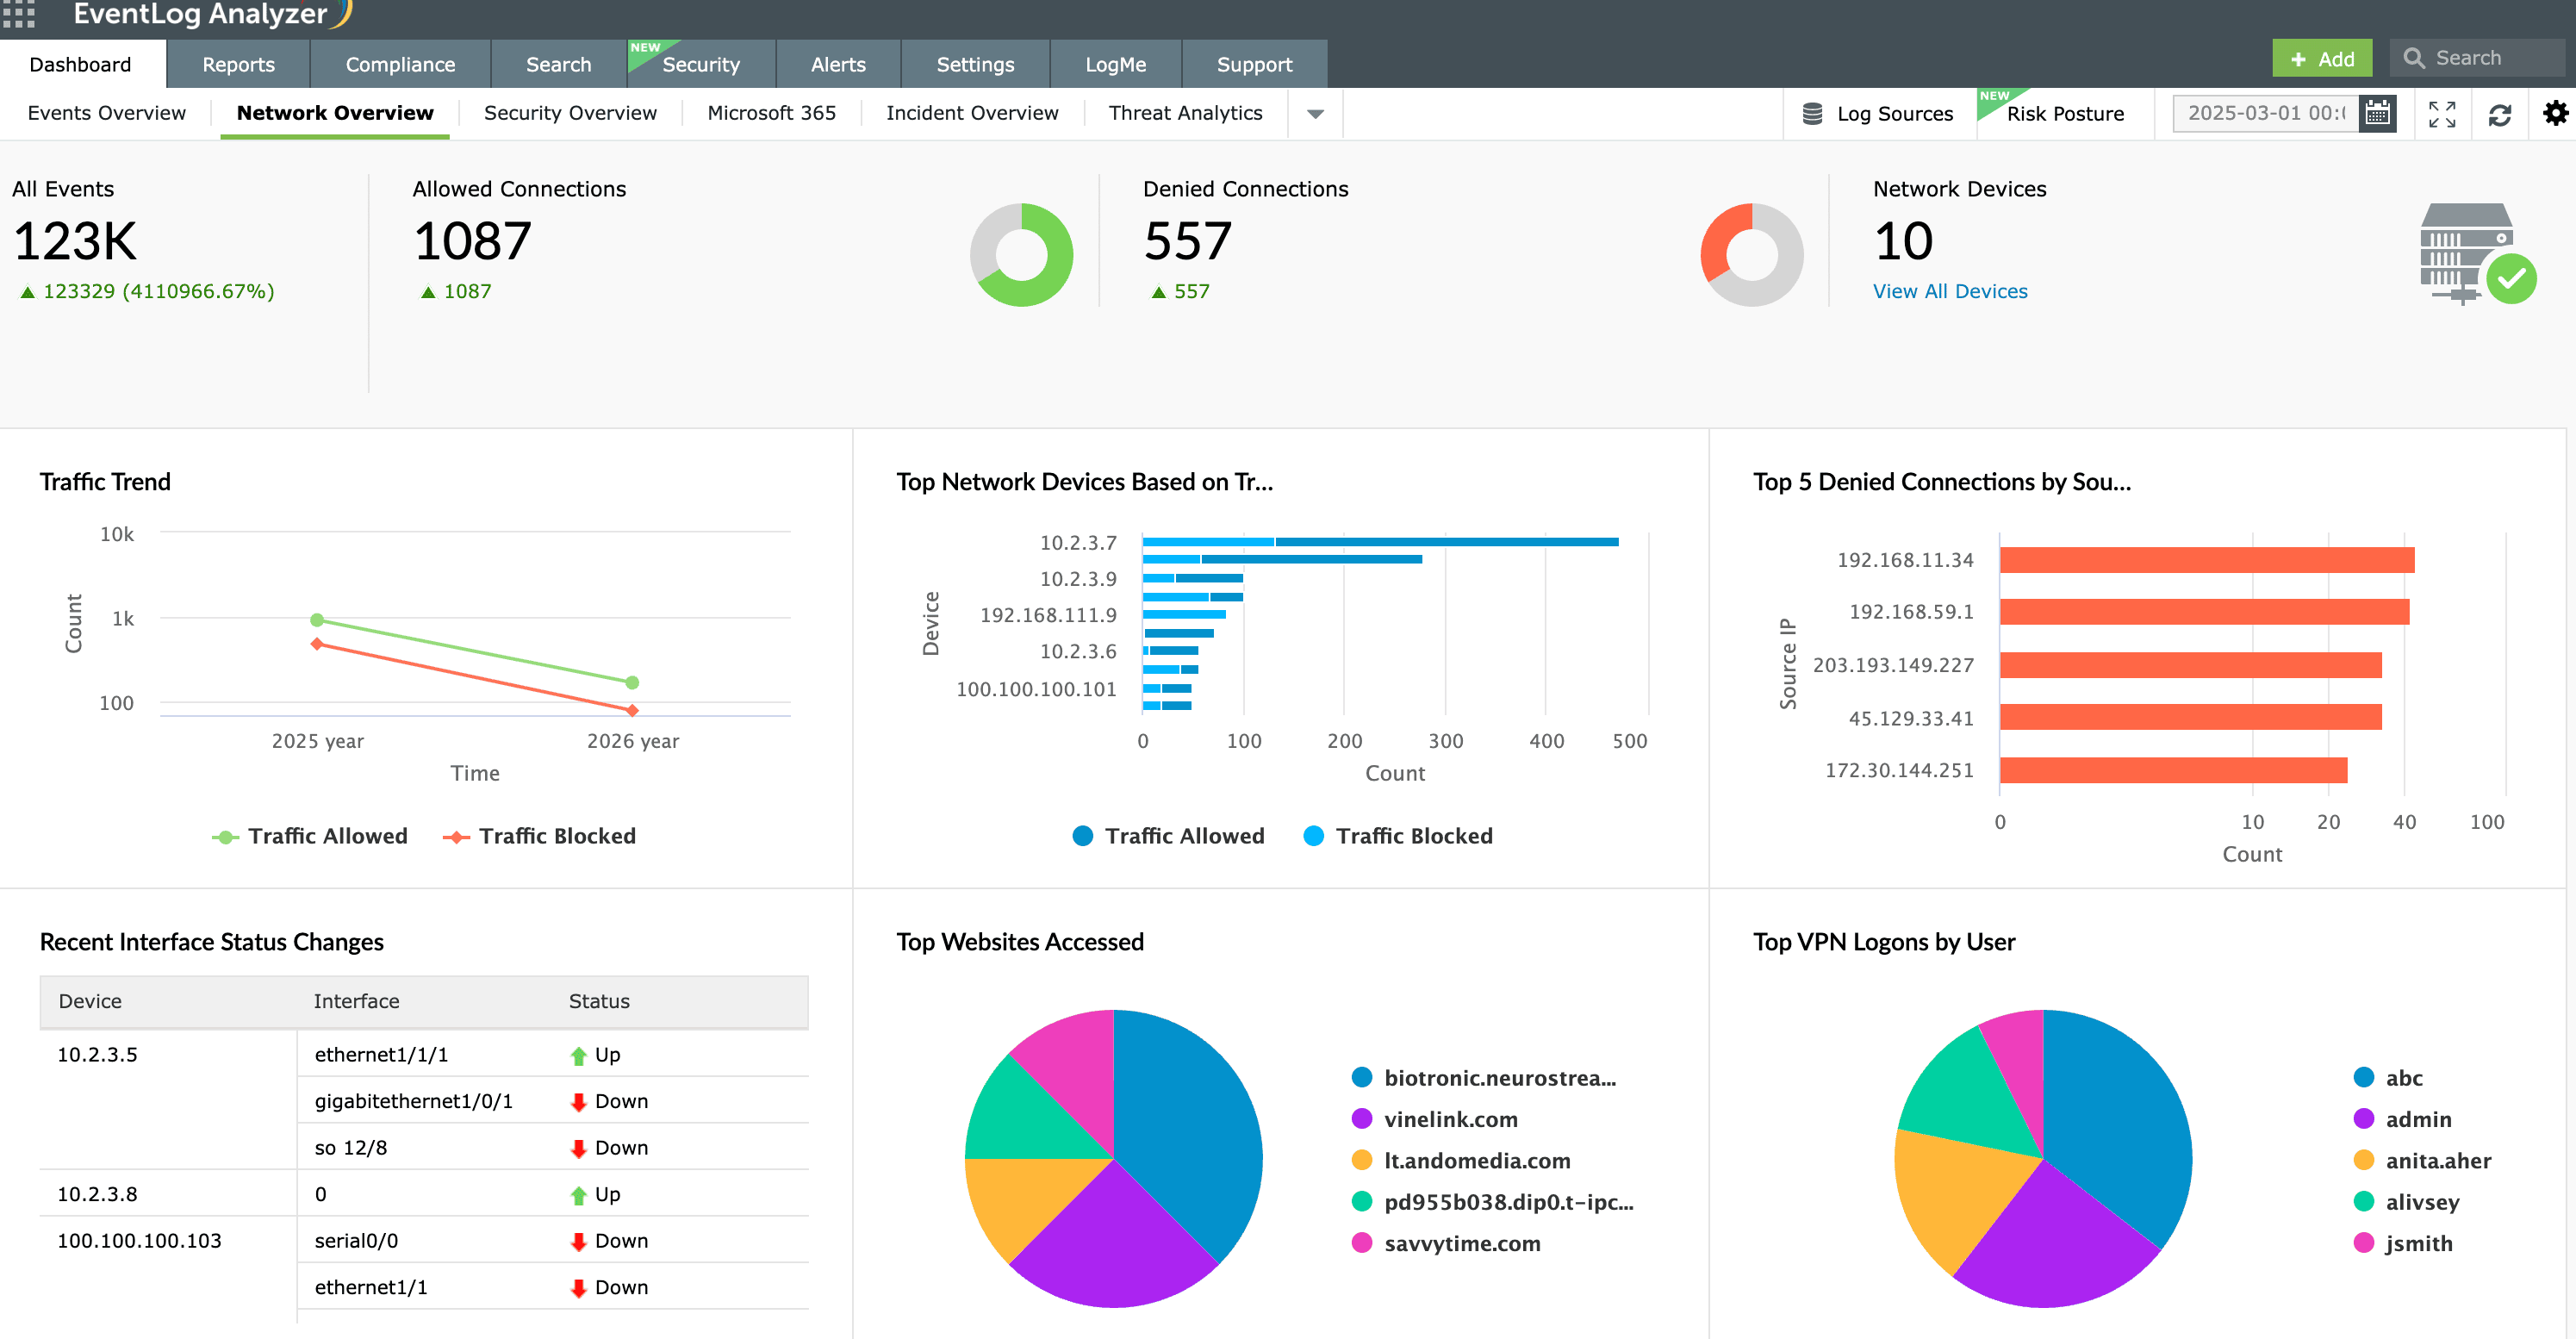
Figure 4: Network Overview dashboard showing top event categories, log volume trend, top denied sources, and top allowed destinations in SonicWall firewalls
Compliance reporting using SonicWall audit logs
Regulated environments need the reports the audit team asks for, not the ones vendors ship. For SonicWall, the predefined compliance report set already covers most common asks:
- PCI DSS: Firewall configuration change reports, denied traffic summaries, VPN access logs, and administrative account auditing map to Requirements 1, 7, 8, and 10.
- HIPAA: Access controls, audit trail reports, and integrity monitoring outputs support §164.308 and §164.312 evidence needs.
- SOX: Administrator activity, configuration change, and privileged user reports address IT general controls.
- ISO 27001: Access management, network security, and operations security control reporting
- GDPR: Data-flow visibility and access logging that supports Article 30 recordkeeping.
For frameworks EventLog Analyzer doesn't ship templates for, the new Compliance Report Builder walks you through defining the report set for a new regulation from scratch: pick the log sources, define the events per control, group them by control family, and the resulting template behaves like a native compliance module.
Other features
SIEM
EventLog Analyzer offers log management, file integrity monitoring, and real-time event correlation capabilities in a single console that help meeting SIEM needs, combat security attacks, and prevent data breaches.
Windows event log monitoring
Analyze event log data to detect security events such as file/folder changes, registry changes, and more. Study DDoS, Flood, Syn, and Spoof attacks in detail with predefined reports.
Application log analysis
Analyze application log from IIS and Apache web servers, Oracle & MS SQL databases, DHCP Windows and Linux applications and more. Mitigate application security attacks with reports & real-time alerts.
Active Directory log monitoring
Monitor all types of log data from Active Directory infrastructure. Track failure incidents in real-time and build custom reports to monitor specific Active Directory events of your interest.
Privileged user monitoring
Monitor and track privileged user activities to meet PUMA requirements. Get out-of-the-box reports on critical activities such as logon failures, reason for logon failure, and more.
Log forensic analysis
Perform in-depth forensic analysis to backtrack attacks and identify the root cause of incidents. Save search queries as alert profile to mitigate future threats.