
In this page
Log360 Cloud empowers security teams to detect, assess, and receive alerts for unusual user and entity behavior. Its dashboard provides organized anomaly details, flexible watchlists to prioritize specific user and entity monitoring, and customizable notifications for efficient investigation. This section elaborates the dashboards of Log360 Cloud's UEBA for efficient anomaly investigation.
Anomaly insights can be viewed via.
Every anomalous user and entity is associated with a risk score. The risk score is calculated and presented based on the analysis performed up to that point in the dashboard.
Anomaly insights are presented in the form of three sub-tabs in the Home dashboard of Log360 Cloud. These are:

Image 1: Anomaly trends dashboard in ManageEngine Log360 Cloud
This dashboard provides an overall summary of all the anomalies detected within a selected time range. It includes:
Total number of anomalies identified for a specified time period.
Number of unique users whose activities have been monitored up until now for anomalies.
Number of entities whose activities have been monitored up until now for anomalies.
Lists the most recent anomaly events along with details like pattern, user, time, and confidence level.
When clicked on a recent anomaly card, the complete details of that particular anomaly can be accessed. These are divided into:
A visual representation of the count of anomalies over a specified period of time.
A visual representation of the count of anomalous users/entities categorized and spread across a risk score range.
A visual representation of the most frequent types of anomalous activities, such as logons, file modifications, or registry access, along with the frequency count.
A visual representation of the number of unique anomalous entities triggered anomalies on each day over a specified period of time
A concise tabular representation of anomalous activities categorized by the anomaly type- Time, Count, and Pattern based anomalies.

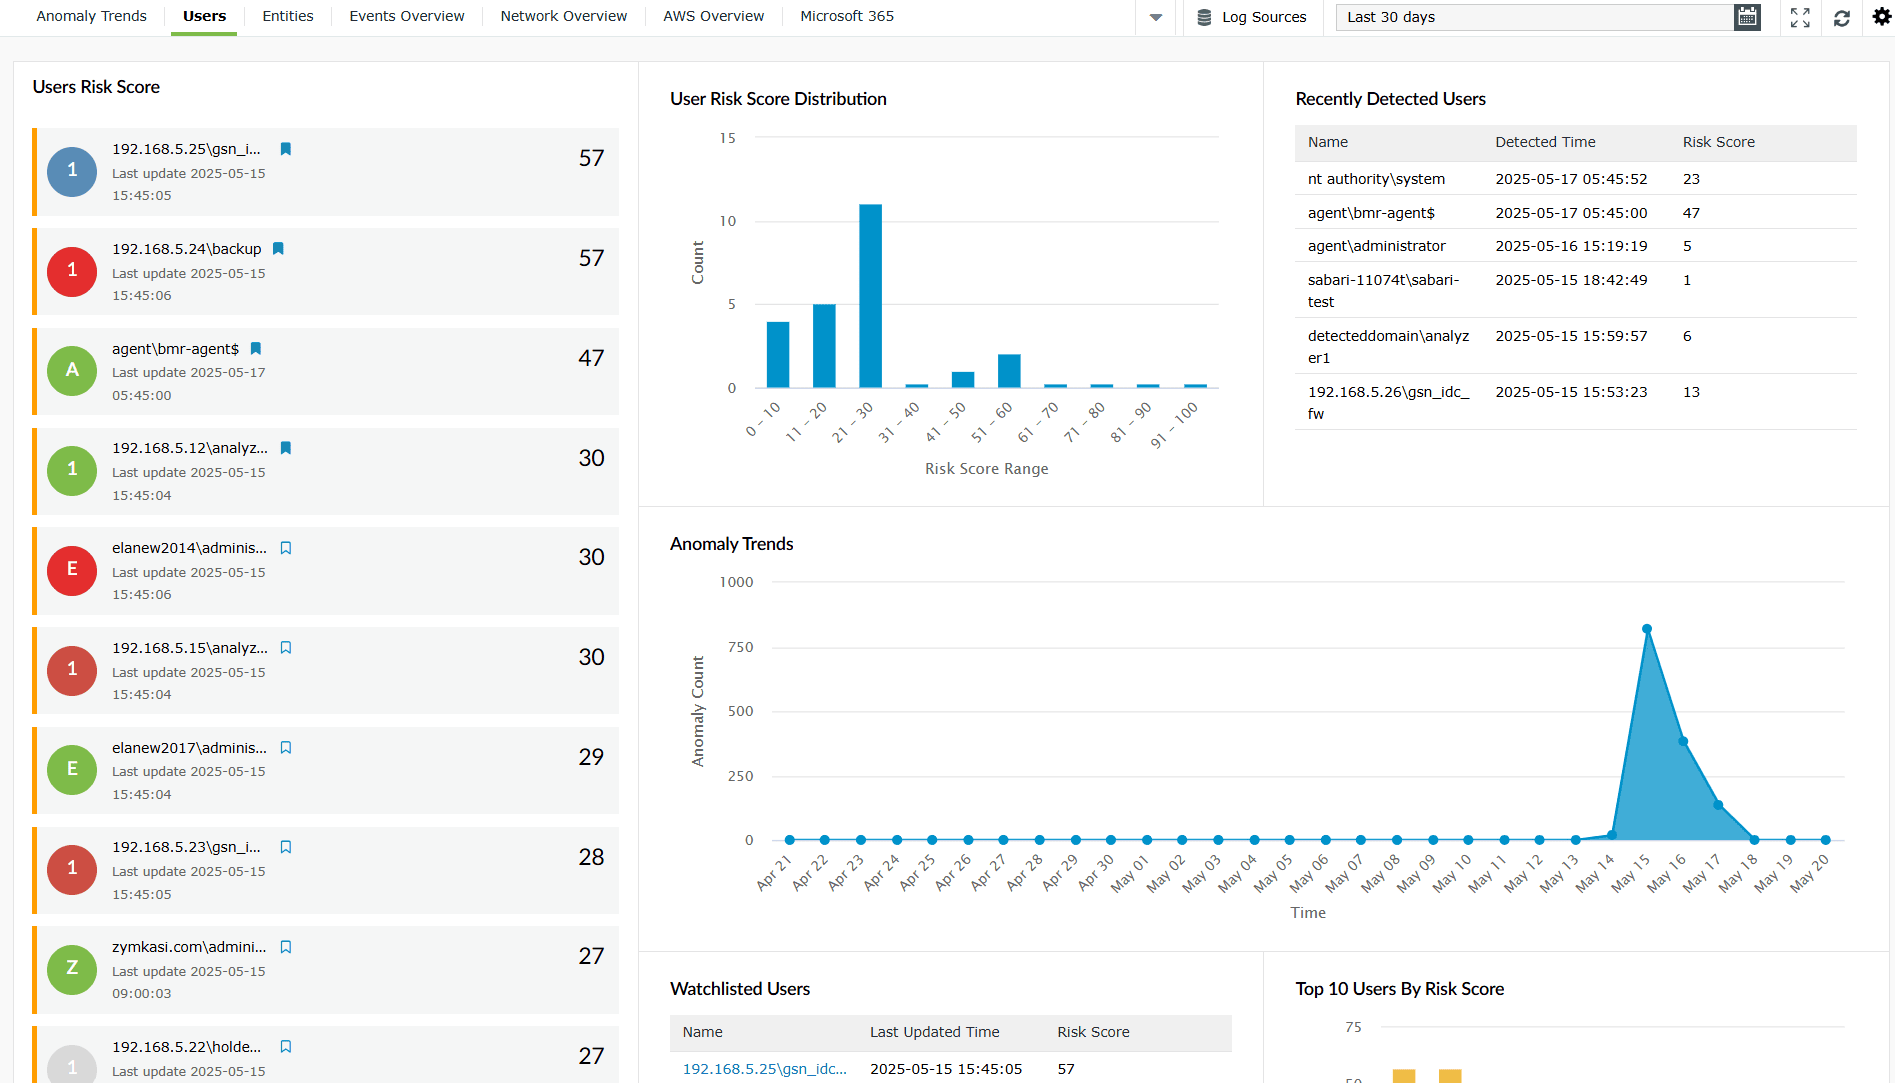
Image 2: Users dashboard in ManageEngine Log360 Cloud
Users dashboard under Home highlights anomalous behavior by individual users. This dashboard also displays users based on the risk score range, allowing you to focus on high-risk individuals first. The users dashboard helps prioritize investigation by displaying:
List of anomalous users ranked by their current risk scores based on their activities that are flagged as an anomaly. When clicked on any user from this widget, the user's anomaly card opens with the anomaly trend on the top followed by a table listing the anomalies contributing to the risk score of the particular user. Clicking on any anomaly message from the table provides Anomaly Details divided into:
A visual representation of the count of anomalous users categorized and spread across a risk score range.
List of anomalous users who recently triggered anomalies, along with timestamps and their respective risk scores.
A visual representation of the count of users' specific anomalies spread across a specified period of time.
List of the anomalous users manually flagged for closer monitoring in the form of watchlists.
Anomalous users with the highest accumulated risk scores ranked by the same.

Image 3: Entities dashboard in ManageEngine Log360 Cloud
The Entities dashboard under Home is similar to the Users dashboard, but focused on machines and other network assets. It includes:
List of anomalous entities ranked by their current risk scores based on their activities that are flagged as anomaly. When clicked on any entity from this widget, the entity's anomaly card opens with the anomaly trend on the top followed by a table listing the anomalies contributing to the risk score of the particular entity. Clicking on any anomaly message from the table provides Anomaly Details divided into:
Contains details that will tell about the deviation which has occurred from the generally expected behavior.
These are shown for applicable anomaly types and contain finer details like the anomaly rule associated, time and details of the event, user details and log sources related to this anomaly, and a message that elaborates the trigger event that flagged the anomaly.
A visual representation of the count of anomalous entities categorized and spread across a risk score range.
List of anomalous entities who recently triggered anomalies, along with timestamps and their respective risk scores.
A visual representation of the count of entities specific anomalies spread across a specified period of time.
List of the anomalous entities manually flagged for closer monitoring in the form of watchlists.
Anomalous entities with the highest accumulated risk scores ranked by the same.
Read also
This document explained in detail about the dashboards provided for the anomaly detection feature of Log360 Cloud's UEBA. For leveraging the capabilities of UEBA, refer the below articles: