Log360 UEBA offers comprehensive reports that can help identify anomalies in activity of devices, databases, and more. Each anomaly can be classified as time-based, count-based and pattern-based. In addition to this, anomalies can be analyzed for users and systems separately.
| Option | Event Sources | Anomaly Reports |
|---|---|---|
| Devices | Windows devices |
|
| Unix devices |
|
|
| Routers |
|
|
| Applications | Active Directory auditing |
|
| Microsoft SQL Servers |
|
|
| FTP servers |
|
|
| Firewall Devices | - |
|
| Cloud Services | Azure |
|
| AWS |
|
|
|
Anomaly reports can be generated for the following:
In addition to the above, Log360 UEBA also detects anomalies in privileged access by integrating tightly with ManageEngine PAM360, a comprehensive privileged access management solution.
For every report, Log360 UEBA gives Dynamic Peer Group Details. This will give information about the different peer group clusters and the members who are part of those clusters. Peer groups are built for both users and entities.
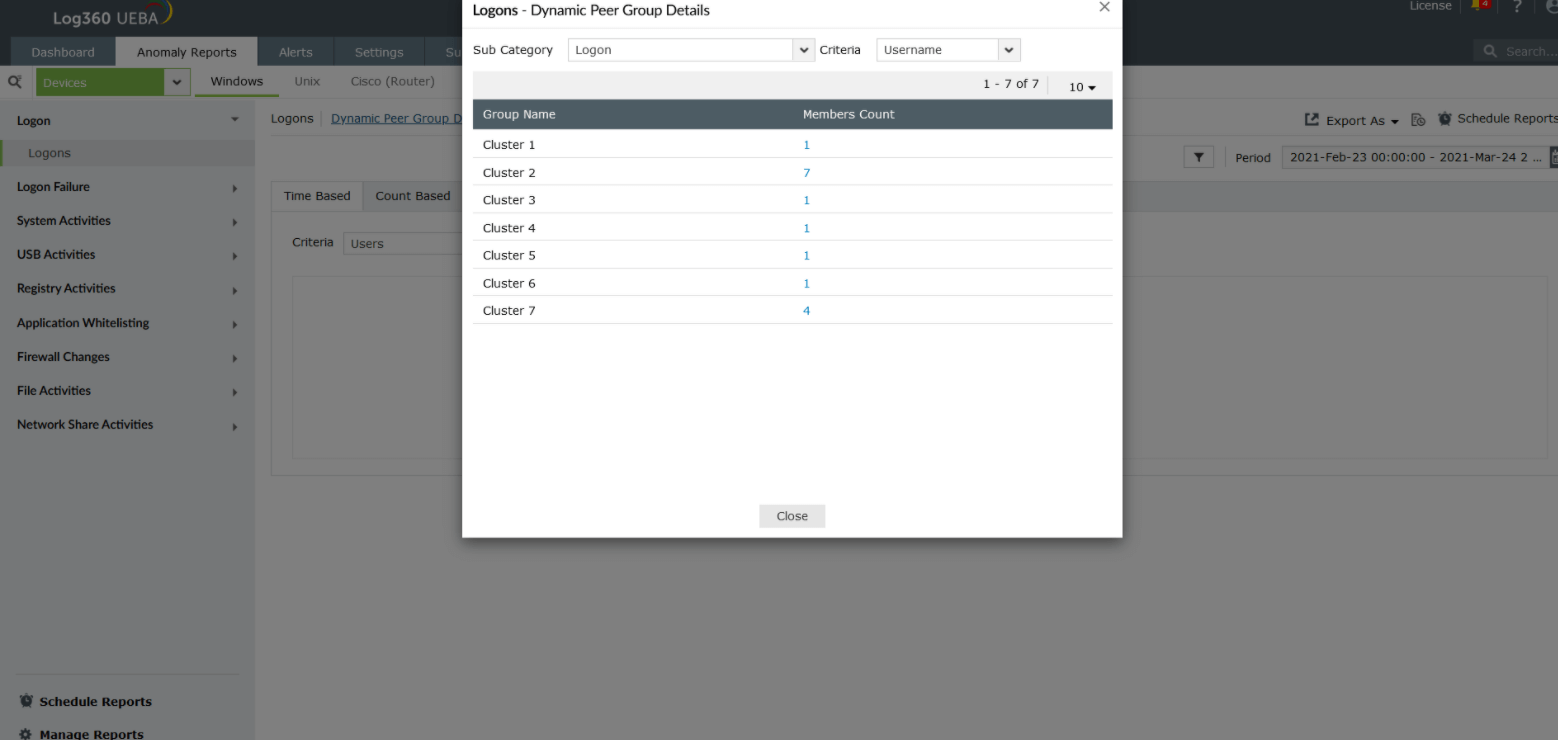 An example of peer grouping for logon anomalies based on users
Anomalies can be tracked for both users or entities (machines). Furthermore, anomalies can be:
 Sample time-based anomalies for Windows logons
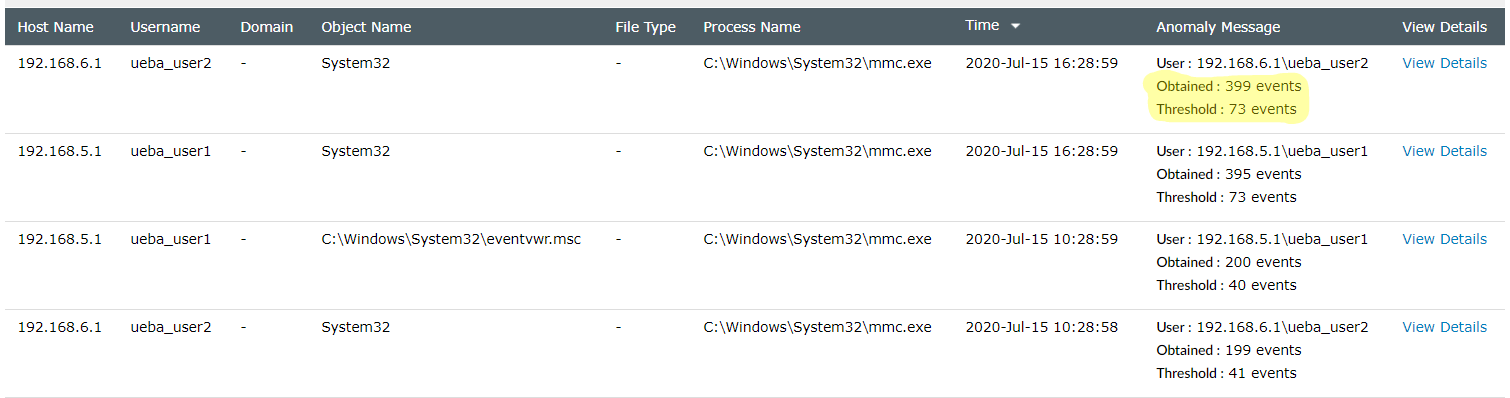 Sample count-based anomalies for file modifications
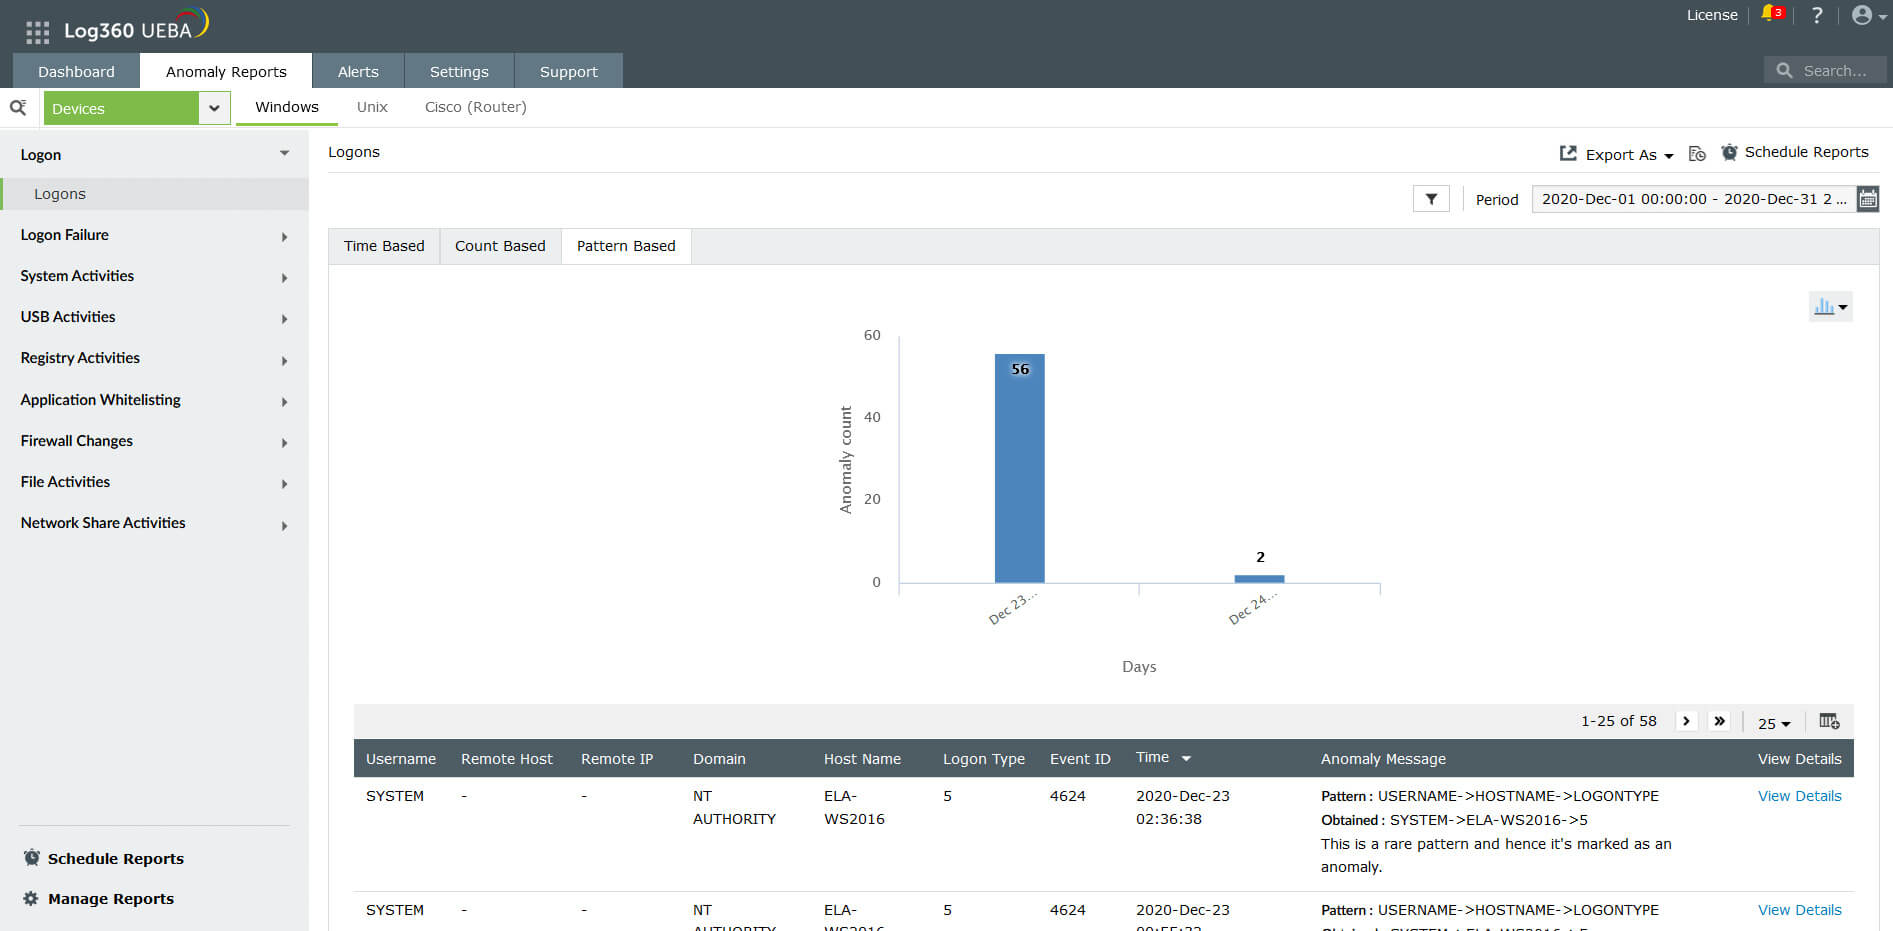
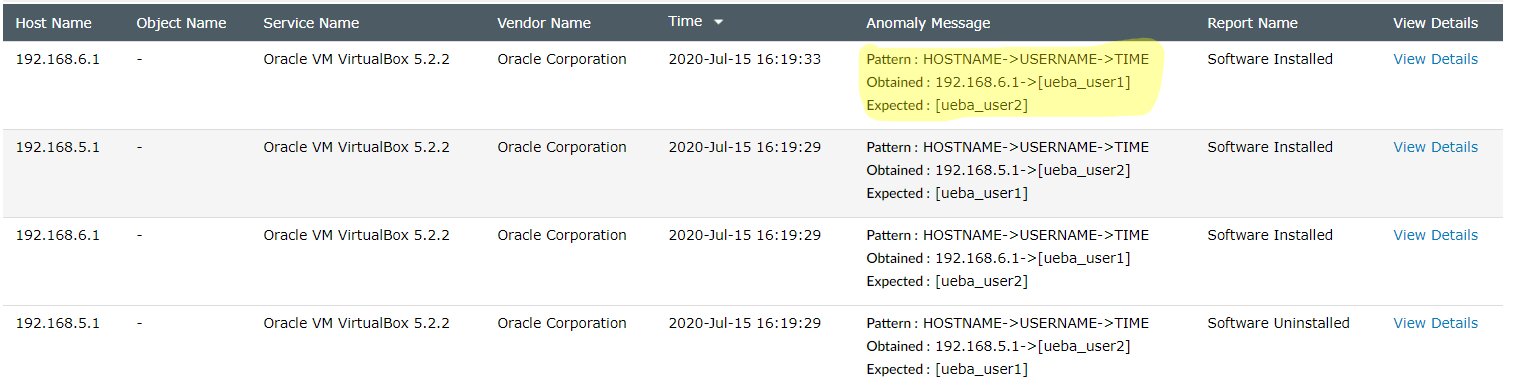 Sample pattern-based anomalies for software installation
 Sample first time access-based anomalies
Anomaly visualization enables administrators to view a graphical representation of every analyzed anomaly. It shows how far the observed values are from the expected values.
To visualize anomalies:
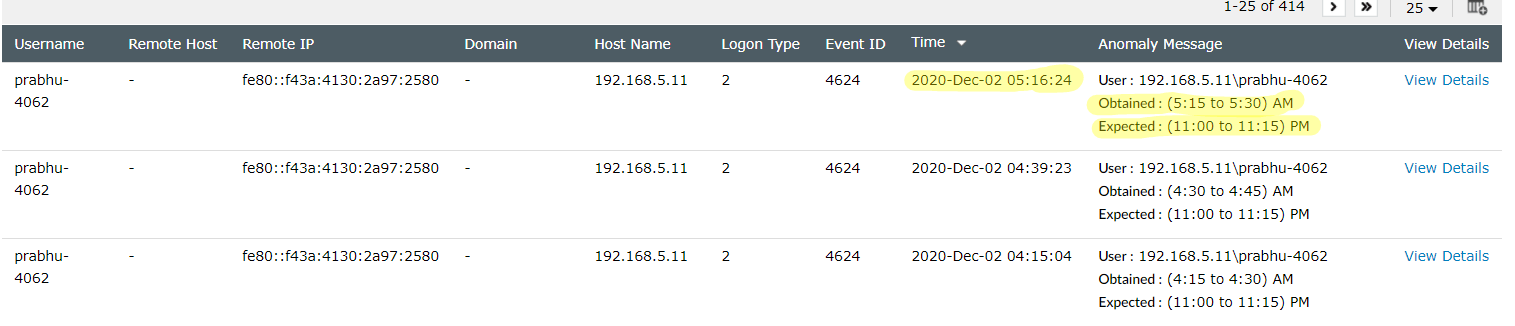
Here is a sample anomaly visualization chart for a time anomaly. In this example, a particular user has an expected logon time between 11 and 11:15 pm, but shows an actual logon time between 5:15 and 5:30 am.
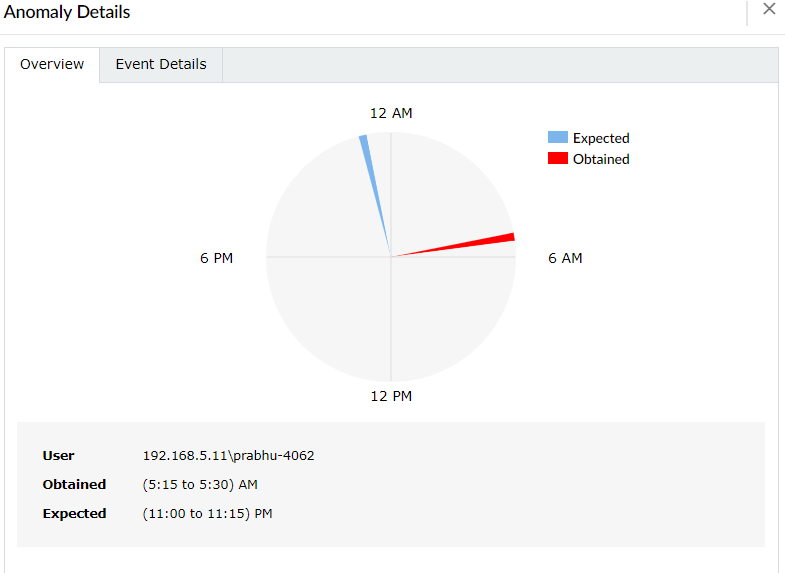 Anomaly visualization for a logon time anomaly
Here is a sample anomaly visualization chart for a count anomalies. In this example, 1383 file deletes have been observed on the host Log360QA-W12-2, while the threshold is only 1033 such activities.
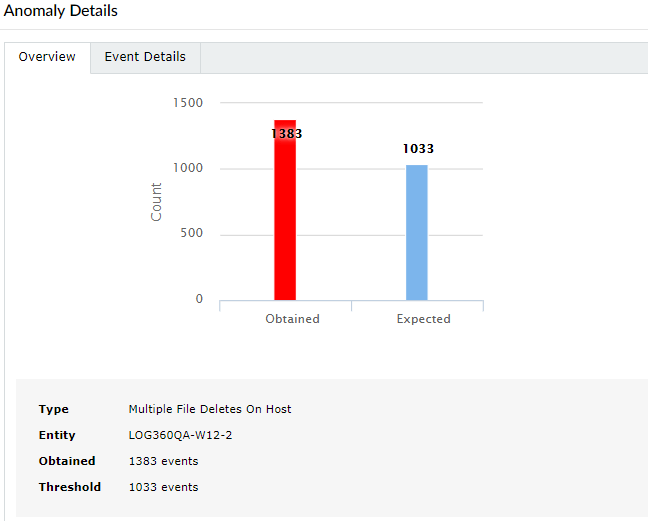 Anomaly visualization for a count anomaly
Log360 UEBA also provides anomaly visualization charts for pattern anomalies. In the example below, the user DWM-3 is logging onto the host itsl360-2k12-1 with an interactive logon (logon Type 2). This is identified as a rare pattern and is marked as an anomaly.
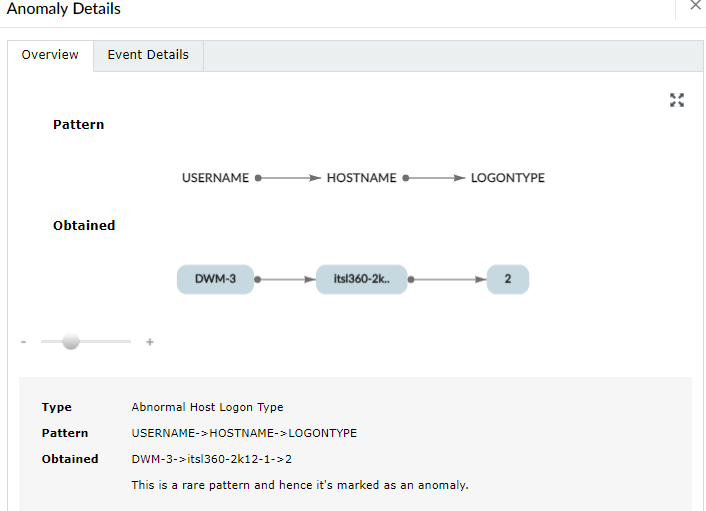 Anomaly visualization for a pattern anomaly
Peer group details: For time, count and pattern anomalies, Log360 UEBA will also give information about a user's or entity's peer behavior. In case the user or entity under consideration has a peer who exhibits similar behavior, there will be a downward impact on the confidence level of the anomaly. This risk score will also then be adjusted downward. This helps to decrease the occurrence of false positives and improves the security context.
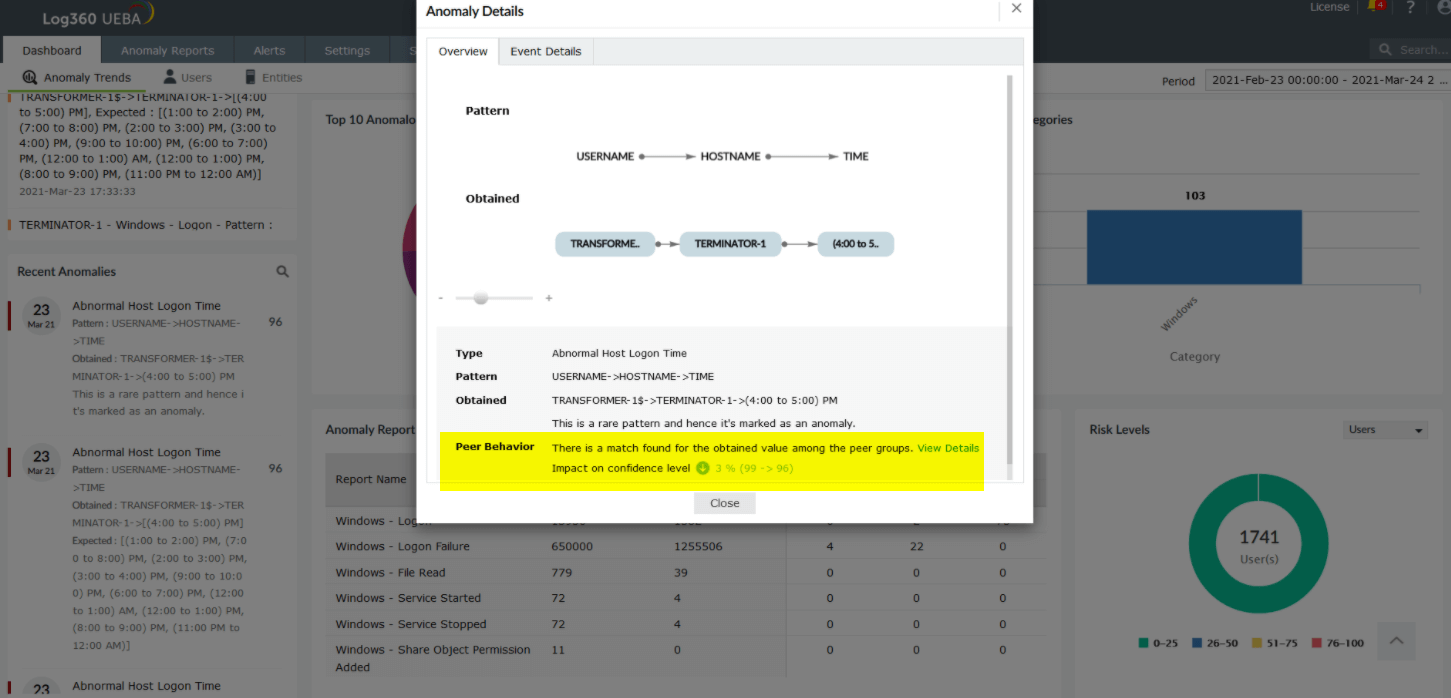 Peer Behavior information under Anomaly Details