Applications Manager Plug-in
The Application Manager (APM) Plugin in OpManager helps businesses keep track over the performance of critical applications ensuring high availability. With the APM plugin, you can monitor your application servers such as Tomcat, Oracle and Websphere. You can also track the performance of databases, containers, cloud applications, end-user services such as mail in a centralized console. The OpManager-APM plugin combination offers an integrated network-application monitoring solution.
How to download and install APM plugin
- You can download the APM plugin from OpManager UI (Navigate to Settings-> General Settings -> Third Party Integrations).
- Click on Configure Application Manager Plugin and download the file.
- Check our installation guide to know the steps to install Applications Monitoring plug-in.
Prerequiste: Please ensure that the compatible version of APM plugin is installed in OpManager.
Discovering monitors in APM plugin
Once you download and install the Application Manager plugin, you will be able to access in depth application monitoring data in OpManager's console. The Applications tab provides detailed insights on the list of applications monitored, the associated monitors, the cloud applications supported in your network environment, alarms raised and reports generated for application monitoring.
Monitors refer to applications, servers or services that are monitored. Discovering monitors using APM plugin can be done using the auto-discovery or the manual method.
After the discovery process, you will be able to view the list of monitors under the Home tab.
Users can also get a unified view of application monitoring data under the following tabs in OpManager:
- Inventory
- Virtualization
- Dashboard
- Alarms
- Notifications
- Reports
- Business Views
- Application Manager KPI in Device Snapshot
- APM Plug-in's Self Monitoring
- Groups
- Organization Map
Inventory
The Inventory tab provides a comprehensive list of devices and interfaces monitored in OpManager. From OpManager versions 126167, a separate a sub tab for applications under Inventory has been introduced to display all applications discovered in OpManager using the APM plugin. (Inventory --> Applications).

This tab classifies the application monitoring data and gives the list of applications with their availability status, category, discovered time etc.
Virtualization
Containers are widely used in today's world as they are lighter, easier to deploy from one environment to other and enable faster service delivery. Tracking the performance of containers is vital to ensure the health of applications.
With the APM plugin you can monitor the containers that are extensively used such as Kubernetes, OpenShift and Docker.
Under the virtualization tab,a separate tab exclusively for monitoring your containers is provided, it lists down the containers discovered in OpManager.
You can discover new containers using the Add Container option available at the top right corner. It takes you to a dedicated page for Container Discovery, where you can specify the details, choose the vendor (Kubernetes/ OpenShift/Docker) and add it into OpManager with just few clicks.

Application monitoring widgets in Dashboard
OpManager's Dashboard provides a consolidated picture of your entire network health with the help of customizable widgets. The APM widgets can be viewed only by users who have downloaded and installed the APM plugin. To view application monitoring widgets, you have to create a custom dashboard and then select the required Application Widgets.

List of supported APM widgets:
- Application Monitors Summary: Gives you the performance of the applications based on key metrics.
- Application Monitors Status: Gives you an overview status of the application monitors.
- Application Health and Availability: Provides the health and availability status of applications.
- Application Monitors HeatMap: Gives you a heat map analysis of the applications performance.
- Application Monitor Groups Summary: Provides the status of the application groups.
- Application Monitor Groups Tree view: Provides the tree view status of the application groups.
- Application Monitors Health Summary: Provides a consolidated view of the availability, health and severity status of all application monitors.
- Application Performance Metrics: Provides monitored data for selected application monitors in multiple graphical formats over a chosen time period.

Alarms
Alarms are used to alert the user whenever a given threshold condition is violated. For APM plugin, by default the supported severity levels are Critical, Warning (indicated as Trouble in OpManager's UI) and Clear. Users can specify values for each severity level, and whenever the actual value crosses the specified value, an alarm will be generated. Alarms help you proactively address issues before they go out of hand.
All alarms raised for application events can be synced with OpManager using the Sync All Alarms option in Application Manager plugin page (Settings--> General Settings--> Third party integrations). Once this sync option is enabled all APM related alarms can be viewed under the All Alarms tab.

Also, a dedicated tab for Application alarms is available under the Alarms view to list down only the APM alarms.

Notifications
Applications manager allows users to send alerts via various channels like sending e-mail, SMS, trap, and executing a command, to notify the customer about any alarm generated while monitoring applications. This helps fault detection and rectification much easier, thereby ensuring high uptime.
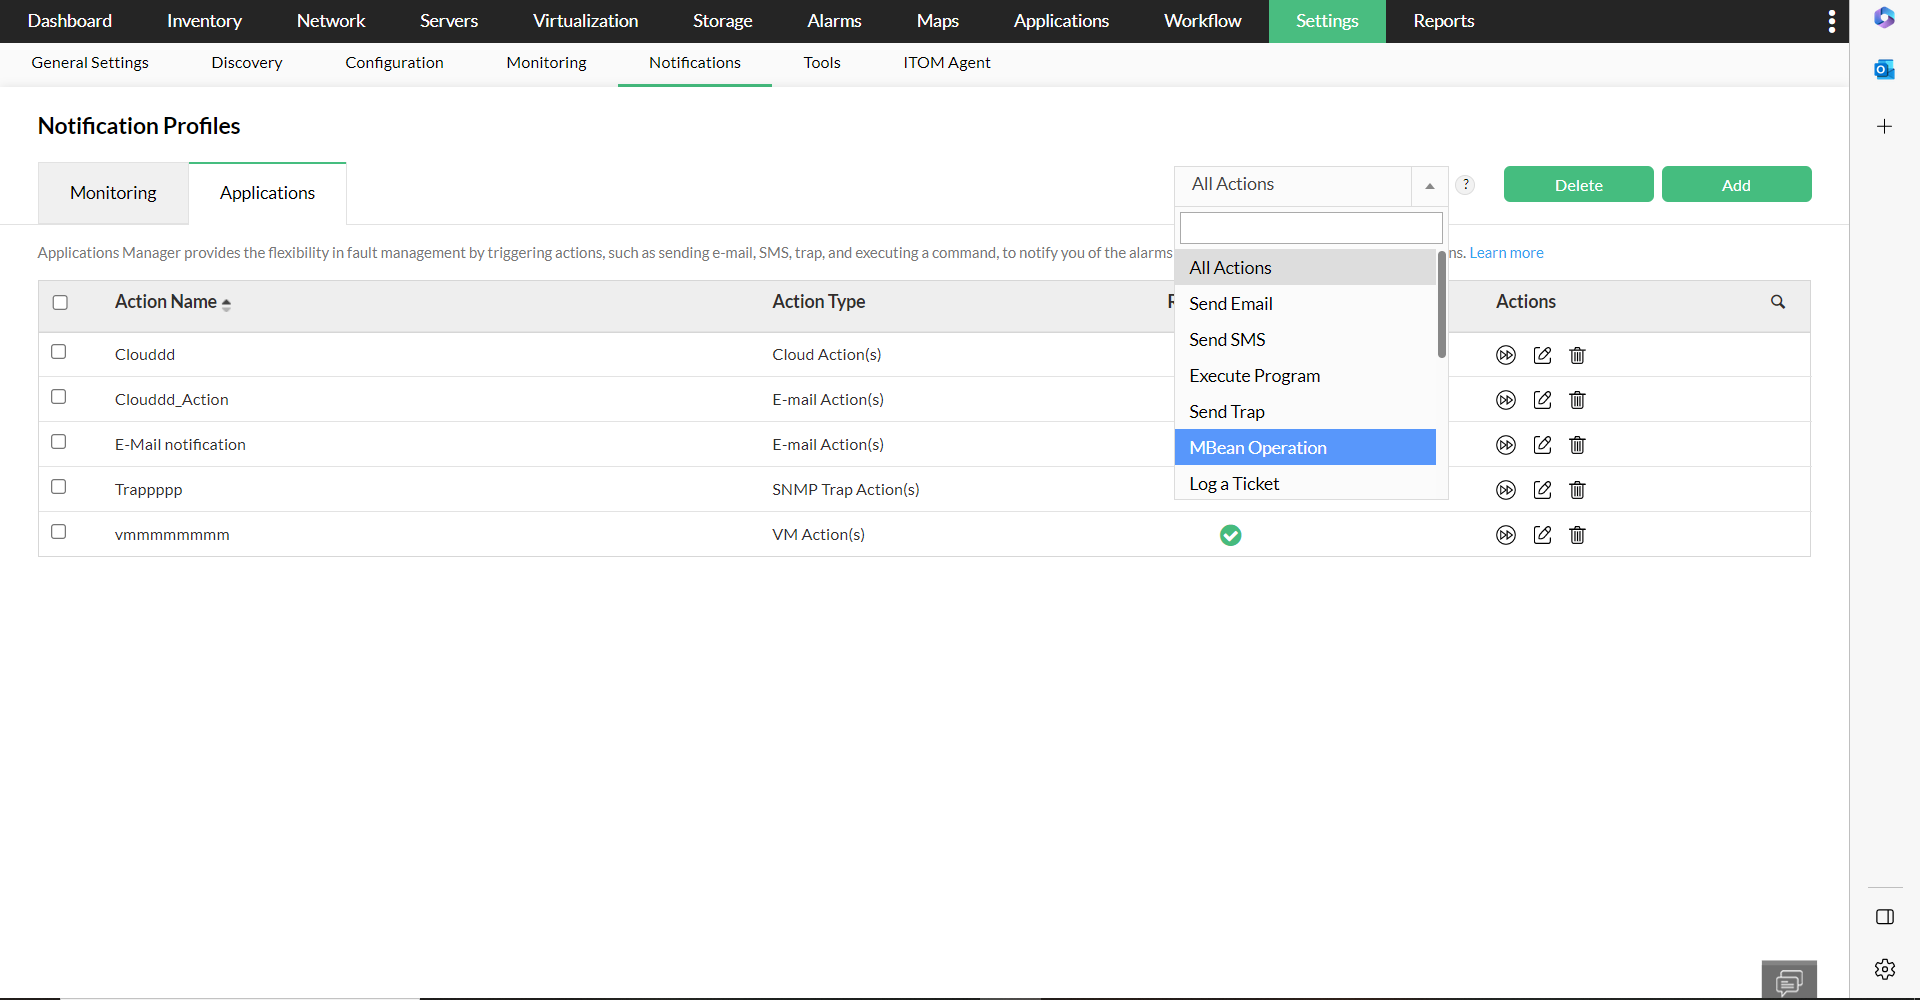
Also, a dedicated tab for Application Actions is available under Settings->Notifications->Notification Profiles->Applications in OpManager. In this page, you can view the list of all actions, and further execute, add, edit or delete them.
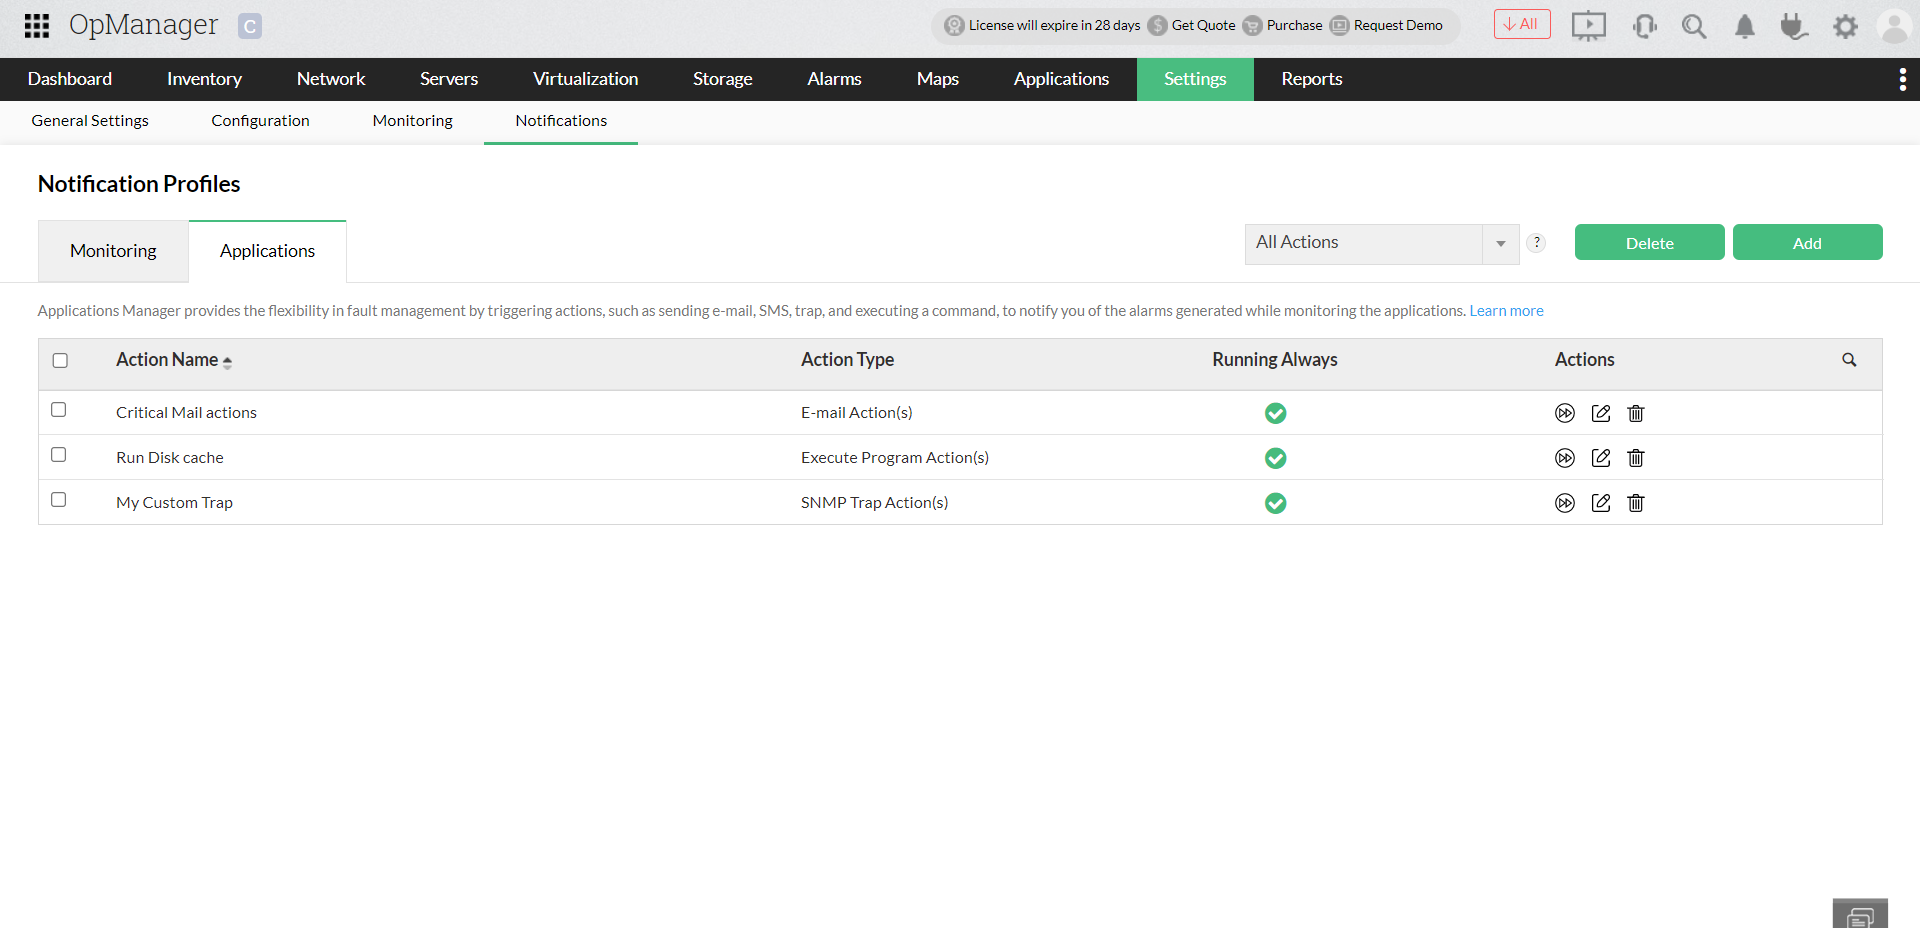
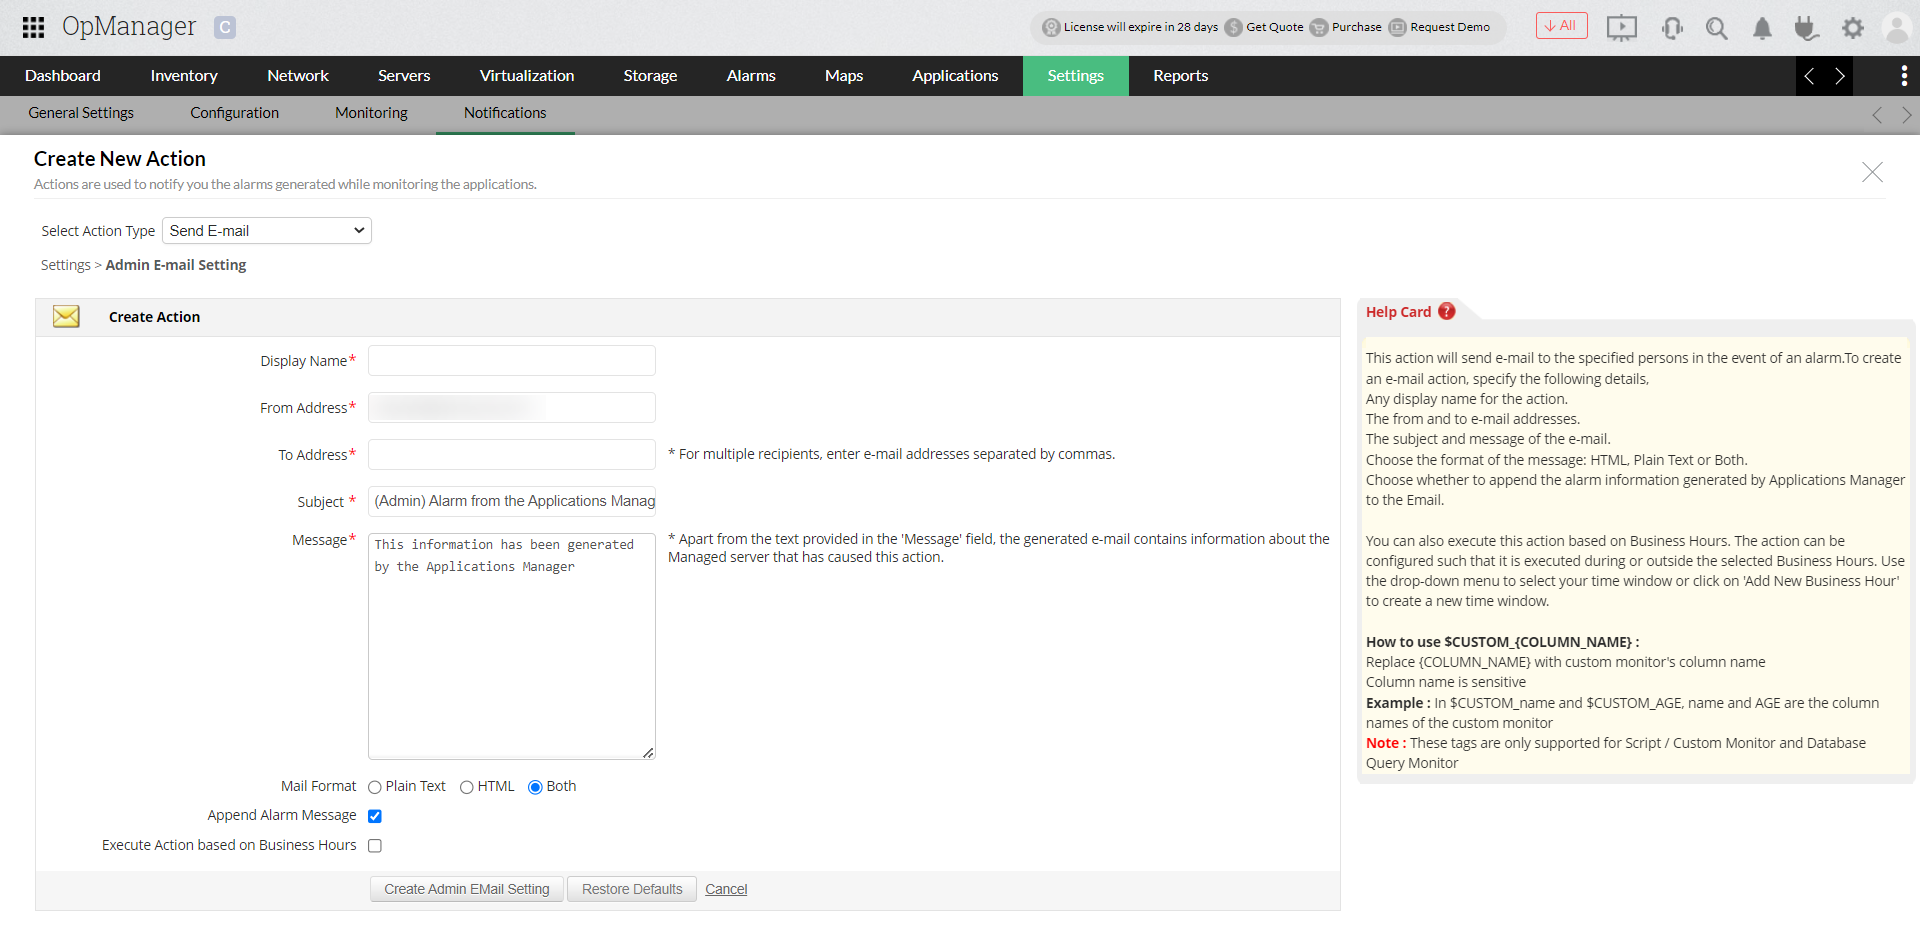
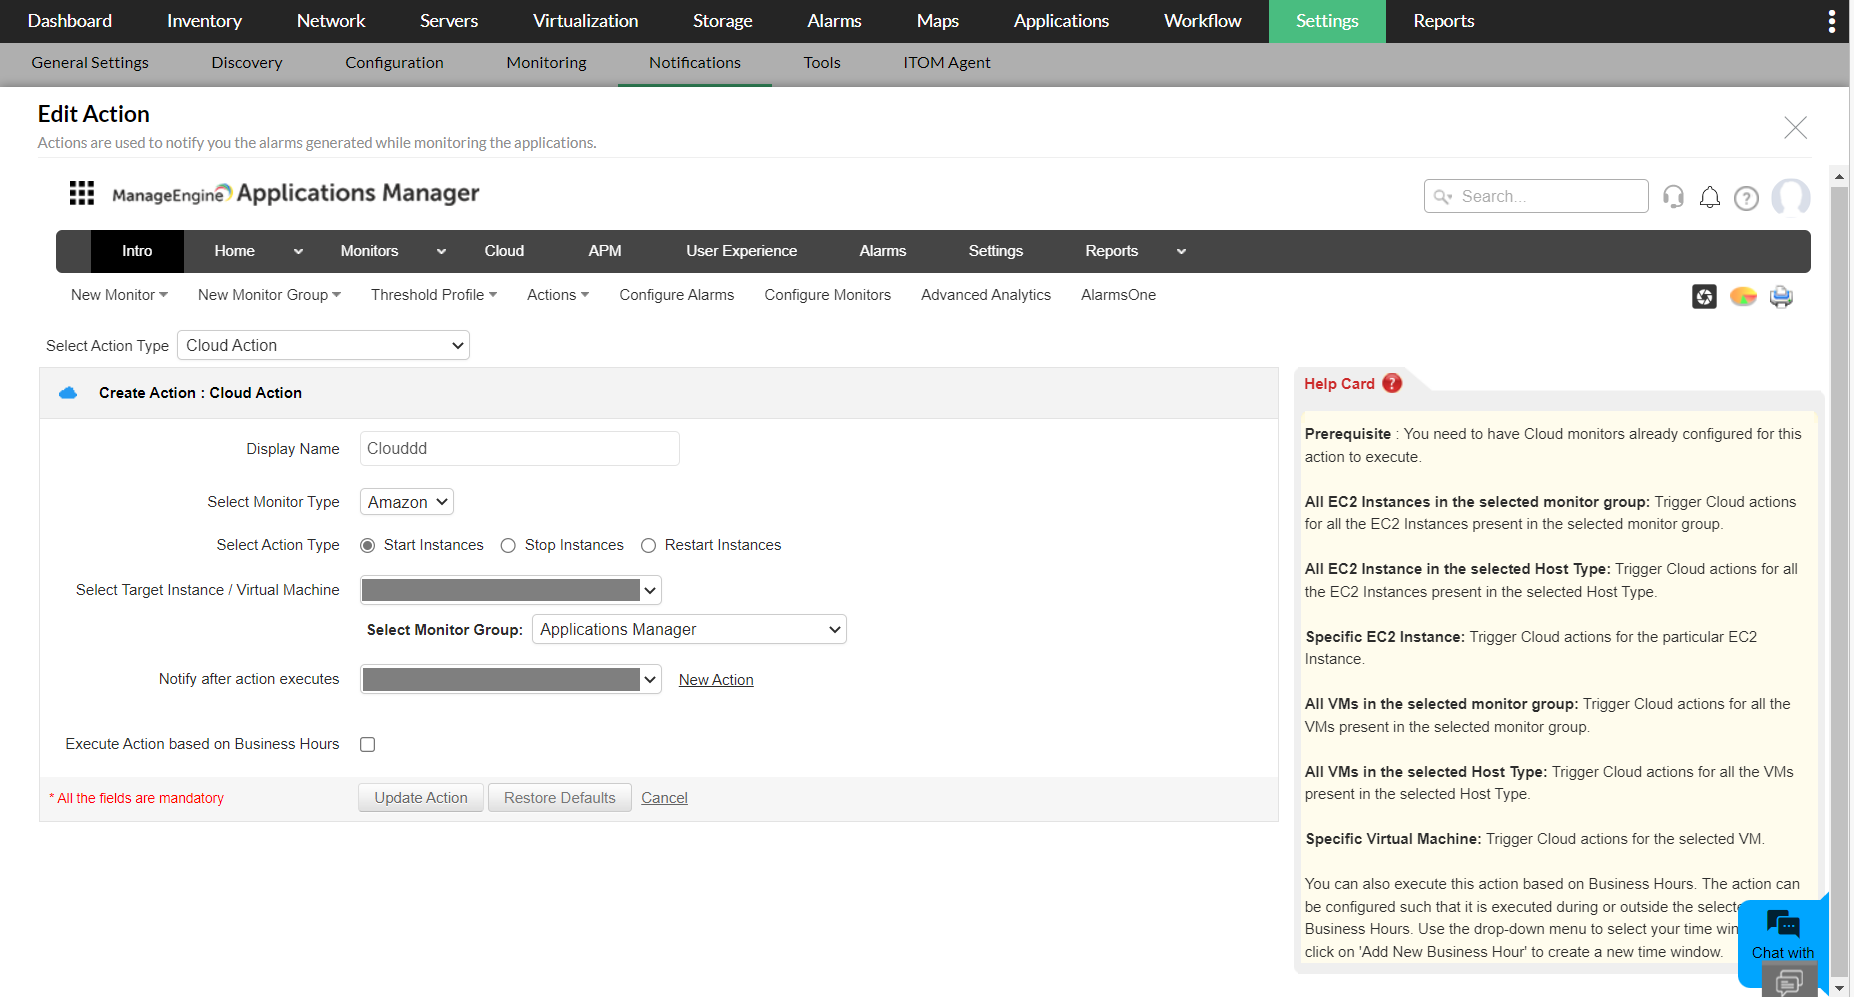
You can add new actions using the Add option available at the top right corner. It takes you to a dedicated page for creating new actions, where you can specify the details, and add it. Learn More.
APM plugin data under Reports
All users who have installed APM plugin will be able to view Application monitoring reports. The APM reports are categorized further such as Application Servers, Cloud apps, Converged infrastructure, mail servers and more.

Application monitors in advanced reports
You can now create custom reports that cover APM plugin monitoring data using the advanced reports feature. (This feature will be available only if for customers who have downloaded and enabled APM plugin in OpManager). While creating a new report you can select the Applications module to display the monitors associated with application monitoring data.

Then you can follow a similar procedure for creating an advanced report to create a new report with applications data. You can also schedule this report and receive it at regular intervals via email.
Business View with Application Monitors
OpManager's Business View was originally intended to give you a high-level view of your network architecture, for easier incident management and efficient troubleshooting. Following an update to v128168, OpManager allows you to add monitors from the Applications Manager Plug-in, to OpManager's business view. This will give you a graphical representation of the applications monitors that are configured in OpManager (via APM plug-in).
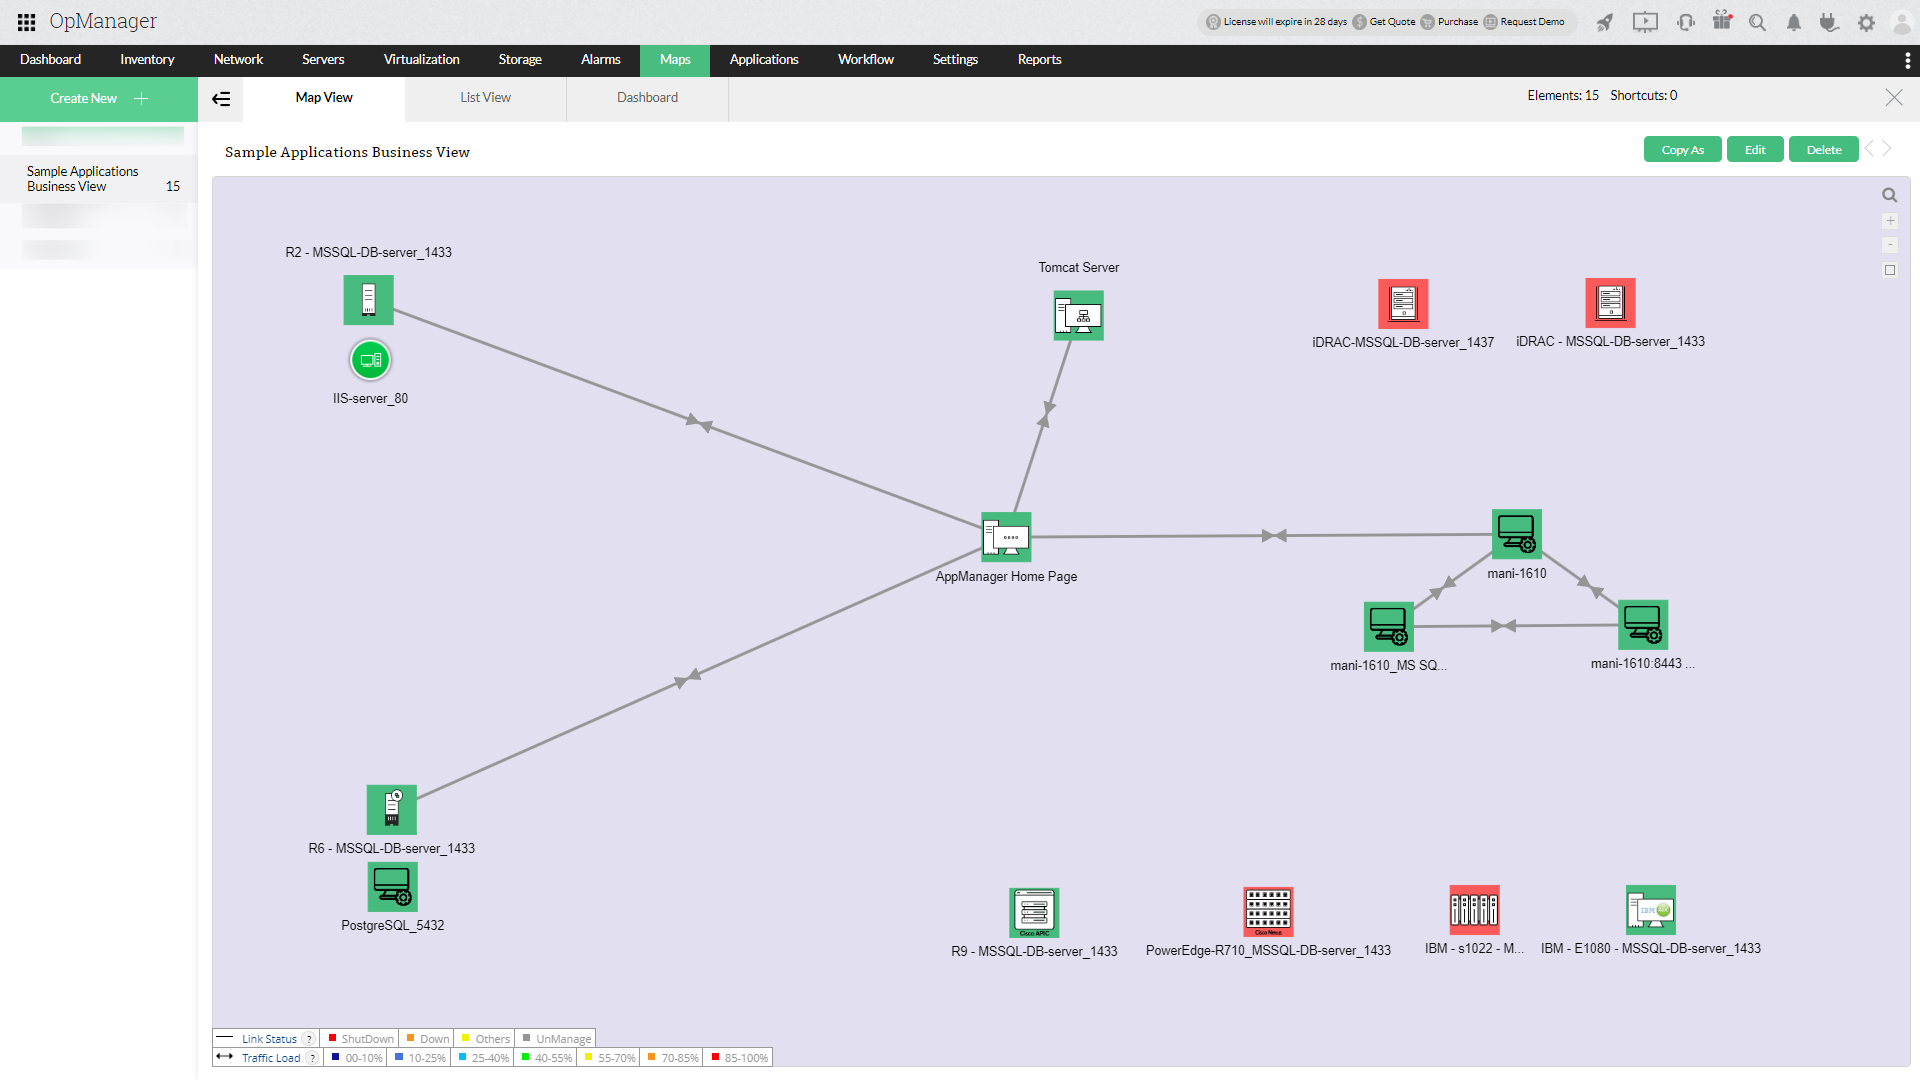
For a guide on how to configure a business view for APM monitors, check this page.
Application Manager KPI in Device Snapshot
Application monitoring is now more seamless in OpManager, with key metrics available directly in the Device Snapshot view, providing deeper insights into application performance.

Supported Application Performance Monitors
| Category | Monitors |
|---|---|
| Application Servers | |
| Database Servers | |
| Middleware Servers | |
| SAP Servers | |
| Web Servers/Services |
APM Plug-in's Self Monitoring
If the Applications Manager plugin is detected as down through Self Monitoring, OpManager will automatically attempt to restart the plugin a predefined number of times. This ensures minimal downtime and helps maintain continuous monitoring without requiring manual intervention.

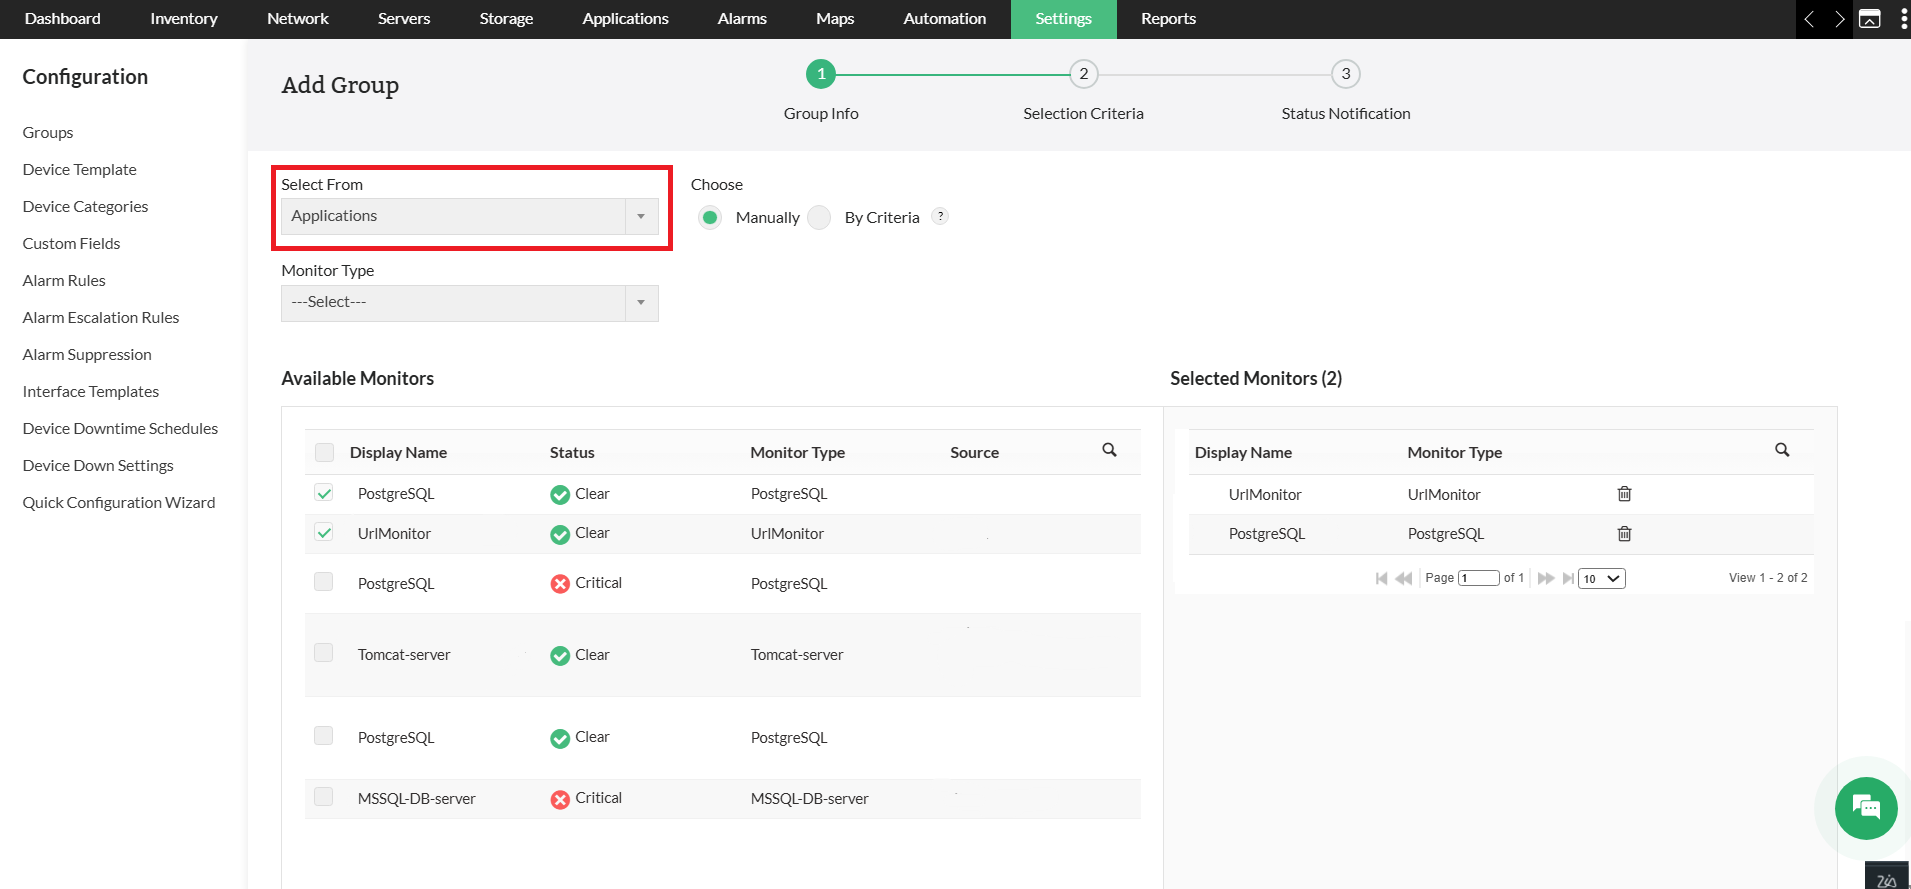
Application Monitors Grouping
With the Grouping Application Monitors feature, you can group monitors from the APM plugin alongside devices for unified visibility. This gives you a consolidated view of both device and application health from a single console. To group application monitors in OpManager:
- Navigate to Settings → Configuration → Groups.
- Select Add at the top right corner.
- Enter a Group Name and an optional description.
- From the monitor selection dropdown, select Applications. All monitors discovered via the APM plugin will be listed and can be selected.
- Click Save.
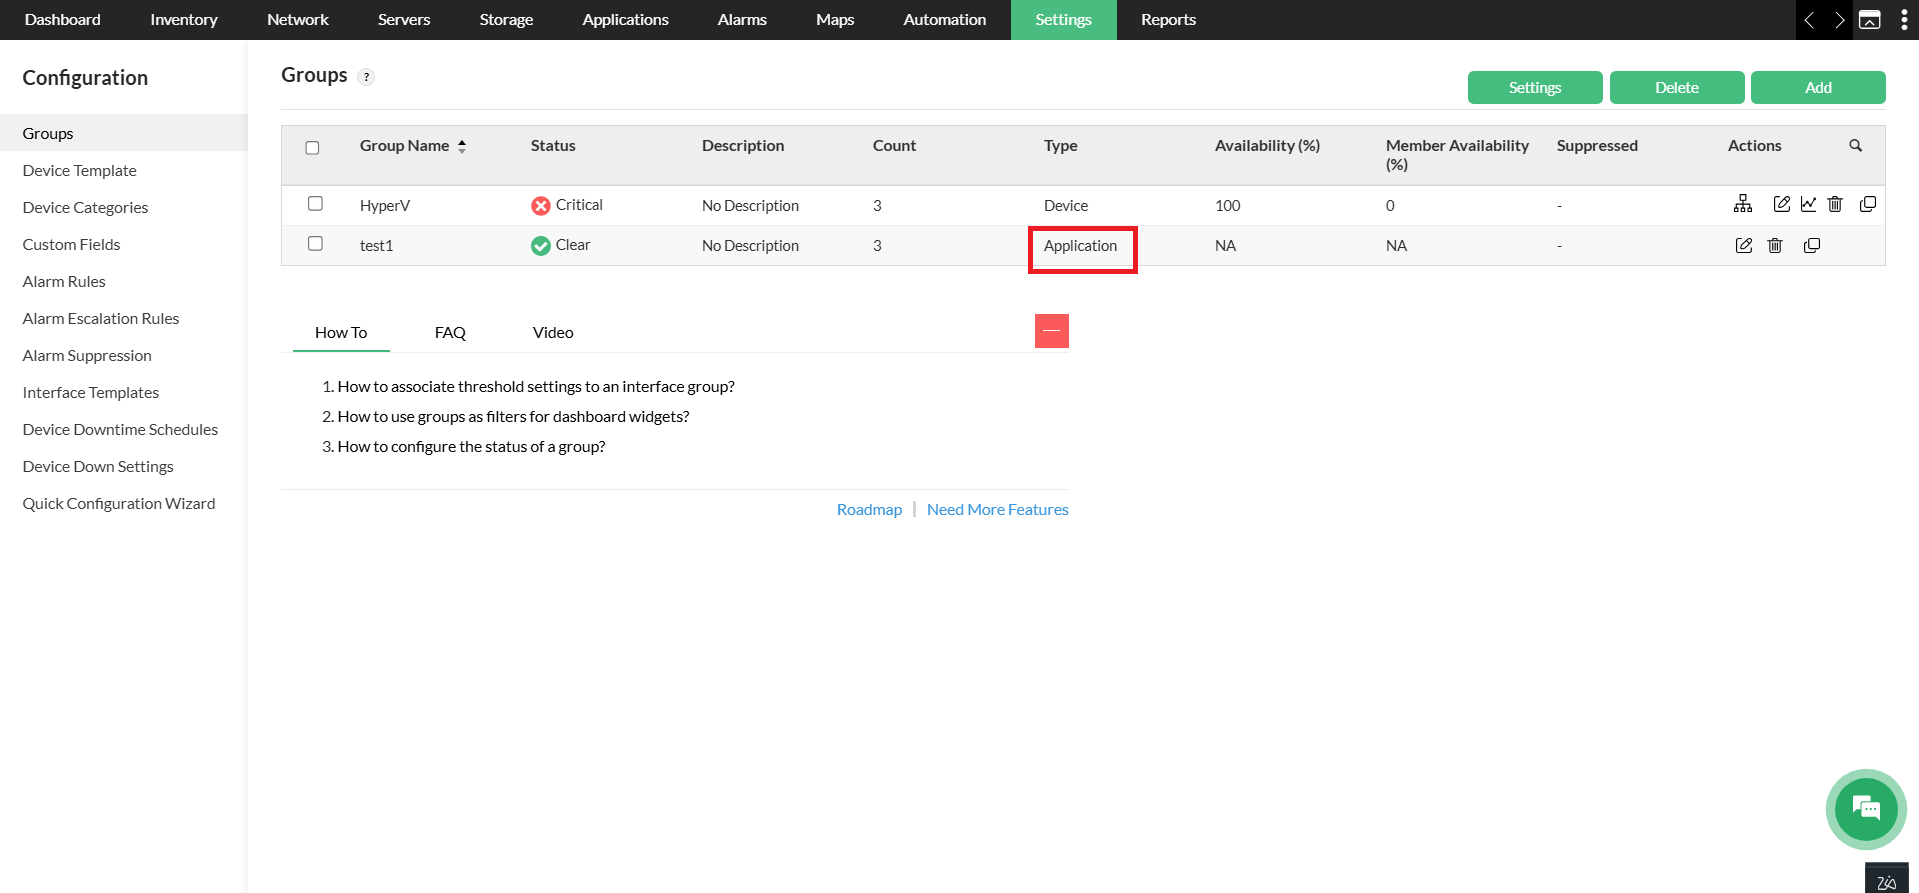
Once configured, the group will be listed under the Groups page. Application monitors will be specified (Application) under the Type column, distinguishing them from group types.
Viewing Application Monitors in the Organization Map
Application monitors linked to devices can now be visualized in the Organization Map, providing a graphical representation of how applications relate to the underlying network infrastructure. To view all application monitors in the Organization Map:
- Navigate to Maps → Organization Map.
- Click the dropdown menu at the top right corner.
- Select Applications from the dropdown.
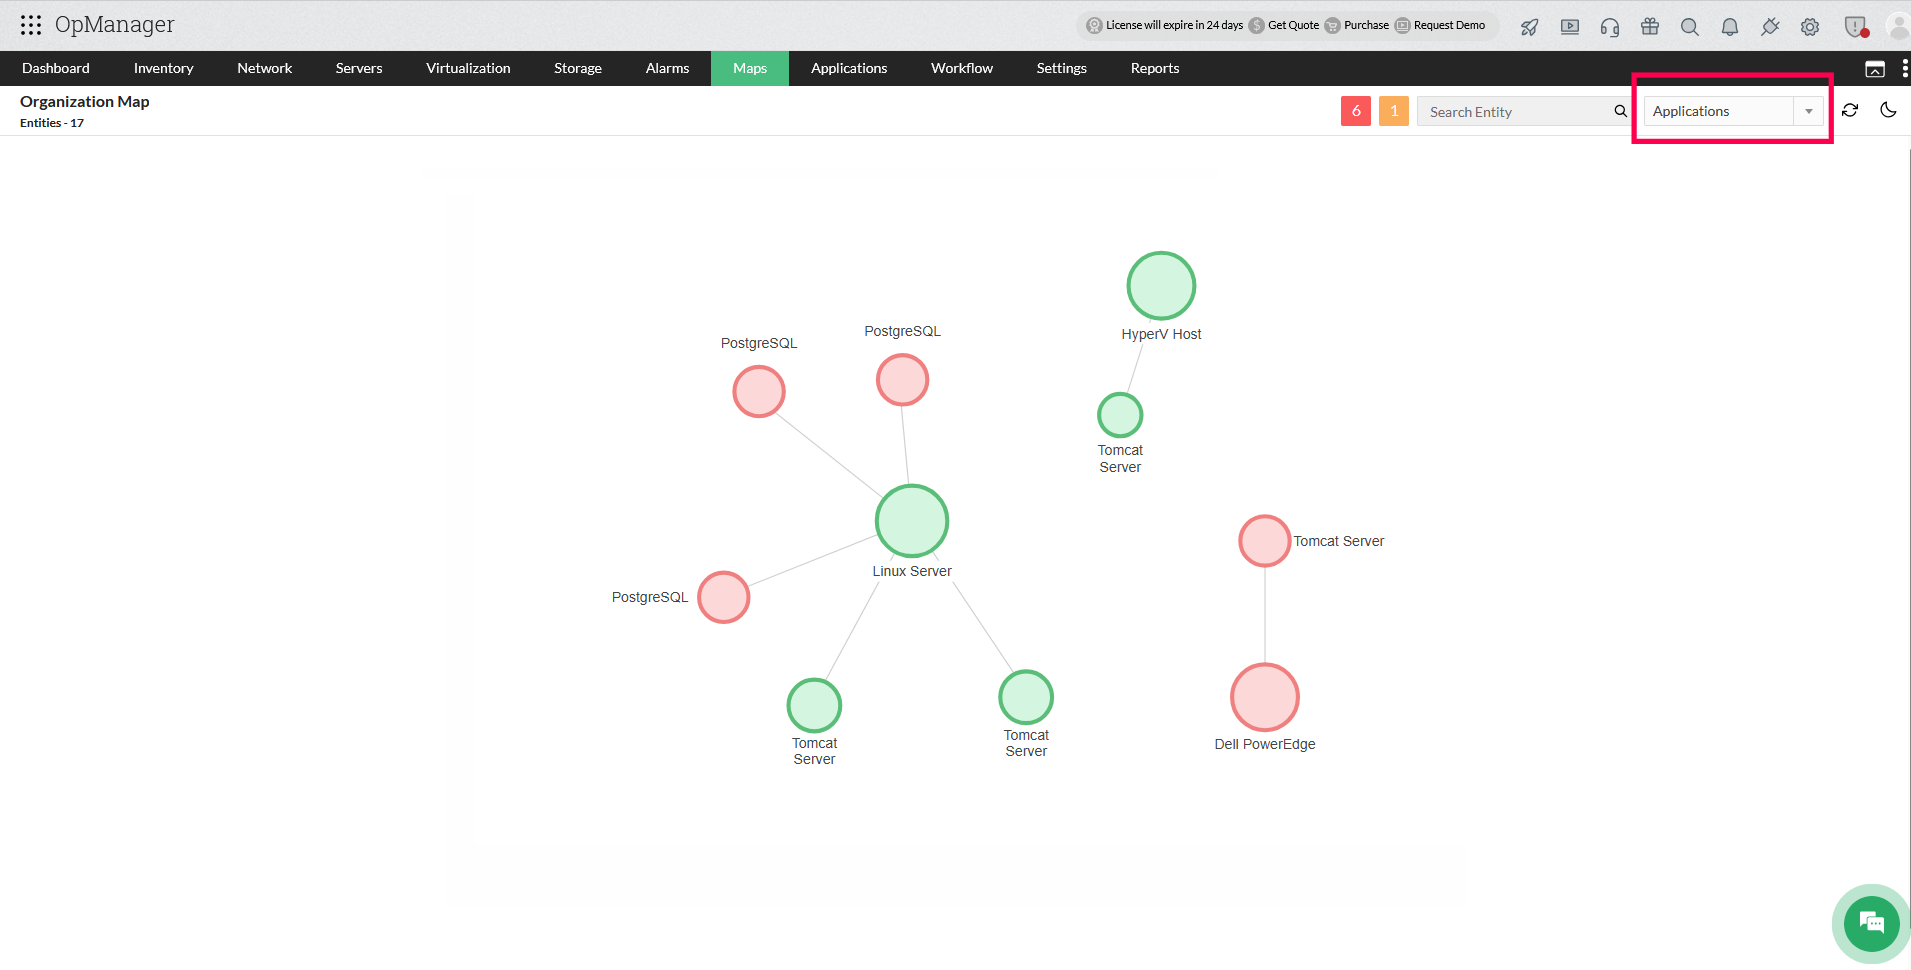
OpManager devices that have associated Application monitors will be listed together in the Organization Map, giving you a clear picture of which applications are tied to which devices. This makes it much easier to spot the source of an application performance issue and understand its impact on your network.