Centralized AppLogs monitoring
Bridge the gap between performance metrics and logs. You can now collect, centralize, search, and analyze application and server logs directly within Applications Manager.
Learn more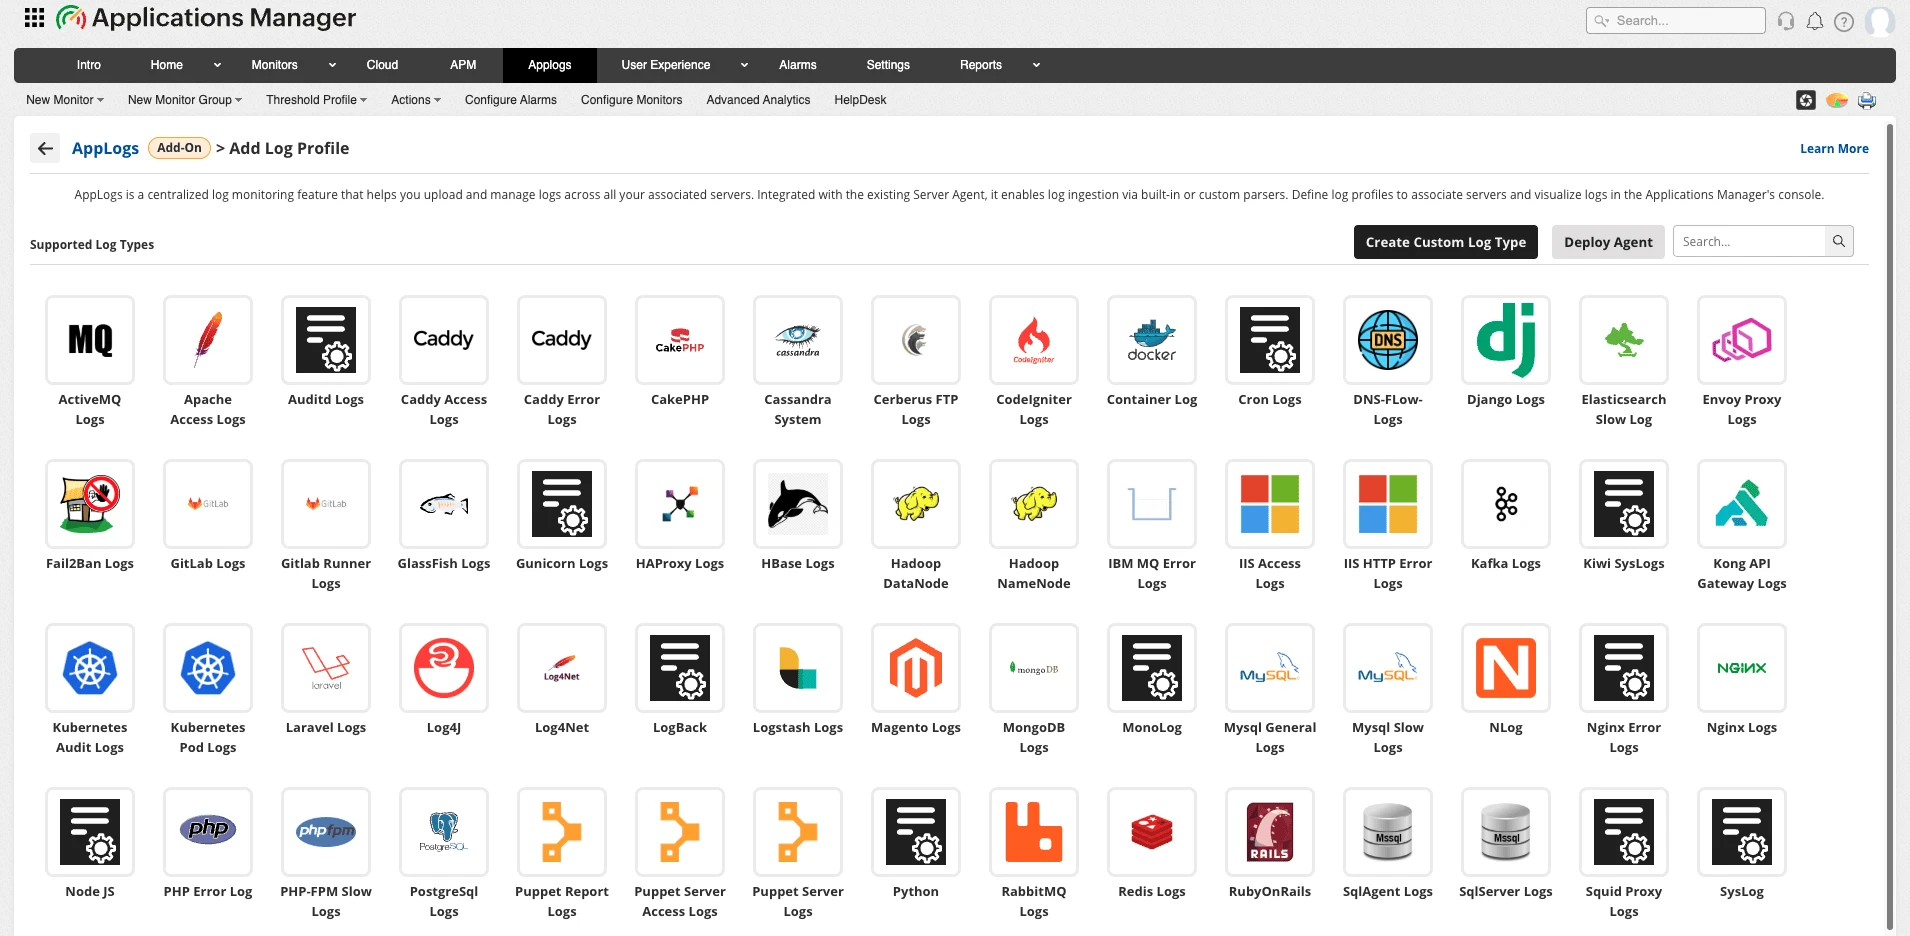
Veeam Enterprise Manager monitoring
Applications Manager now supports monitoring for Veeam Enterprise Manager, providing deep visibility into the health and performance of your backup infrastructure. Track backup job status and execution trends in real time to ensure seamless operations across your IT.
Learn more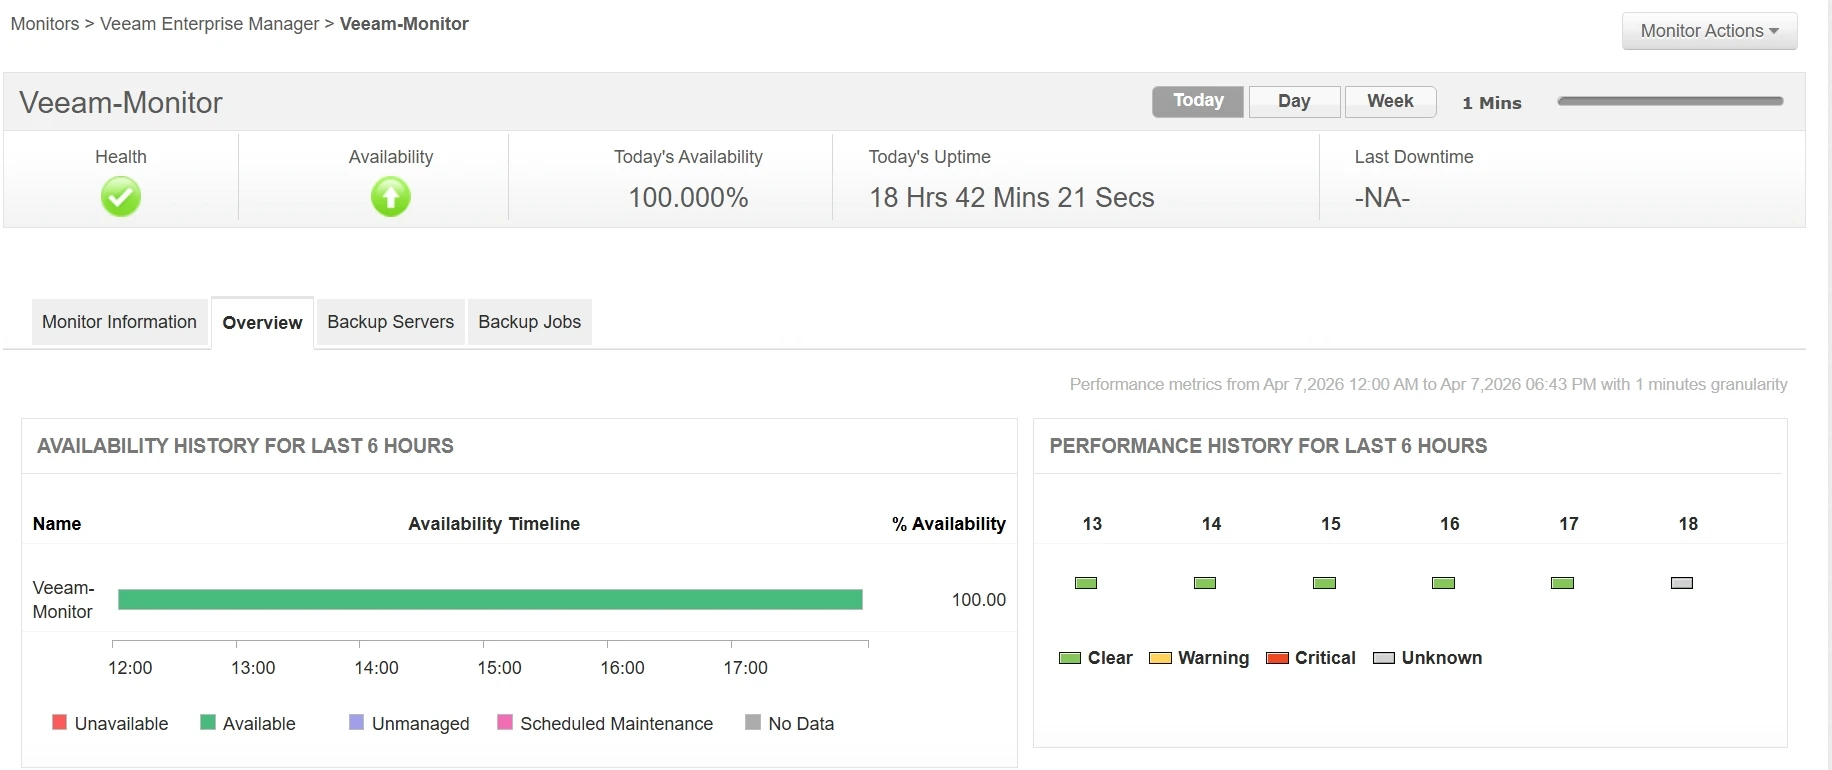
AI-powered alarm summaries
Leverage Generative AI in Applications Manager to transform how you handle alerts. With OpenAI integration, automatically generate structured summaries for consolidated, group-level, or individual alarms.
Learn more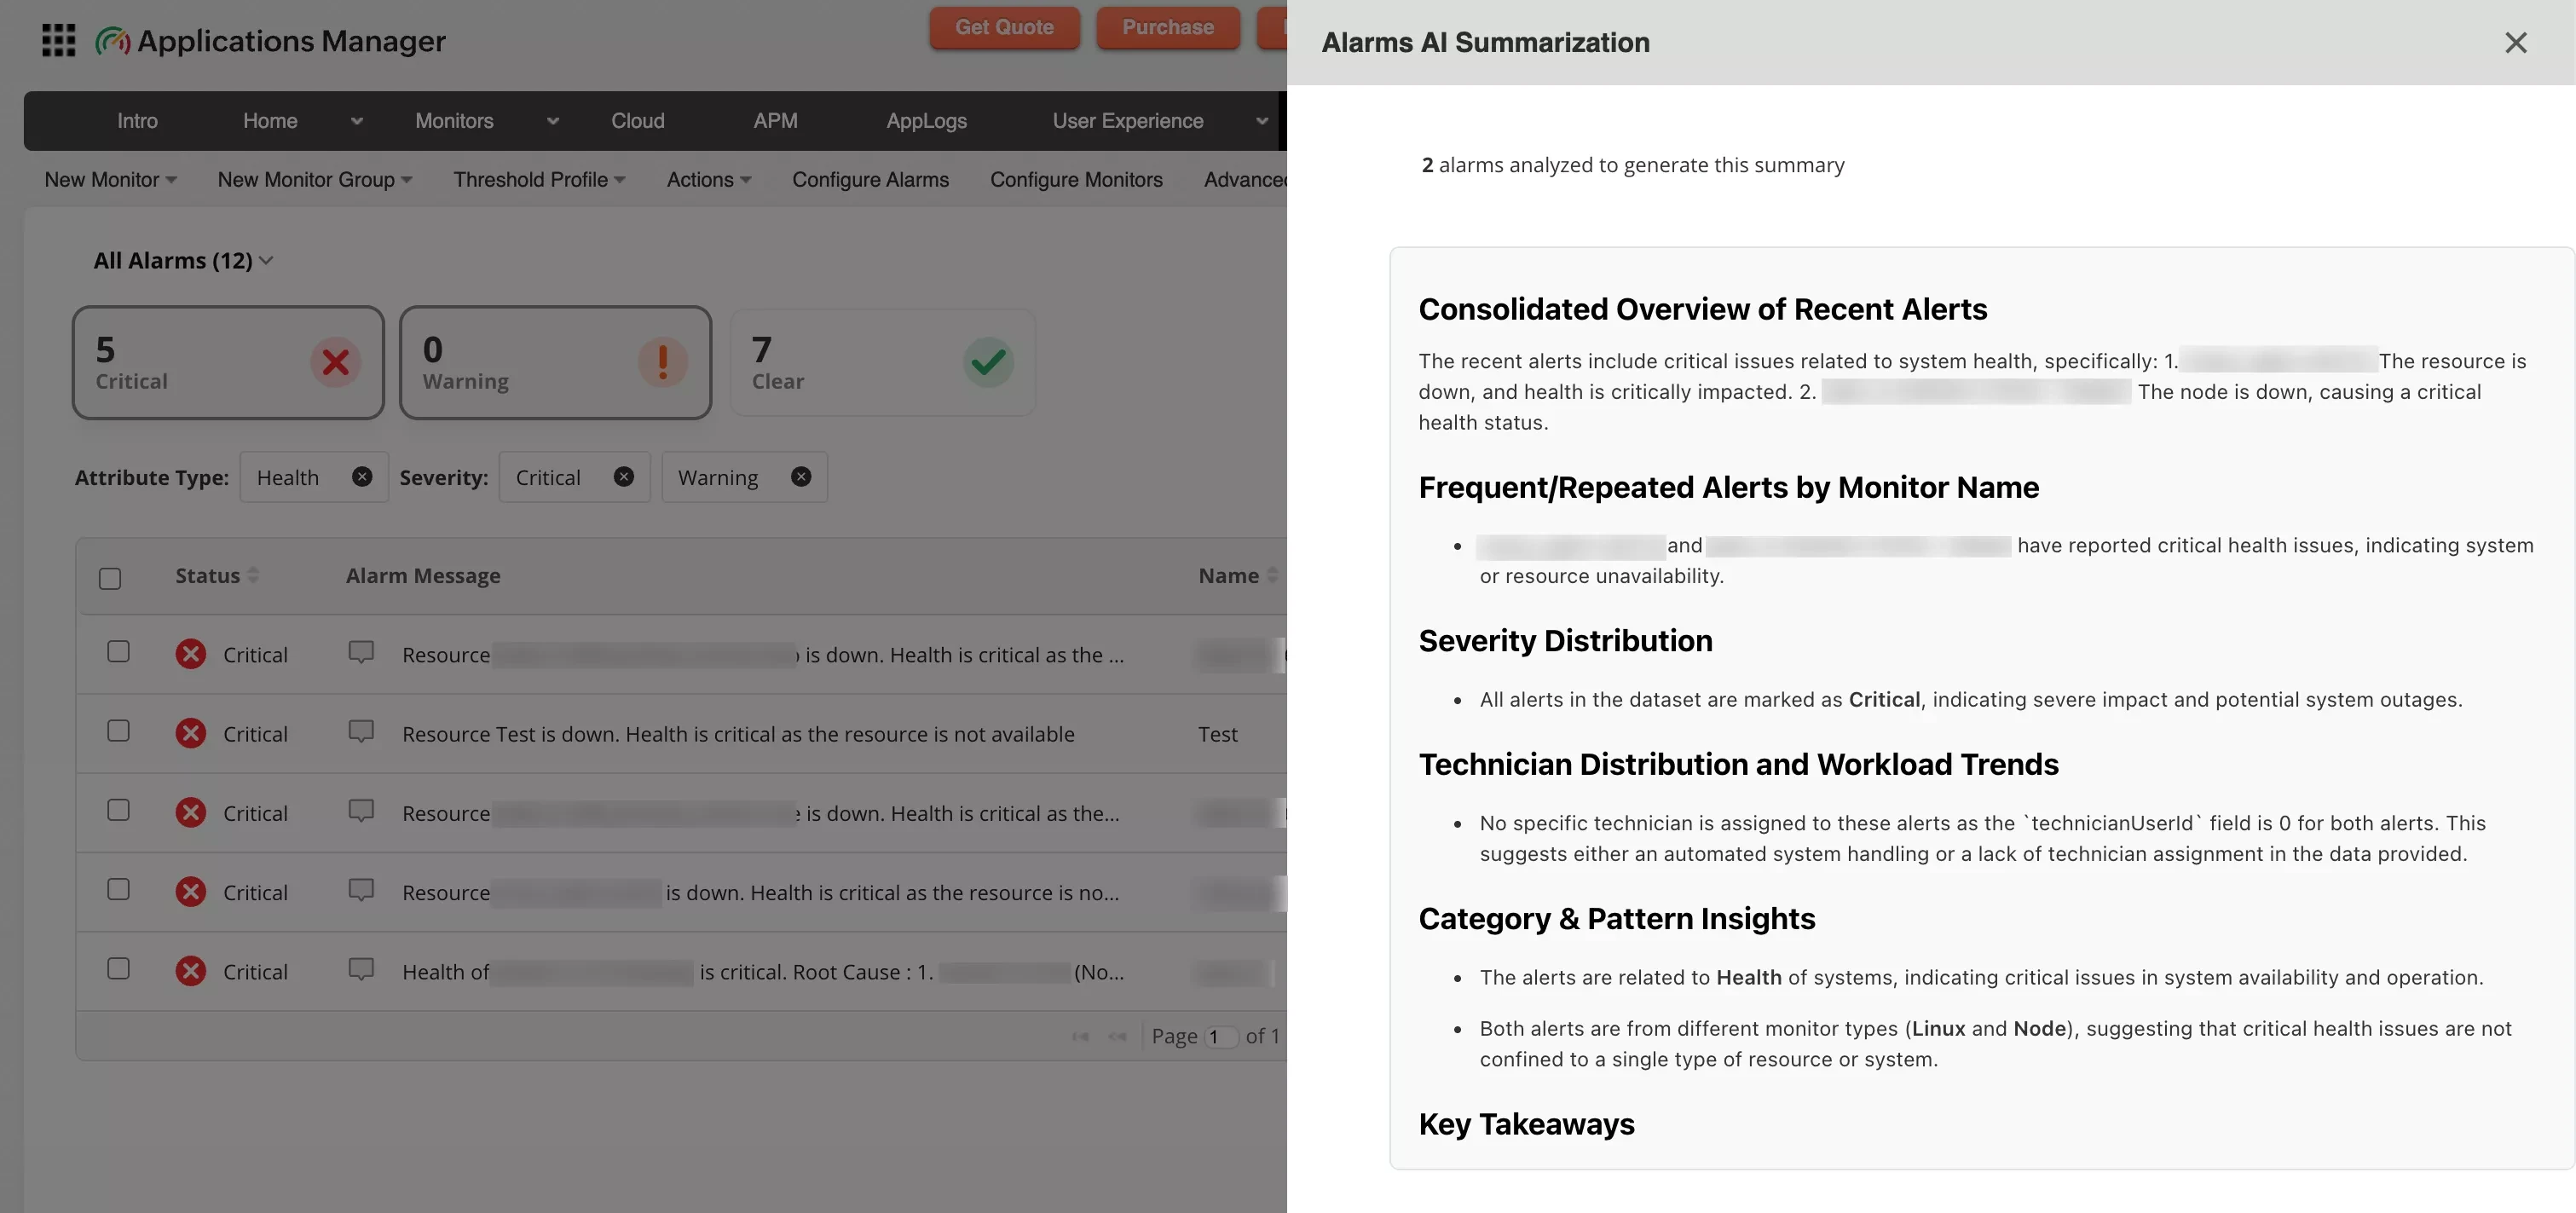
Docker Swarm monitoring
Gain deep visibility into your container orchestration with dedicated Docker Swarm monitoring. Ensure cluster health, service availability, and smooth orchestration across Docker hosts.
Learn more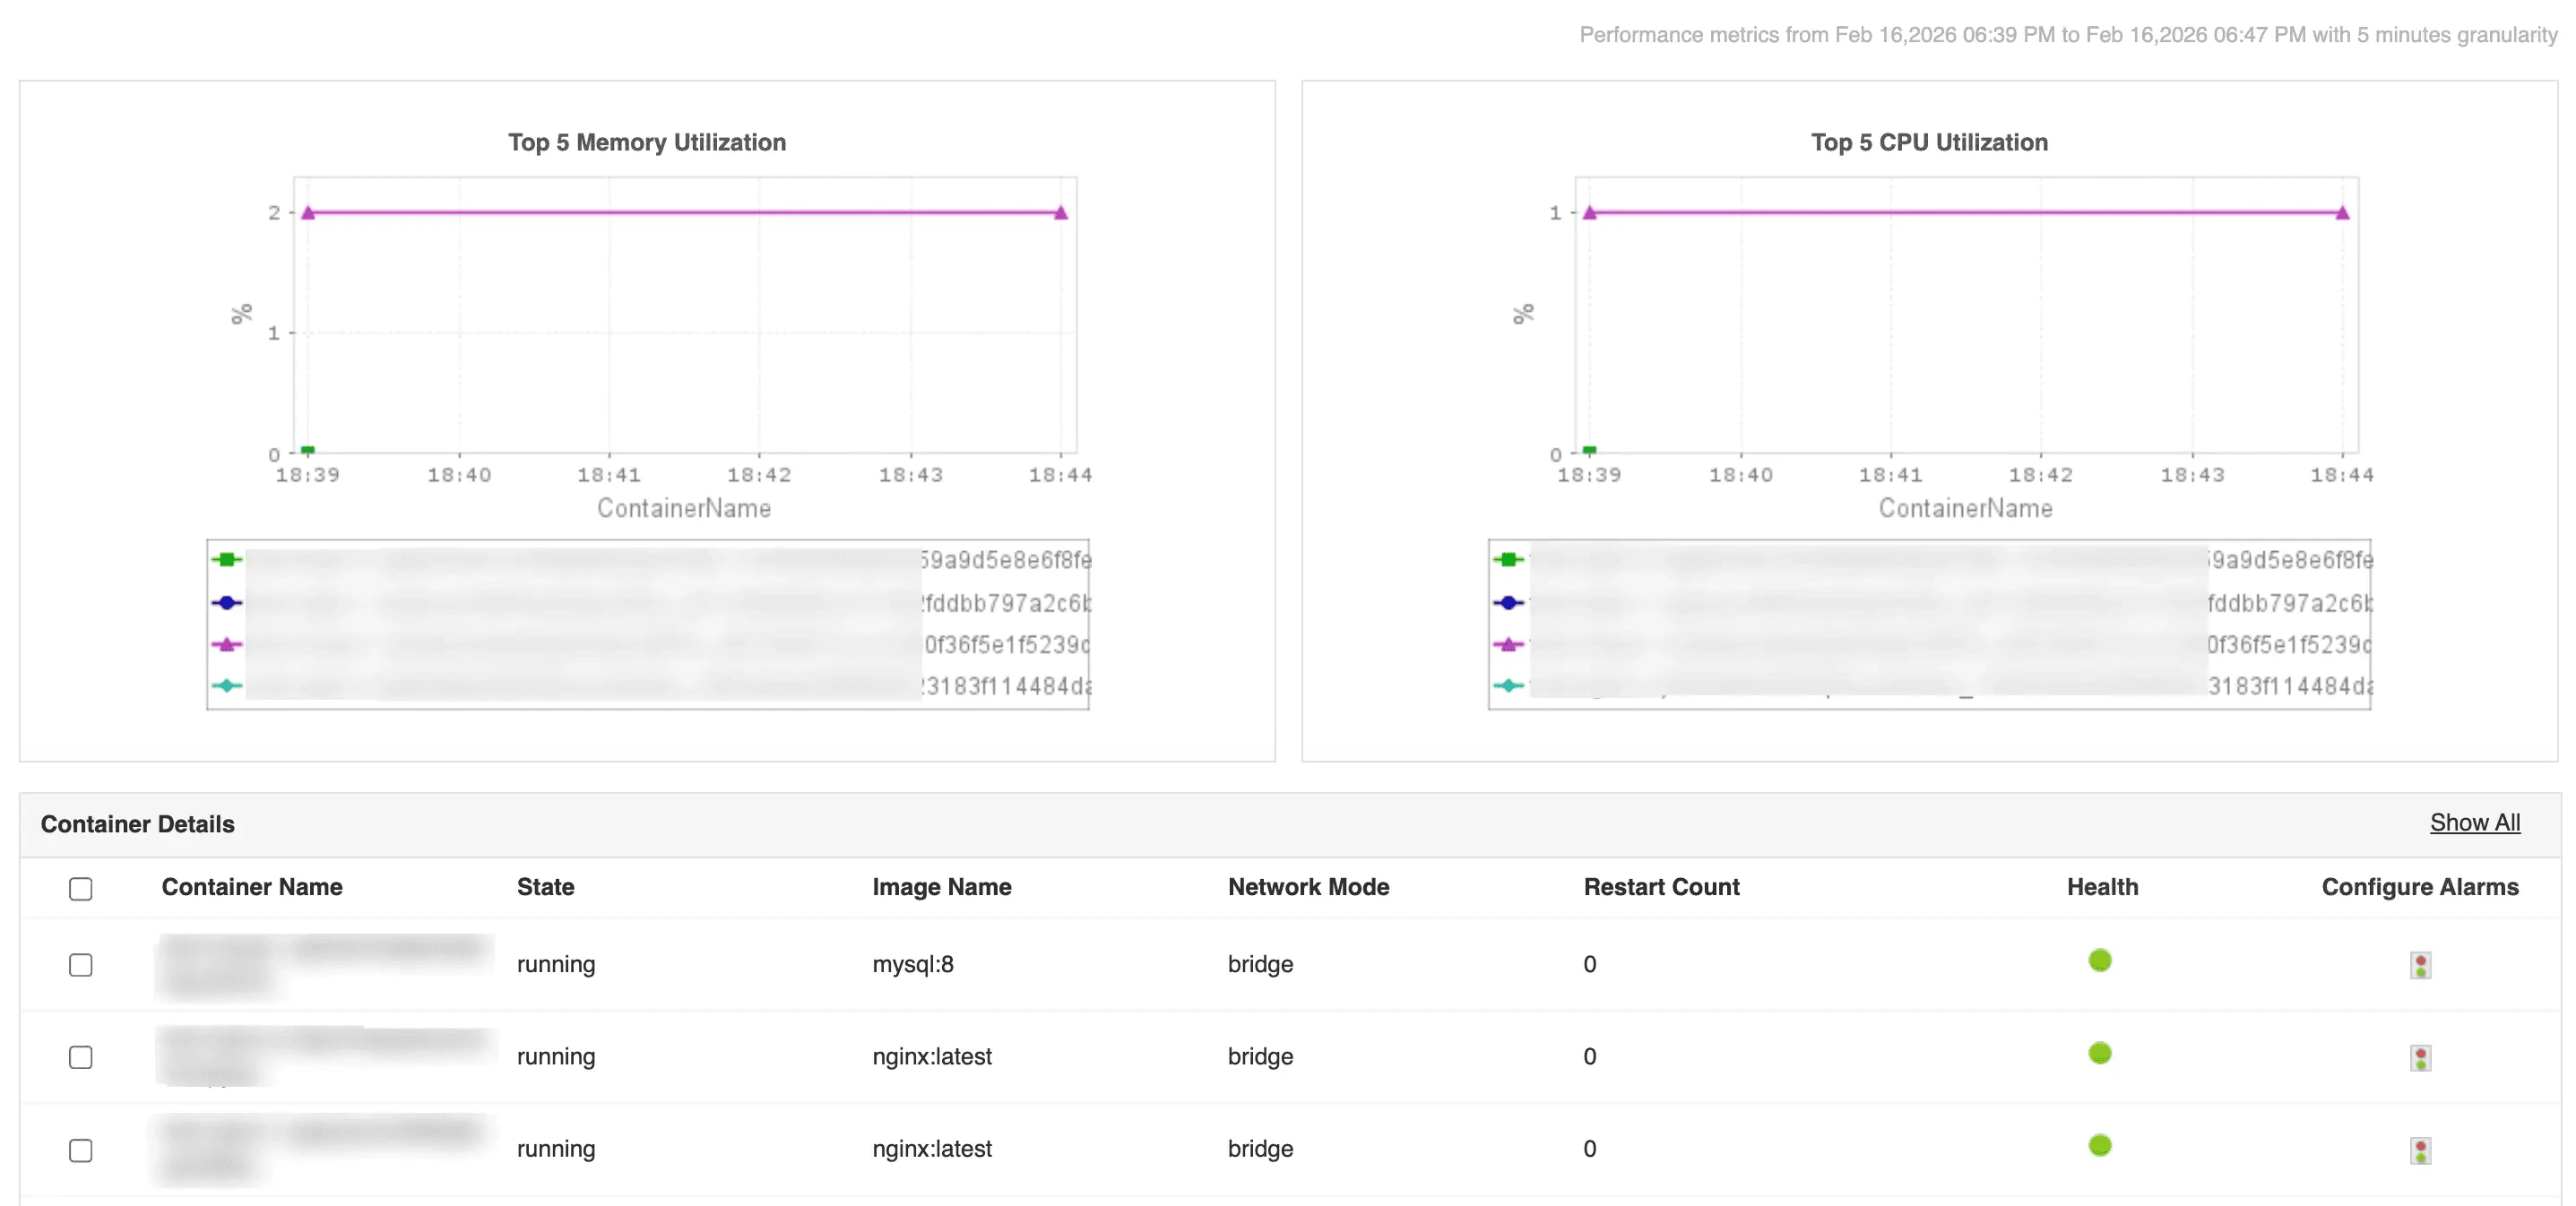
Comprehensive Podman monitoring
Monitor key performance and operational metrics of Podman environments, including container and pod status, resource utilization, and runtime health. Gain real-time insights into image health and service availability.
Learn more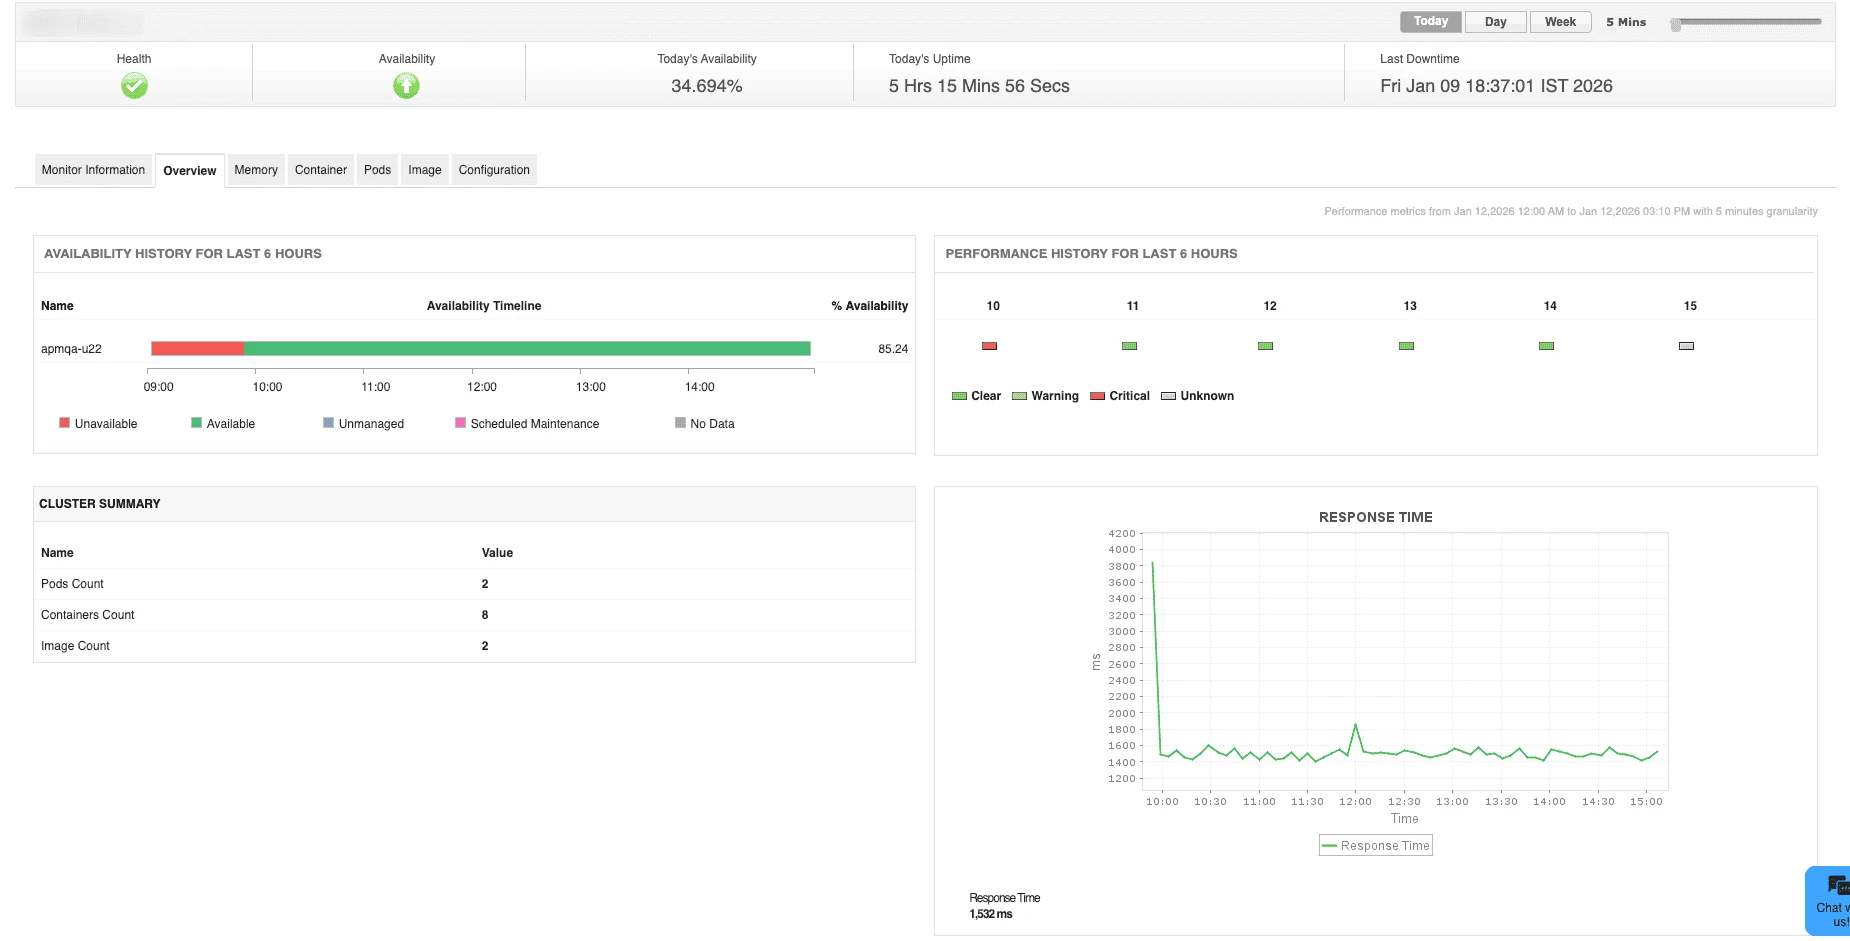
Advanced SIEM and Splunk integrations
Strengthen your security posture by seamlessly forwarding application alarms, audit logs, and access logs from Applications Manager to Splunk and other SIEM platforms.
Learn more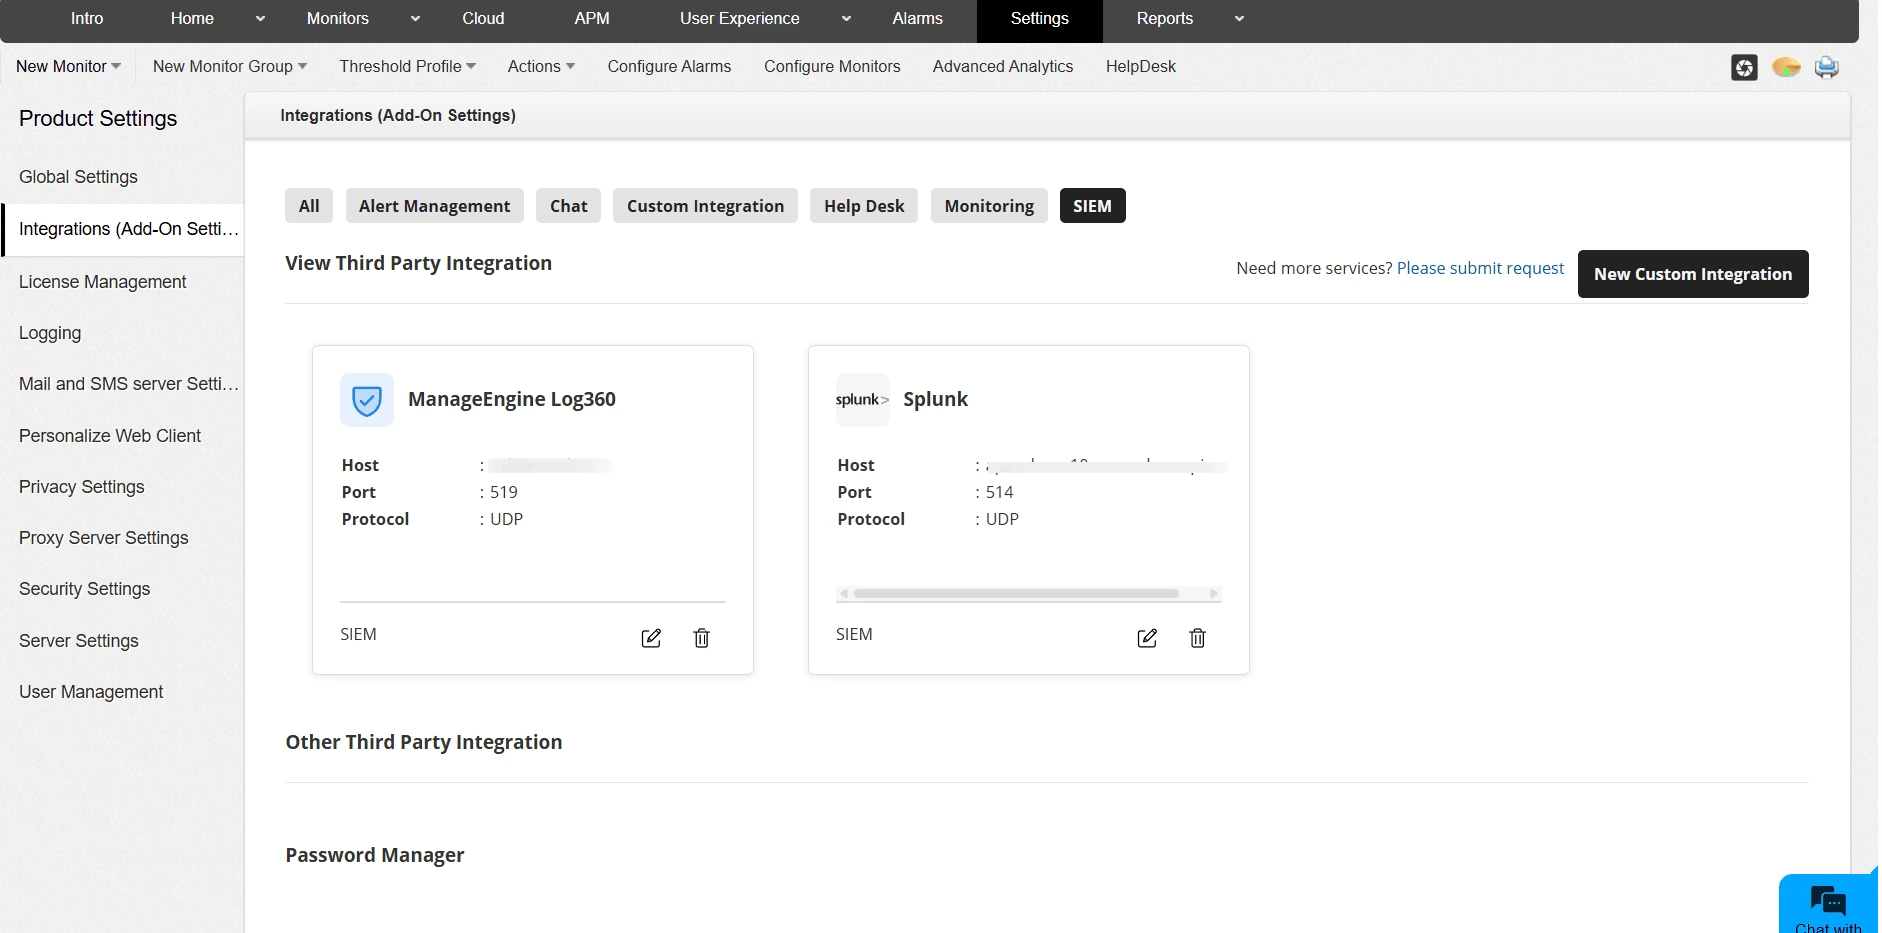
APM Insight: Performance Milestones
You can now easily compare performance metrics across different milestones and display milestone markers directly on graphs to visualize how code changes affect end-user satisfaction.
Learn more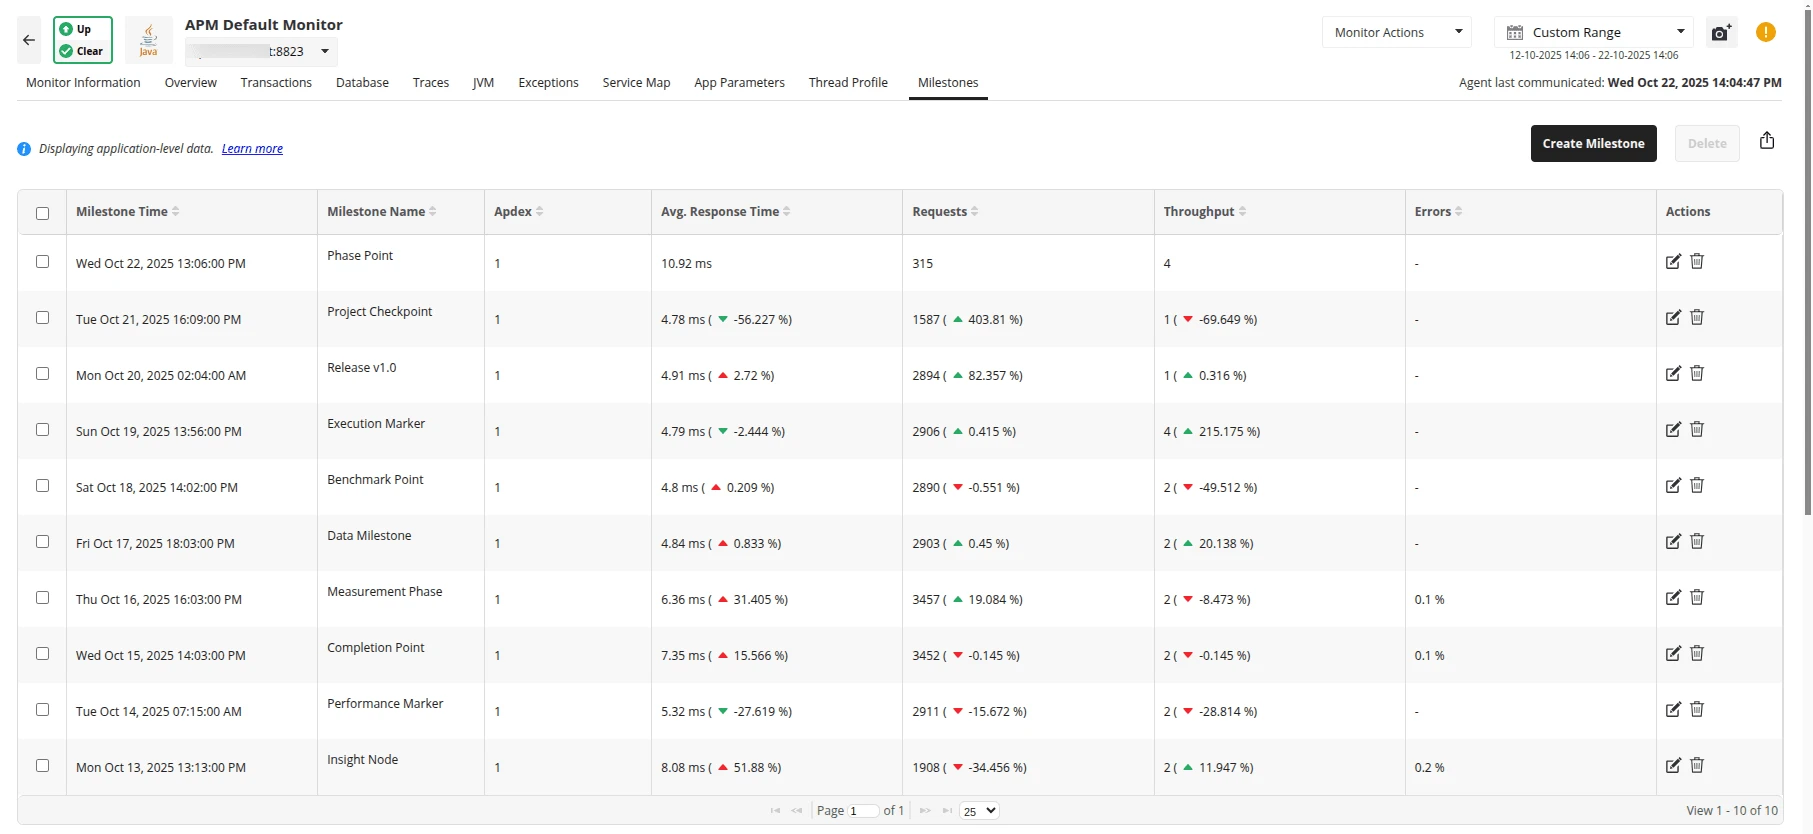
Archives
- 2025
- 2024
- 2023
- 2022
- 2021
- 2020
- 2019
- 2018
Support for Windows server 2025
Gain deep visibility into the performance, resource utilization, and system health of your Windows Server 2025 OS. Ensure your modernized infrastructure remains stable and efficient.
Learn more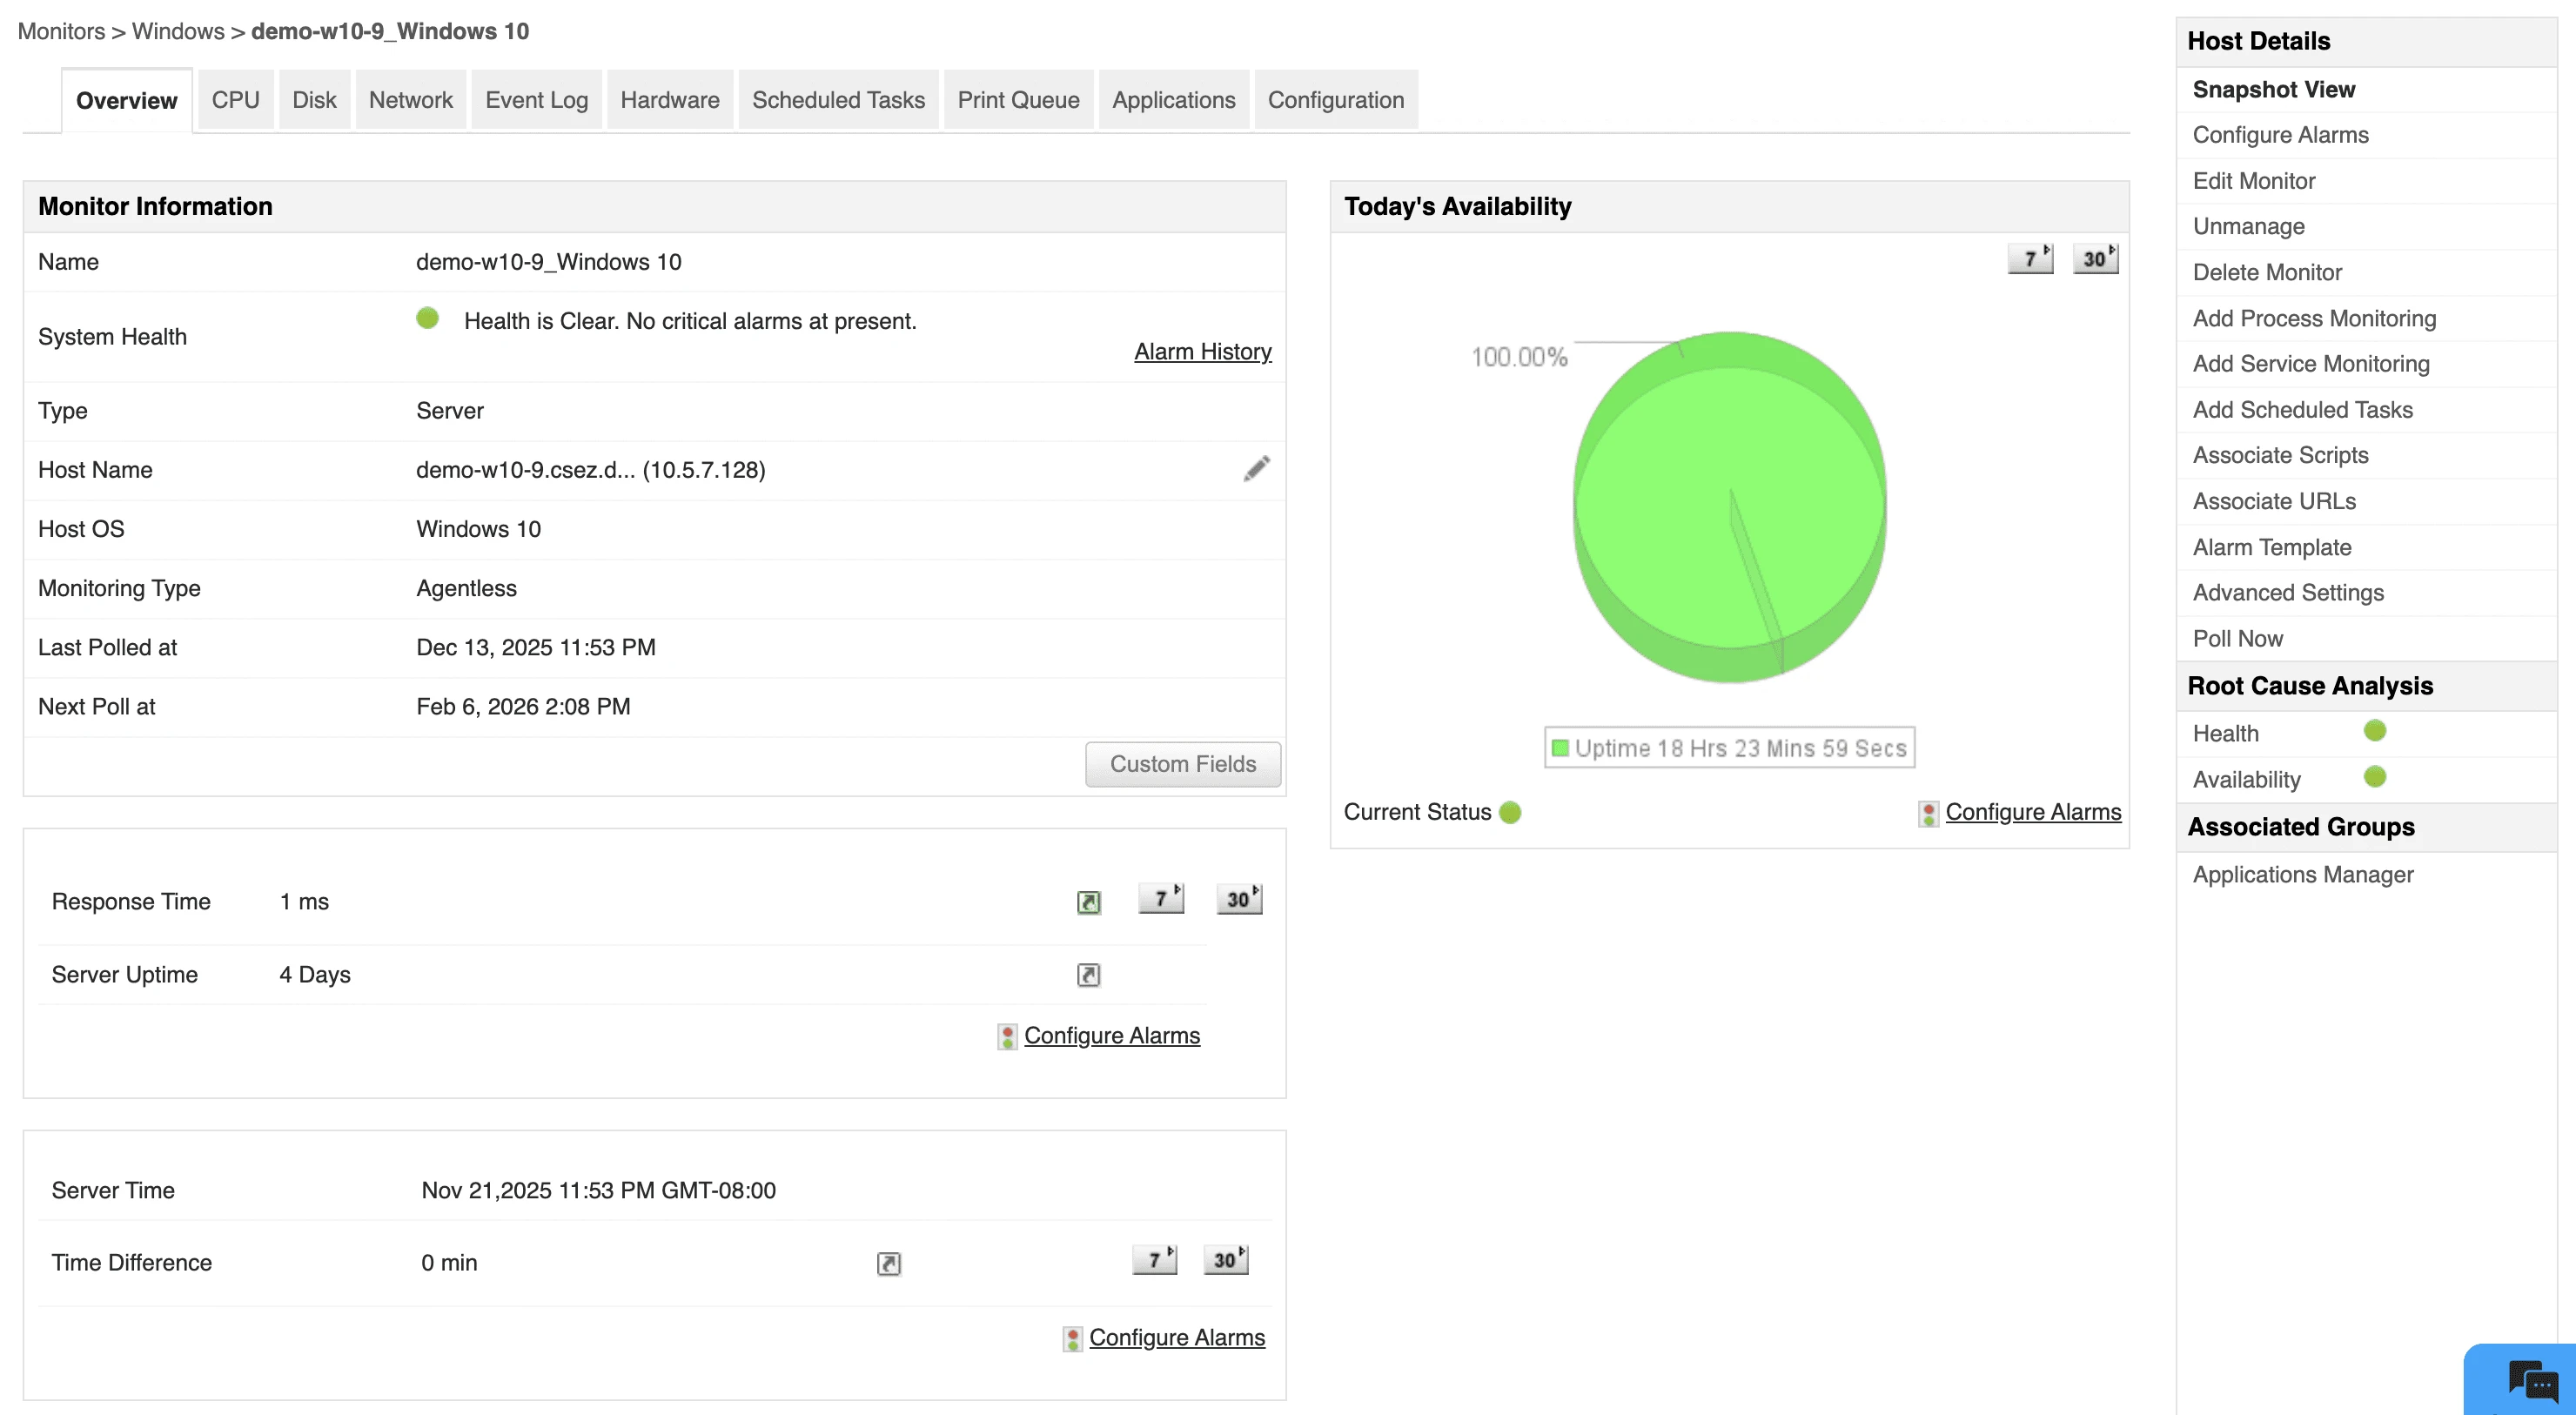
Enhanced Oracle Cloud Autonomous AI database monitoring
Stay ahead of your cloud database performance with updated support for Oracle Cloud Autonomous AI Databases.
Learn more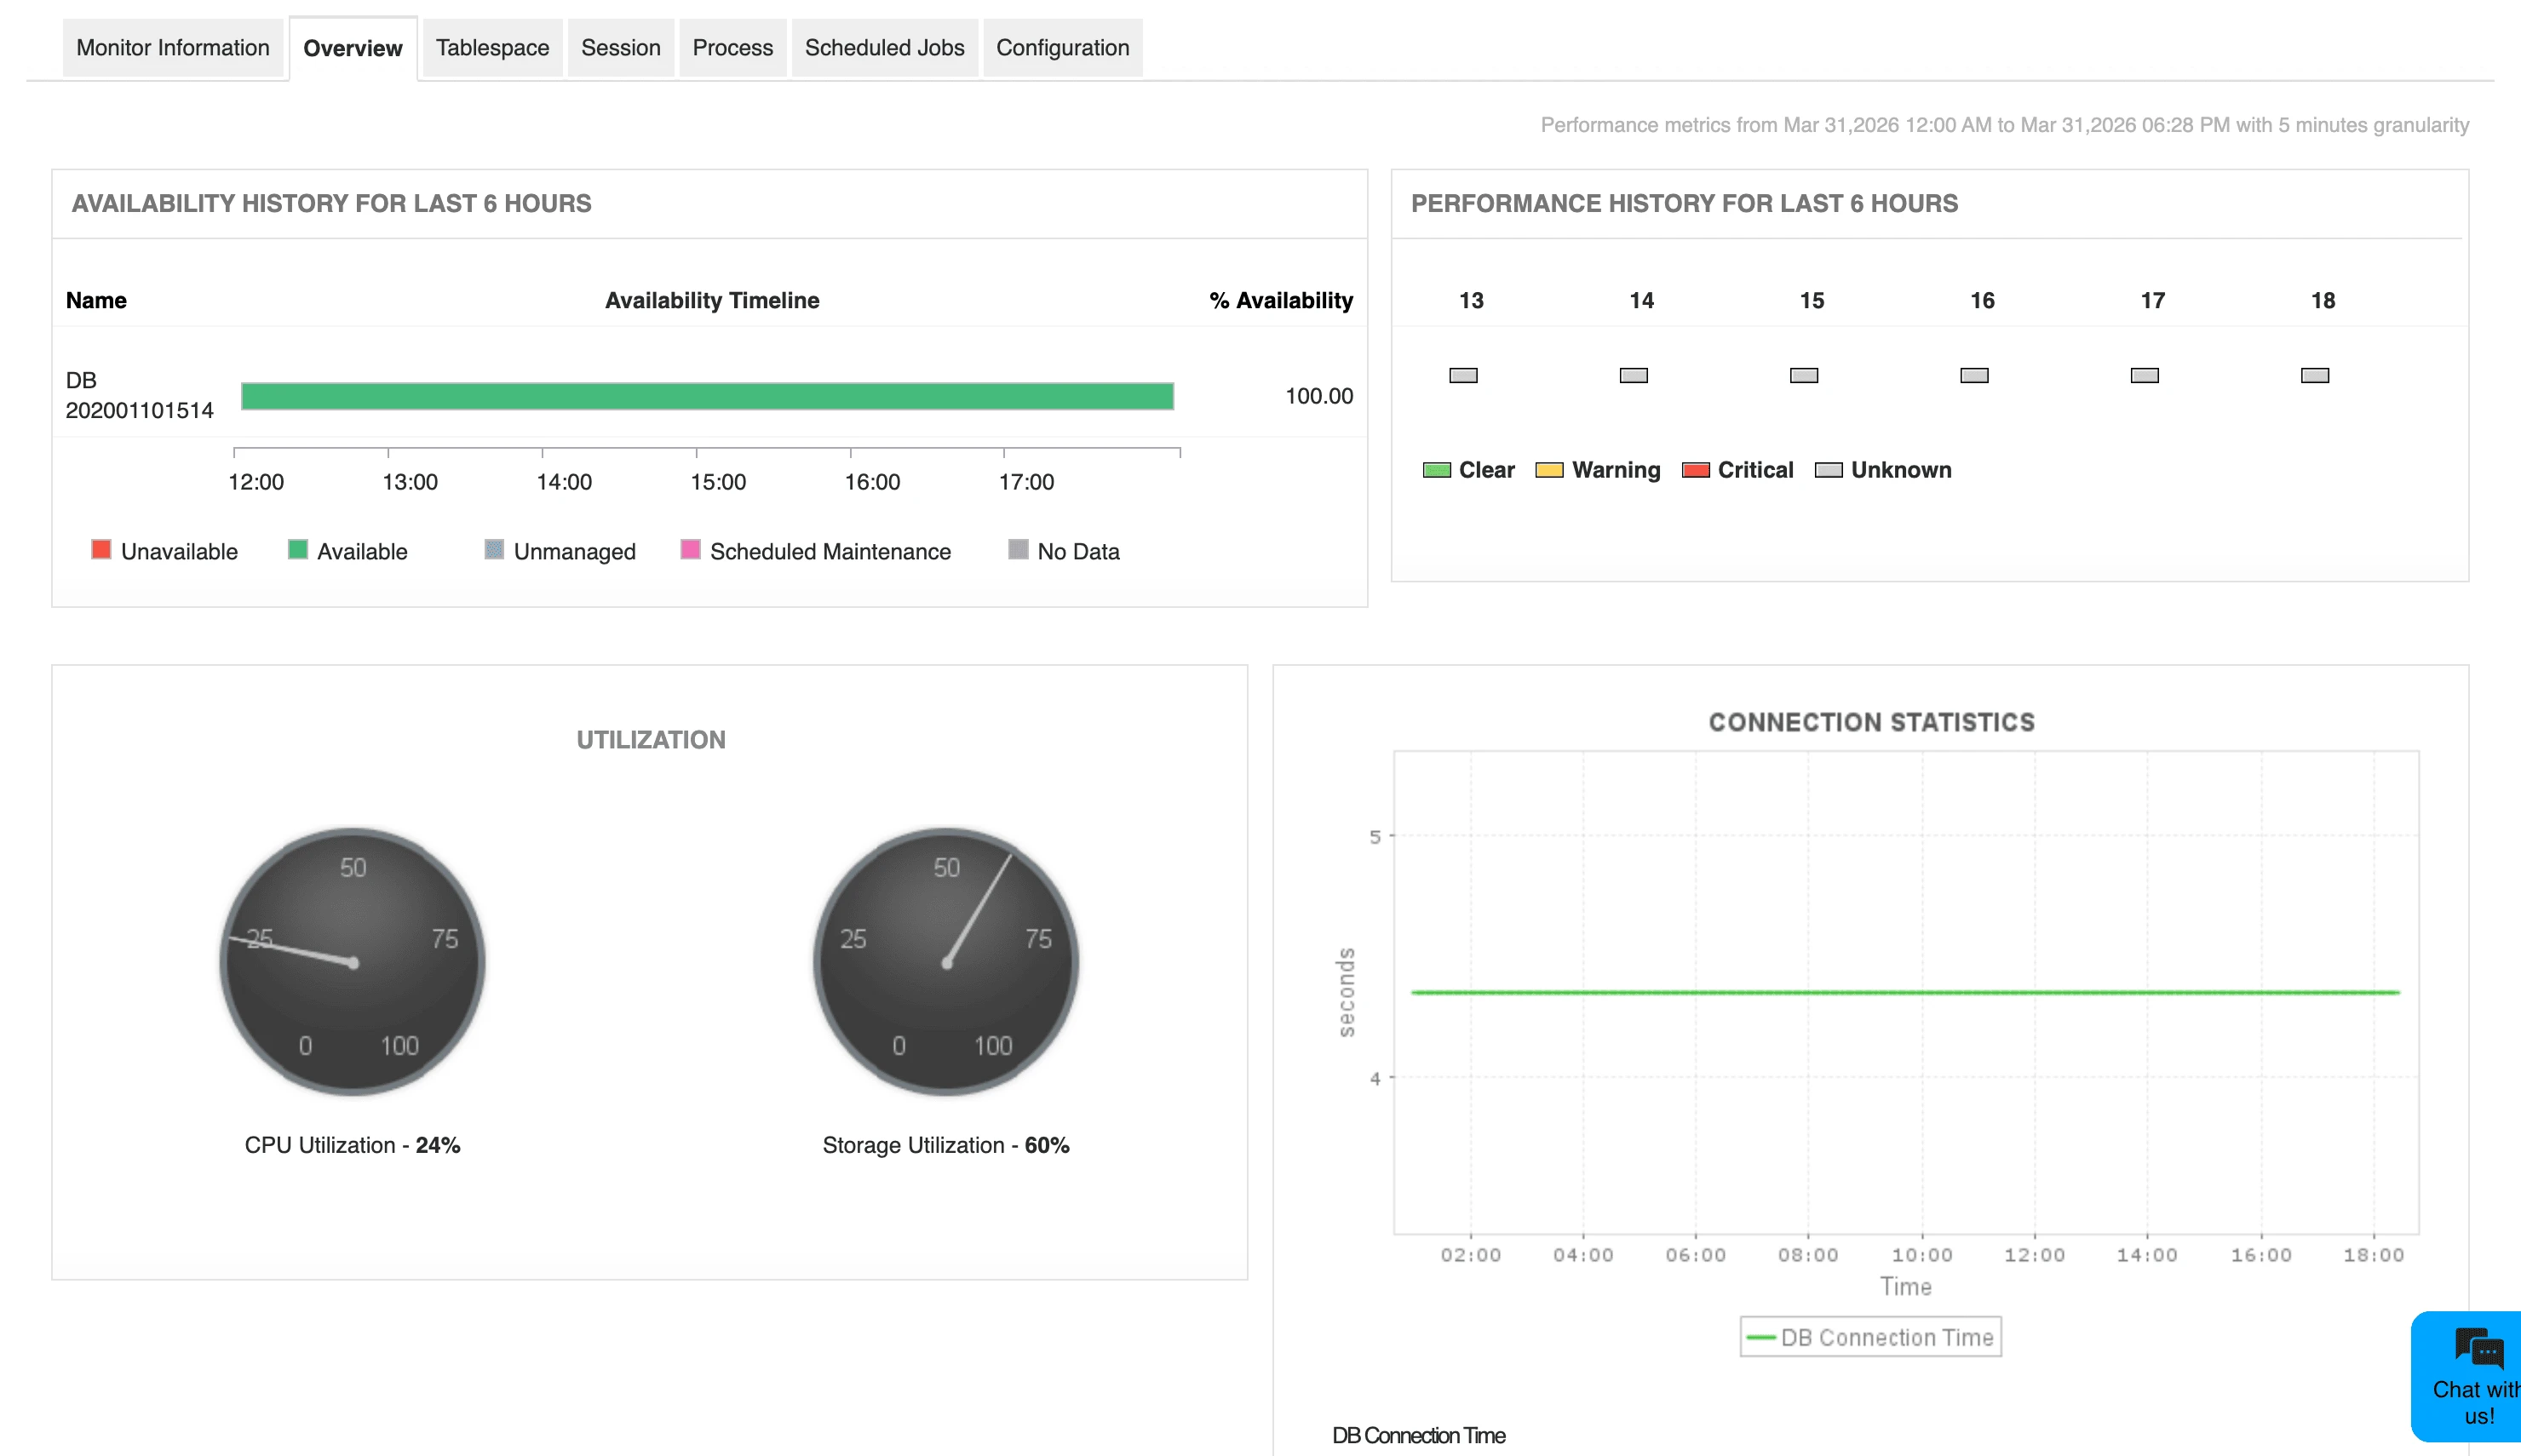
20+ New AWS services
Eliminate console-switching with support for over 20 new AWS services, bringing your total to 50+ monitored services. Correlate and troubleshoot your entire cloud stack—from networking to security—on a single screen.
Learn more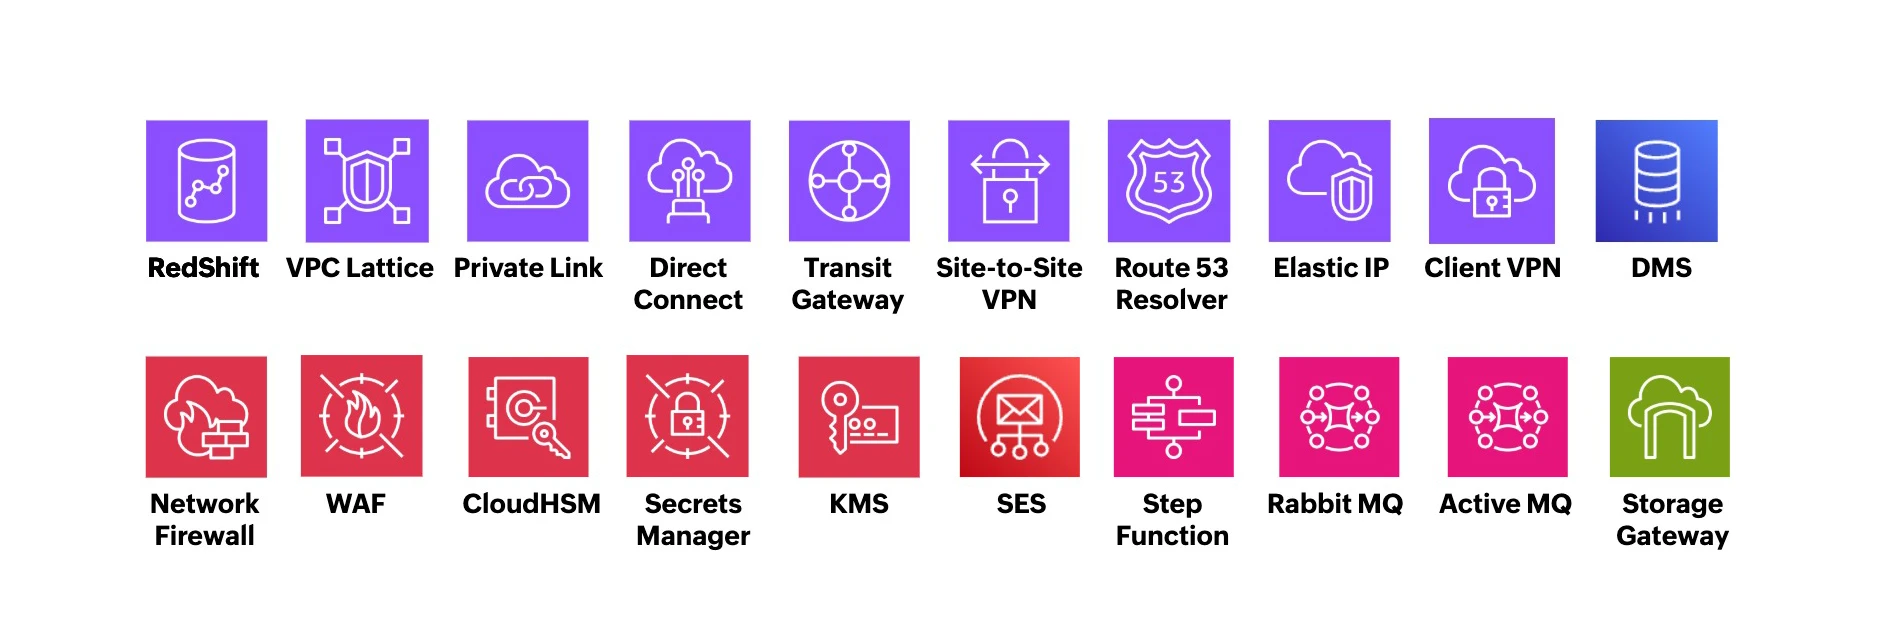
Advanced MS SQL Server 2025 monitoring
Proactively manage your database environment with support for the latest MSSQL 2025. Prevent bottlenecks and optimize your SQL infrastructure.
Learn more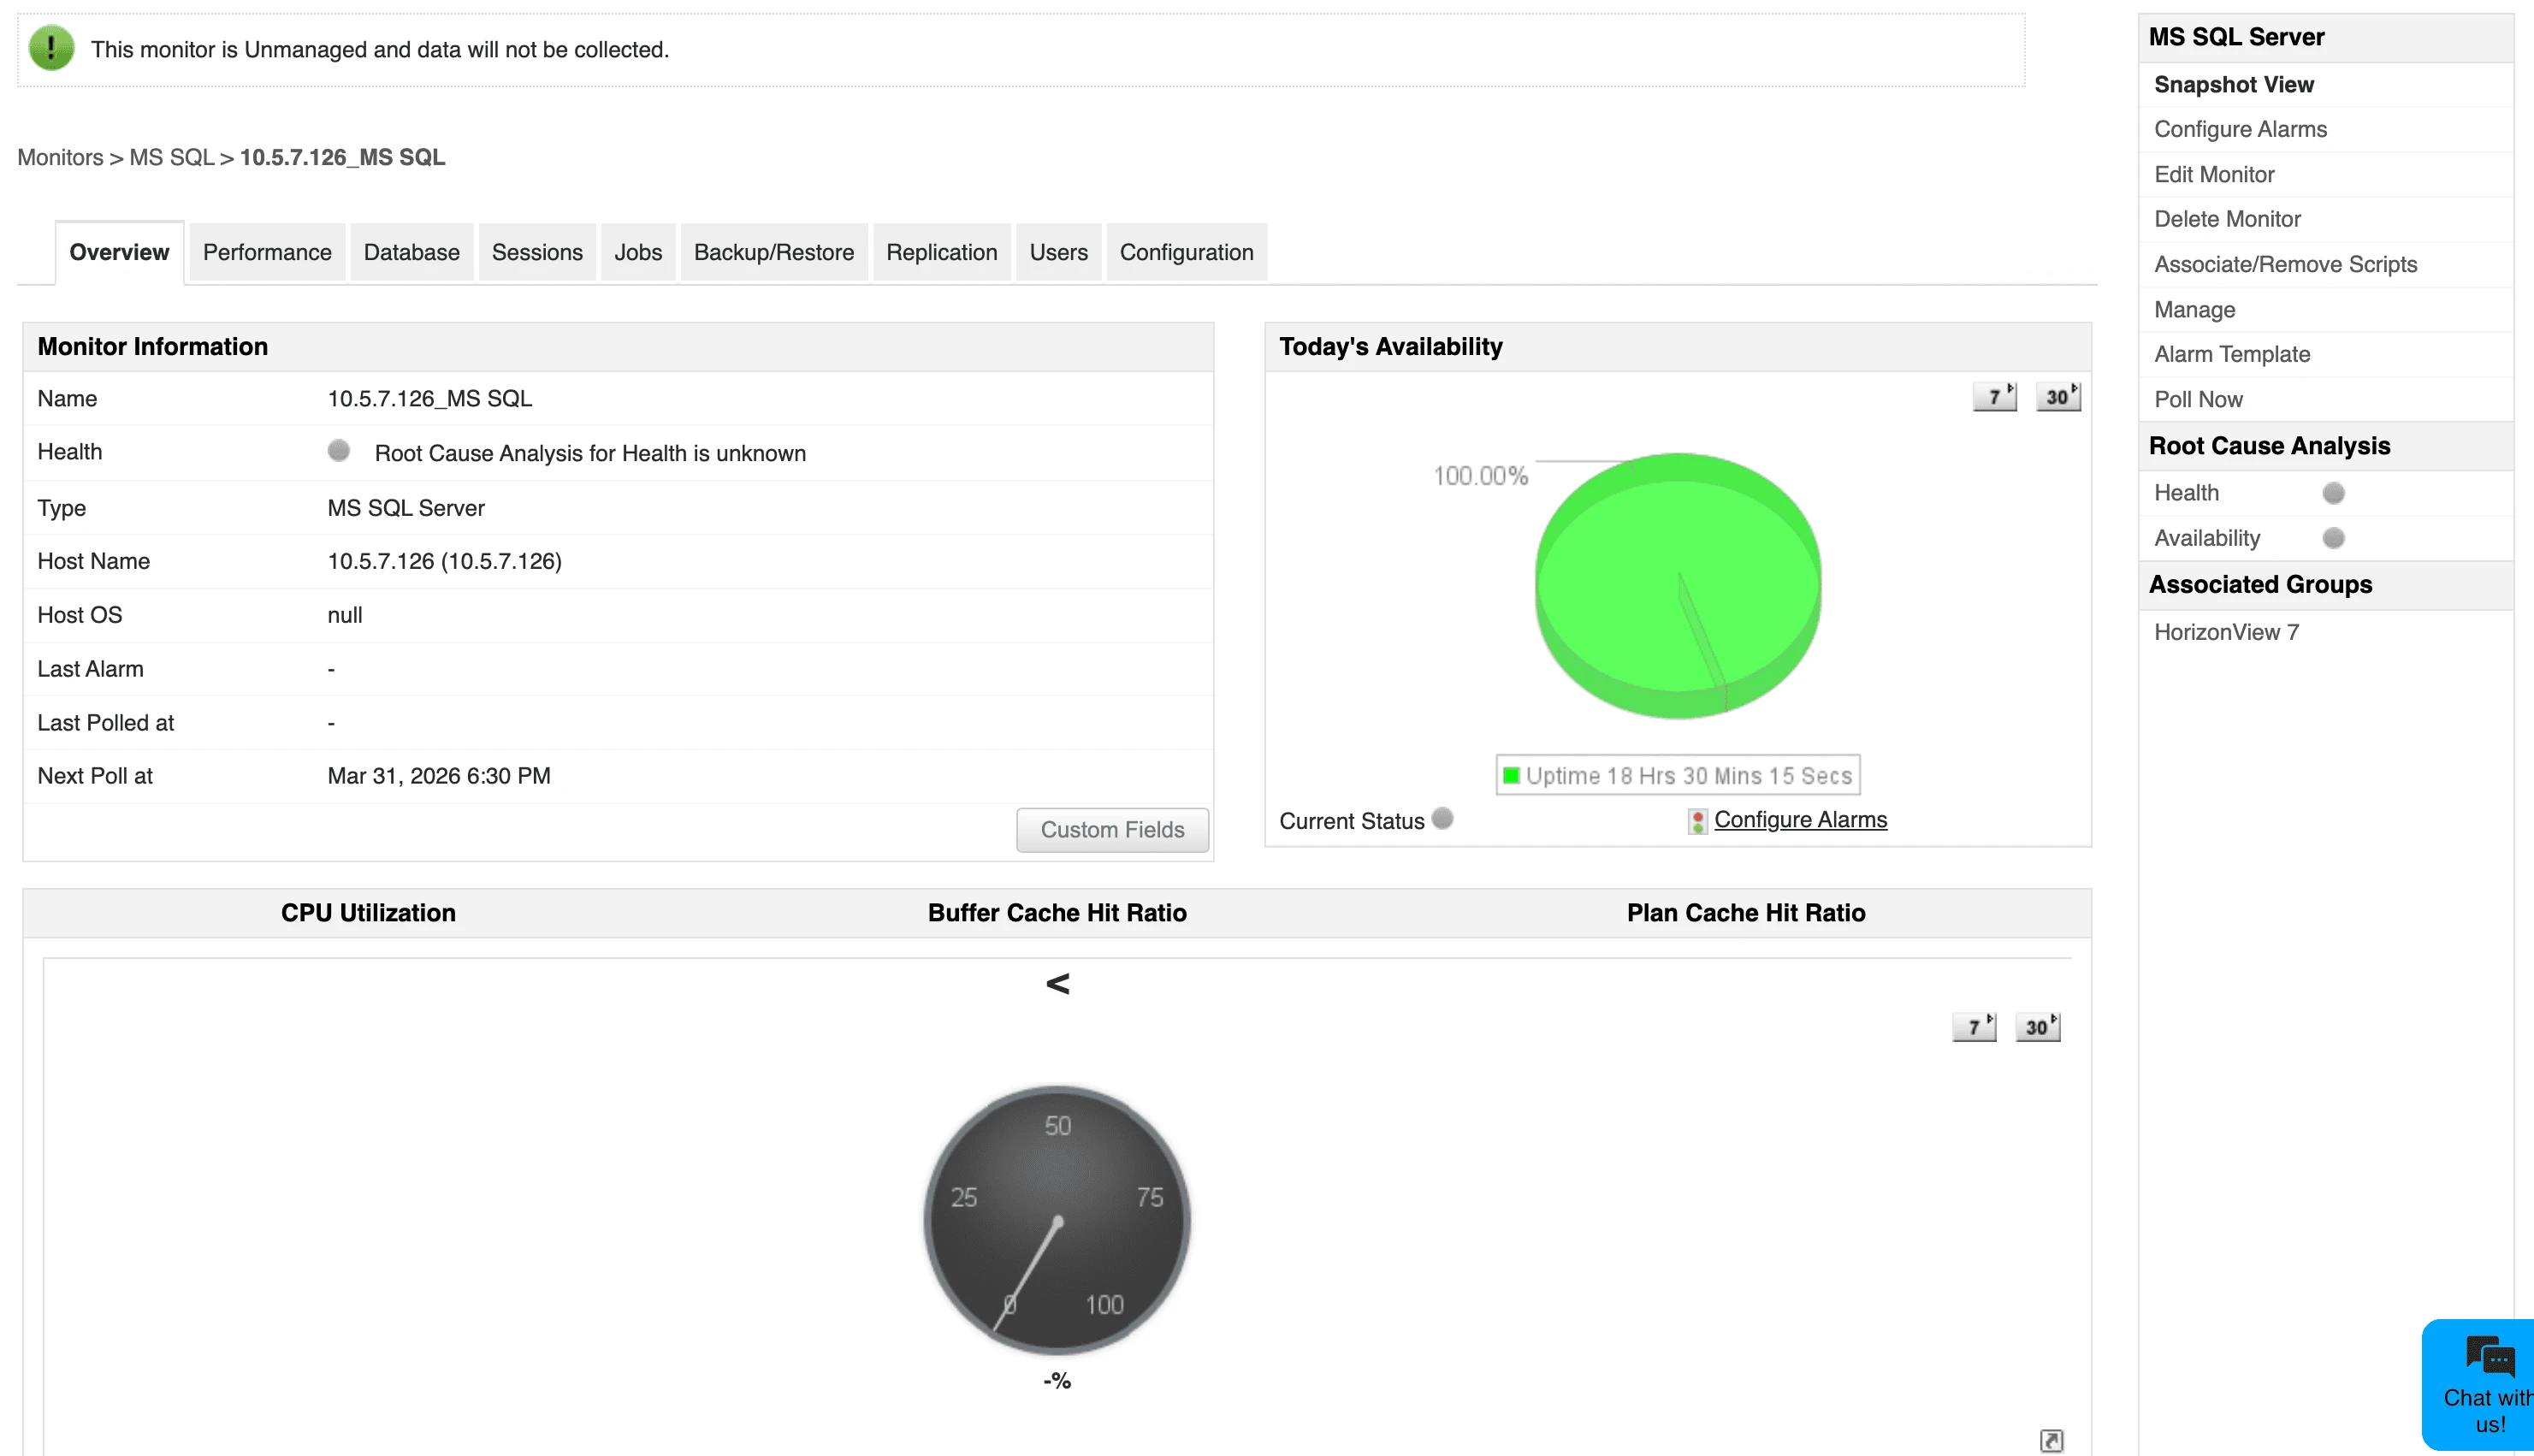
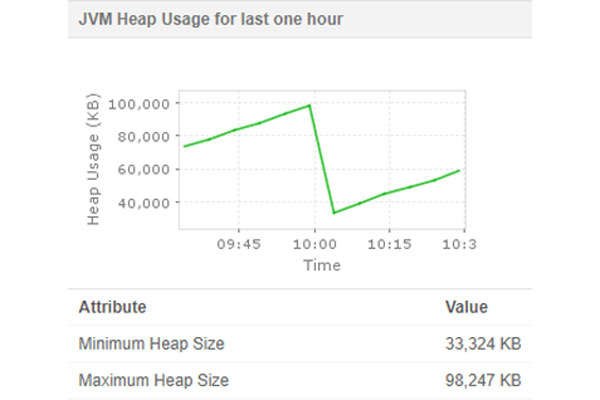
Smart sampling and JVM metrics in APM Insight
Optimize your application performance tracking with smart sampling and enhanced JVM metric collection. Capture critical background transactions and asynchronous calls without impacting application overhead.
Learn more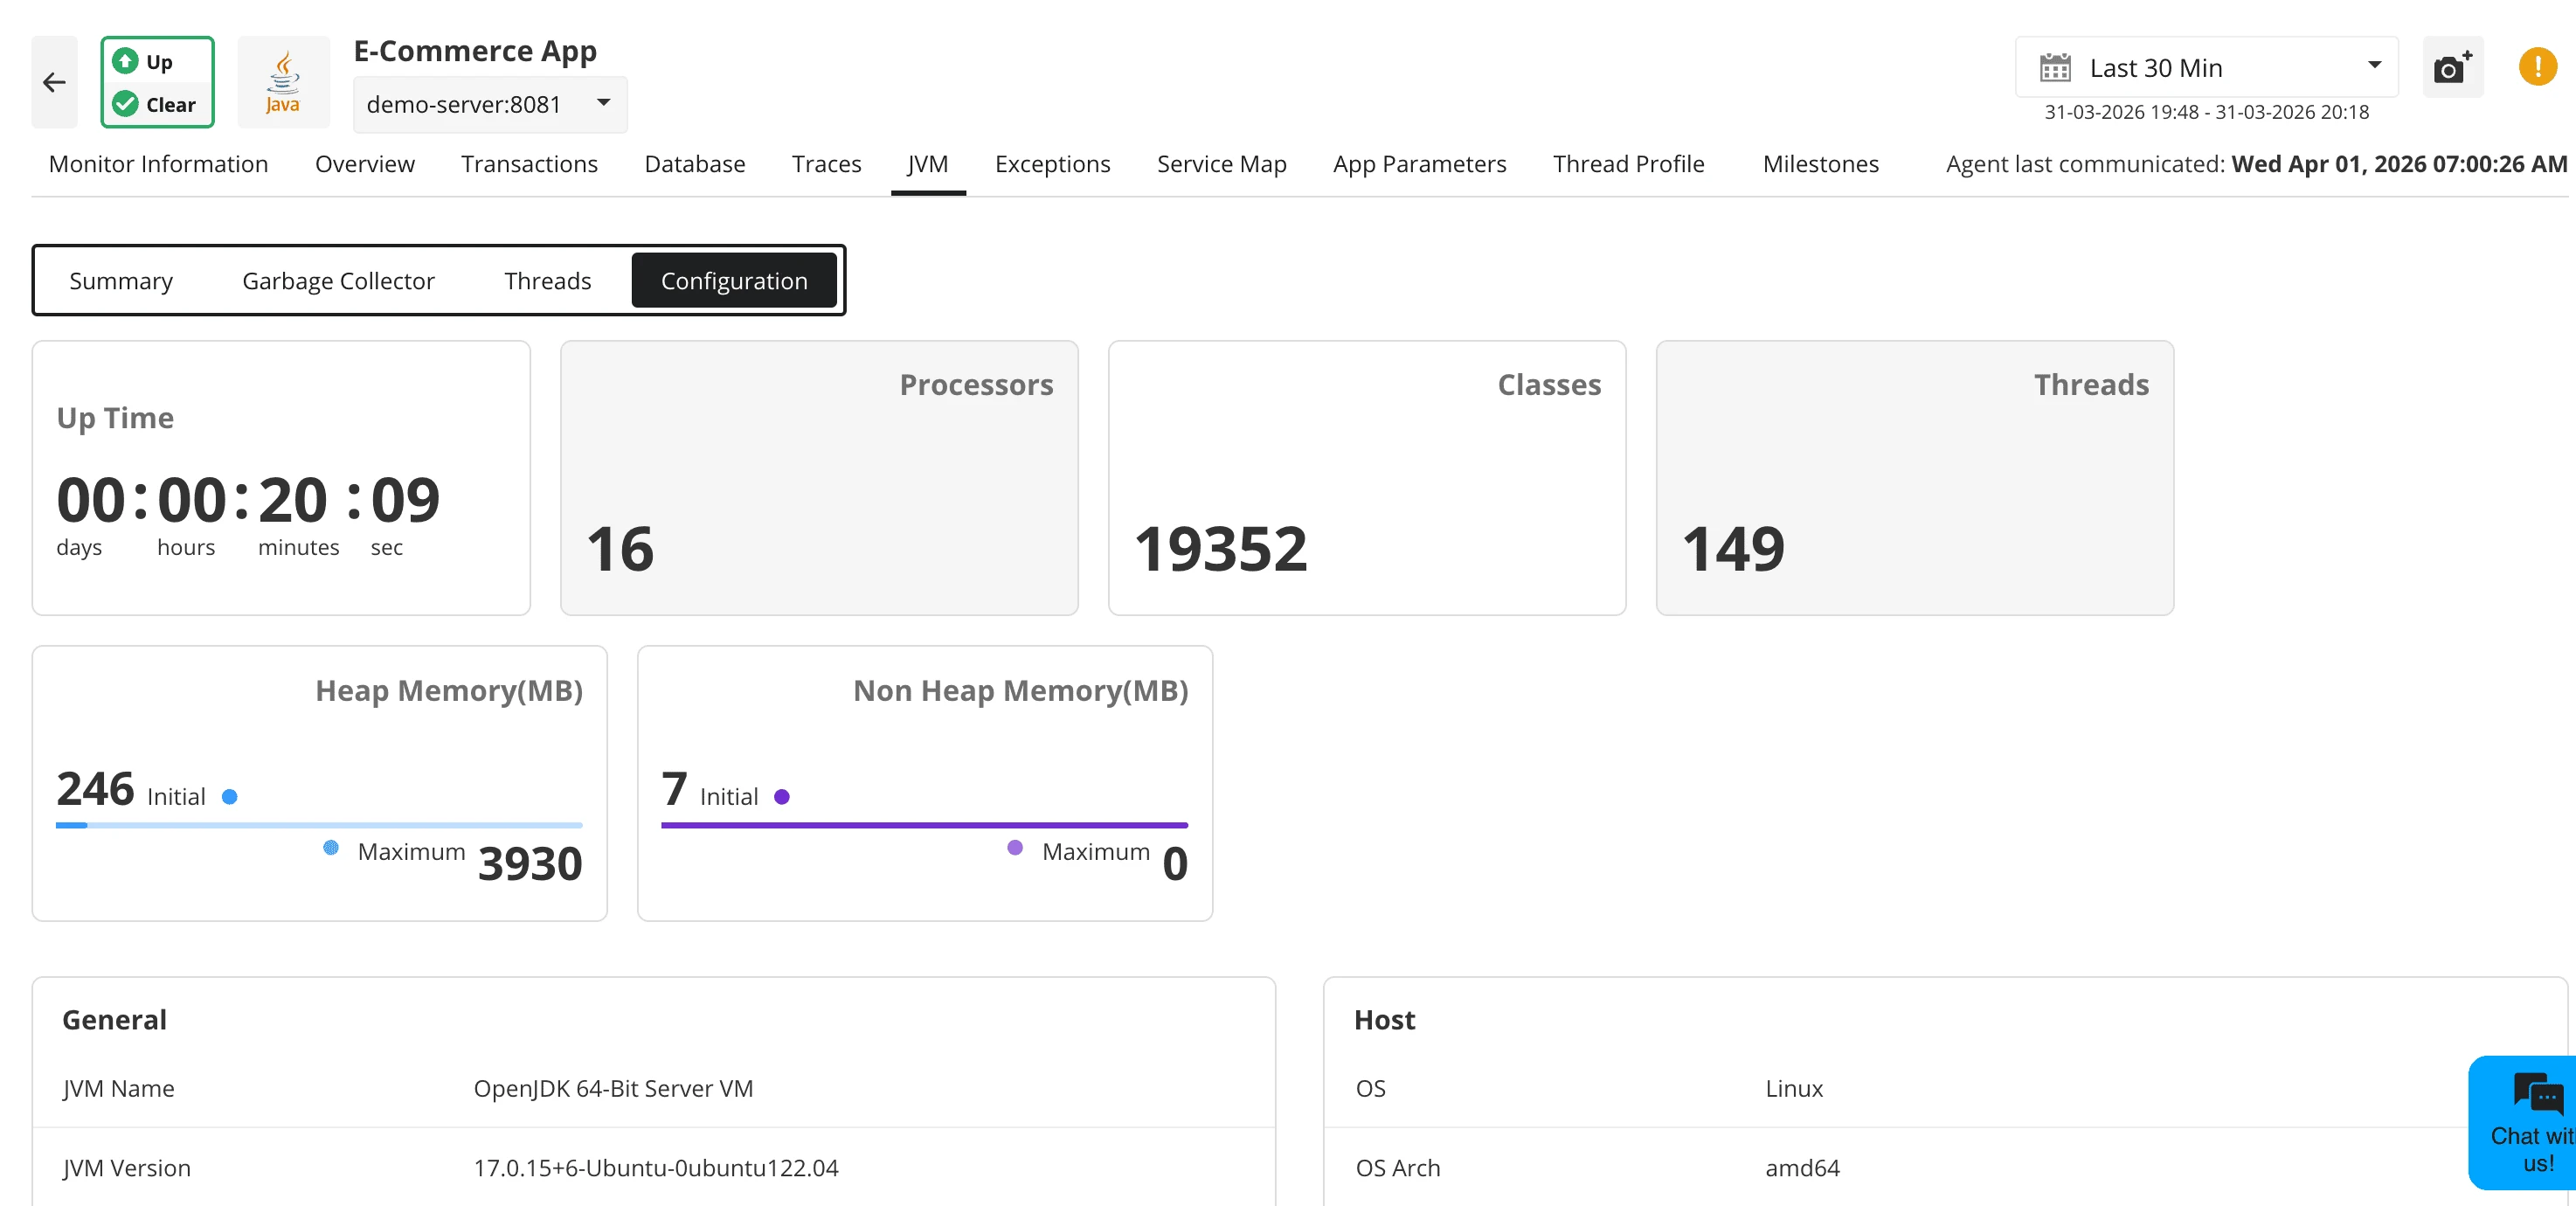
Enhanced SSL/TLS certificate visibility
You can now view full certificate chains and cipher details directly within the SSL/TLS monitor, making it easier to identify weak security configurations before they become a risk.
Learn more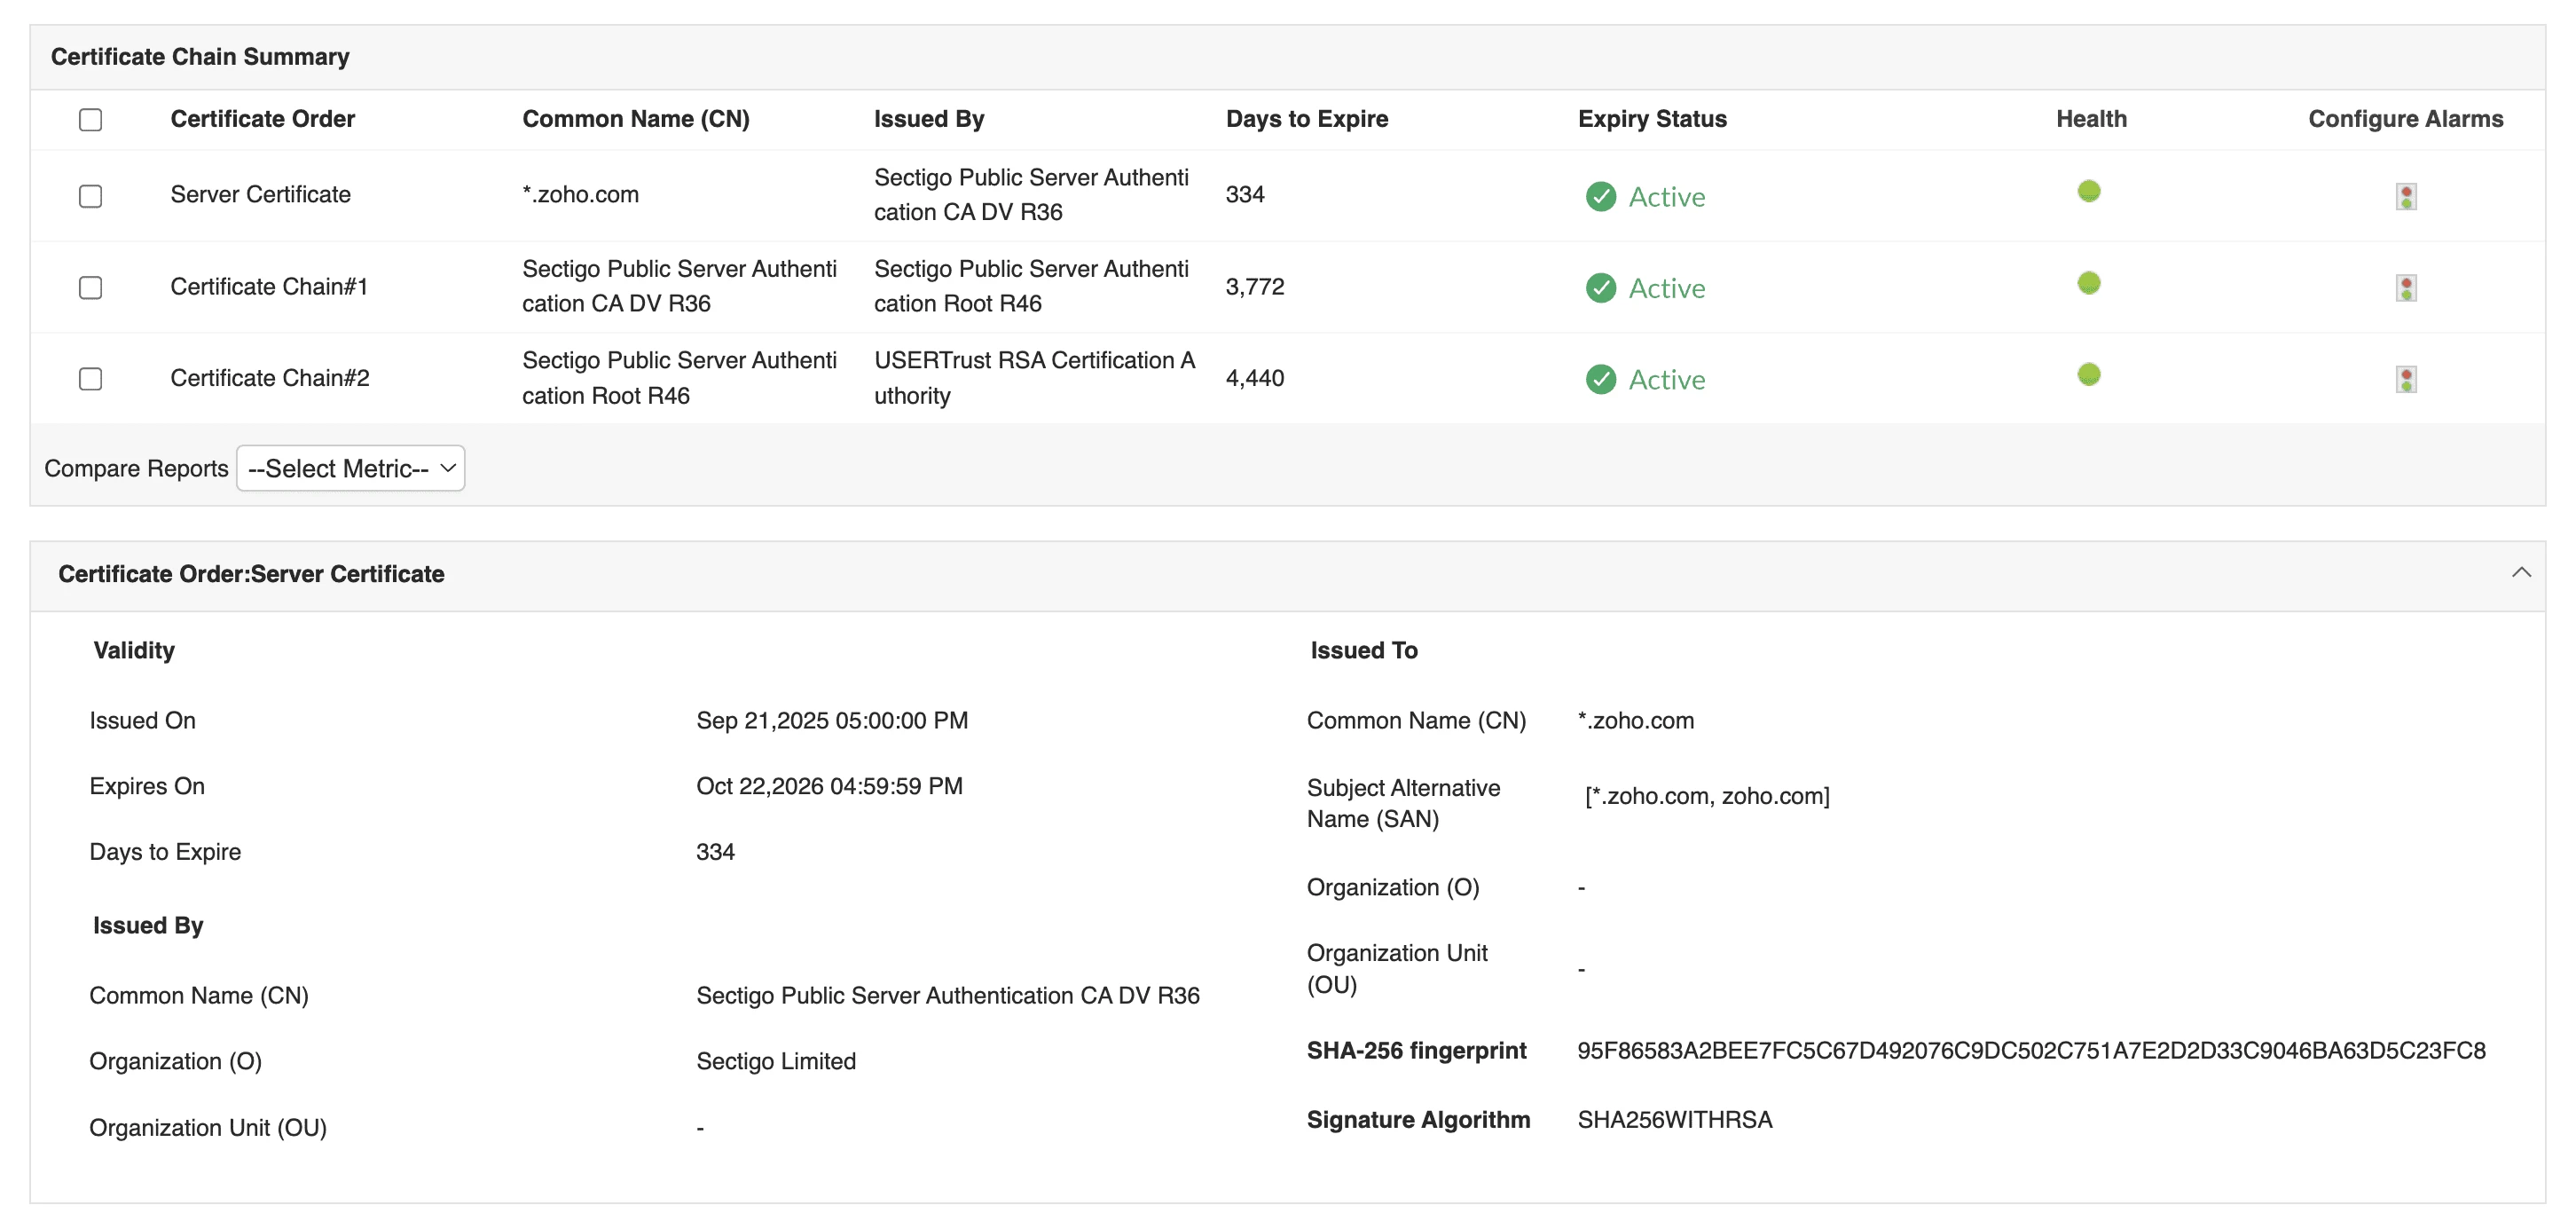
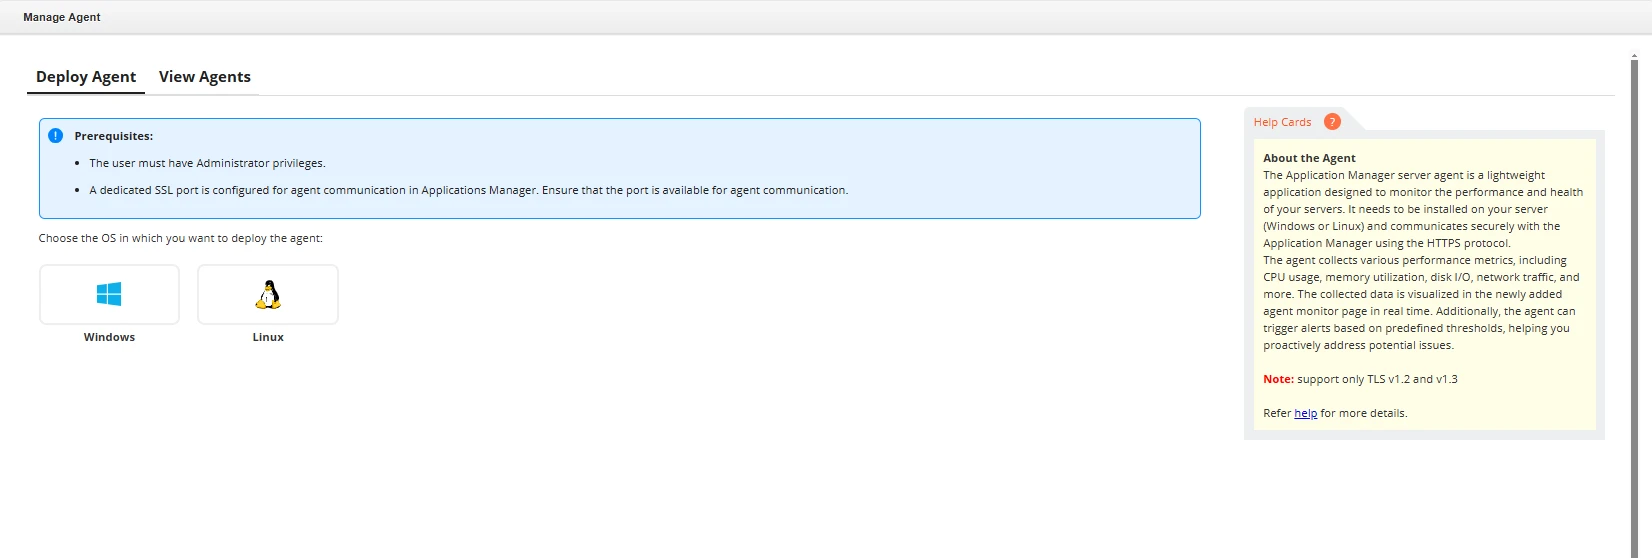
Agent-based server monitoring
Custom integration with third-party tools
Integrate with third-party tools for incident management and event management (eg: MoogSoft) and chat (eg: MS Teams).
Applications Manager version 17
Experience improved performance and security with a major architectural leap. This version features an upgraded bundled PostgreSQL 15.5 database and enhanced middleware components to power your monitoring at scale.
Learn more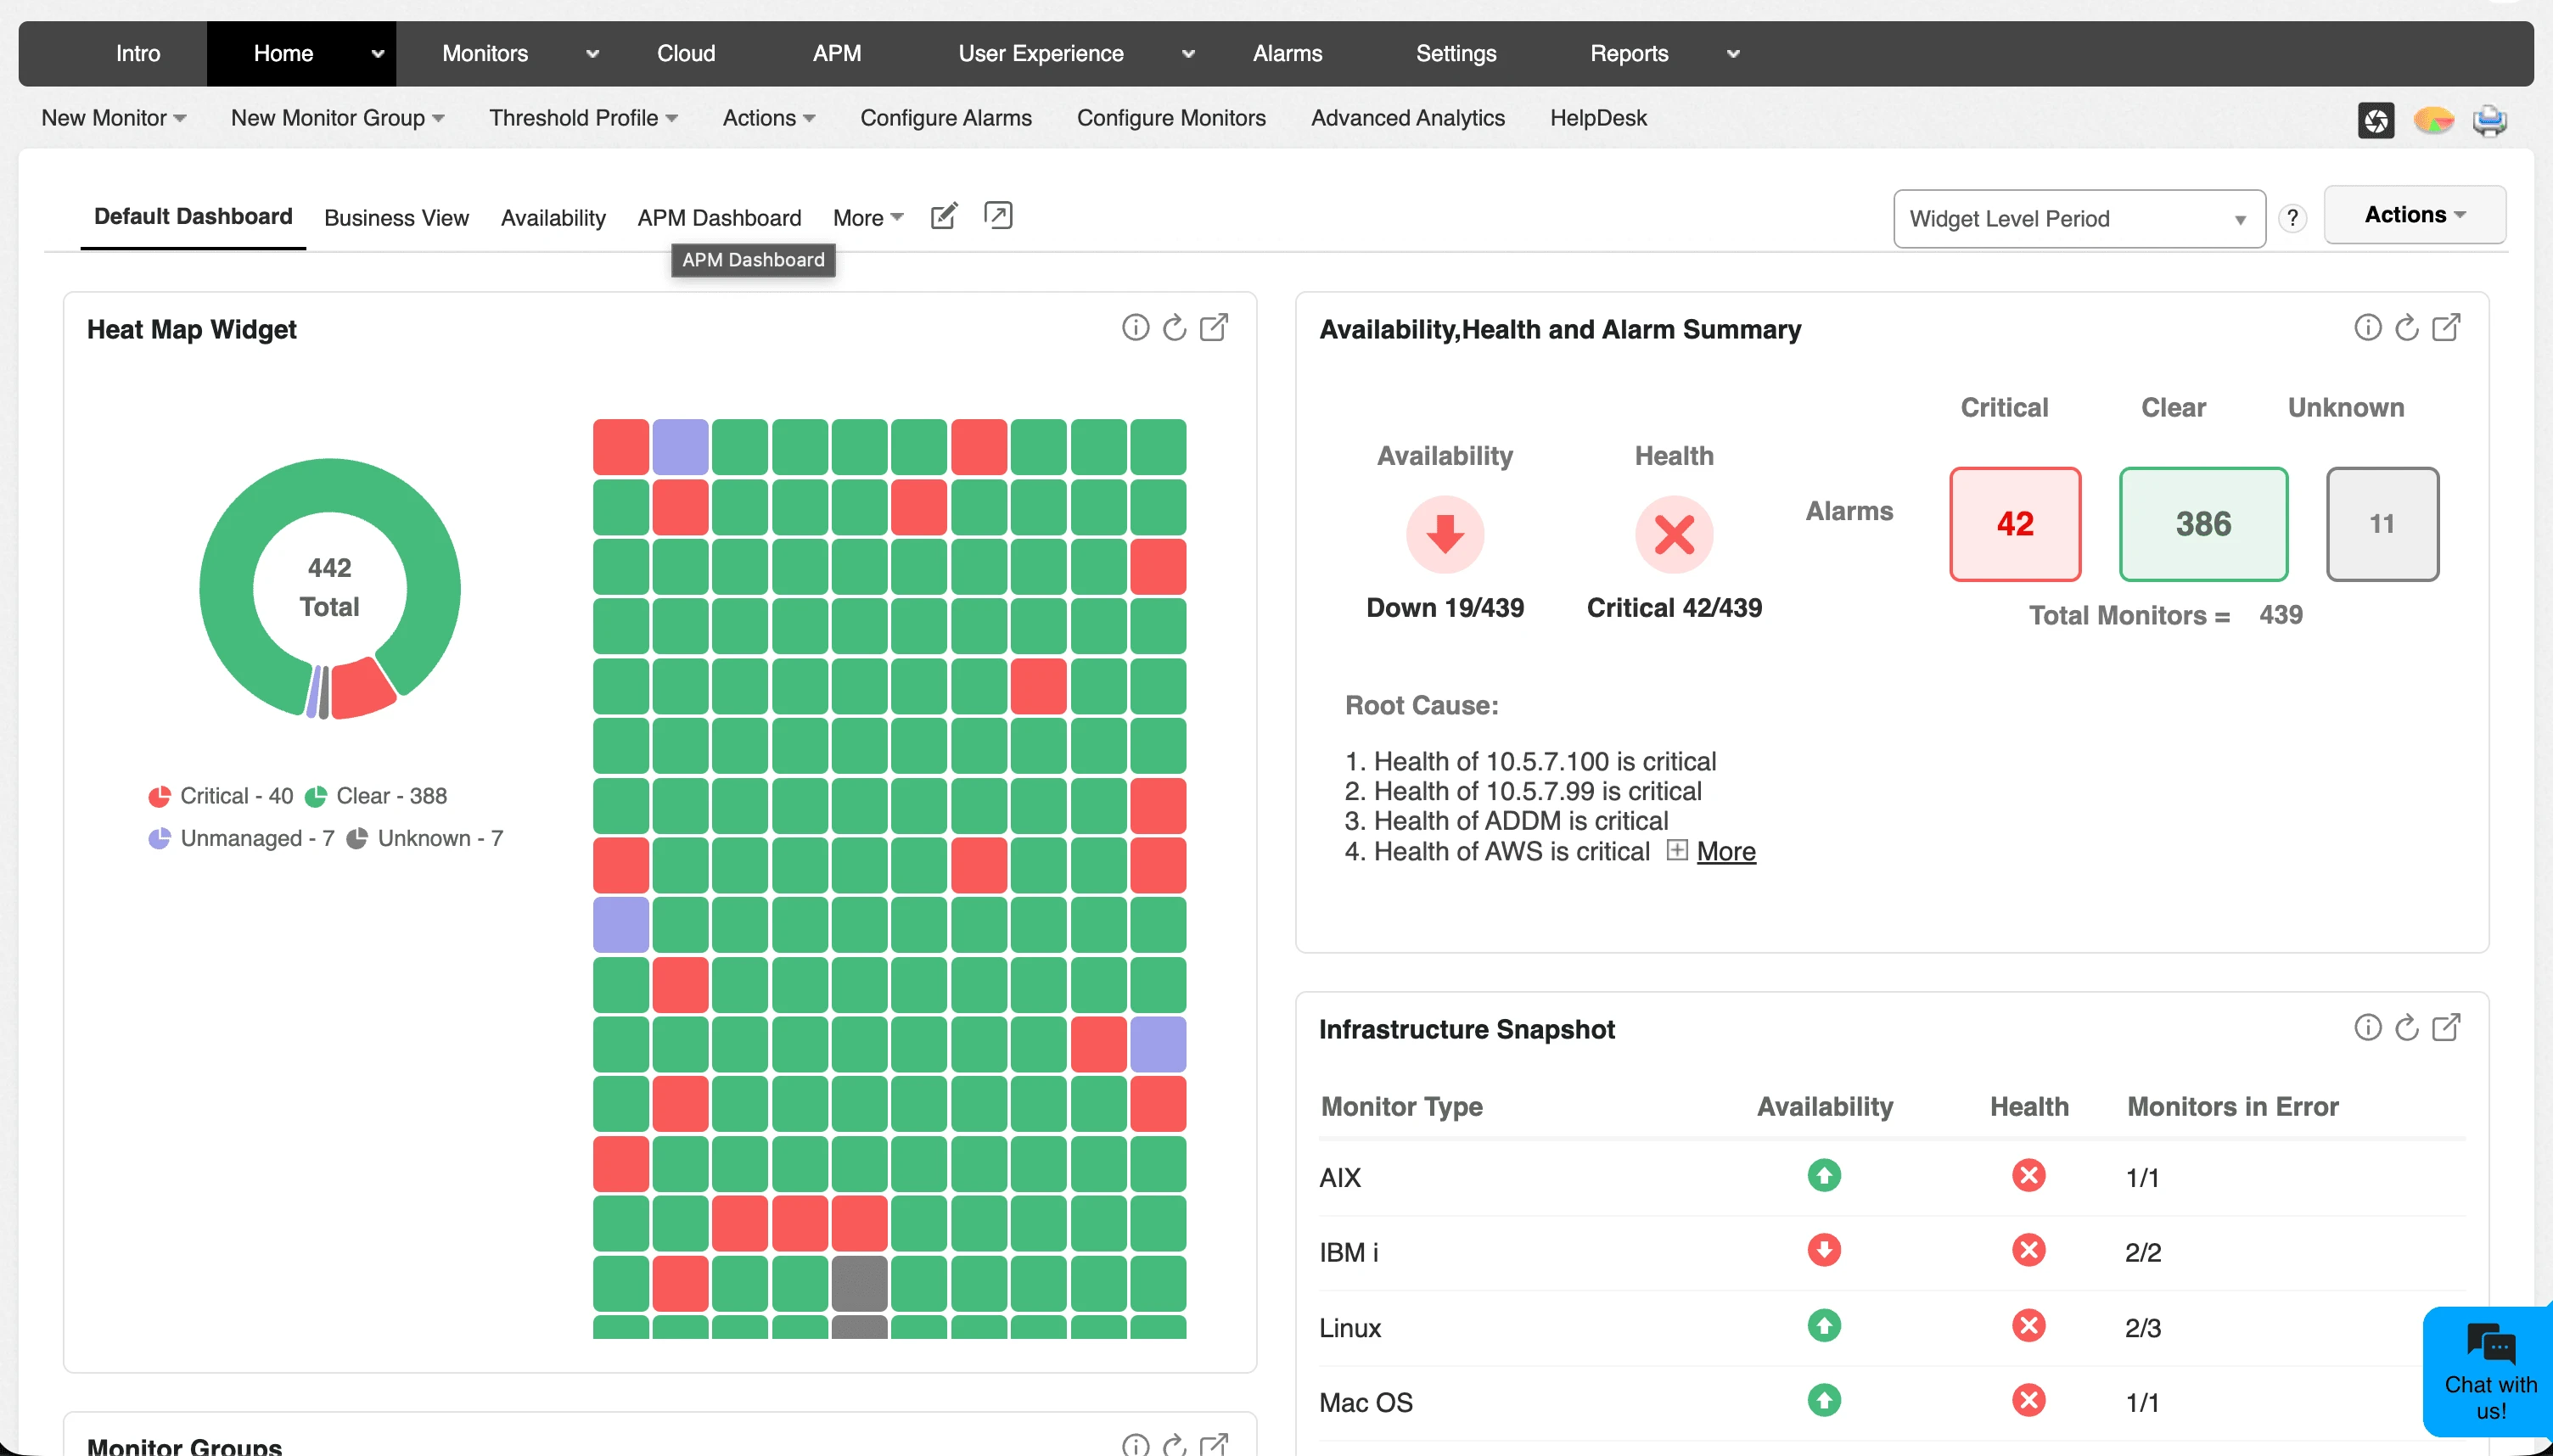
Comprehensive Azure observability
Gain end-to-end visibility into your Azure cloud infrastructure. Monitor the health and performance of more than 50 Azure services including Application Gateways, Firewalls, ExpressRoute Circuits, and Virtual Network Gateways in real-time.
Learn more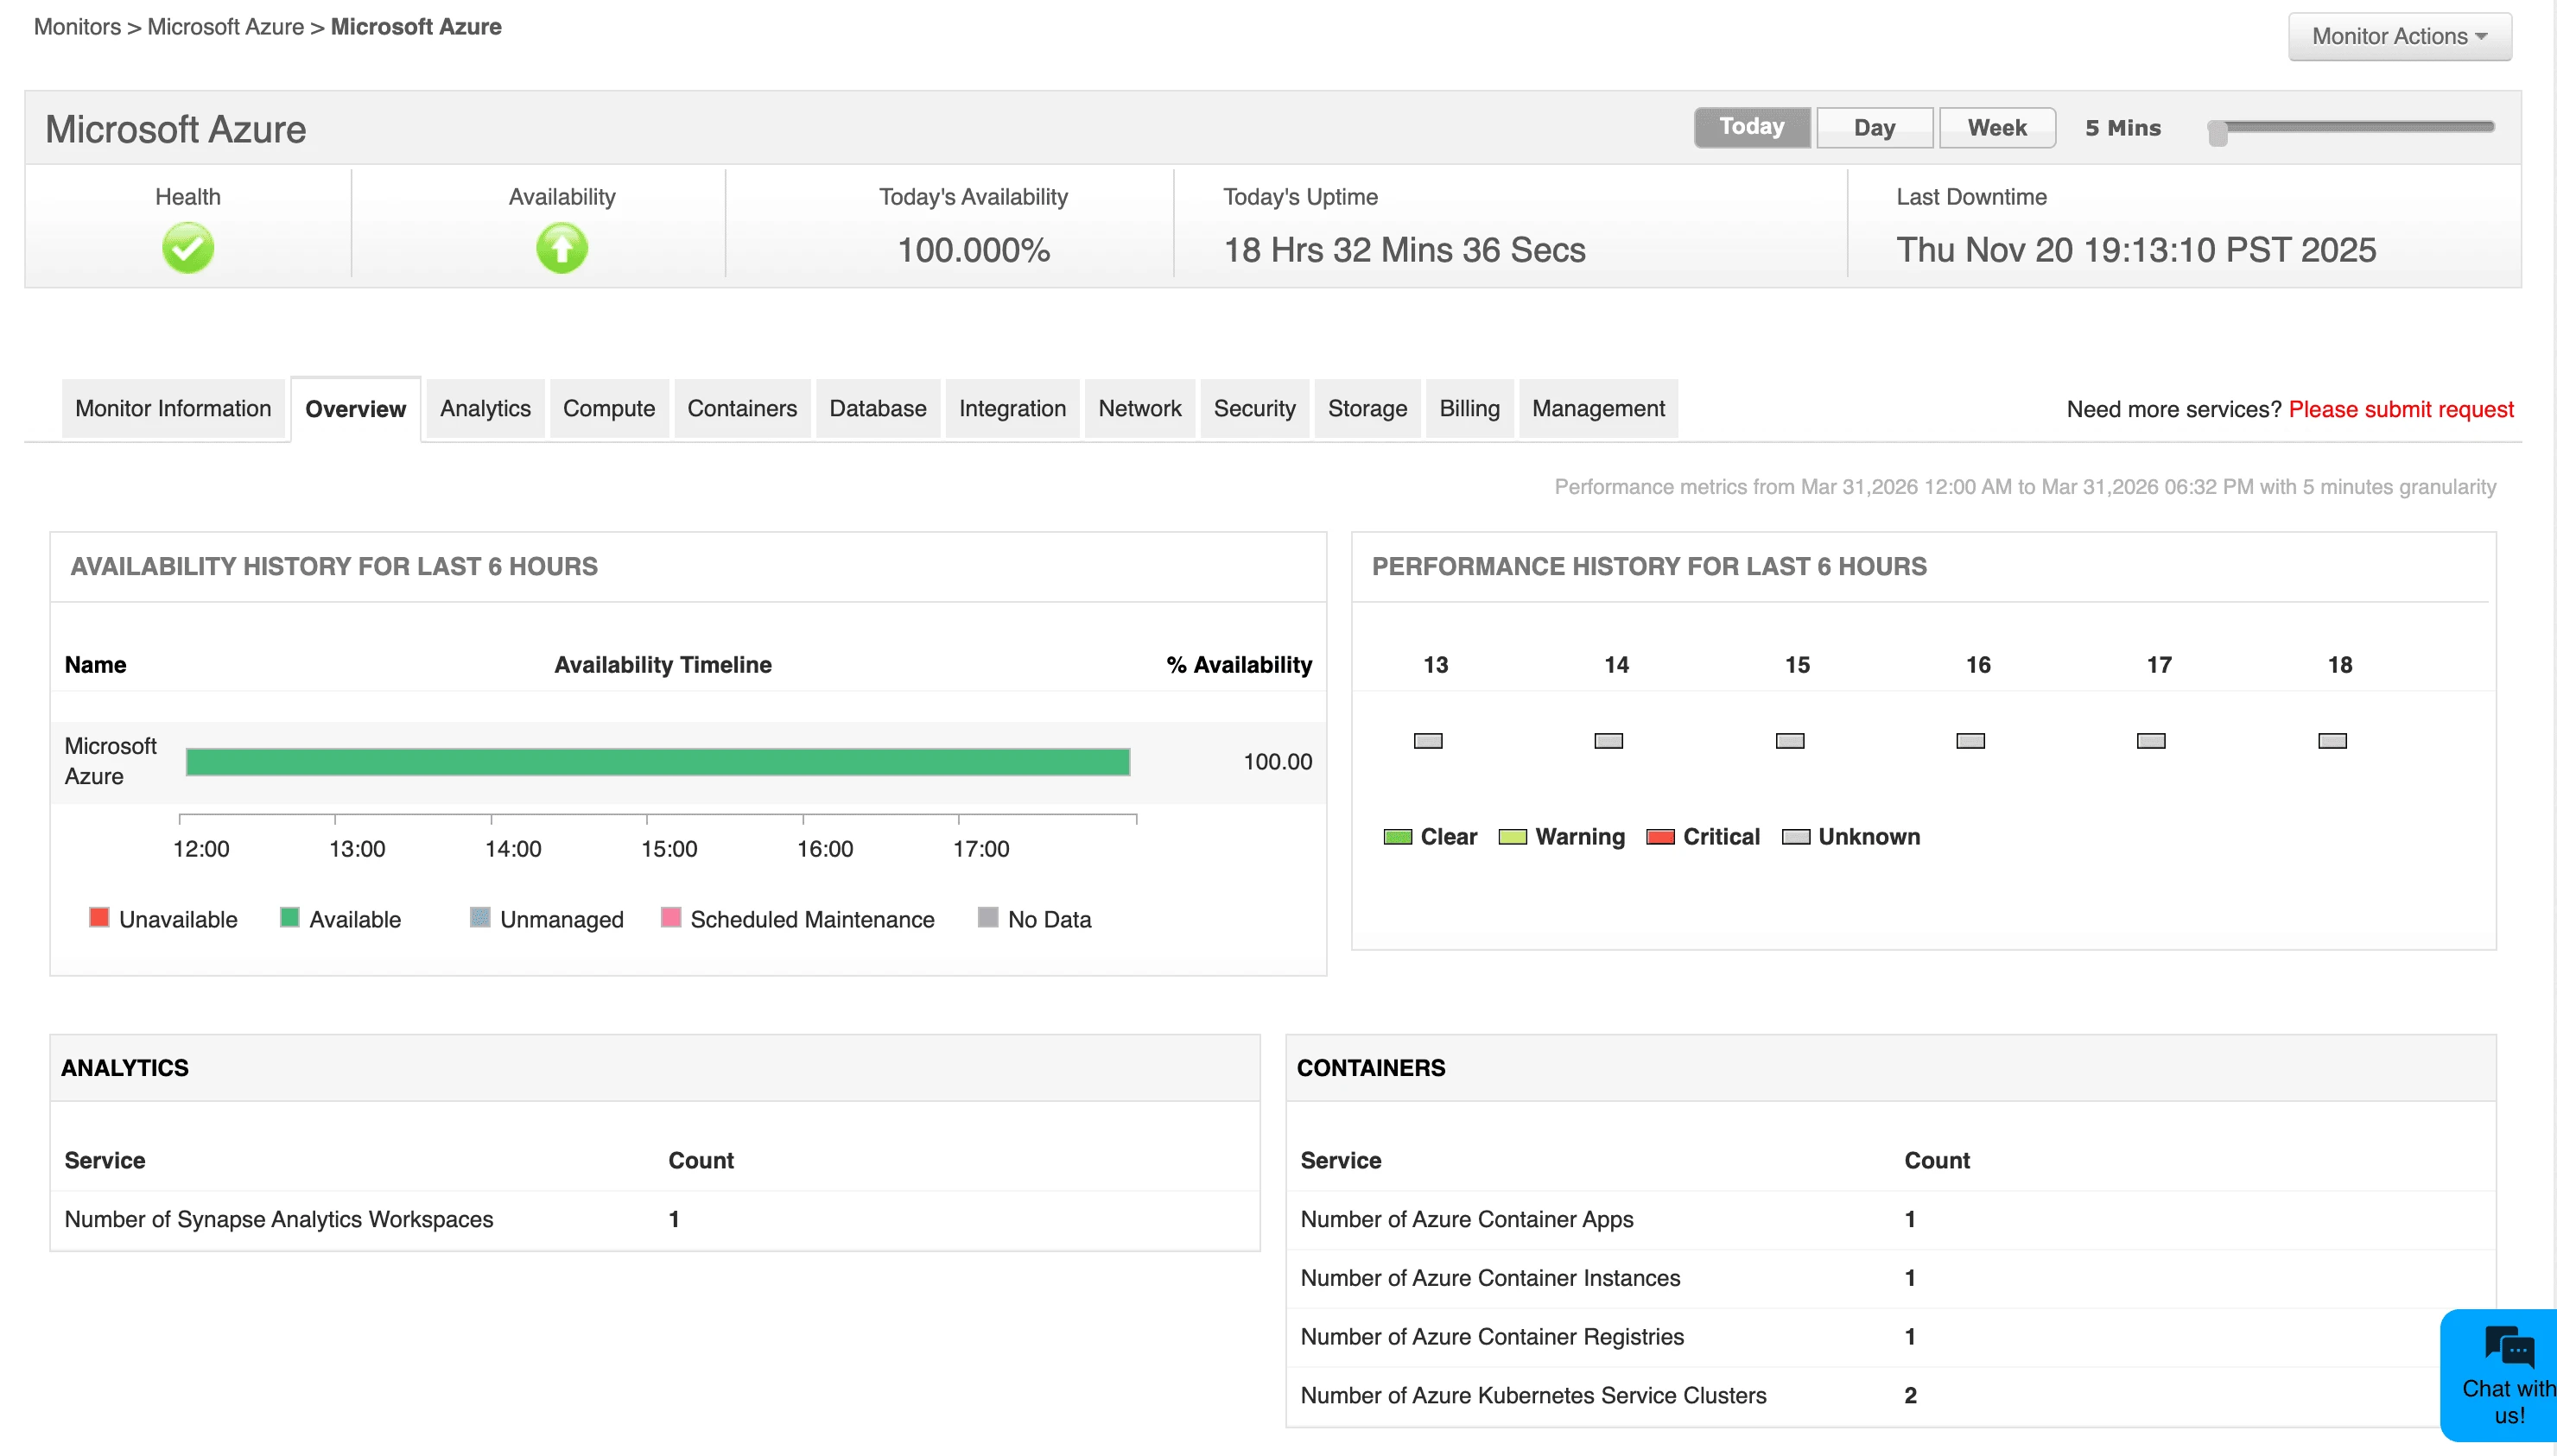
Kingbase Database Monitoring
Expand your database monitoring portfolio with comprehensive support for Kingbase. Analyze critical performance metrics in real-time to ensure the reliability and efficiency of your data operations.
Learn more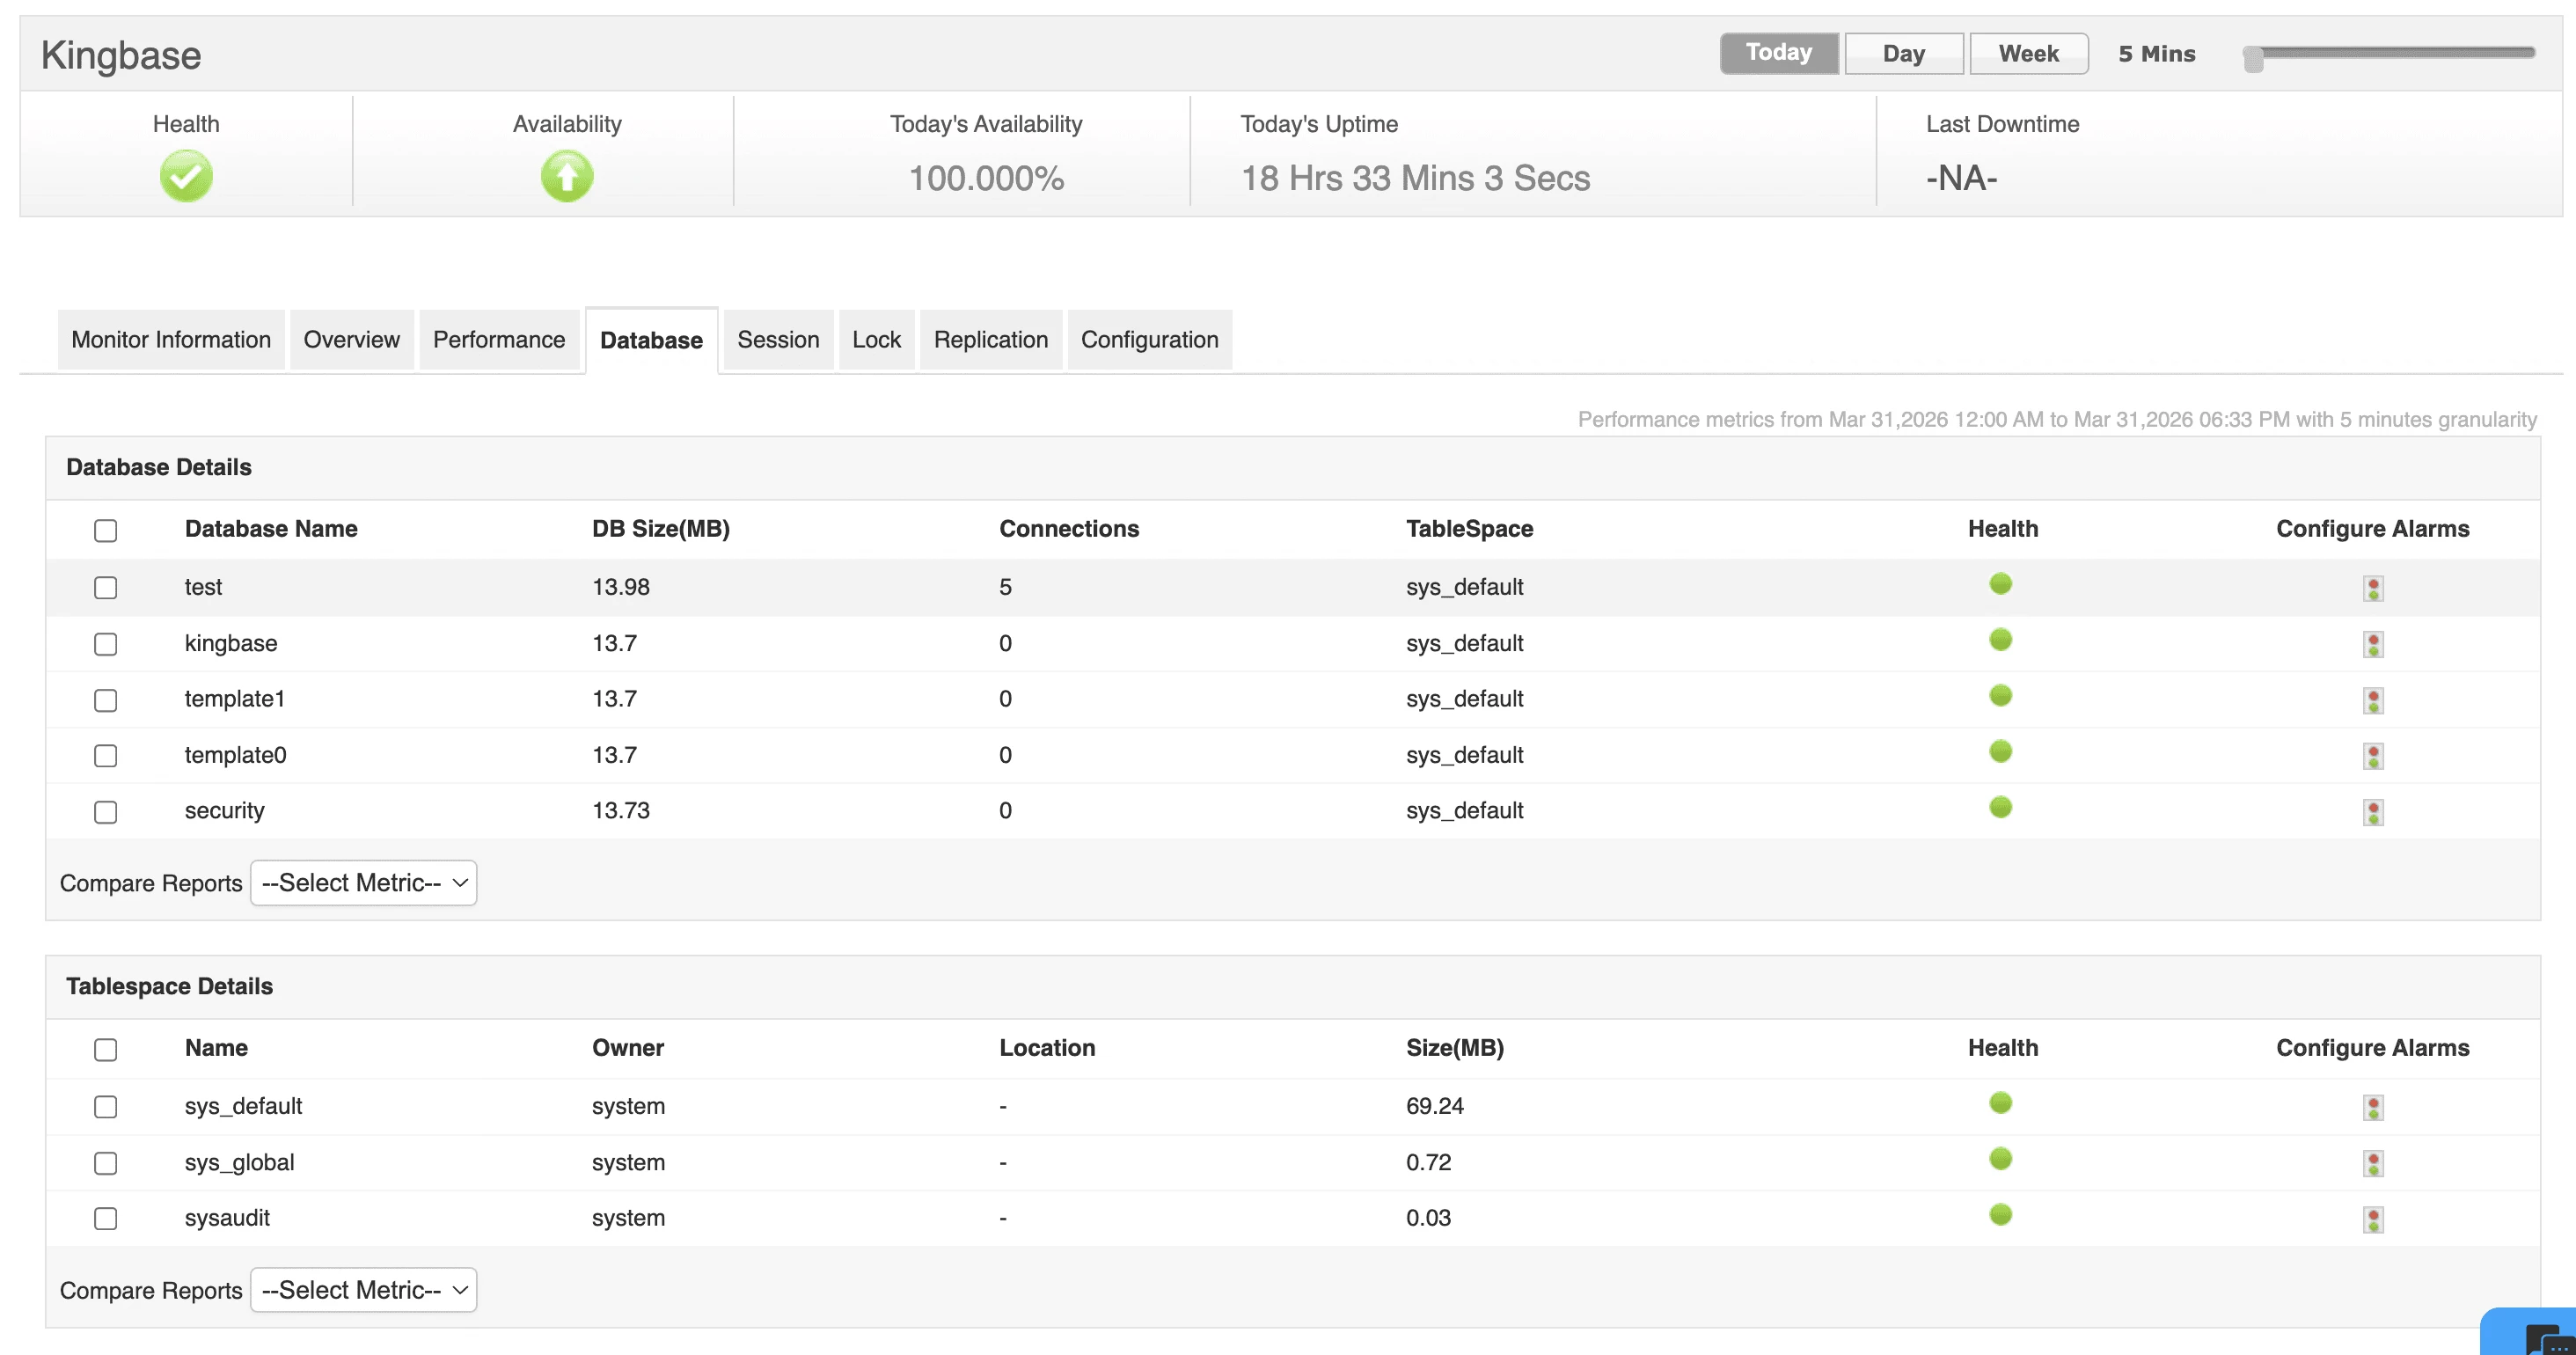
Intelligent Application Discovery (ADDM) Enhancements
Simplify your monitoring setup with expanded ADDM support. Automatically discover MaxDB, SQL Anywhere, IBM WebSphere MQ, LDAP, and DNS monitors, ensuring your entire IT landscape is mapped and monitored.
Learn more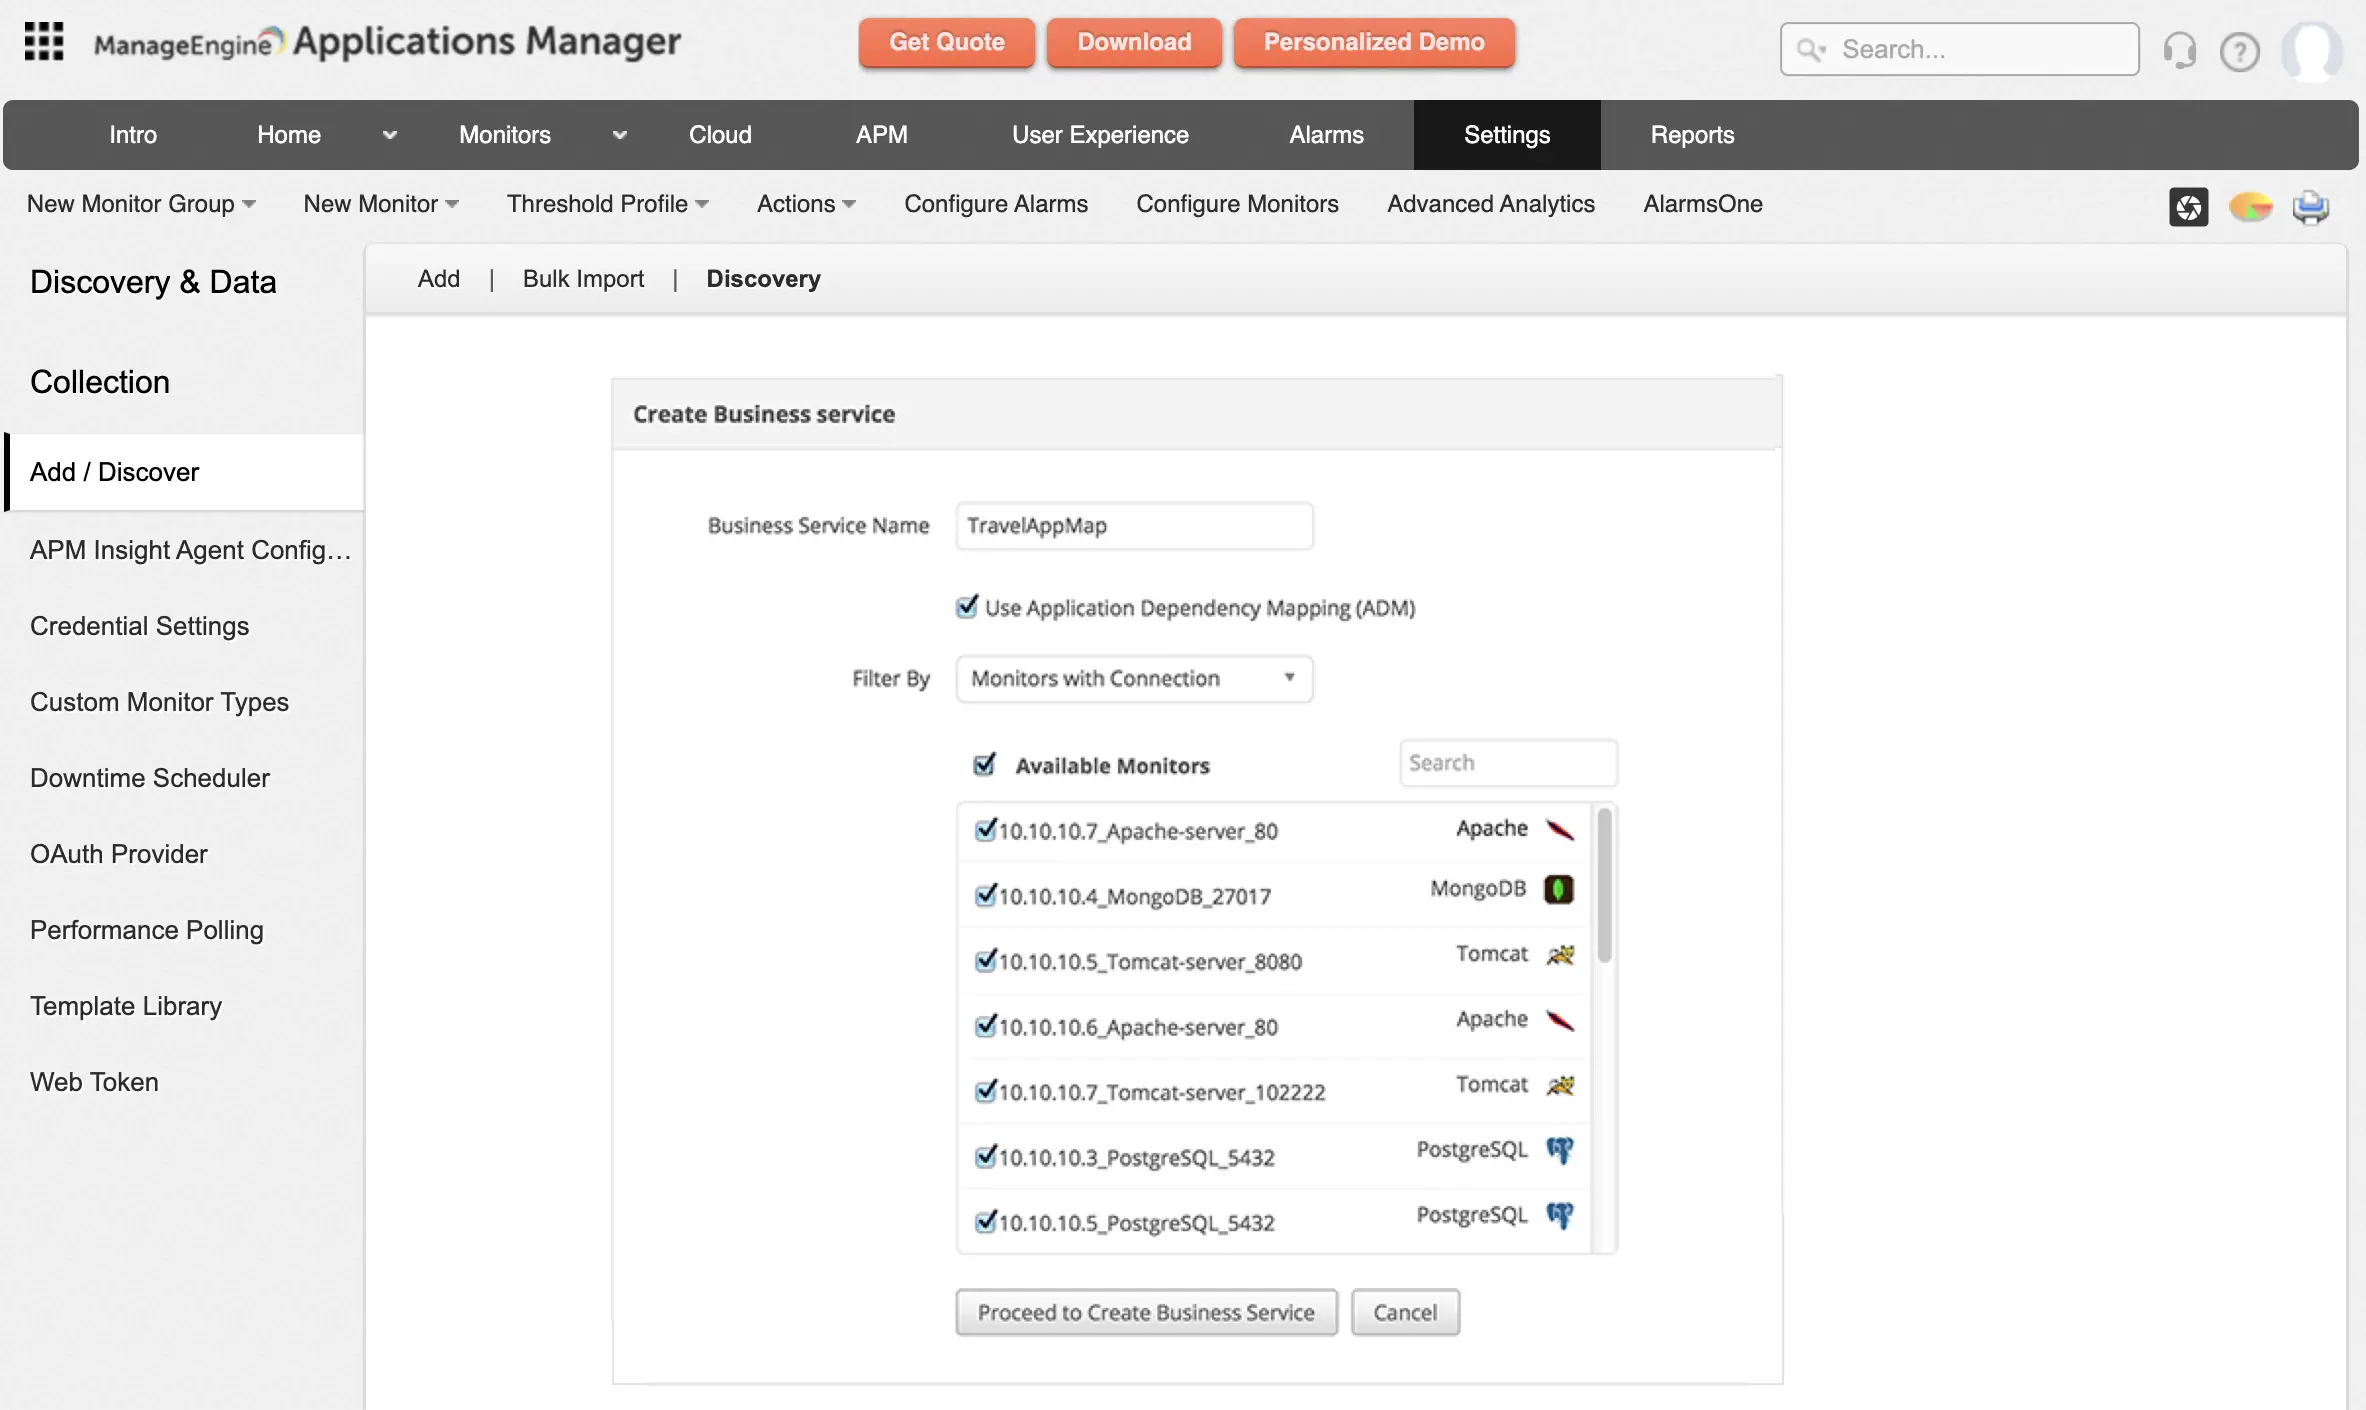
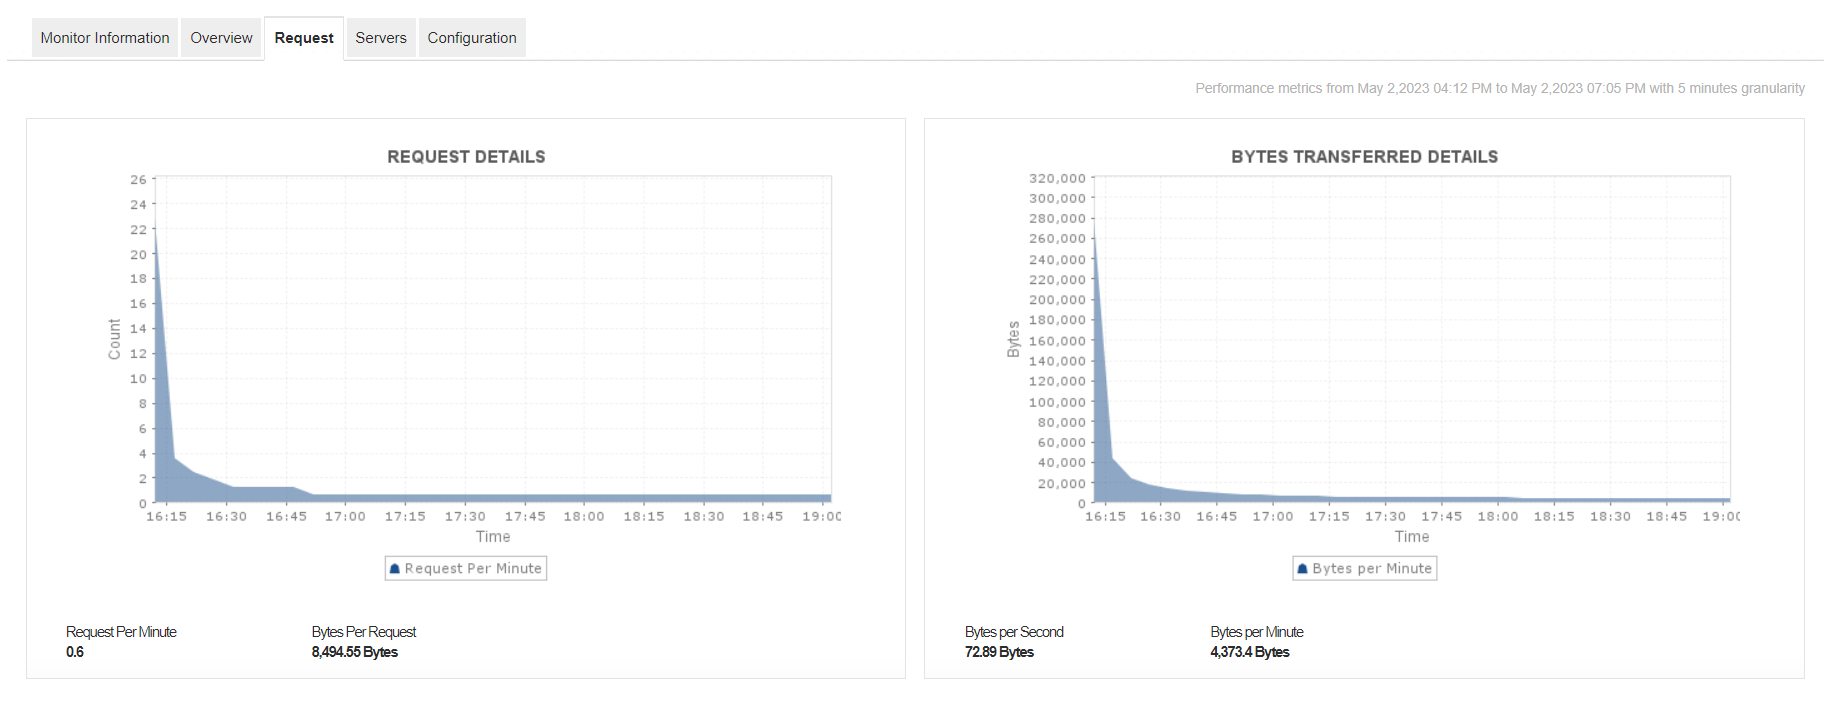
Proactively monitor your IBM HTTP servers
Track critical KPIs of your IBM HTTP server, and identify & troubleshoot performance issues before they become critical.
APM Insight gets a new look
APM Insight has been revamped to improve user-friendliness and intuitiveness. Experience seamless navigation and visualization of performance data!
More security!
We have now migrated and upgraded from Oracle 1.8.0_202 JRE to Azul Zulu 1.8.0_352 JRE for better security! Tomcat has also been upgraded from 9.0.16 to 9.0.70.

Virtual IP address support for failover
Configure Applications ManagerÍs dual server failover system to ensure constant monitoring and availability of your business-critical applications!

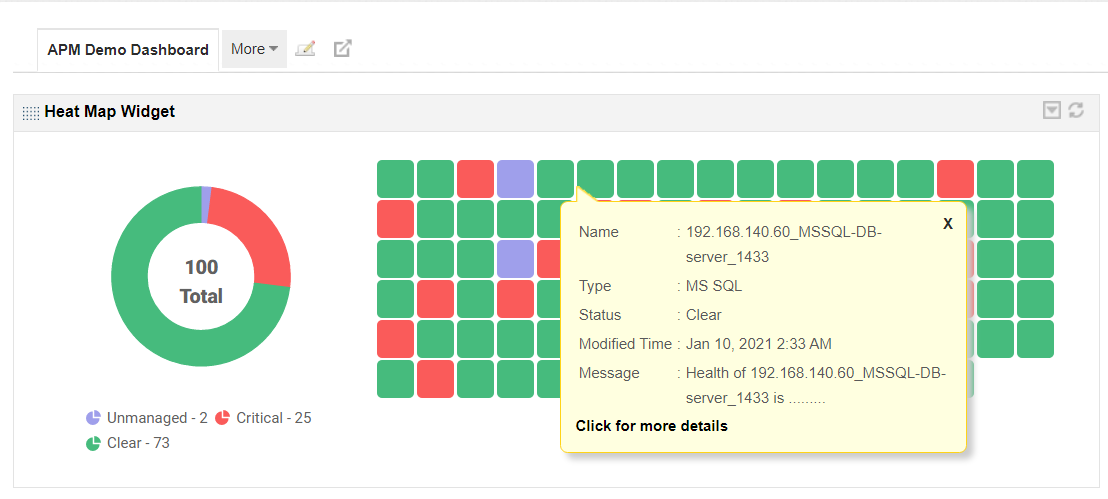
More Widget Options
You can now access the Alarm tab while clicking on the Summary Chart in Heat Map and Monitor Status Overview widget. You can filter Monitor Groups in the 'Availability, Health and Alarm Summary' widget.

ADDM gets an upgrade
You can now auto-discover MS SQL monitor in Applications Manager Standalone and Plugin!

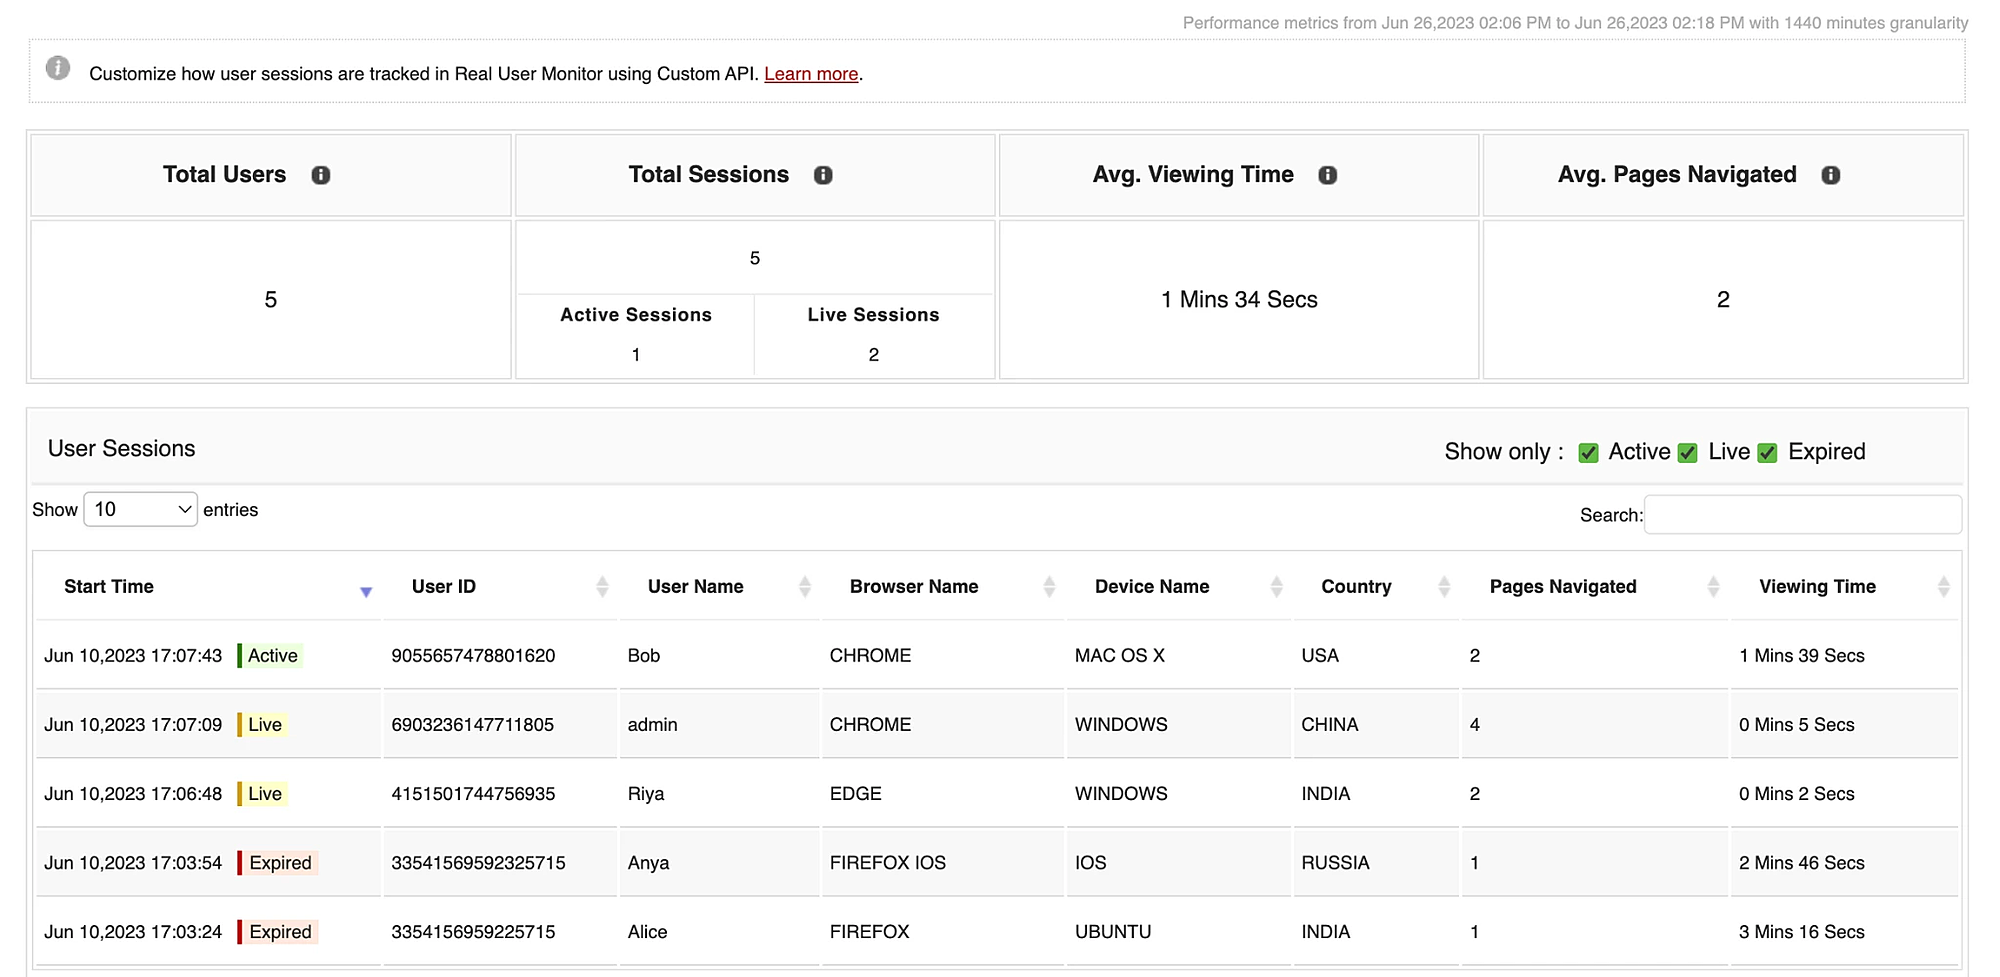
RUM gets enhanced
You can now categorize live, active and expired user session status in Real User Monitor.
Support for ServiceDesk Plus MSP v13000
Applications Manager has now been enhanced to support integration with the upgraded ServiceDesk Plus MSP 13000 version.

Extensive Azure Kubernetes monitoring
Monitor critical KPIs of Azure Kubernetes Service. Become aware of pod details at both the namespace and cluster level.
Learn more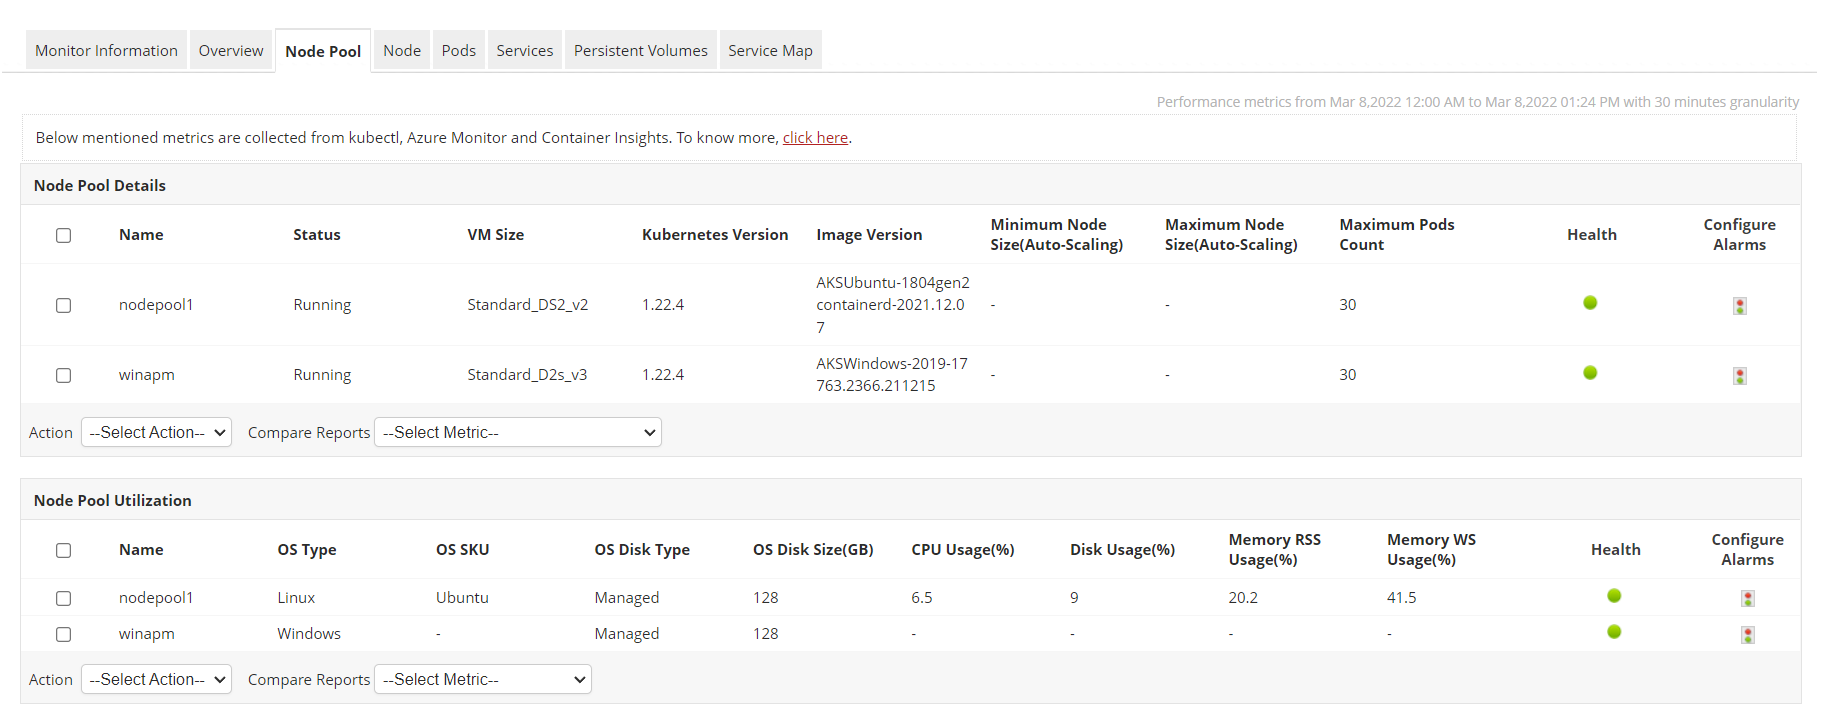
Rest API Sequence monitoring simplified
Test the availability of multiple APIs in a single session.Monitor critical KPIs to analyze the responsiveness of the application.
Learn more
More Widget Options for APM Plugin
You can now create the following widgets of APM Plugin monitors in OpManager dashboard:
- Applications Health & Availability
- Application Monitors HeatMap
- Application Monitors Summary
- Application Monitor Groups Summary
- Application Monitor Groups Tree view
- Application Monitors Status
Easy access of APM Plugin Monitor reports
You can now access APM Plugin monitors under Reports->Applications in OpManager.

Support for SAML authentication
Set up an SAML SSO authenticator in Applications Manager to authenticate user identity in your resources with a single set of credentials!
Learn more
Install APM as a wrapper service
You can now install and start Applications Manager as a wrapper service in Linux platforms.

Proactively monitor your Azure Load Balancer
Monitor KPIs of Azure Load balancer. Identify, troubleshoot, and resolve performance issues instantly.
Learn more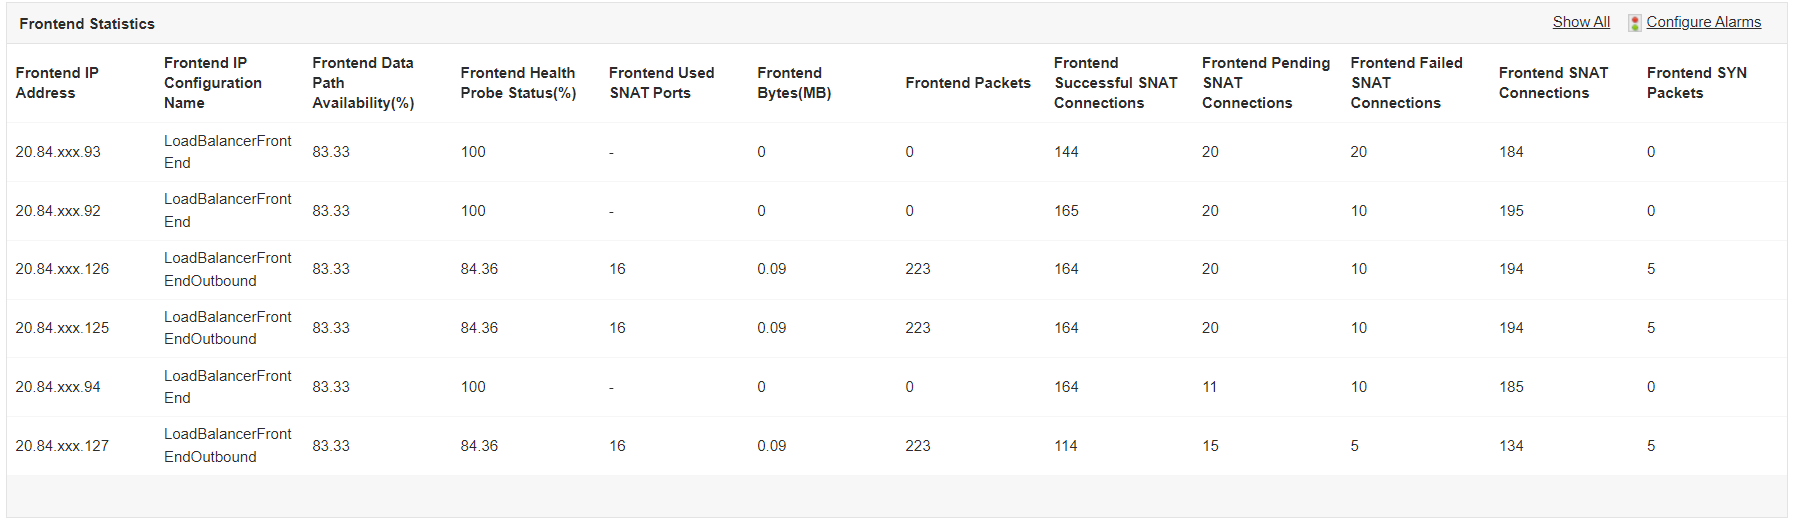
More Widget options
- You can now access the Monitor Errors Status Widget under 'Alarms'. This is available under Home ? Actions ? Add Widgets.
- You can now access the Server Uptime Widget under 'Availability and Health Widgets'. This is available under Home ? Actions ? Add Widgets.
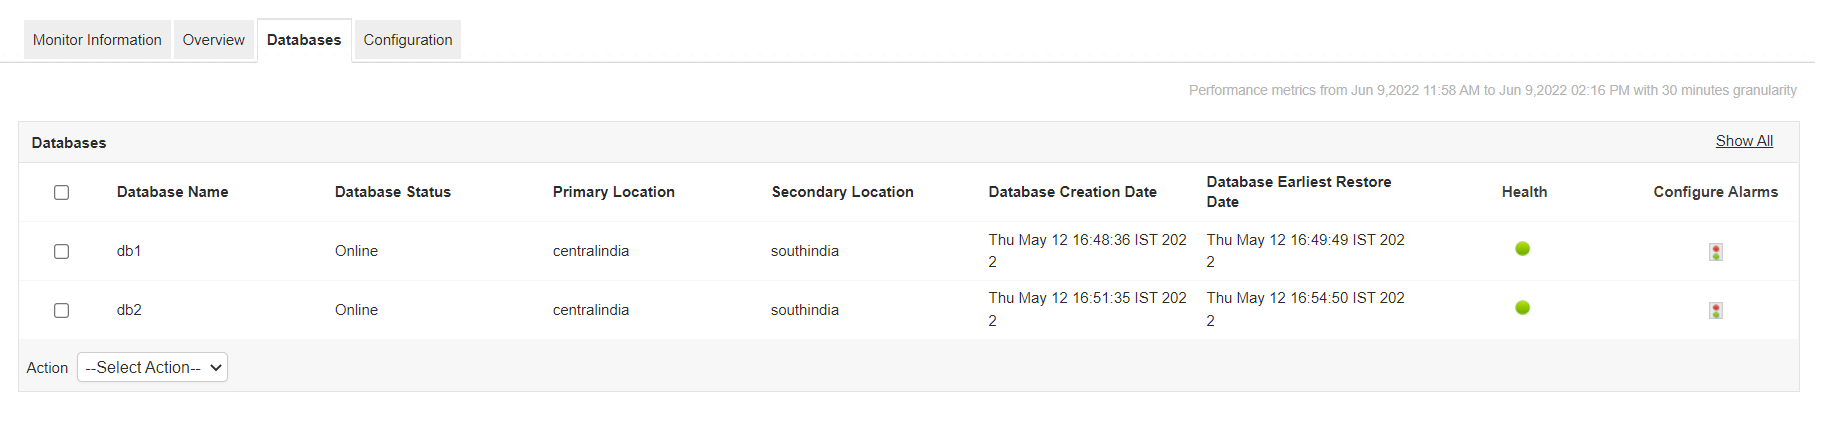
Azure SQL Managed Instances (SQL MI) monitoring
Monitor the availability and performance of your Azure SQL Managed Instances. Track critical KPIs to detect, diagnose and resolve performance bottlenecks instantly
Learn more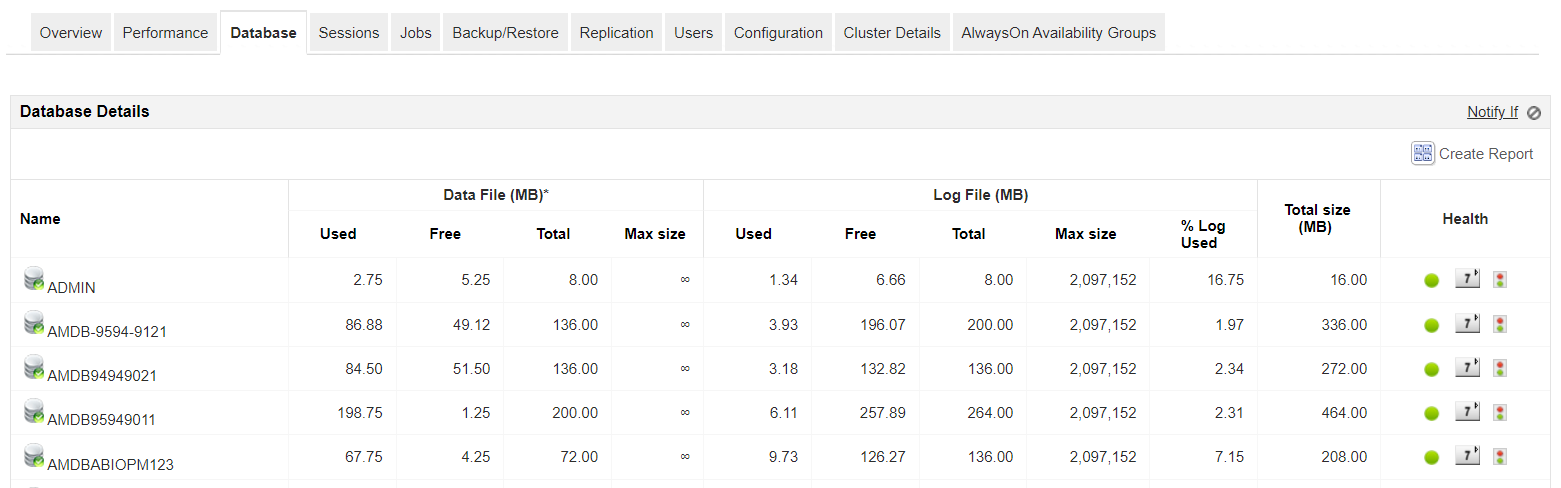
MS SQL monitor gets an upgrade
You can now see disk utilization metrics for Data and Log Files under the 'Database' tab in MS SQL monitor.

Support for Azure Gov Cloud
You can now add and monitor Azure Gov Cloud account in Microsoft Azure monitor!

PostgreSQL monitor enhanced
You can now monitor PostgreSQL Tablespaces along with other critical performance metrics!
APM settings gets an upgrade
You can now leverage the URL Debug tool to troubleshoot issues. This option available under Settings ? Self Help Tools. You can also enable Two-Factor Authentication (TFA) to enforce extra security. This option is available under Settings ? User Management.

Prometheus Integration
With the Prometheus integration, auto discover the scrape jobs from Prometheus server and categorize them to the respective monitor types in Applications Manager instantly!
Learn more
Comprehensive Amazon Elastic Kubernetes Service (EKS) monitoring
Monitor the performance of Kubernetes clusters and their related nodes/pods, services, and persistent volumes. Visualize their dependencies using service maps to gain total insight into the operation of your Kubernetes hosted on AWS.
Learn more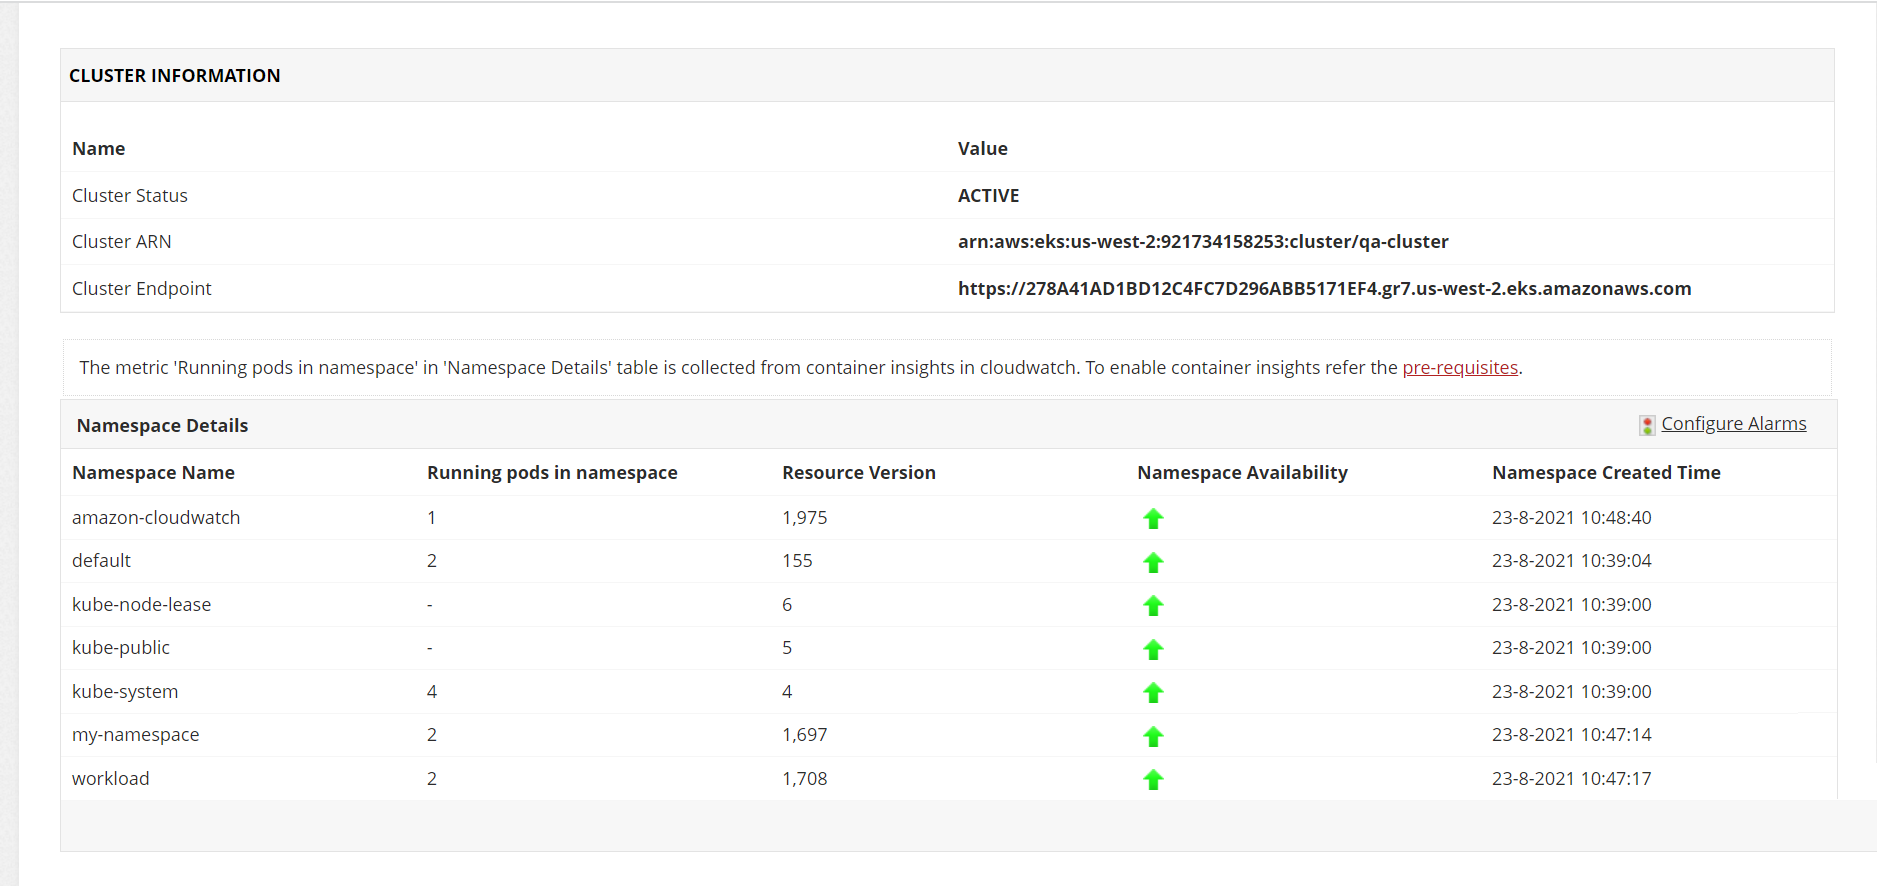
Proactively monitor Citrix Virtual Apps and Desktops
Assess the performance and efficiency of desktops and applications running in your Citrix virtual environments. Manage different desktop groups, measure resource utilization, and locate disconnected sessions with ease.
Learn more
Get on-the-spot alerts using Sybase Replication Monitoring
Track the availability and performance of your Sybase replication servers. Resolve issues quickly by getting instant alerts as and when any hindrances arise.
Learn more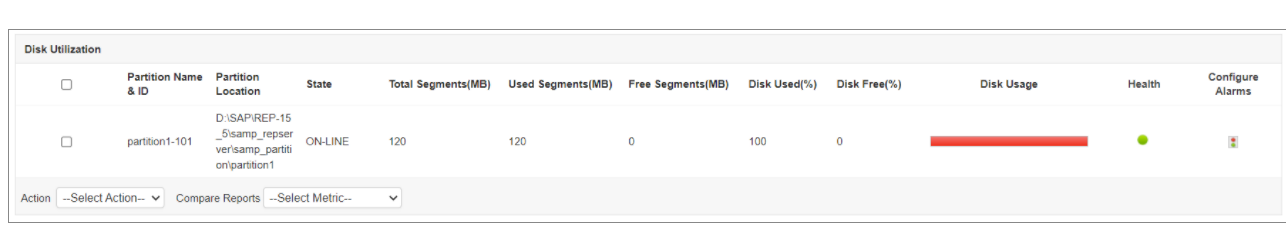
Gain insights into SAP Business One Monitoring
Track performance of key components in the Business One platform such as system landscape directories, scenarios, bizstores, users, errors and conflicts. Achieve end-to-end visibility into business-critical transactions and pinpoint errors with ease.
Learn more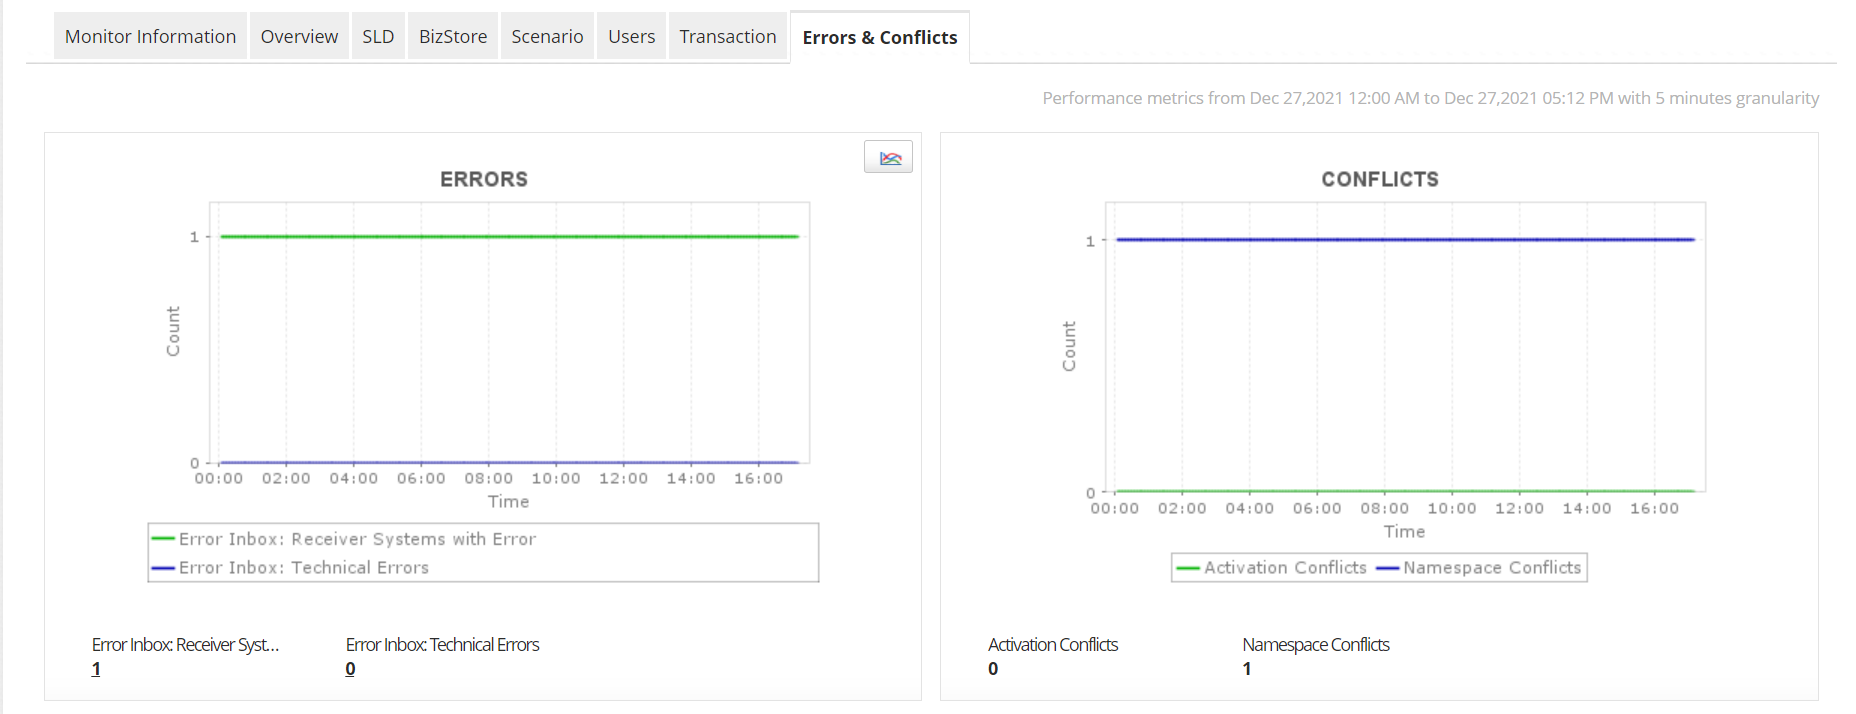
Obtain unparalleled insight into real user transactions
Get insights into your end-user's web application experience by tracking front-end performance across multiple regions, identifying JavaScript errors, and monitoring key user interactions in real time.
Learn more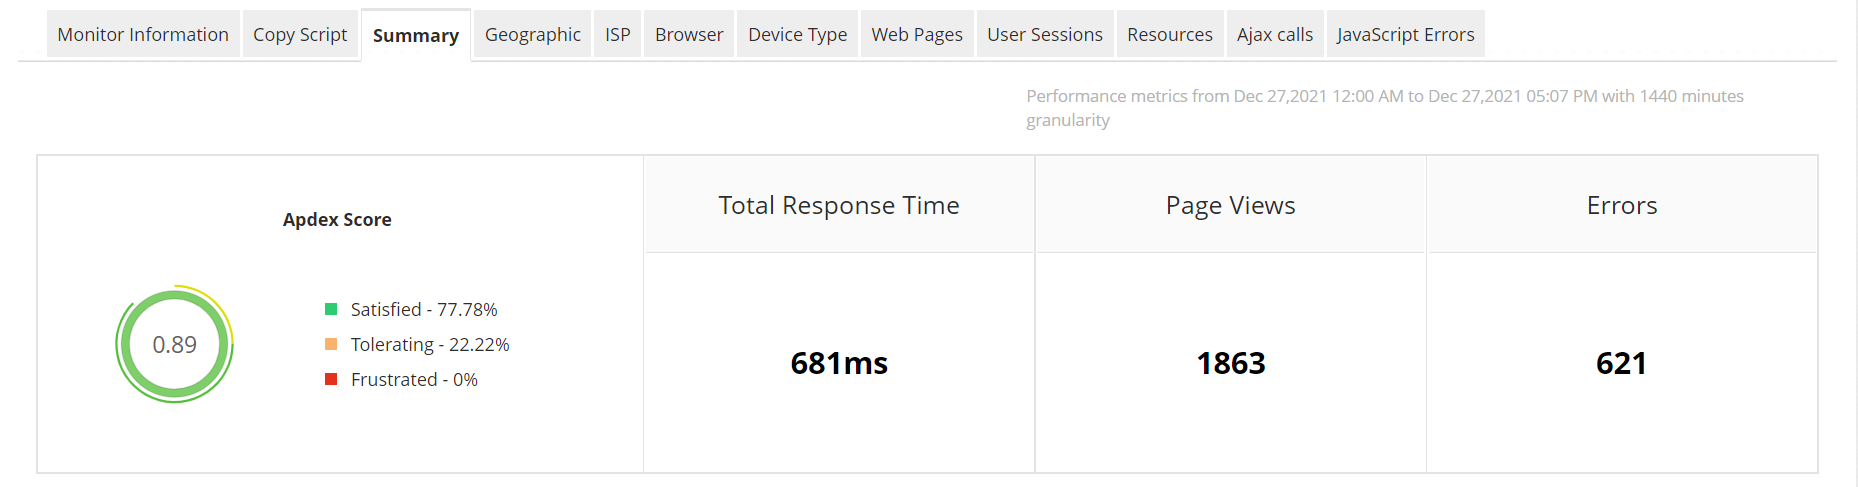
Get insights into Microsoft Teams Performance
Become aware of the service health of your Microsoft Teams service and identify issues instantly. Manage your teams and channels efficiently and also discover usage preferences by analyzing usage information!
Learn more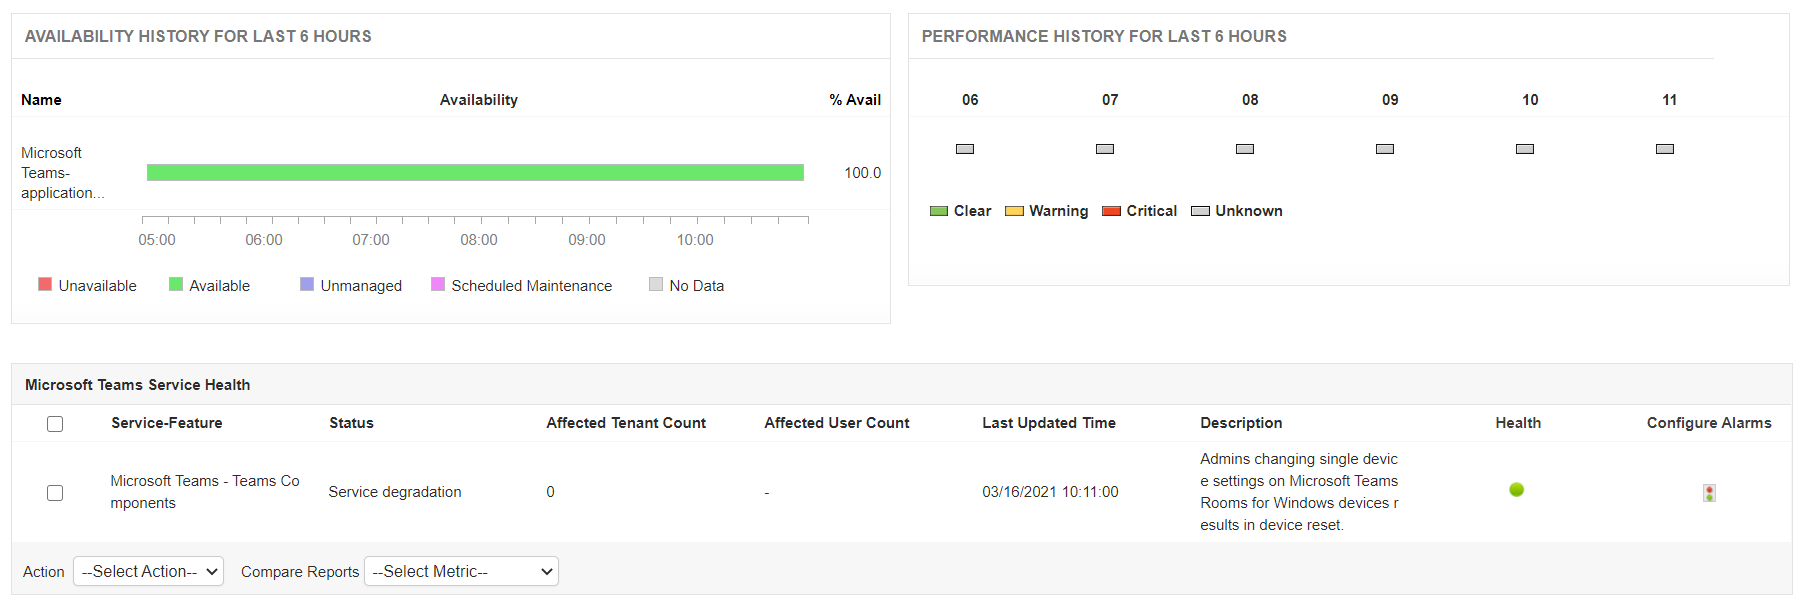
Brand Reputation Monitoring
Perform real-time black-list checks on your website and maintain a positive Brand reputation. Identify threats in your website and eliminate them instantly to prevent black listing.
Learn more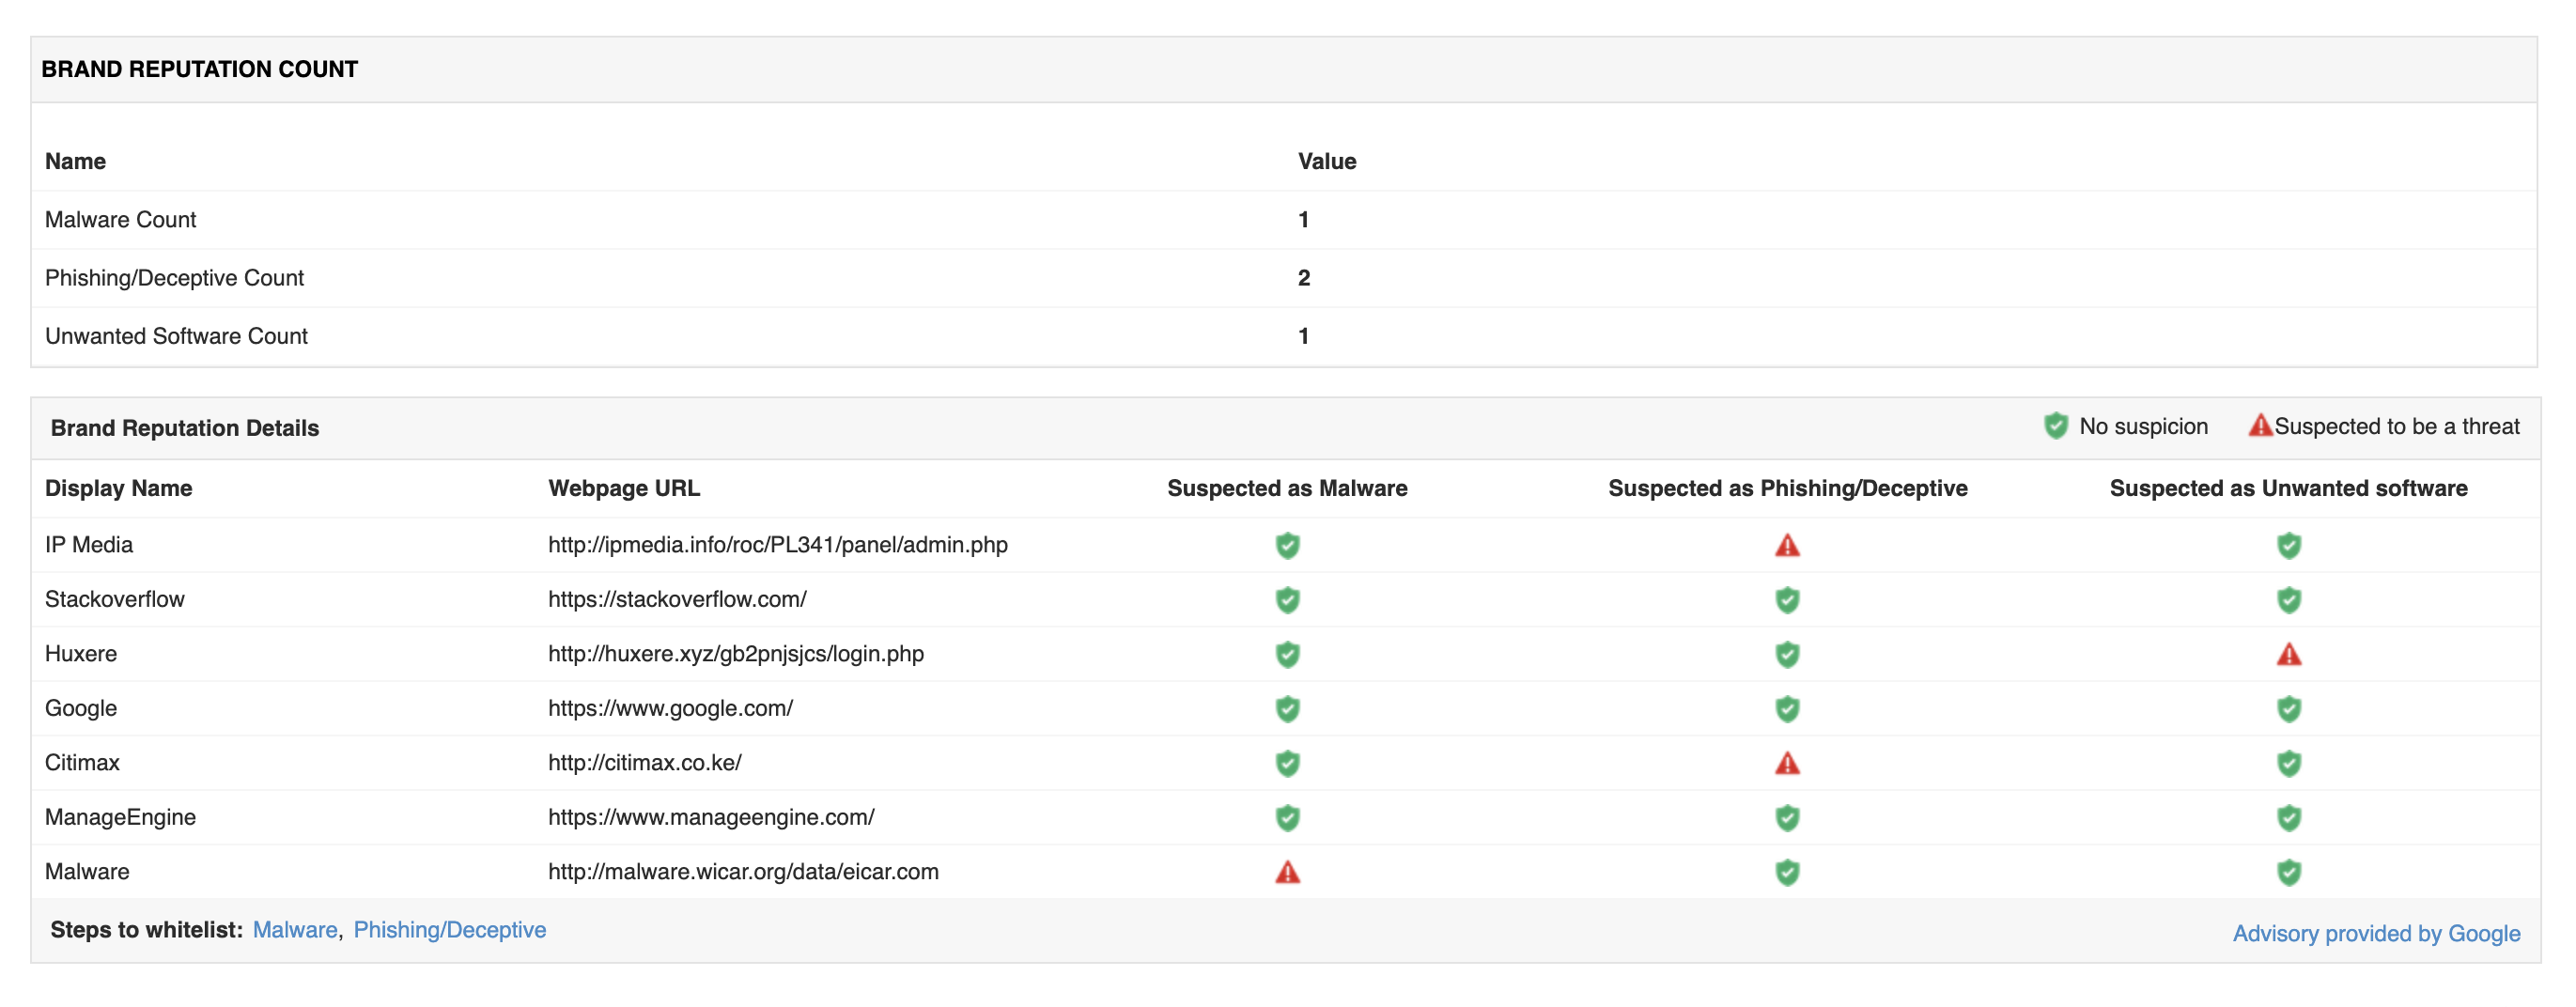
Azure Service Bus Monitoring
Visualize Azure Service Bus performance: administer messages and requests and prevent throttling of requests. Become aware of increasing resource usage and employ capacity planning to ensure optimal performance of critical business applications.
Learn more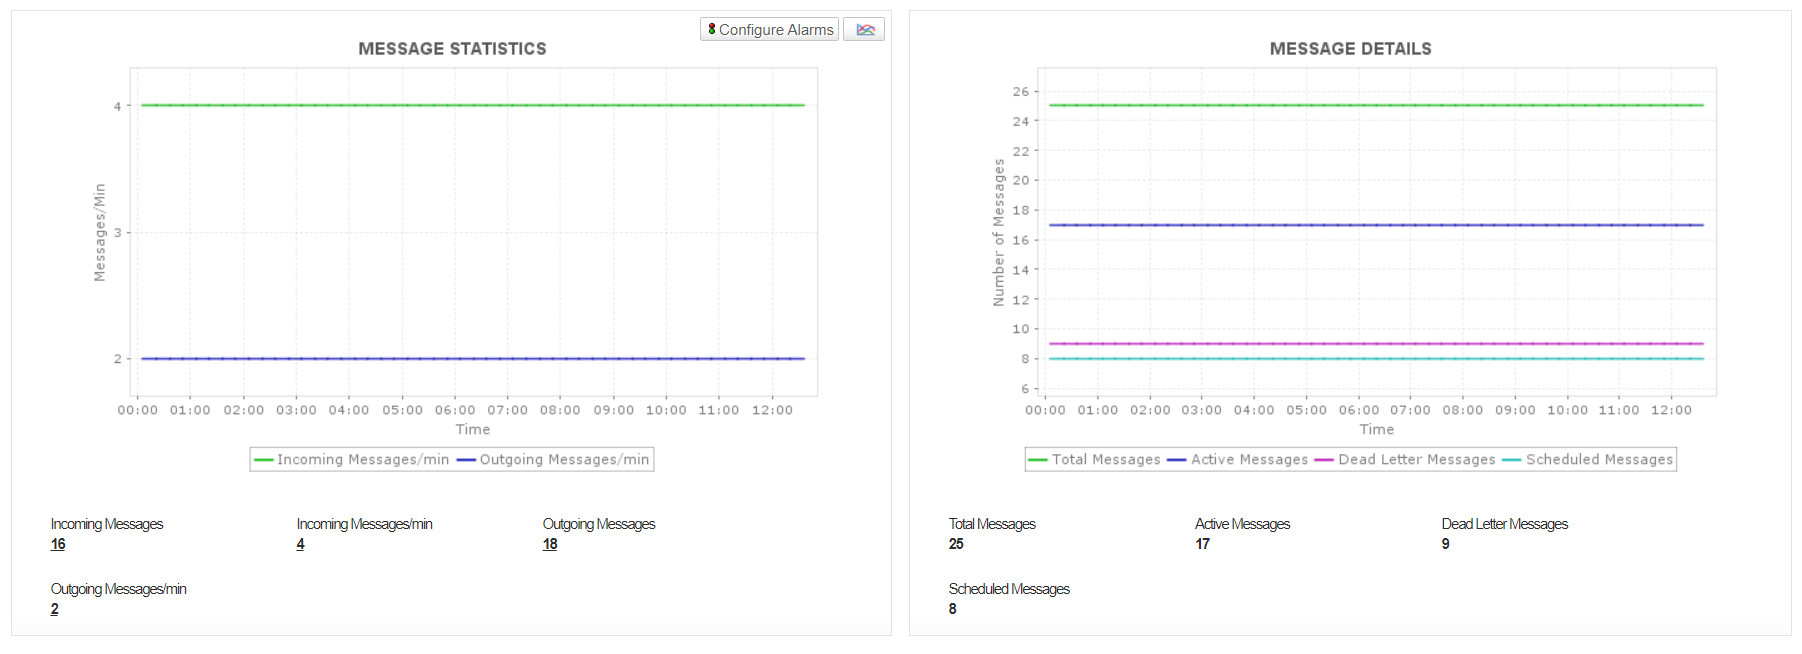
Service Map support for APM Insight
Get an overview of application architecture with the automated Service Map feature. Track the status of external components connected to your application. Service Map is supported for Java, Node.JS, PHP, .NET and .NET Core applications respectively.
Take a demo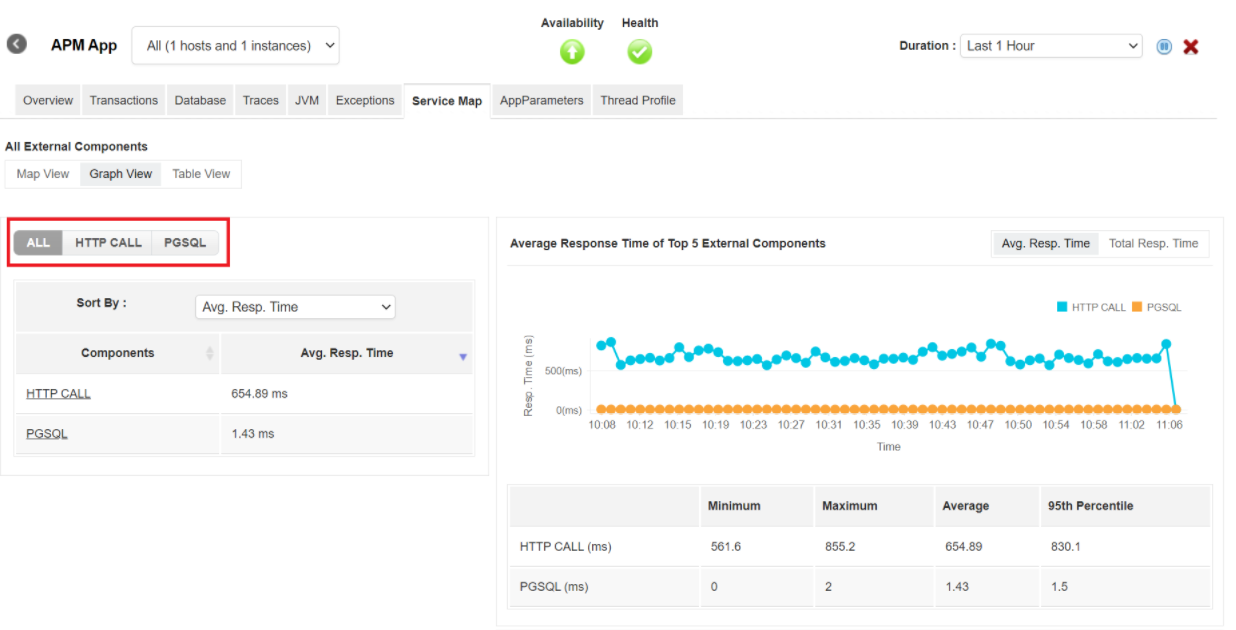
AWS ECS monitoring
Get deep insights into the performance of your AWS ECS clusters. Become aware of resource usage and track tasks and instances running in your clusters.Identify issues in your clusters and promptly troubleshoot problems before they affect your applications.
Learn more
Manage your Hyper-V Clusters with ease
Auto discover Hyper-V servers present in your cluster and monitor their performance to ensure smooth running of your applications. Track Cluster Shared Volumes and Cluster network and ensure uninterrupted functioning of critical VM related activities.
Learn more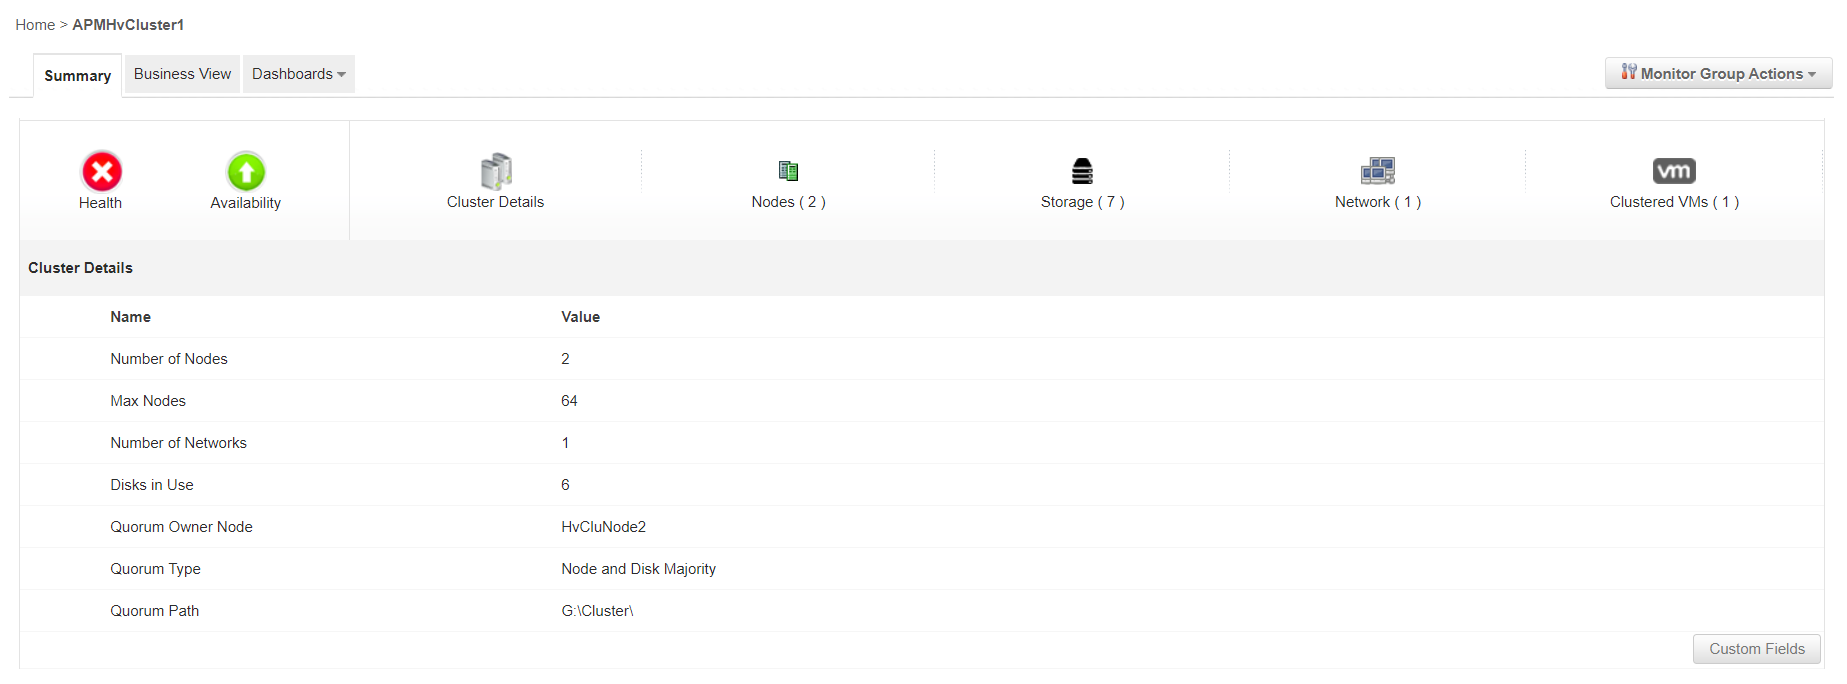
Assess your webpage performance with Webpage Analyzer
Gain insights about the performance of your webpage: Get to know your page score, response times and throughput. Track your requests and eliminate slow loading components. Use PageSpeed rules and suggestions to enhance the webpage performance.
Learn more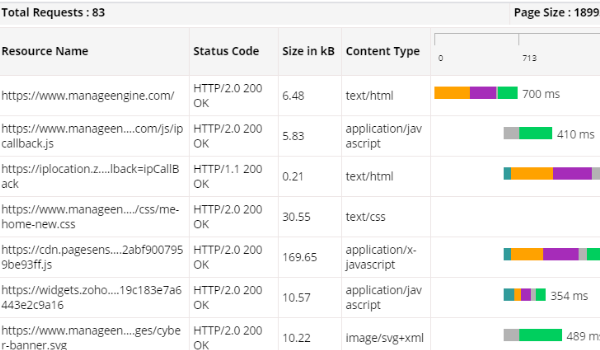
Istio Monitoring Simplified
Track the health and availability of the Istio service mesh. Gain insights about all five components of the service mesh and identify problematic components. Become aware of performance degradation and fix issues quickly to facilitate smooth performance of your service mesh.
Learn more
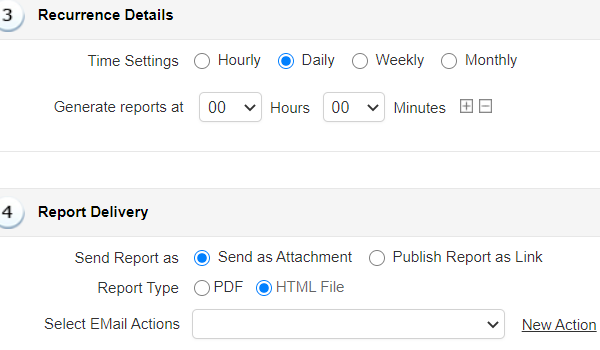
Scheduling Reports option gets an upgrade
Get an overview of application architecture with the automated Service Map feature. Track the status of external components connected to your application. Service Map is supported for Java, Node.JS, PHP, .NET and .NET Core applications respectively.
New in APM Insight
- Get detailed views of databases that your application interacts with.
- Visualize database operations data in both graphical and tabular formats.
- Mark your key transactions and search and filter exceptions occurring in your applications.
- Track and monitor app parameters and distributed traces for your Java, .NET and NodeJS applications.
- Configure Thread Profiles for your Java and .NET applications.
More widget options
You can now add 'Monitor Overview' and 'Monitors by Status and Downtime' widgets while creating your Custom Dashboard. This is available under Home ? Actions ? Add Widgets.
HeatMap widget now shows Total Monitor count and count of individual health severities at the first glance.
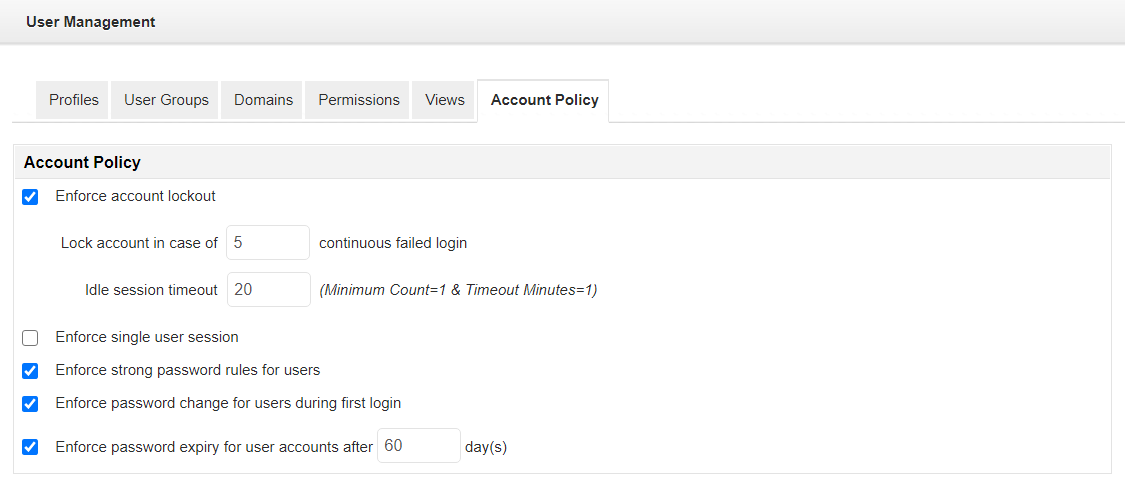
Password management made easier
With our new feature, you can now configure password expiry and change/update your default login/password. This option is available under Admin? User Management ? Account Policy.
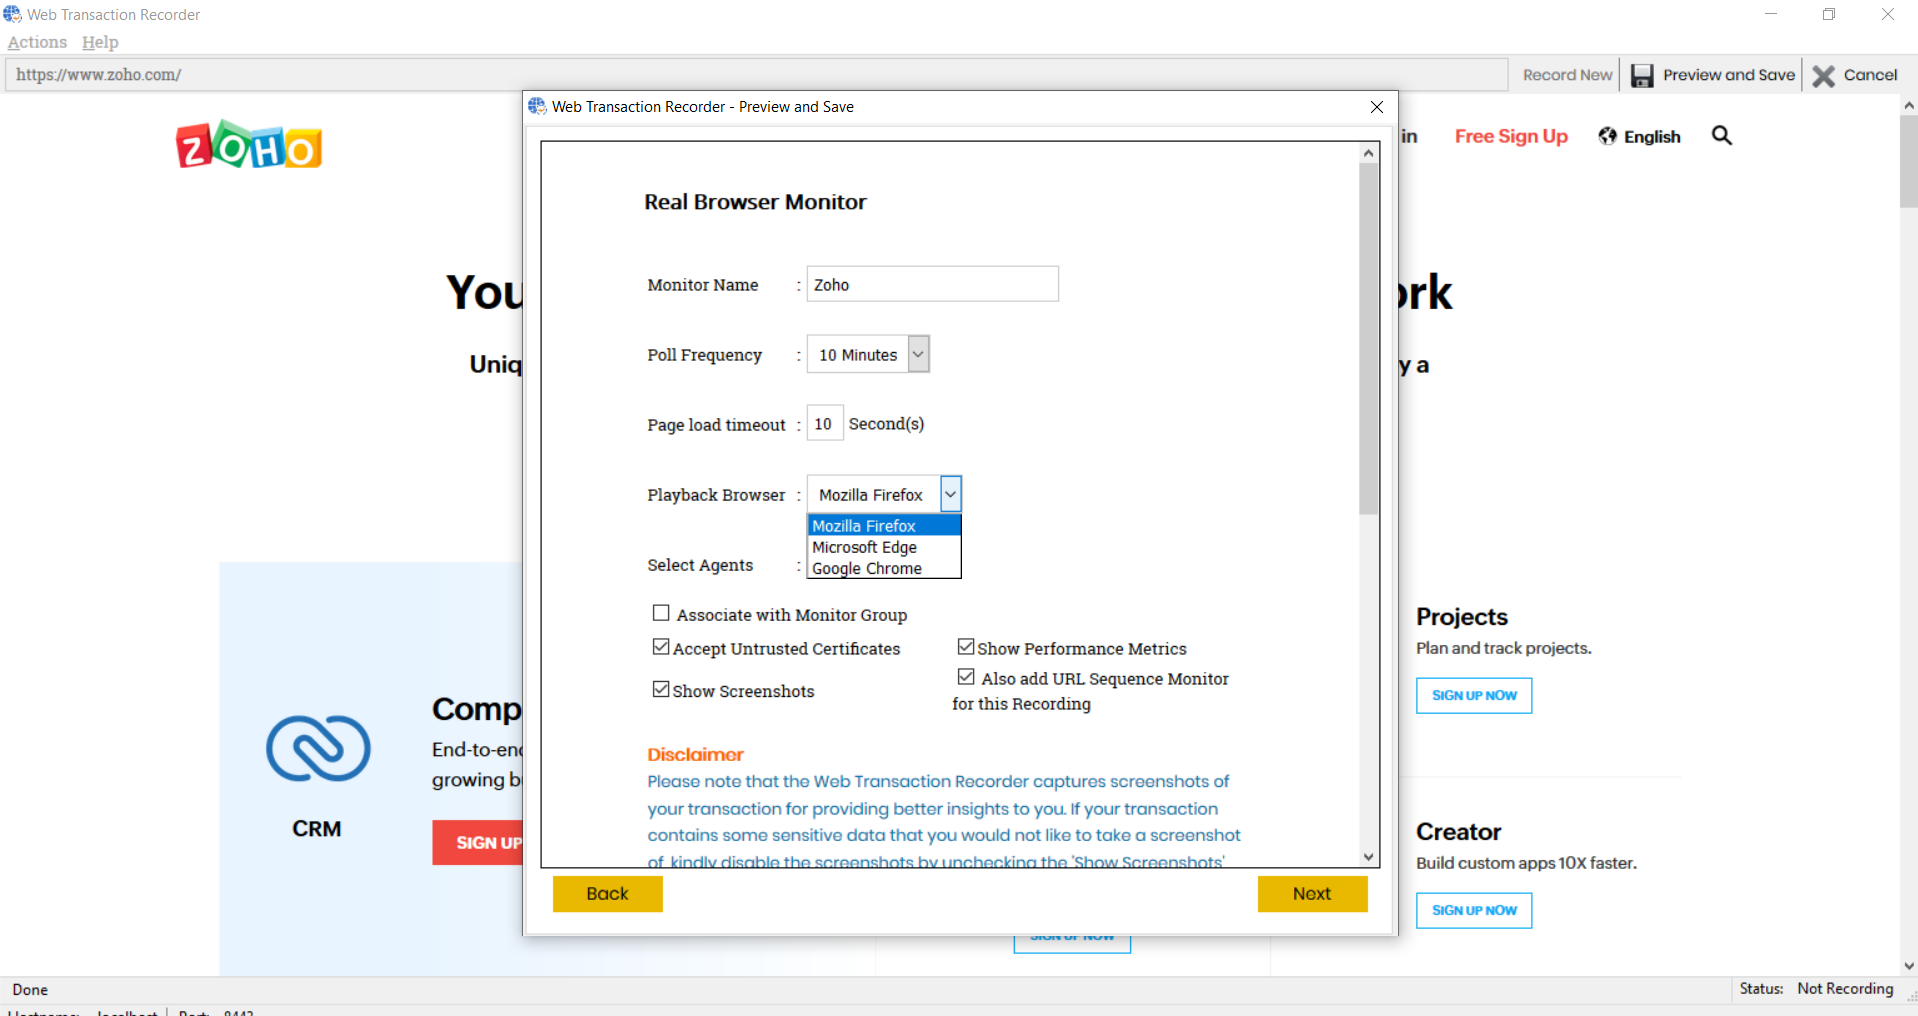
Real Browsing Monitor enhanced
RBM now supports Chrome browser based playback. You can also view and edit basic authentication credentials included in Playback Script.
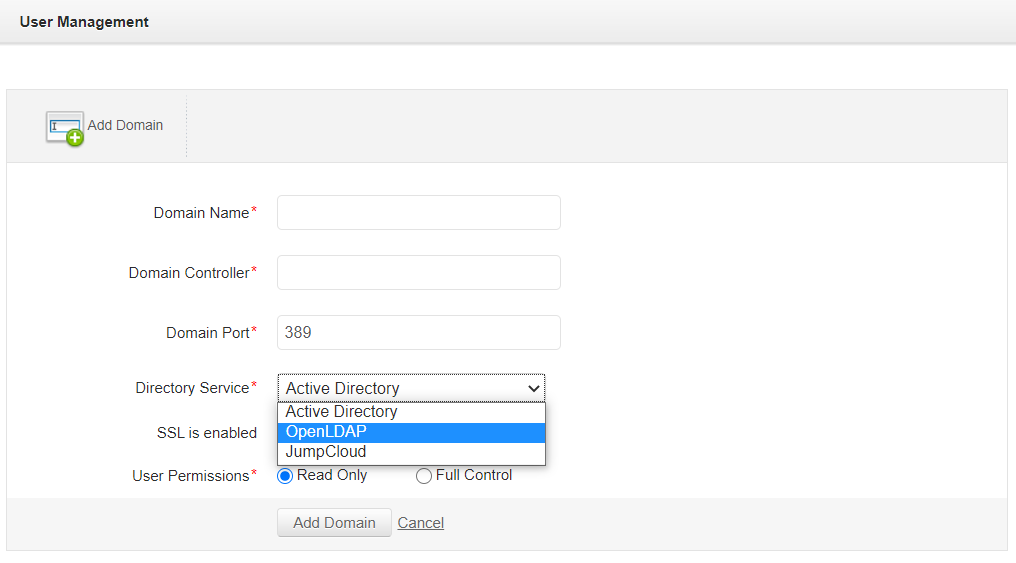
Import users from Jumpcloud
You can now import users and user groups from Jump Cloud directory domains along with Active Directory, OpenLDAP
AWS Elastic Beanstalk monitoring
Get insights about performance of web servers and applications built on the Beanstalk service. Monitor crucial metrics such as instance health, request statistics, host performance statistics, and latency and optimize the performance.
Learn more
AWS Lambda monitoring
Get updates about irregularities in the functioning of your Lambda environment. Keep track of invocations, concurrent events and the configuration details. Troubleshoot issues and resolve bottlenecks easily.
Learn more
Amazon SQS monitoring
Monitor your Amazon SQS queue and track messages and configurations. Optimize problematic queues and enhance the performance of the queues.
Learn more
Google Kubernetes Engine monitoring made easy
Manage your clusters and nodes to isolate ones that consume memory. Track the CPU and memory usage of pods and maximize their efficiency to help optimize the performance.
Learn more
Proactively monitor your Oracle Multitenant database
Manage resource allocation in Oracle Multitenant environment by tracking tablespaces. Manage your workloads and plan your capacity by tracking the growth and usage of blocks.
Learn more
Admin tab gets more options
View all servers in Application Dependency Mapping under the Global Settings option in the Admin tab. With respect to User Management, personalize and edit tabs added in the Permissions tabs. (Available from build 14570 onwards)
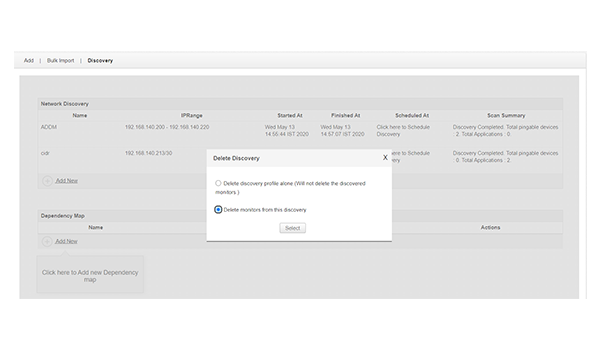
ADDM gets an upgrade
Delete monitors that are discovered through a specific discovery profile. This helps to de-clutter unwanted monitors that are added during the discovery. (Available from build 14570 onwards). View list of applications discovered under a particular server. (Available from build 14690 onwards)
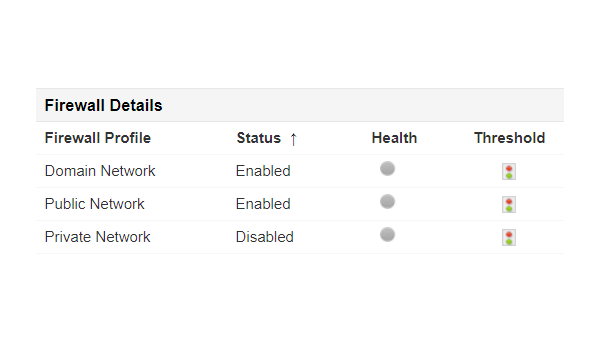
Windows server monitor enhanced
Applications Manager's Windows monitor now supports Firewall monitoring. (Available from build 14590 onwards)
Unravel the path to effective optimization of Hazelcast grid
Keep track of resource usage and capture faults that emerge out of inefficient resource utilization. Optimize the performance and resolve issues with ease.
Learn more
Applications Manager now integrates with Slack!
With Applications Manager's integration with Slack, receive customized notifications on your slack channels in real time to improve response time and reduce email alert overload.
Learn more
Track performance of your .NET core application environments
Get detailed information about the health, performance and efficiency of your .NET core application. Understand the application through all levels and optimize it to increase user satisfaction.
Learn more
Seamlessly monitor your Google cloud storage instances
Gain insights about crucial metrics such as traffic, number of requests, and details about objects in your Google cloud storage instance.
Learn more
Effective cloud space management with Oracle cloud storage monitoring
Visualize your cloud usage and manage cloud space effectively. Monitor block volumes and administer your back-ups and ensure that your data is secure in the cloud.
Learn more
Proactively monitor your Oracle autonomous database
With our support for Oracle Autonomous database, identify connectivity errors easily, monitor the data growth and optimize the overall performance of your database.
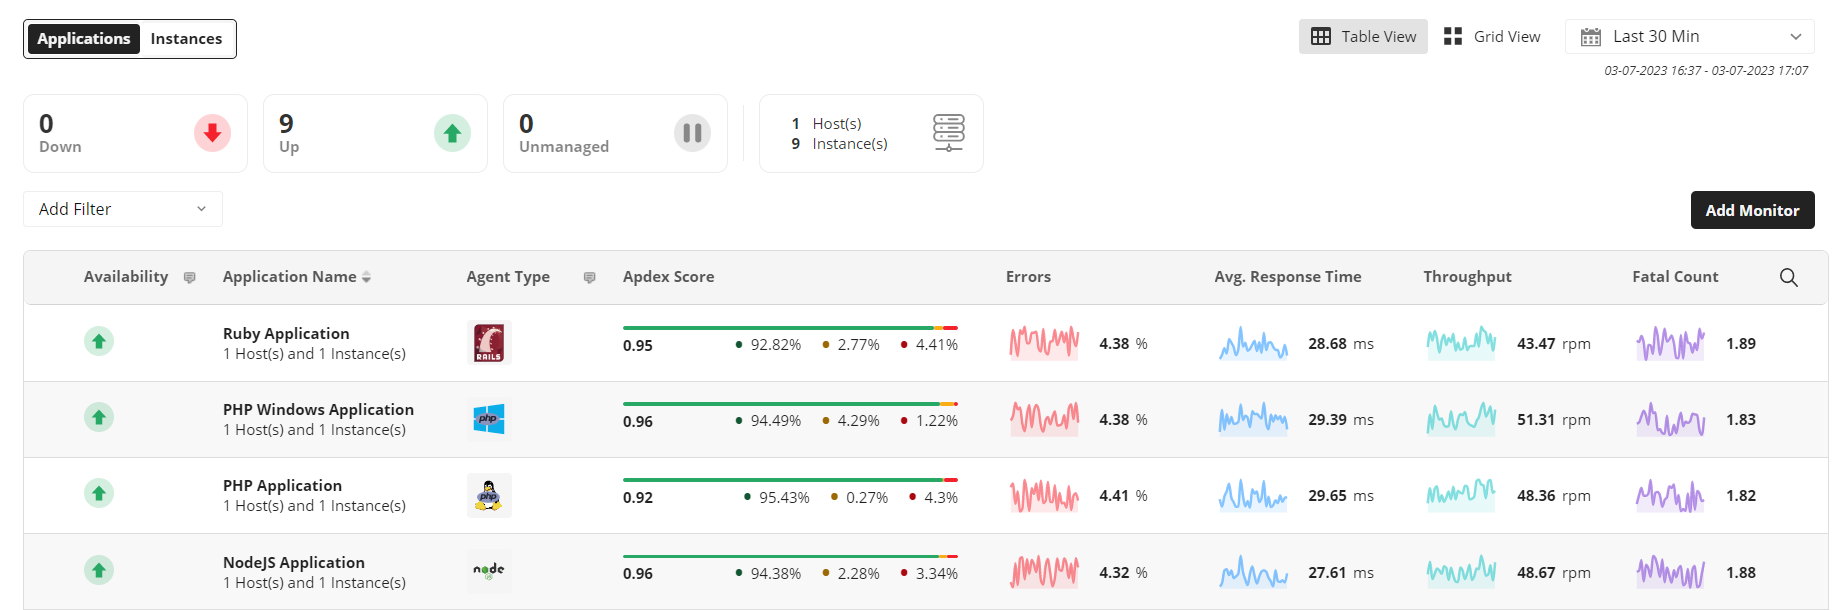
Learn moreGet end-to-end visibility into your NodeJS and PHP applications

Keep an eye on your Google Cloud Platform Compute Instances
Monitor your Google Compute instances and track key metrics such as CPU and memory usage, disk performance, disk throttling, network traffic, firewall metrics, etc. Regulate resource usage by monitoring quota metrics at individual host level.
Learn more
Track the health and performance of SQL Anywhere Database
Monitor KPIs of SQL Anywhere database such as resource consumption, database space, database mirroring, file details, cache, connections, sessions, etc. and optimize the performance.
Learn more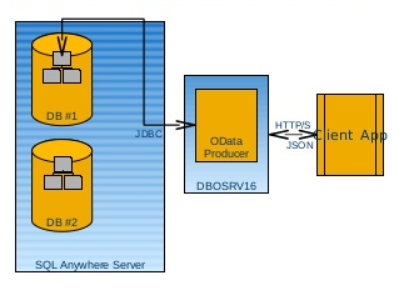
Easy Nutanix monitoring
Applications Manager now supports monitoring of Nutanix environments as a part of its converged infrastucture monitoring module. Monitor clusters, track key metrics, identify and resolve bottlenecks easily.
Learn more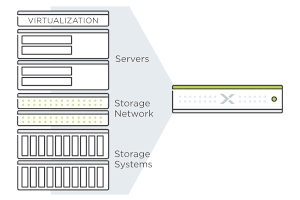
Simplified KVM Monitoring
Gain detailed insights into the performance of your KVM servers, and obtain the health status and performance stats of the host servers along with their associated VMs in real time.
Learn more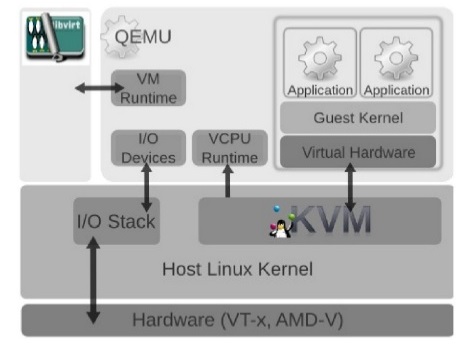
RHV Monitoring made easy!
Visualize the hierarchical service topology mapping of all aspects of the KVM hypervisor and RHV guest VMs associated with the RHV servers. Monitor and analyze the performance of each and every layer of the RHV infrastructure, and rapidly identify and resolve bottlenecks with ease.
Learn more
Proactively monitor your Oracle VMs
With our support for Oracle VM, gain complete insight into the health and performance of your Oracle VM servers along with their associated virtual machines.
Learn more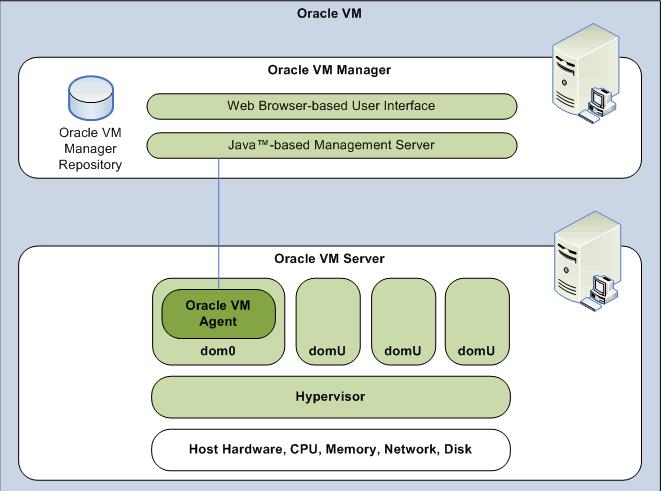
Unravel the path to seamless Oracle Cloud Monitoring
Gain complete visibility into your Oracle Cloud Infrastructure and track key metrics such as block volumes, boot volumes, network traffic, etc.
Learn more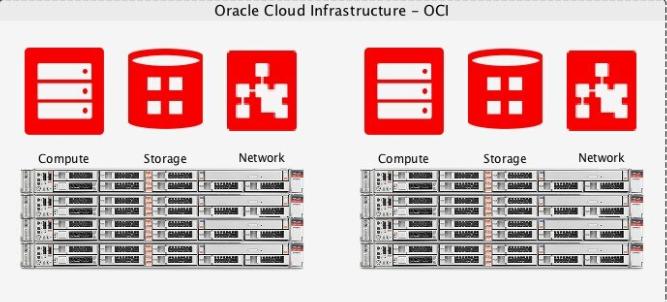
Proactively monitor your OpenShift infrastructure!
Get unmatched visibility into services and deployments in your OpenShift infrastructure.Track key metrics like pod and node usage with ease.
Learn more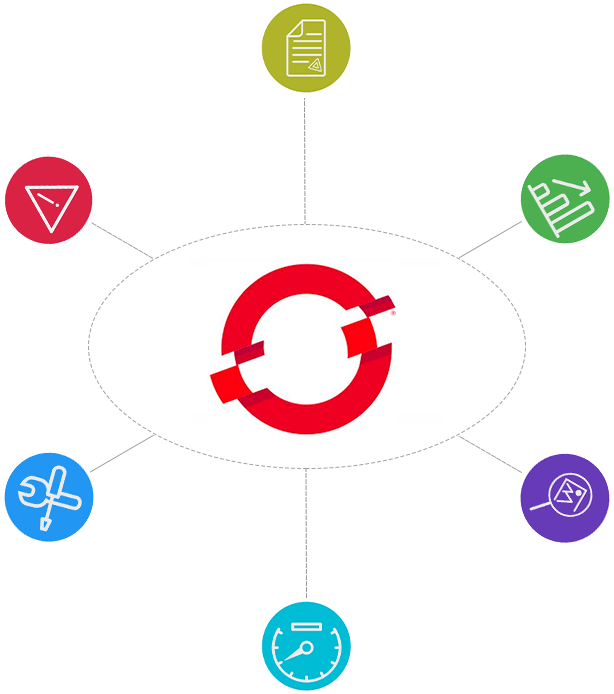
Kubernetes monitoring simplified.
Visualize the performance of your entire container infrastructure, identify and investigate performance issues, and take control of the applications deployed.
Learn more
Gather real-time stats of your Amazon ELB!
Monitor application load balancers; analyze traffic patterns, and easily resolve load balancer issues.
Learn more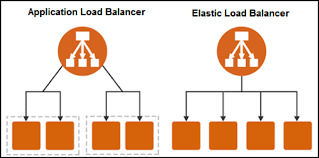
Microsoft Network Policy Server
With Applications Manager, you can now monitor the availability and performance of Radius servers, and proactively alert administrators of authentication, authorization, or accounting bottlenecks encountered by the NPS Server.
Learn moreUnderstand AWS usage with billing reports.
Monitor AWS billing statistics and obtain detailed expenditure reports that break down your costs based on service.
Learn more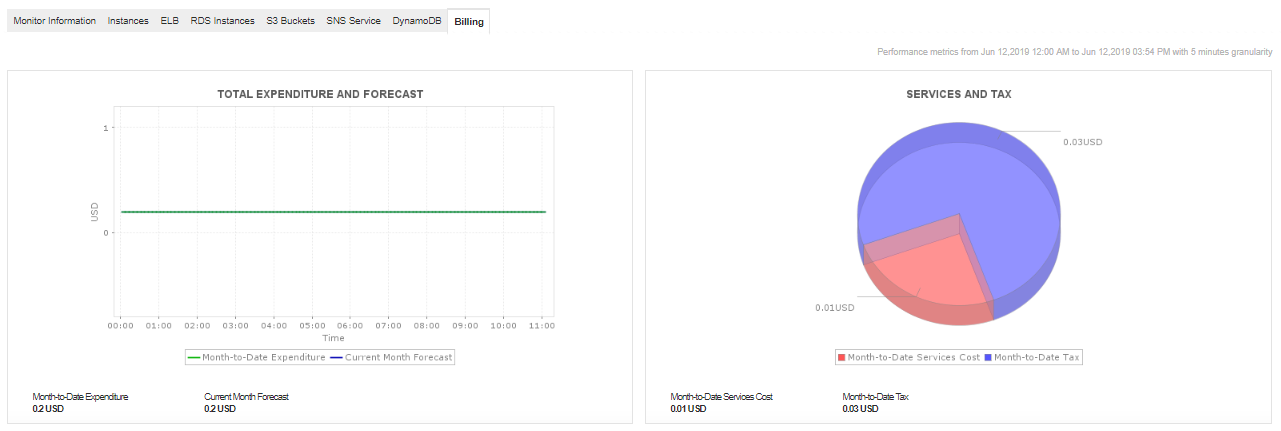
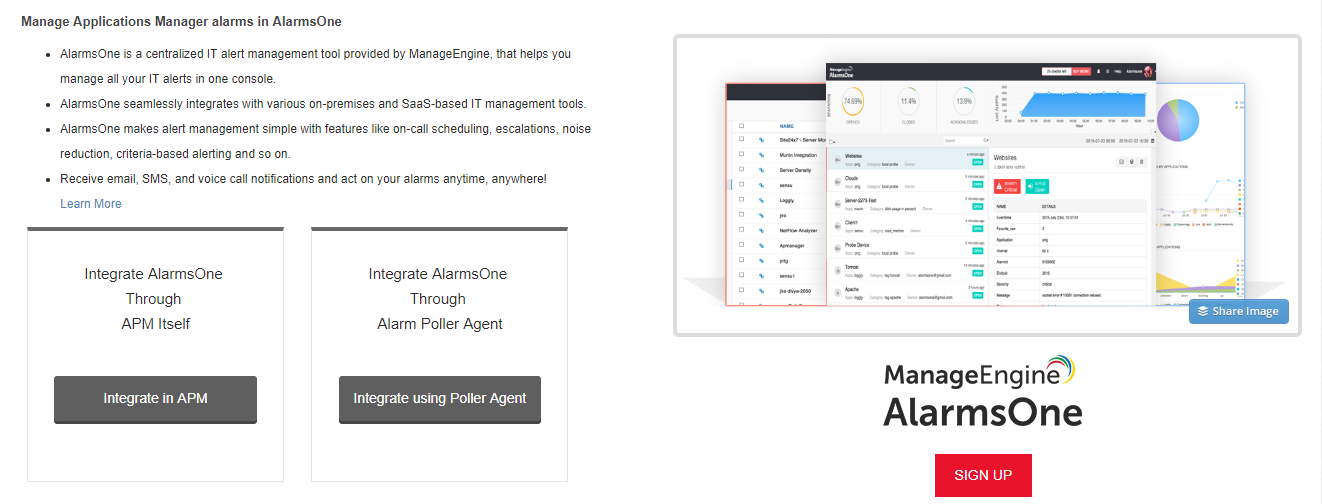
Applications Manager now integrates with Alarms one!
With Applications Manager's integration with Alarms One, receive email, SMS, and voice call notifications and act on your alarms anywhere, anytime! Simplify alert management with features like on-call scheduling, escalations, noise reduction, and so on.
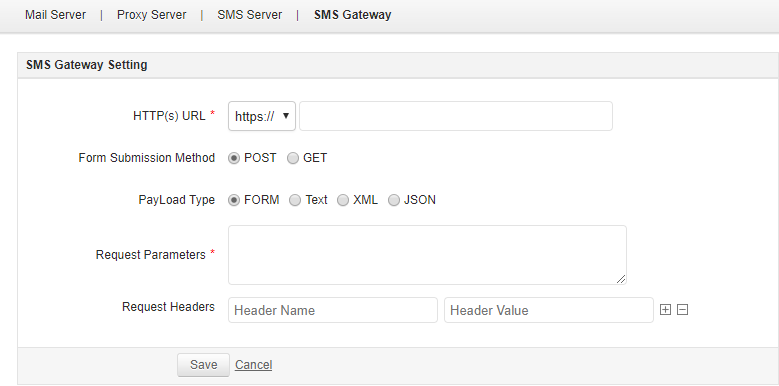
Integrate your own SMS gateway
With Applications Manager, you can now integrate third-party SMS gateways, and start receiving alerts instantly.
Amazon DynamoDB Monitor
Applications Manager now provides round the clock monitoring for Amazon Dynamo DB, a fully managed NoSQL database offered by Amazon AWS. You can now track key metrics like read and write capacity units, latency, throttled requests, secondary indexes, streams and much more.
Learn more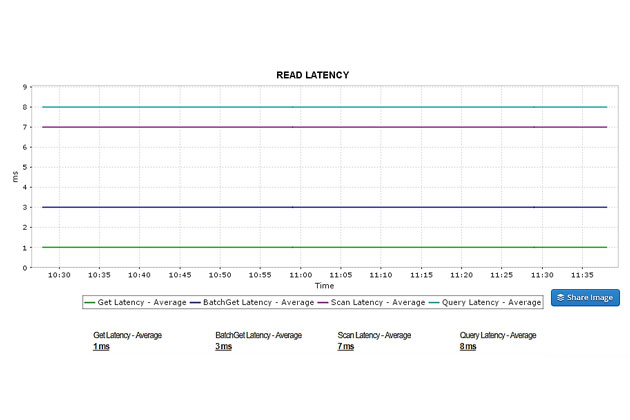
Now supports Azure SQL Database
Ensure optimal performance of your Azure SQL Database servers. Track key performance indicators, troubleshoot deadlocks, monitor active sessions and much more.
Learn more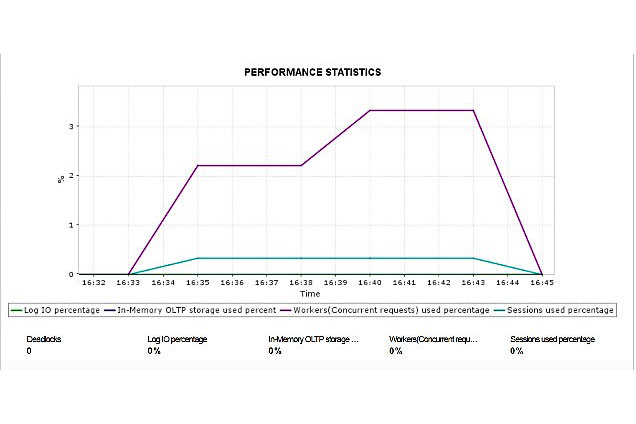
Web transaction monitor enhanced.
With our new web transaction recorder, you can now record transactions for both real- browser monitoring and URL sequence monitoring. Record web transactions and user transactions using a single transaction recorder.
Learn more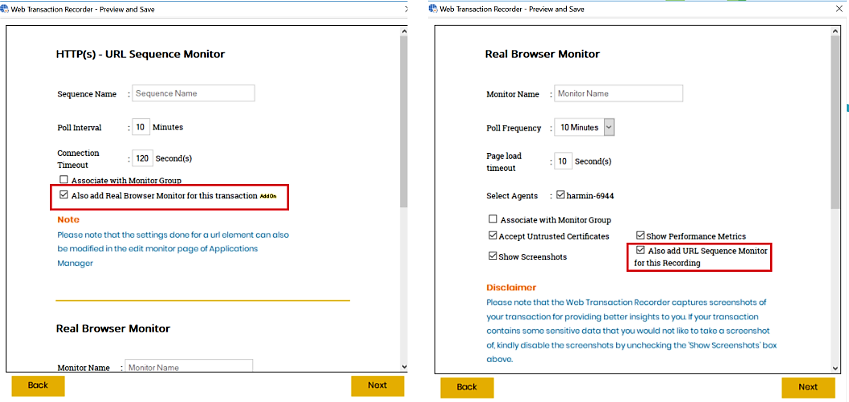
New metrics. Enhanced support for SQL.
You can now track key metrics of your Microsoft SQL monitor like SQL database connection details, configuration details, database actions, job history reports, replication agent history, server database mirroring, clusters, etc.
Learn more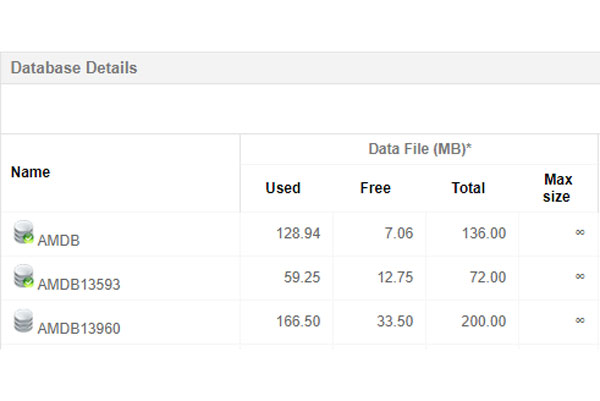
VMware monitoring enhanced
Access different storage devices, display the available storage adapters and review their information with VMware Storage Adapters.
Learn more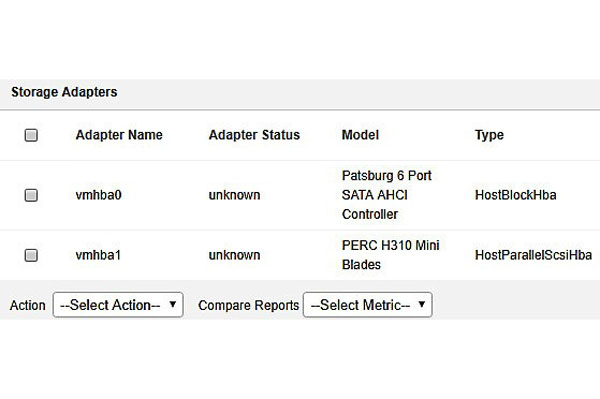
WebLogic. Turned up to 12.x
Extended support up to version 12.x to enhance monitoring experience of your WebLogic servers. Experience increased application availability, proactive alerts and much more (available from build 13800 onwards).
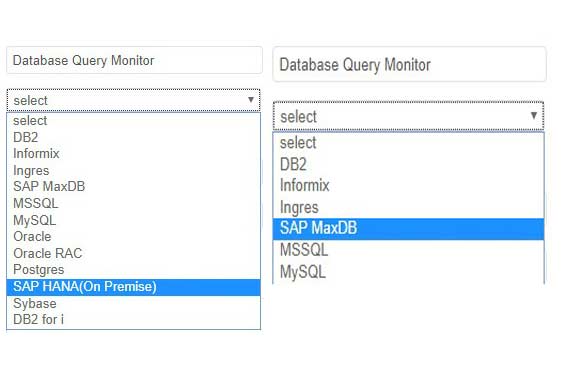
Database query monitor gets a boost
Applications Manager now supports monitoring of SAP HANA (on premise) and SAP MaxDB database queries in Database Query Monitor (available from build 13860 onwards).
Forecast reports get a boost with Machine learning techniques
Applications Manager has roped in machine learning techniques to give a boost to your forecast reports. This feature will help users make accurate estimates of growth trend of attributes like disk utilization of servers, database size, etc.so that they can plan capacity better. You can view the forecast by growth trend upto 3 years (available from build 13860 onwards).
Learn more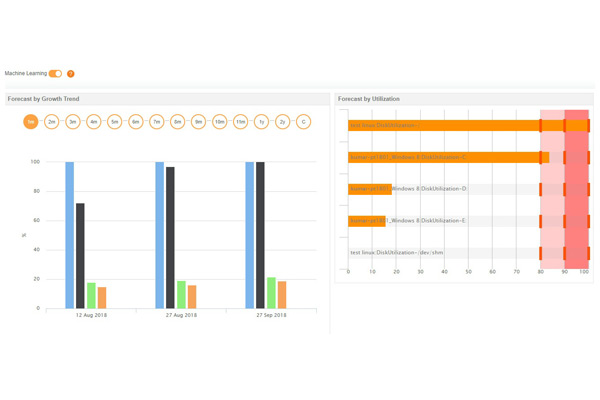
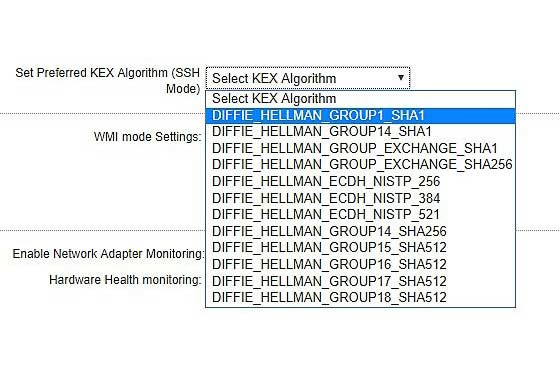
SSH connectivity amplified
SSH connectivity has been enhanced using Key Exchange (KEX) method with support for diffie-helamn-group14-sha256, diffie-helman-group 15-sha512, diffie-helman-group 16-sha512, diffie-helman-group 17-sha512, and diffie-helman-group 17-sha512 algorithms. You can now select the preferred KEX algorithm that is to be used while establishing connection via SSH.
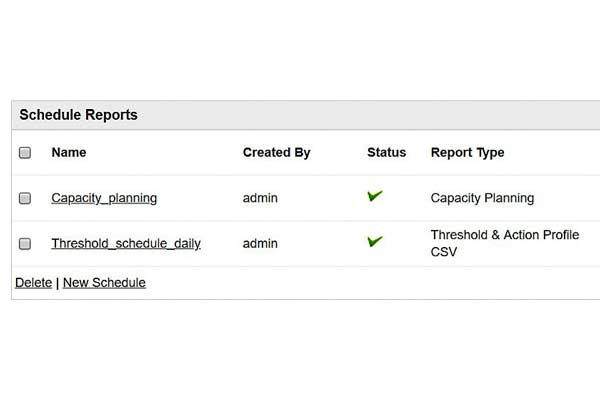
Plan what you need. Exactly when you need it.
Avail capacity planning under scheduled reports.You can now receive the undersized and over sized server details by configuring a schedule reports of capacity planning type (available from build 13840 onwards).
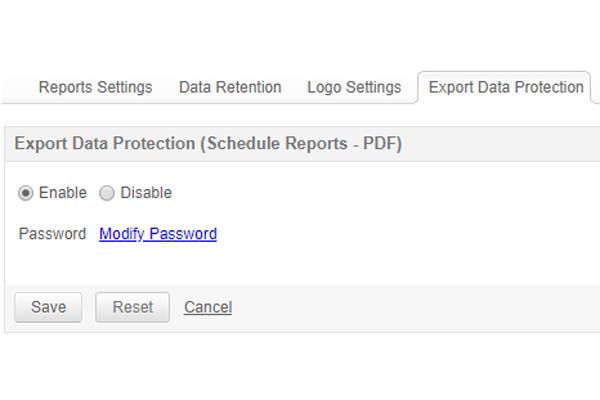
Protection. Privacy. Access.
Password protection has been added for reports that are exported in pdf format.
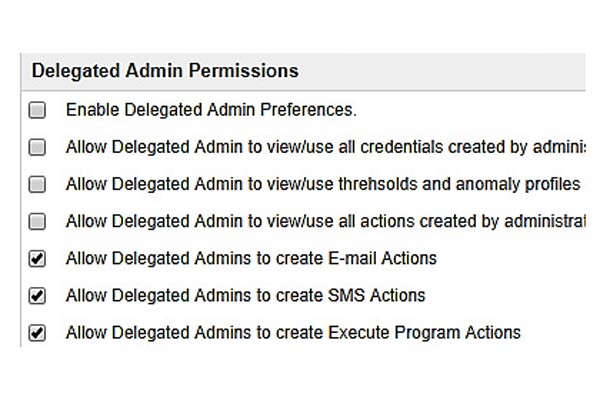
More power to delegated admins!
Admins can now grant permission to delegated admins for creating actions.
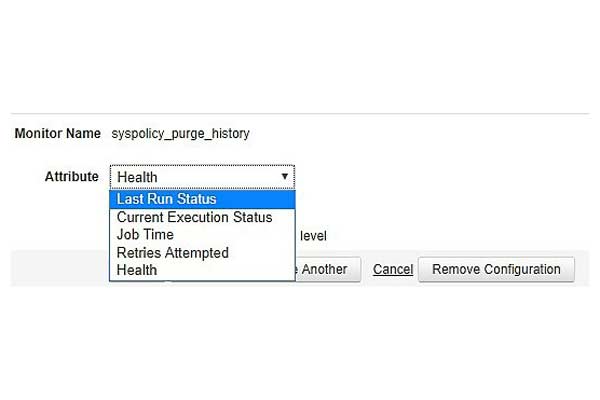
Generate customized alarms
You can now customize alarms in MS SQL for last run status and current execution status of jobs.
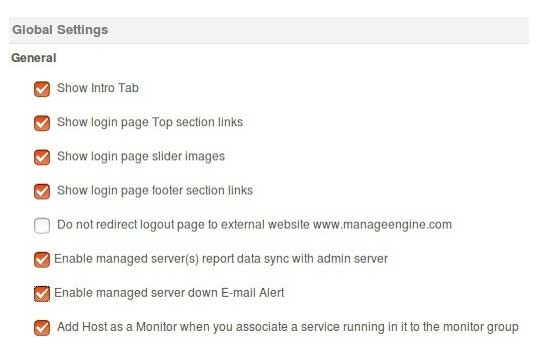
Enable and disable with a click
You can now enable/disable the "Probe server down" email alerts from the Central server directly via UI and Rest API (available from build 13830 onwards).
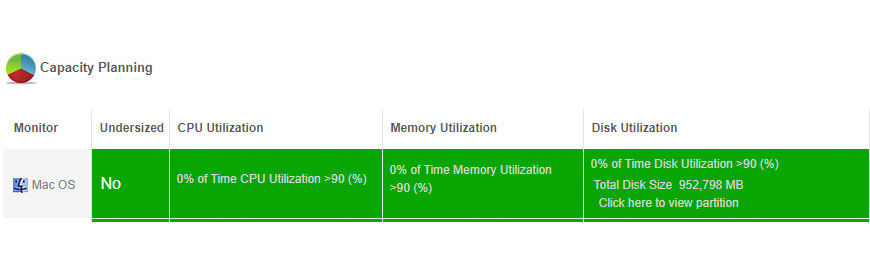
Capacity planning made easy
With our new feature, you can now view server disk utilization details of a particular monitor for a specific time interval configured by the user
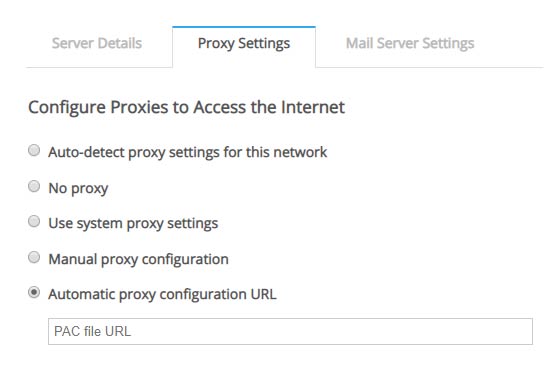
Proxy settings for EUM enhanced
Applications Manager now supports Automatic proxy configuration URL for End-User Monitoring. EUM agent uses the proxy settings defined in the PAC file.
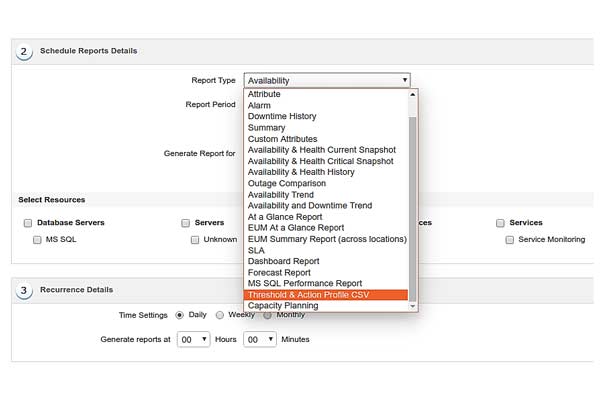
New in schedule reports
On scheduling a report with threshold action profile CSV as report type, you can receive mail with in-detail report. Threshold and action profile CSV report feature has been added under schedule reports (available from build 13820 onwards).