Customize Dashboard Views
How to create dashboard profile
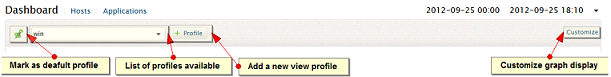
In EventLog Analyzer, host group-specific dashboard ‘profiles’ can be created (click + Profile button), where each dashboard profile displays only that information corresponding to the host group assigned to the profile. The default dashboard profile is ‘All Groups’ and this profile is not editable (add. modify, delete is not possible), unlike other dashboard profiles.
Create dashboard profile in EventLog Analyzer using the following menu:
- Home tab > Dashboard > + Profile > +Add
The procedure to create dashboard profile is given below:
-
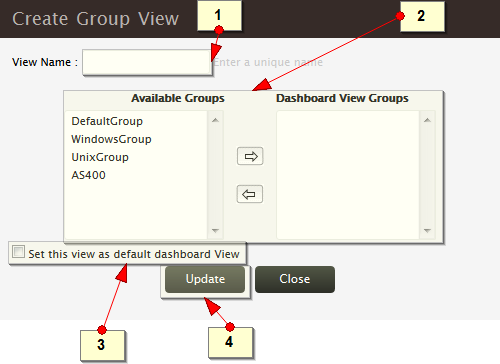
Enter a unique view name for the new dashboard view profile
-
Select the host group(s) to add to this profile. Use the left to right arrow to add the host group(s) (move the host group(s) from the Available Group(s) list to Dashboard View Group(s) list) and right to left arrow to remove the host group(s) (move the host group(s) from the Dashboard View Group(s) list to Available Group(s) list)
-
Select the 'Set this view as default dashboard view' check box to set this newly created profile as default profile for the dashboard
-
Use Update button to save the new dashboard profile
How to edit/ delete dashboard profile
Create dashboard profile in EventLog Analyzer using the following menu:
- Home tab > Dashboard > + Profile
Profiles
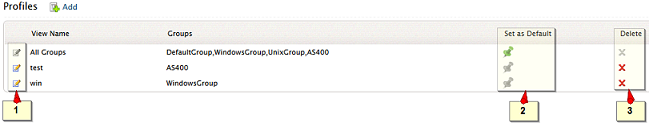
+ Profile menu will take you to the Profiles page, where all the view profiles are listed. In the Profiles table, all the profiles added to EventLog Analyzer are displayed with edit icons, host group(s) available for the profile, set as default menu icons, and delete icons.
-
How to edit a profile?
On the table row of a specific profile Edit menu icon is available. Use the icon to edit the selected profile.
-
How to set it as default profile?
On the table row of a specific profile Set as default menu icon is available. Use the icon to set the selected profile as default profile.
-
How to delete a profile?
On the table row of a specific profile Delete menu icon is available. Use the delete icon to delete the selected profile.
Set as default profile
If you want to make any particular profile as the default dashboard profile, you have pin-it to the dashboard by selecting the profile from the drop-down list of profiles and then clicking the ‘Pin’ on the right-hand-side of the drop-down list.
Customize dashboard graph display
-
The graphical charts (widgets) displayed in the dashboard are, All Events, Alerts, Important Events, Event Category, Security Events, and Log Trend. The graphical charts can be selectively displayed in the dashboard using the Customize link.
-
The widgets can be dragged and dropped to any position in the dashboard.

