Windows Event ID 1000: Troubleshooting guide
Last updated on:In this page
What is Event ID 1000?
Event ID 1000 is the Windows Application Error event. Windows writes it to the Application event log whenever a program crashes without warning. You'll find these entries in Event Viewer under Windows Logs > Application, with the source listed as Application Error.
Event ID 1000 is a diagnostic record, not a diagnosis. It tells you that something crashed. It does not tell you why. Two Event ID 1000 entries can look almost identical in the summary view and have entirely different root causes: one from a driver conflict, a corrupted DLL, and a bad update.
Event log monitoring is crucial to find the cause of such application errors. For this, three fields must be read together: The Faulting Application Name (what crashed), the Faulting Module (which component the fault happened inside), and the Exception Code (the type of fault).
Stay ahead of application crashes
Track Event 1000 errors, investigate crash activity, and get real time alerts with EventLog Analyzer.
How to read Event ID 1000 in Windows Event Viewer
Step 1: Open and Filter the Windows Application Event Log
- Press Win + R, type eventvwr.msc, and press Enter.
- In the left pane, expand Windows Logs and click Application.
- In the right-hand Actions pane, click Filter Current Log.
- Type 1000 into the Event IDs field, then click OK.
- Click the most recent Event ID 1000 entry to open its details in the lower pane.
You now have every application crash recorded on this machine, filtered from the noise.
Step 2: Interpreting the Faulting Application Name and Exception Code
Each Event ID 1000 entry has eight fields worth reading:
- Faulting Application Name: the executable that crashed (e.g., dwm.exe, explorer.exe, chrome.exe).
- Faulting Application Path: the full file system location of that executable.
- Faulting Module: the DLL or component where the fault actually occurred. This is often more useful than the application name. An application can crash because of a module it loaded.
- Exception Code: a hex code identifying the fault type. 0xc0000005 is the most common; it means access violation, usually memory corruption or bad pointer use. 0xc00001ad indicates a serious internal error.
- Fault Offset: the memory address within the faulting module where the crash happened. Useful for developers, less so for admins.
- Faulting Process ID: the PID of the crashed process at the time of the fault.
- Faulting Application Start Time: when the application launched.
- Report ID: a unique identifier for this specific crash report.
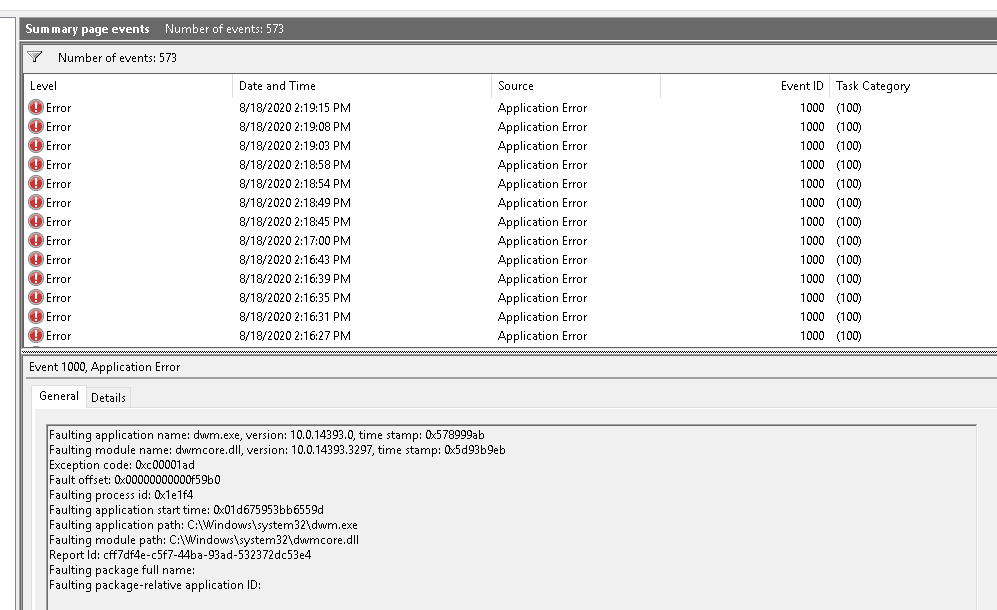
The following example explains how to interpret an Event ID 1000 entry:
- Event ID 1000 entry indicates that the application "dwm.exe" version "10.0.14393.0" crashed.
- The fault occurred in the module "dwmcore.dll", which is version "10.0.14393.3297".
- The Exception code "0xc00001ad" signifies a serious error within a program, often related to memory corruption or access violations.
- The Fault Offset "0x00000000000f59b0" provides a memory address within the module where the error occurred.
- The Faulting Process ID "0x1e1f4" shows the unique ID of the process at the time of crash.
- The Faulting Application Start Time "0x01db75953bb6559d" marks when the application was launched.
- The Faulting Application Path and Faulting Module Path give the full paths to the executable and module involved in the crash, respectively.
- The Report ID is a unique identifier for this specific error report, useful for tracking and diagnostics. This detailed information helps diagnose and address the underlying issues causing application crashes.
After finding the Event ID 1000 entry, look at the 10 to 20 events immediately before it in the Application and System logs. The warnings, errors, or unusual service starts in that window often name the underlying trigger. This is how you turn a symptom into a root cause.
Common causes of application errors (Event ID 1000)
The faulting module and exception code narrow the cause quickly. Match the pattern in the entry to one of the categories below.
- Corrupted system files or DLLs: A protected Windows file has been overwritten, replaced, or damaged. Faulting modules like ntdll.dll, kernelbase.dll, or msvcrt.dll often point here.
- Corrupted or version-mismatched .NET Framework: Applications built on .NET fail when the installed framework version is missing, downgraded, or partially updated. Look for mscorlib.dll, clr.dll, or KERNELBASE.dll in the faulting module field.
- Missing or outdated Visual C++ Redistributable: Many desktop applications ship expecting a specific VC++ Redistributable version. When the wrong one is installed, or a required one is missing entirely, the app crashes on load or during a specific action.
- Graphics driver conflicts: Any Event ID 1000 with dwm.exe, dwmcore.dll, nvwgf2umx.dll (Nvidia), or atidxx64.dll (AMD) in the module field is almost always a driver issue.
- Third-party software conflicts: Screen overlays, capture tools, antivirus hooks, and game bar utilities (GameBar.exe) inject themselves into other processes and can crash them. If the crash happens only when a specific tool is running, this is your cause.
- Memory corruption or memory leaks: The application uses more memory than the system can allocate, or corrupts its own memory space during operation. Exception Code 0xc0000005 is the classic signal here.
- Outdated Windows or application builds: Some Event ID 1000 crashes are fixed in later patch levels. If the crashing app and OS haven't been updated in a while, that's a legitimate place to start.
How to fix application errors (Event ID 1000)
Work these steps in order. Each one fixes a different class of problem, and later steps assume earlier ones didn't resolve it.
Step 1–2: Run System File Checker and DISM
Corrupted Windows files are the most common single cause. Two built-in tools handle this: System File Checker (SFC) scans and repairs protected system files, and DISM Deployment Image Servicing and Management (DISM) repairs the Windows component store that SFC pulls its replacement files from.
Run DISM first and then run SFC because SFC needs a healthy repair source to work from, and DISM restores that source.
- Right-click Command Prompt and choose Run as administrator. (SFC and DISM both need admin privileges.)
- Run: DISM.exe /Online /Cleanup-image /Restorehealth—wait for completion.
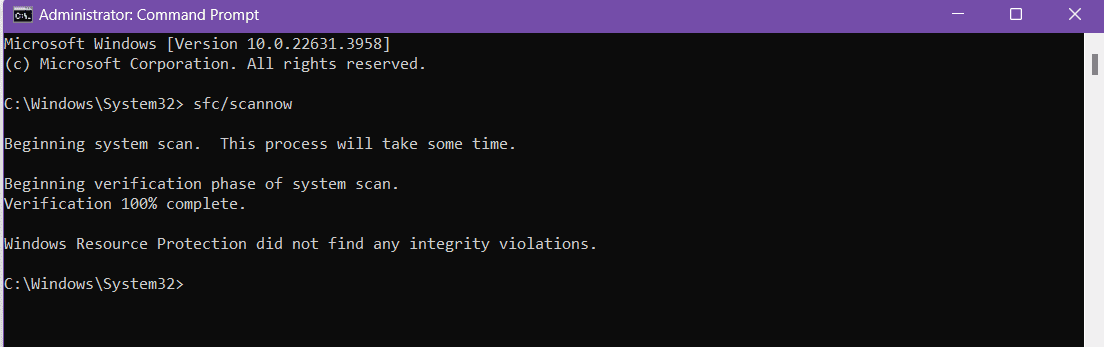
- Run: sfc /scannow—wait until the scan reaches 100%.
- Read the output. If SFC reports "Windows Resource Protection did not find any integrity violations," system files are clean. If it repaired files, restart and check whether Event ID 1000 recurs.
Step 3–4: Repair .NET Framework and Visual C++ Redistributable
If Event ID 1000 hits .NET-based applications, or the faulting module is a CLR file:
- Open Control Panel > Programs > Programs and Features > Turn Windows features on or off.
- Uncheck the installed .NET Framework versions, click OK, and restart.
- Download the current .NET Framework installer from the official Microsoft page.
- Run the installer, then restart.
For Visual C++ crashes (faulting modules like MSVCP140.dll, VCRUNTIME140.dll), download and reinstall both the VC++ 2015–2022 Redistributable (x86 and x64) from Microsoft's site. Installing both architectures matters: 32-bit and 64-bit applications each load their own version.
Step 5–7: Update Windows, Drivers, and Perform a Clean Boot
Update Windows: Go to Settings > Update & Security > Windows Update > Check for updates. Install any pending updates. Restart when prompted.
Update or roll back graphics drivers: For any dwm.exe crash, or Event ID 1000 entries that name a GPU vendor DLL, the driver is the first suspect.
- Open Device Manager, expand Display adapters, right-click the GPU, and choose Update driver.
- Or go to Properties > Driver > Roll Back Driver if the crashes started after a recent driver update.
- On workstations, download the driver directly from Nvidia, AMD, or Intel rather than relying on Windows Update; the vendor's build is usually newer.
Perform a Clean Boot: This isolates third-party software conflicts.
- Press Win + R, type msconfig, press Enter.
- On the Services tab, check Hide all Microsoft services, then click Disable all.
- Open Task Manager > Startup and disable all startup entries.
- Restart. If Event ID 1000 stops, re-enable services and startup items in batches until the crash returns; the last group you re-enabled contains the culprit.
Fixing dwm.exe Event ID 1000 crashes
dwm.exe is the Desktop Window Manager. It composes what you see on screen: window transparency, animations, and the whole visual output layer. When Event ID 1000 names dwm.exe, the crash almost always ties back to graphics.
Read the Faulting Module field first. It splits the diagnosis in two:
- Faulting Module is dwmcore.dll or a vendor GPU DLL (nvwgf2umx.dll, atidxx64.dll, igdumdim64.dll)—this is a graphics driver problem. Update the GPU driver, or roll it back if the crashes started after a driver update.
- Faulting Module is ntdll.dll, kernel32.dll, or another Windows system DLL—this is a system file problem. Run DISM and SFC per Step 1–2.
Verify dwm.exe isn't malware. The legitimate file lives at C:\Windows\System32\dwm.exe. If the Faulting Application Path shows a different location, the process is impersonating dwm.exe and you're looking at a malware issue, not a crash issue. Run a full antivirus scan.
If graphics driver updates don't resolve dwm.exe crashes and SFC finds no issues, disable hardware acceleration in any app you suspect (browsers, Office, video players) as a temporary workaround while you investigate further.
Monitor and analyze Event ID 1000 at scale
ManageEngine EventLog Analyzer collects Windows event logs from every endpoint into a single console, filters them centrally, and alerts you the moment an Event ID 1000 fires, instead of waiting for a user ticket.
The tool provides out-of-the-box event log reports that group Event ID 1000 entries by device, application, and time. You can see at a glance whether a crash is one-off or a pattern across the fleet.
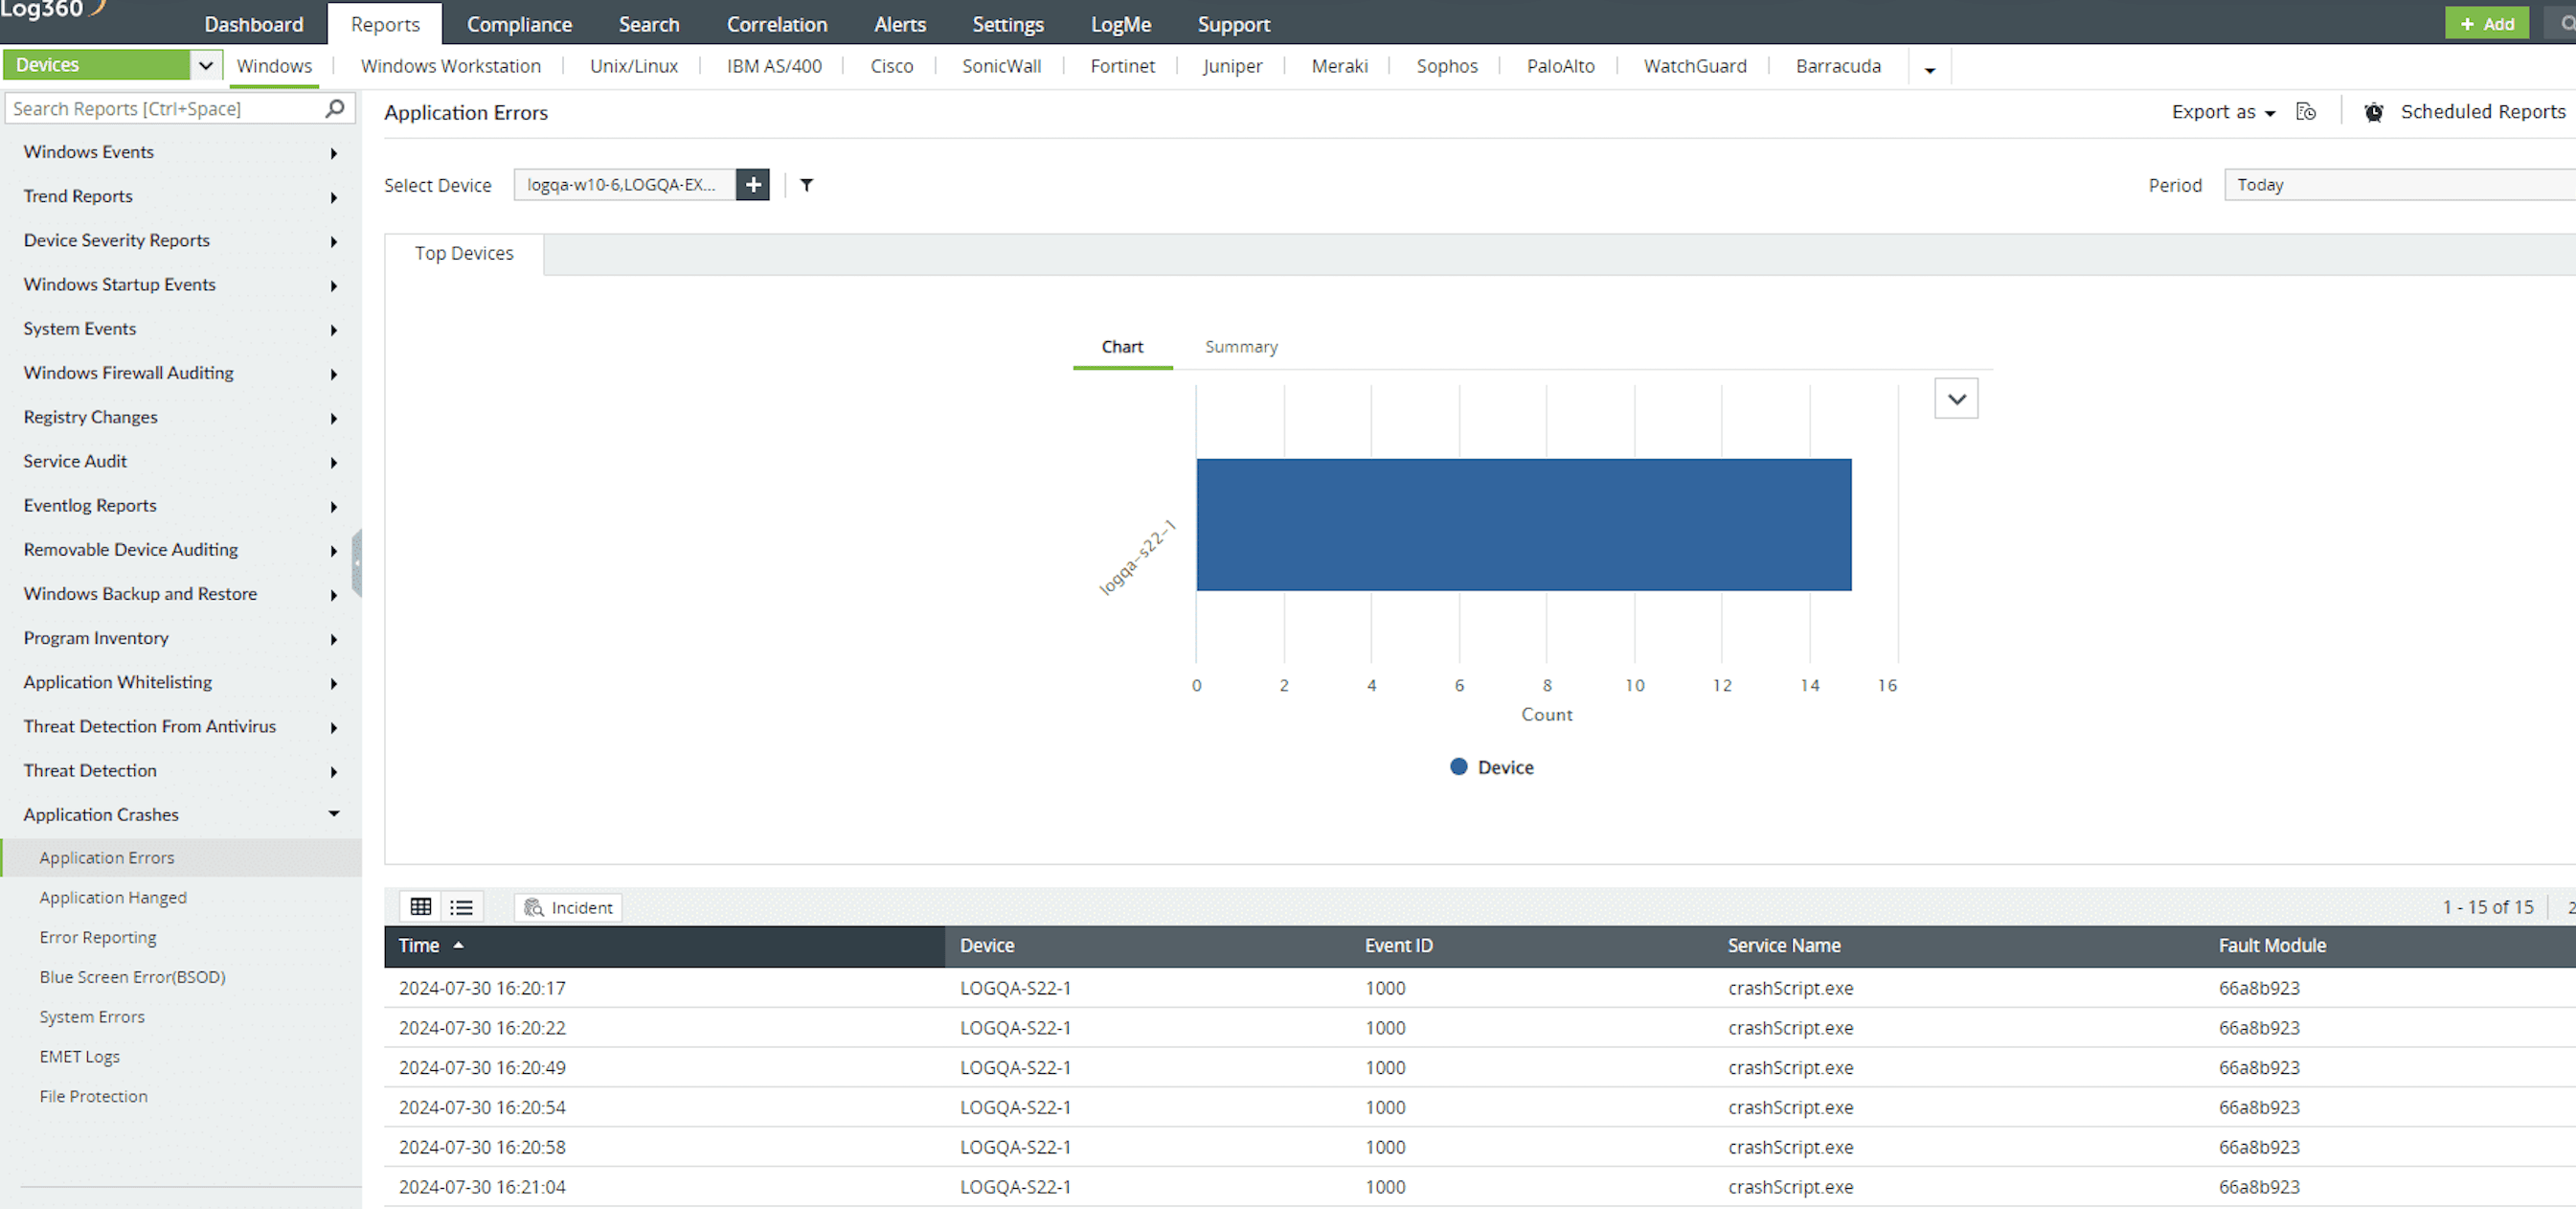
A predefined event log alert profile for critical application crashes fires the moment an Event ID 1000 event is written. Alerts can be scoped to specific devices, tuned with smart thresholds (to trigger only when crash rates spike beyond normal), and paired with predefined workflows that take action automatically.
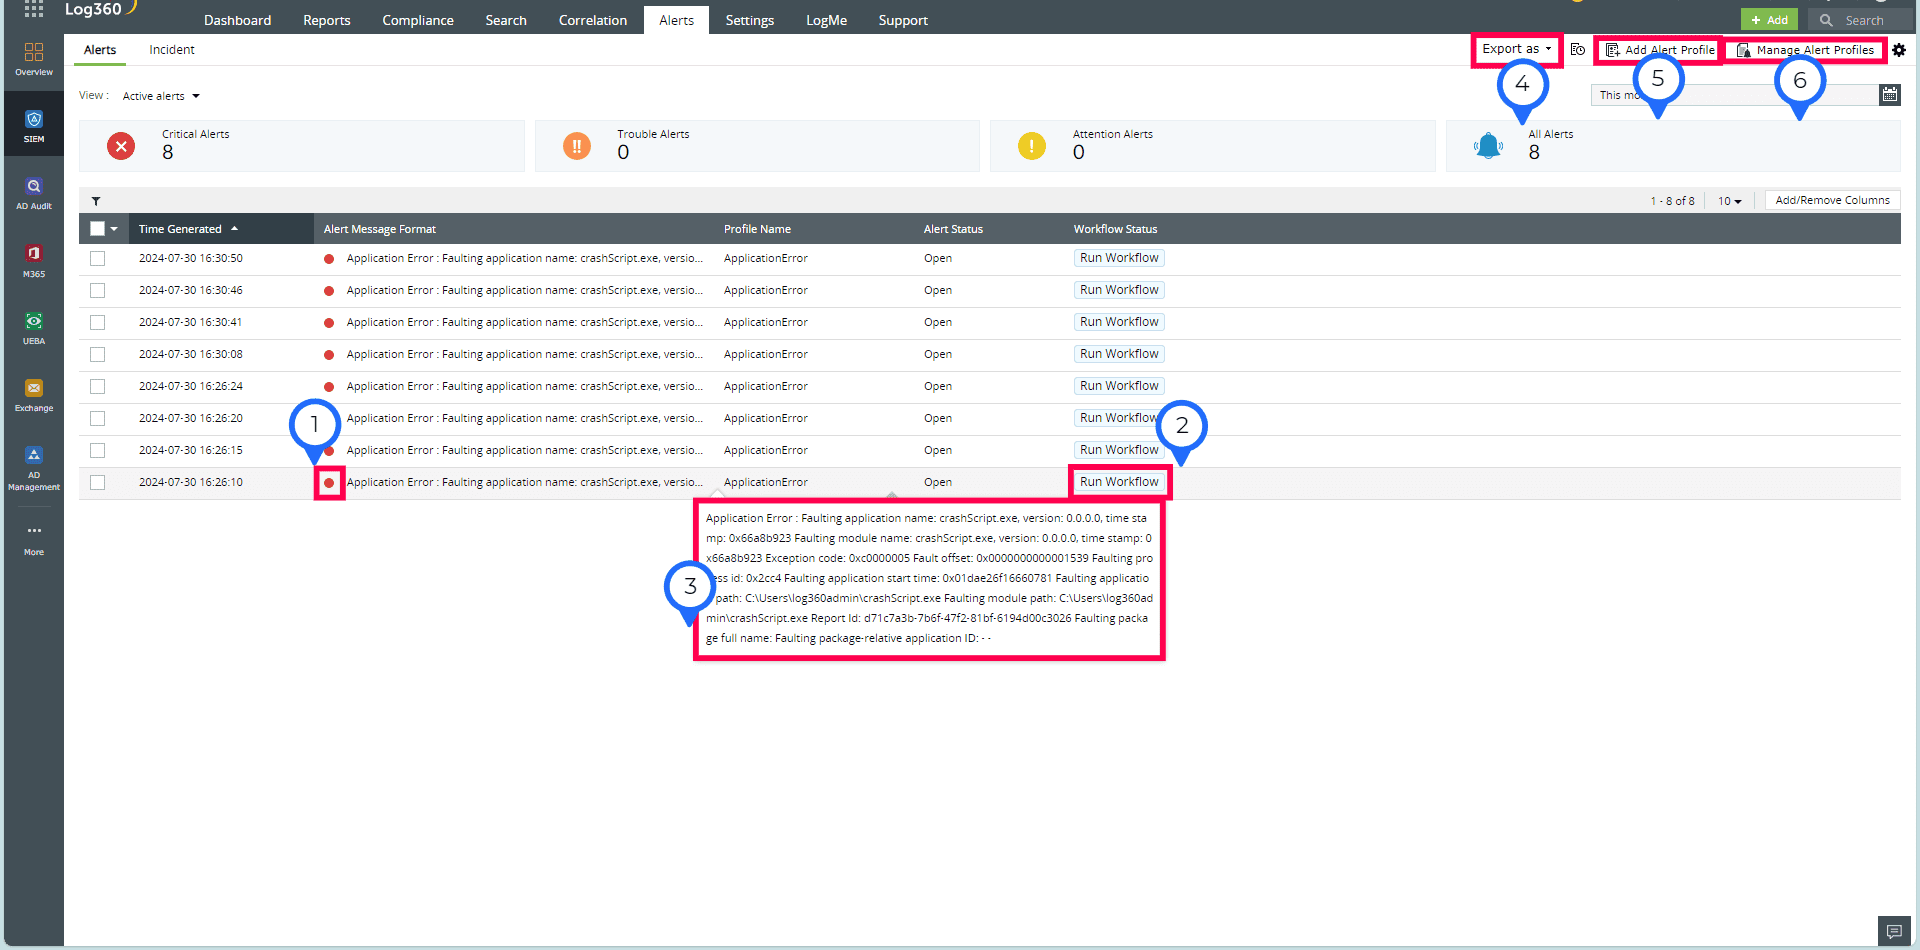
- This section indicates the severity level of the alert, highlighting the urgency and importance of the situation. Severity levels help categorize alerts based on their impact to enable quicker prioritizations and responses.
- After generating the workflow, you can initiate a sequence of predefined actions tailored to mitigate and control the impact of the detected event.
- You can obtain a detailed summary of the detected anomaly, including essential information needed to understand it, as well as receive a clear overview so you can provide a swift analysis and deliver accurate decision-making.
- For documentation and further analysis, you can export the alert details in CSV or PDF formats. These exports are useful for reporting purposes, record-keeping, and sharing information with stakeholders.
- You have the flexibility to add and customize alert profiles to suit your specific monitoring needs.
- You can also manage your alert profiles efficiently by enabling or disabling profiles based on your current requirements. This empowers you to ensure these align with your operational priorities.
Leverage EventLog Analyzer to obtain deep-dive details on application crashes, BSOD analysis, and other system errors.
Frequently asked questions (FAQs)
Can I ignore DCOM errors?
DCOM errors are logged under Event ID 10016, not 1000; they're a different event class entirely and the two shouldn't be confused. Event ID 10016 is often safe to ignore on standalone workstations; it typically indicates a permissions issue for the Local Activation of a COM component and doesn't affect end-user functionality. Event ID 1000, on the other hand, records an actual application crash. Recurring Event ID 1000 entries for the same executable—especially system processes like dwm.exe, explorer.exe, or services.exe—should be investigated. One-off crashes in a non-critical app can usually wait; a pattern cannot.
What does Event ID 1000 mean in a Windows Explorer.exe crash log?
It means the Windows shell—taskbar, Start menu, and File Explorer—crashed. The faulting module usually reveals the culprit: a third-party shell extension, codec, or context-menu handler. Use ShellExView to disable non-Microsoft extensions and clear the thumbnail cache.