How to troubleshoot Event ID 1002: An application hang in Windows
Last updated on:Quick answer:
What is Event ID 1002?
Event ID 1002 is a Windows Application event log entry, logged by the Application Hang source, that appears when a program stops interacting with Windows and is closed. It records the faulting application name and version and a hang type, and it is Windows' way of noting that the app stopped responding, not an error the app itself returned.
Fastest triage: Open Event Viewer (eventvwr) -> Windows Logs -> Application, filter for Event ID 1002, and read the faulting application name and hang type on the General tab. Repeated 1002 entries for the same program usually point to system file corruption, low memory, or a third-party add-in. Identify the faulting process, repair system files with SFC and DISM, adjust virtual memory if RAM is tight, and use Safe Mode to rule out third-party software.
In this page
- What event ID 1002 Application Hang means and how to read it in Event Viewer
- How to identify the faulting process (explorer.exe and others)
- Running SFC to repair corrupted system files
- Using DISM when SFC cannot resolve the issue
- Adjusting virtual memory to prevent application hangs
- Using Safe Mode to isolate the cause of the hang
- Verifying the fix and monitoring for recurring application hangs
- How EventLog Analyzer helps analyze and troubleshoot event ID 1002
What event ID 1002 means and how to read it in Event Viewer
Event ID 1002 is logged in the Windows Application event log when an application stops responding to Windows and is subsequently closed. The event is recorded with Application Hang as the source and Task Category 101.
The event description typically indicates that the application stopped interacting with Windows and was closed. Windows Error Reporting (WER) can provide additional information about the incident and direct you to the problem history in Security and Maintenance.
Event ID 1002 may also be referred to as Windows Event ID 1002, error code 1002, or status code 1002 in troubleshooting searches. In this context, 1002 is an event ID, not an HTTP, networking, or Windows error/status code. It identifies an application hang event in the Windows Application log.
When analyzing event ID 1002, focus on the faulting application name, application version, and hang type recorded in the event details. These details provide more useful information for identifying the cause and troubleshooting the application than the event ID itself. When these events occur across multiple Windows systems, Windows log management can help centralize the logs and make recurring application hangs easier to monitor and investigate.
To read it, open Event Viewer and filter the Application log:
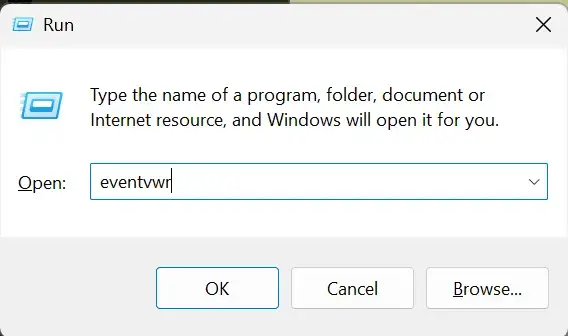
- Press Win + R, type eventvwr, and press Enter to open Windows Event Viewer.
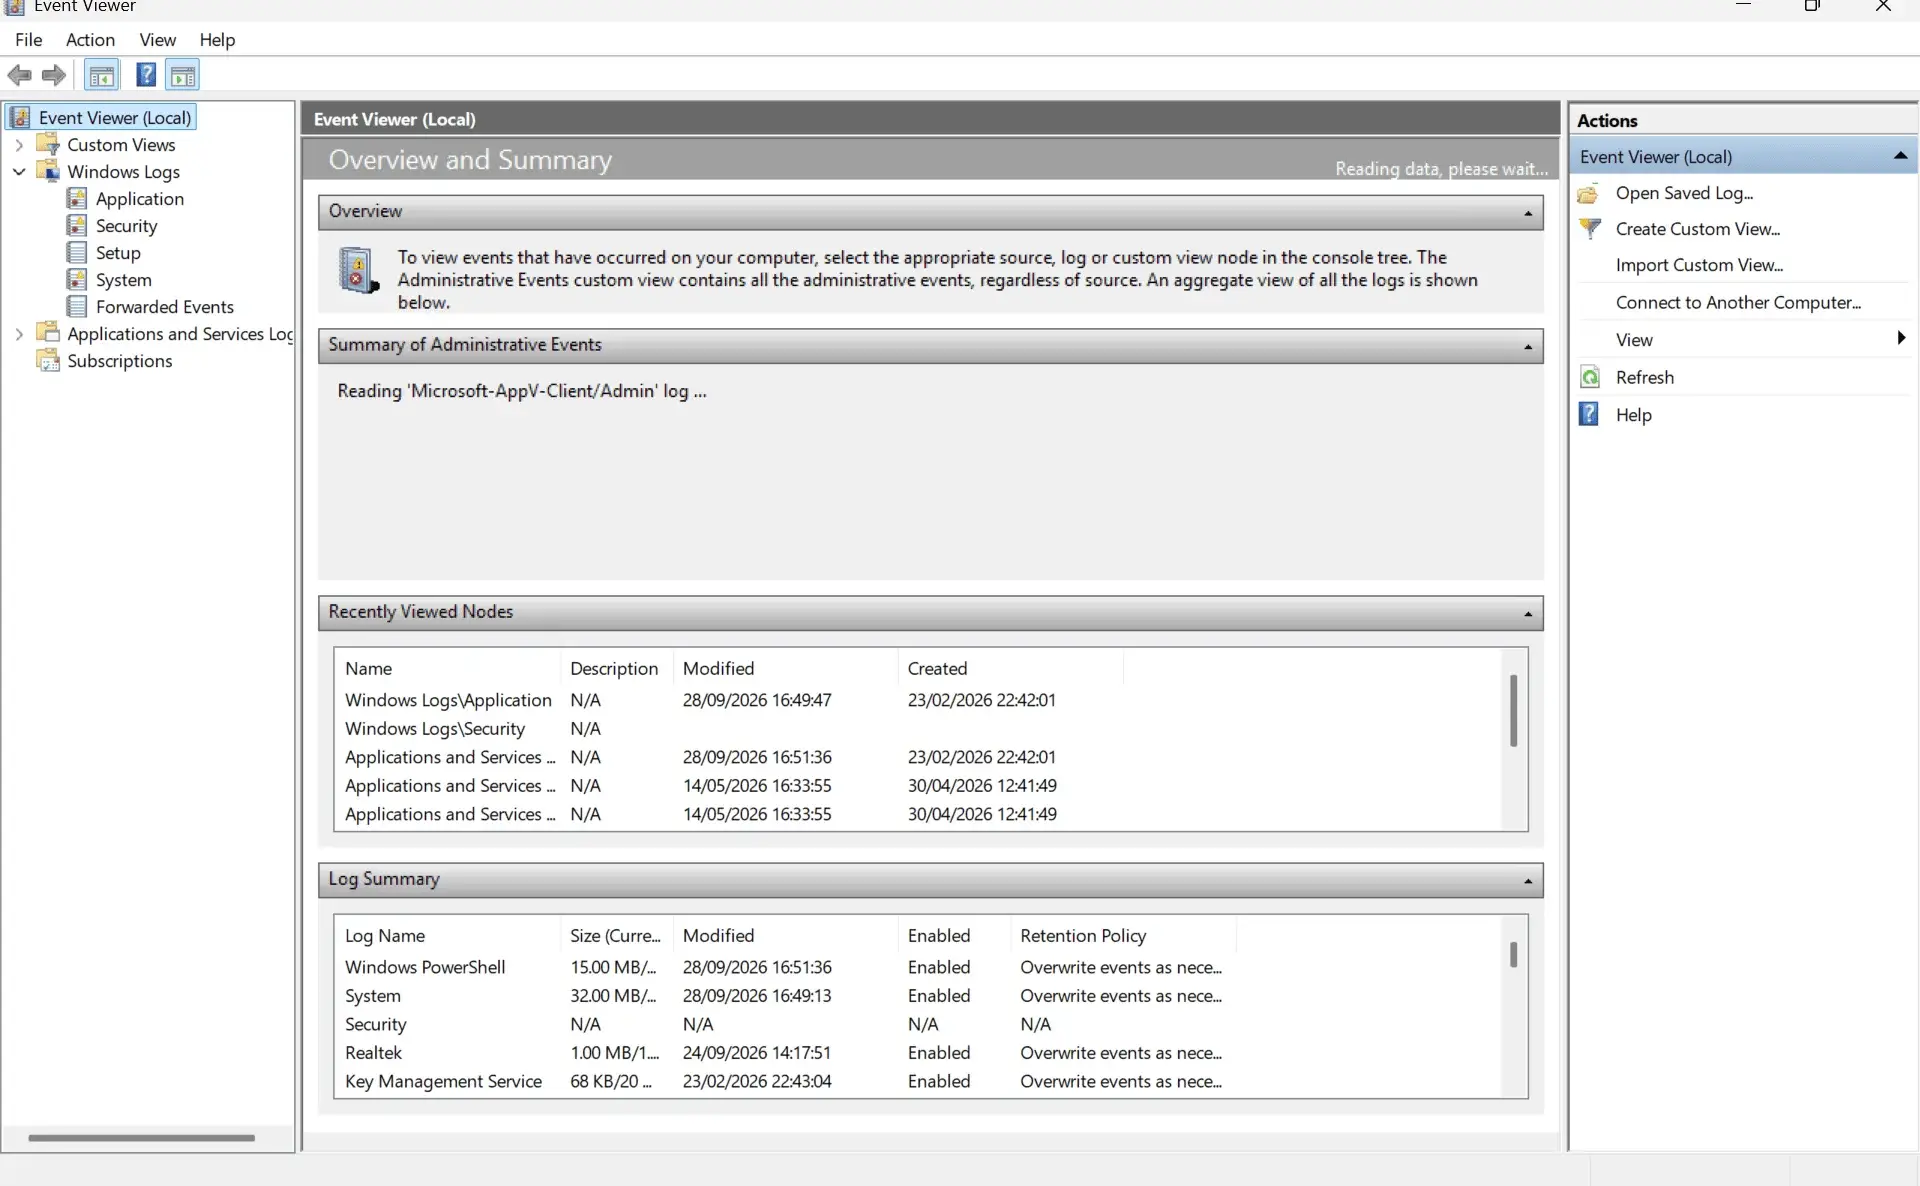
- In the left pane, expand Windows Logs and select Application.
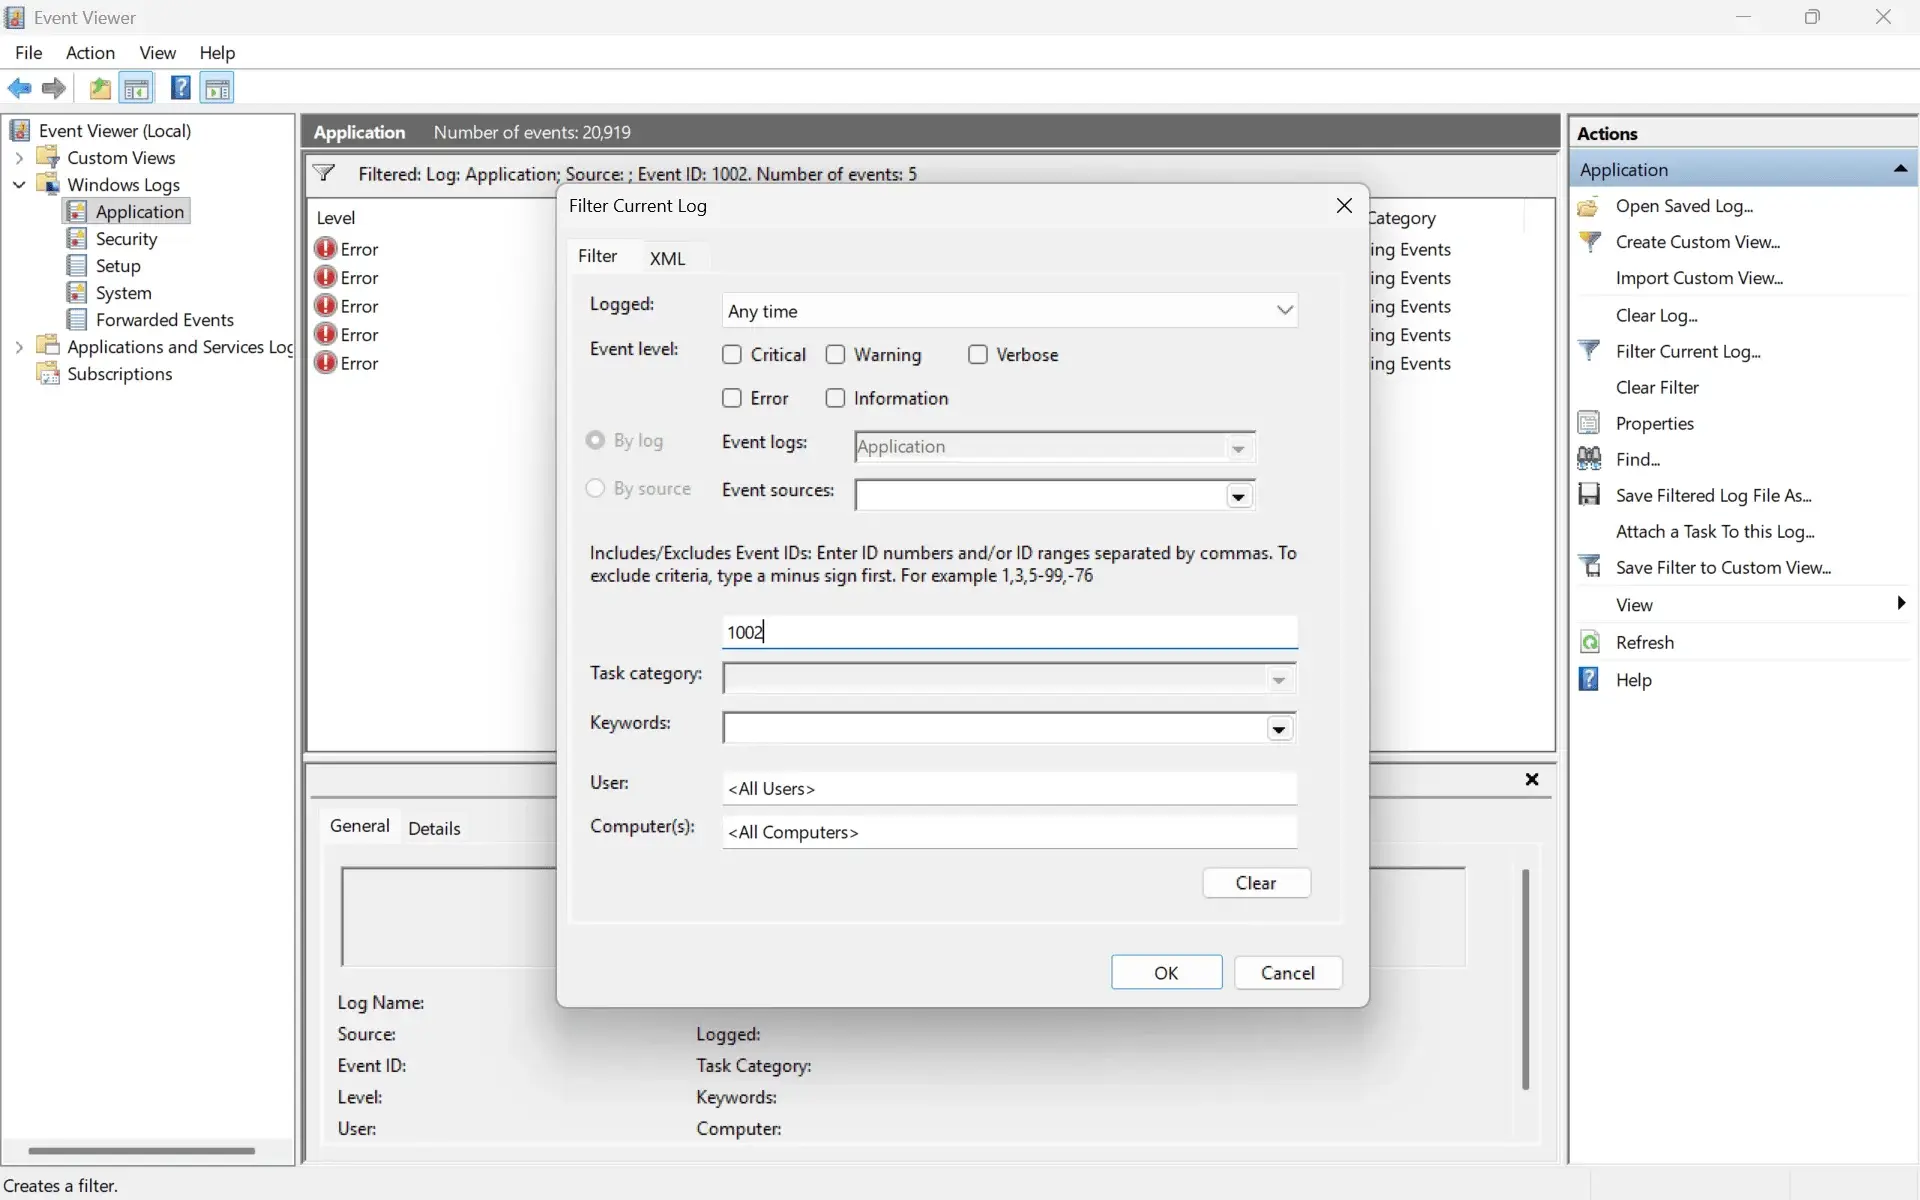
- In the Actions pane, click Filter Current Log, enter 1002 in the Event IDs box, and click OK.
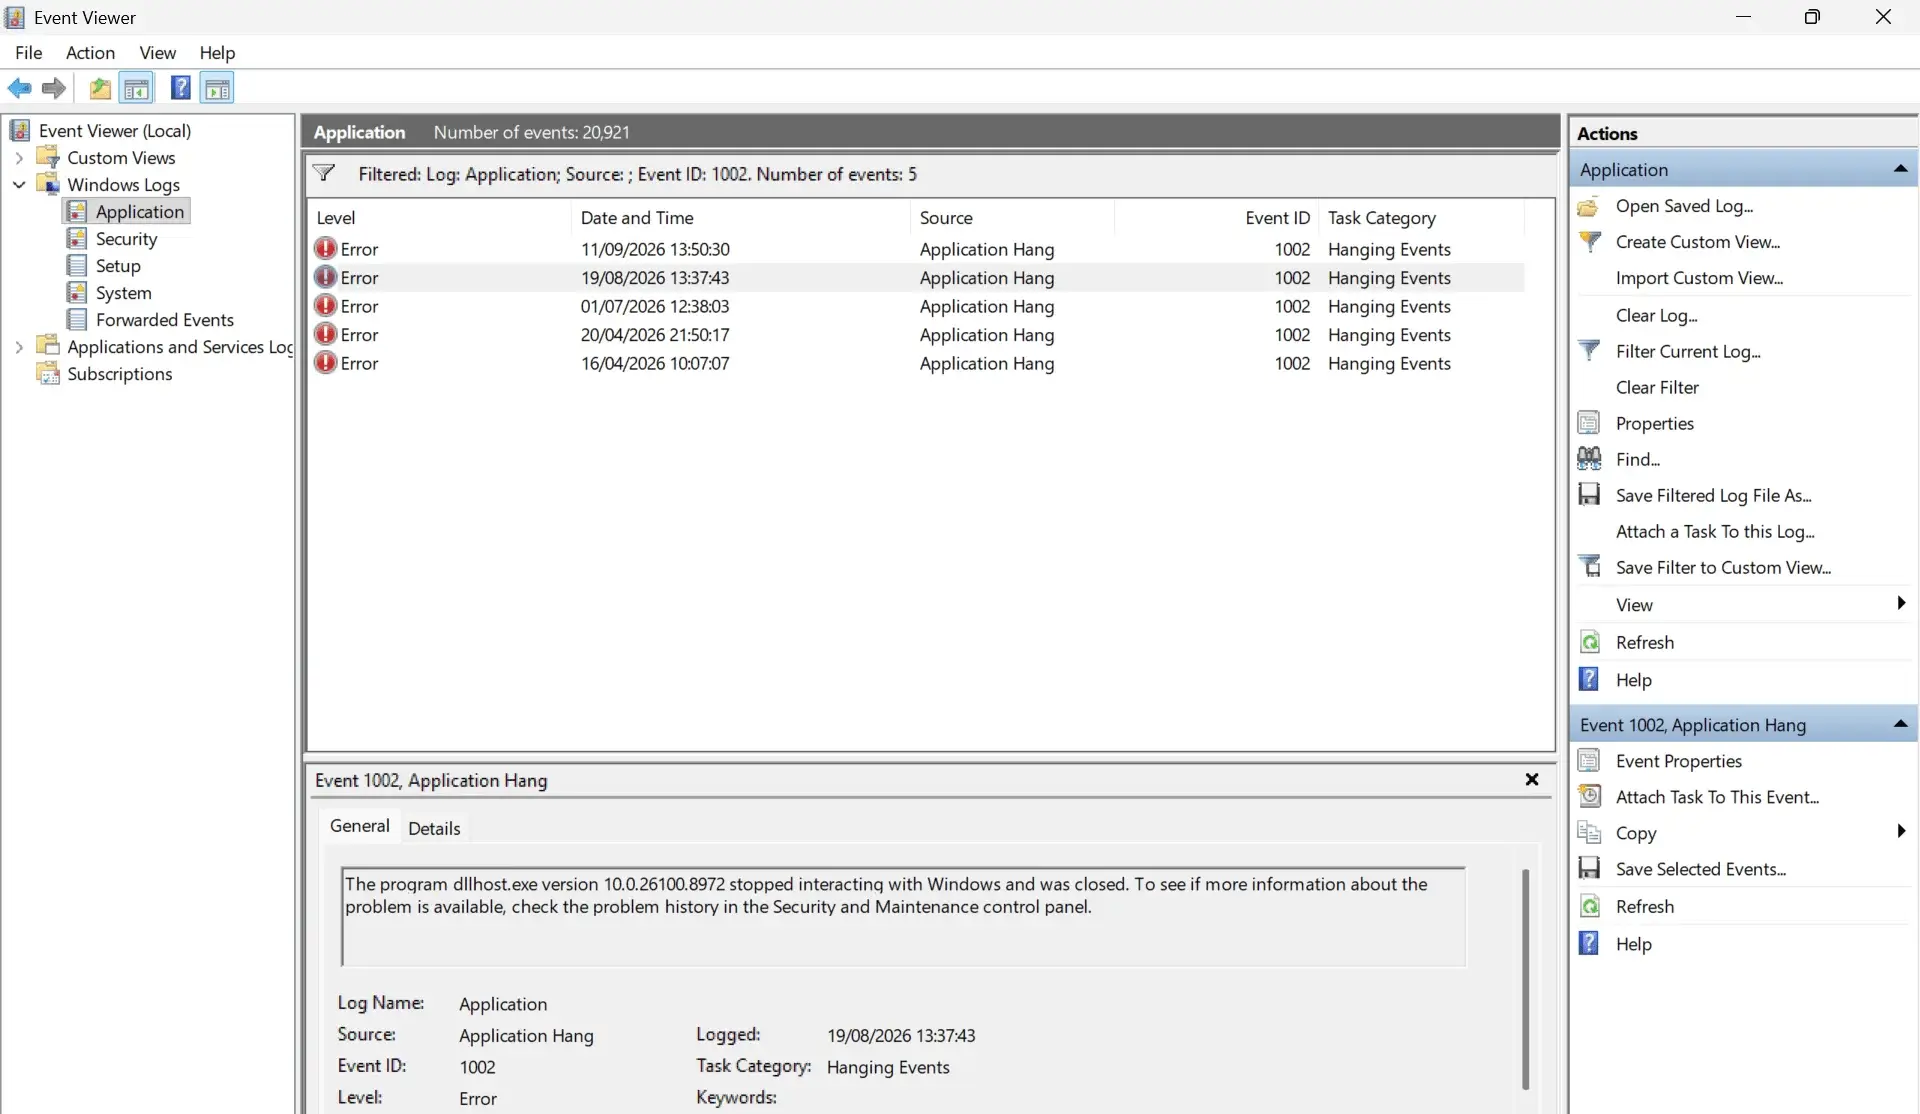
- Select an entry and read the General tab for the faulting application name, version, and hang type. Note the timestamp so you can correlate it with what you were doing when the program froze.
Key fields in the event ID 1002 log entry
Each 1002 entry exposes the same core fields in detail pane:
- Event ID: 1002
- Source: Application Hang
- Task Category: 101
- Hang type: A short label describing how the app stalled (for example, the top-level window went idle).
- Faulting application name and version: The program that stopped responding, which is your primary clue.
- Windows Error Reporting reference: A prompt to check the problem history in Security and Maintenance for the matching report.
Get deeper visibility into application hangs across your environment
Centralize Application Hang activity from every Windows endpoint and alert on repeated hangs in real time.
How to identify the faulting process (explorer.exe and others)
The faulting application name in the entry identifies which process hung, and that name determines every step that follows. The most commonly reported process is Windows Explorer (explorer.exe). Because Windows Explorer draws the taskbar, Start menu, and desktop, a hang there freezes the entire shell: the taskbar stops responding, icons do not react, and File Explorer windows go blank.
Cross-reference the process in Task Manager to confirm which one is unresponsive. Press Ctrl + Shift + Esc, locate Windows Explorer (explorer.exe) on the Processes tab, and check its CPU and memory use. If it is unresponsive, right-click it and choose Restart to reload the shell without restarting the computer. Business applications also generate event ID 1002. Outlook is a frequent source, usually because of a slow add-in or a mailbox waiting on the server.
After identifying the process, isolate it. Safe Mode loads only the drivers and services Windows requires and leaves third-party software out, so if the hang does not recur there, the cause is an installed component rather than Windows itself. Clean boot troubleshooting is the next step to narrow down the specific application or service. For additional detail on any hang, open the problem history in Security and Maintenance, where Windows Error Reporting stores the report that matches the event.
How to run SFC to repair corrupted system files
Corrupted or missing protected system files are a common root cause of repeated application hangs, which makes this the first repair to run. It is quick and non-destructive. The System File Checker (SFC) scans the protected system files and repairs any that are damaged. Run it before adjusting virtual memory or reinstalling applications.
- Click Start, type cmd, right-click Command Prompt, and choose Run as administrator.
- Type the following command, then press Enter: sfc /scannow
- Wait for the scan to reach 100%. Do not close the window while it runs.
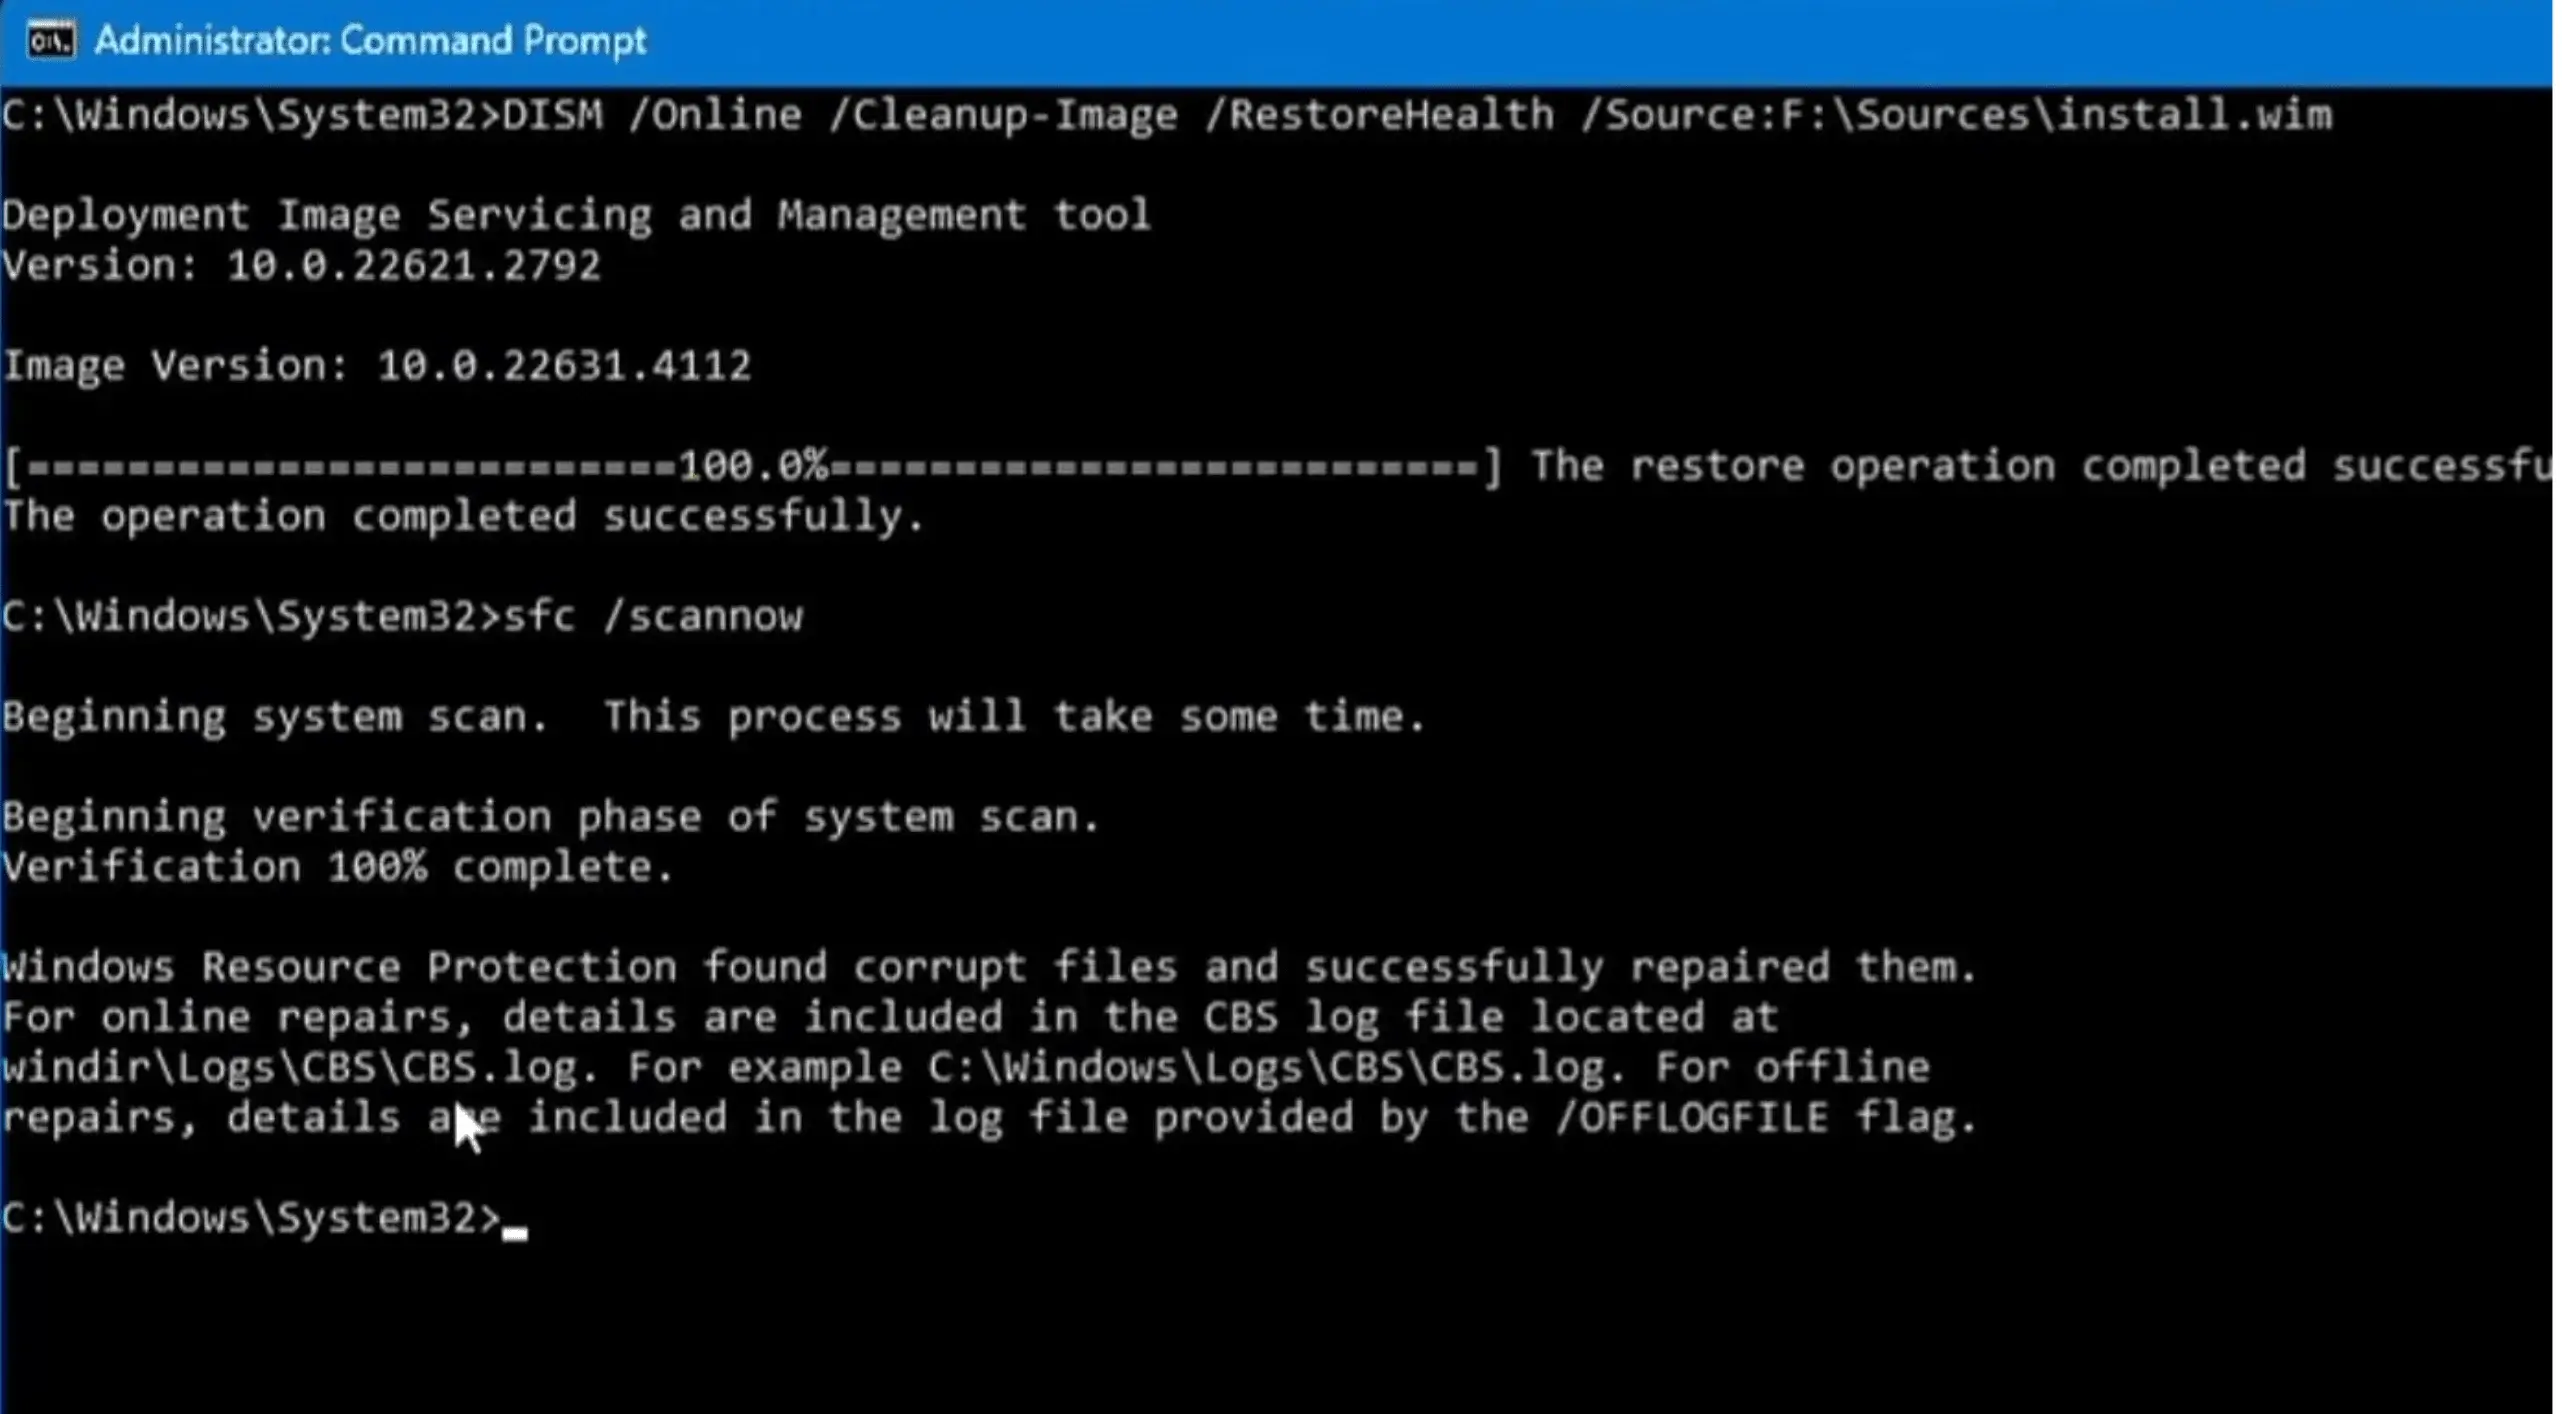
The result line reports the outcome. "Windows Resource Protection did not find any integrity violations" means the system files are intact, so the cause lies elsewhere. "Found corrupt files and successfully repaired them" means SFC resolved the problem; restart and check the Application log. "Found corrupt files but was unable to fix some of them" means SFC could not complete the repair on its own, and the next step is to run DISM. The commands work the same way on Windows 10 and Windows 11.
How to use DISM when SFC cannot fix the hang
When SFC reports files it could not repair, the Deployment Image Servicing and Management tool (DISM) is the next step. SFC copies its replacement files from a local component store, and if that store is also damaged, SFC has no valid source to copy from. DISM repairs the component store so that SFC can complete its repair.
- Open Command Prompt as administrator again.
- Run the restore-health command: DISM /Online /Cleanup-Image /RestoreHealth
- Let it finish. It usually takes several minutes and can pause around 20% or 40%, which is normal. Keep the machine online, since DISM may pull healthy files from Windows Update.
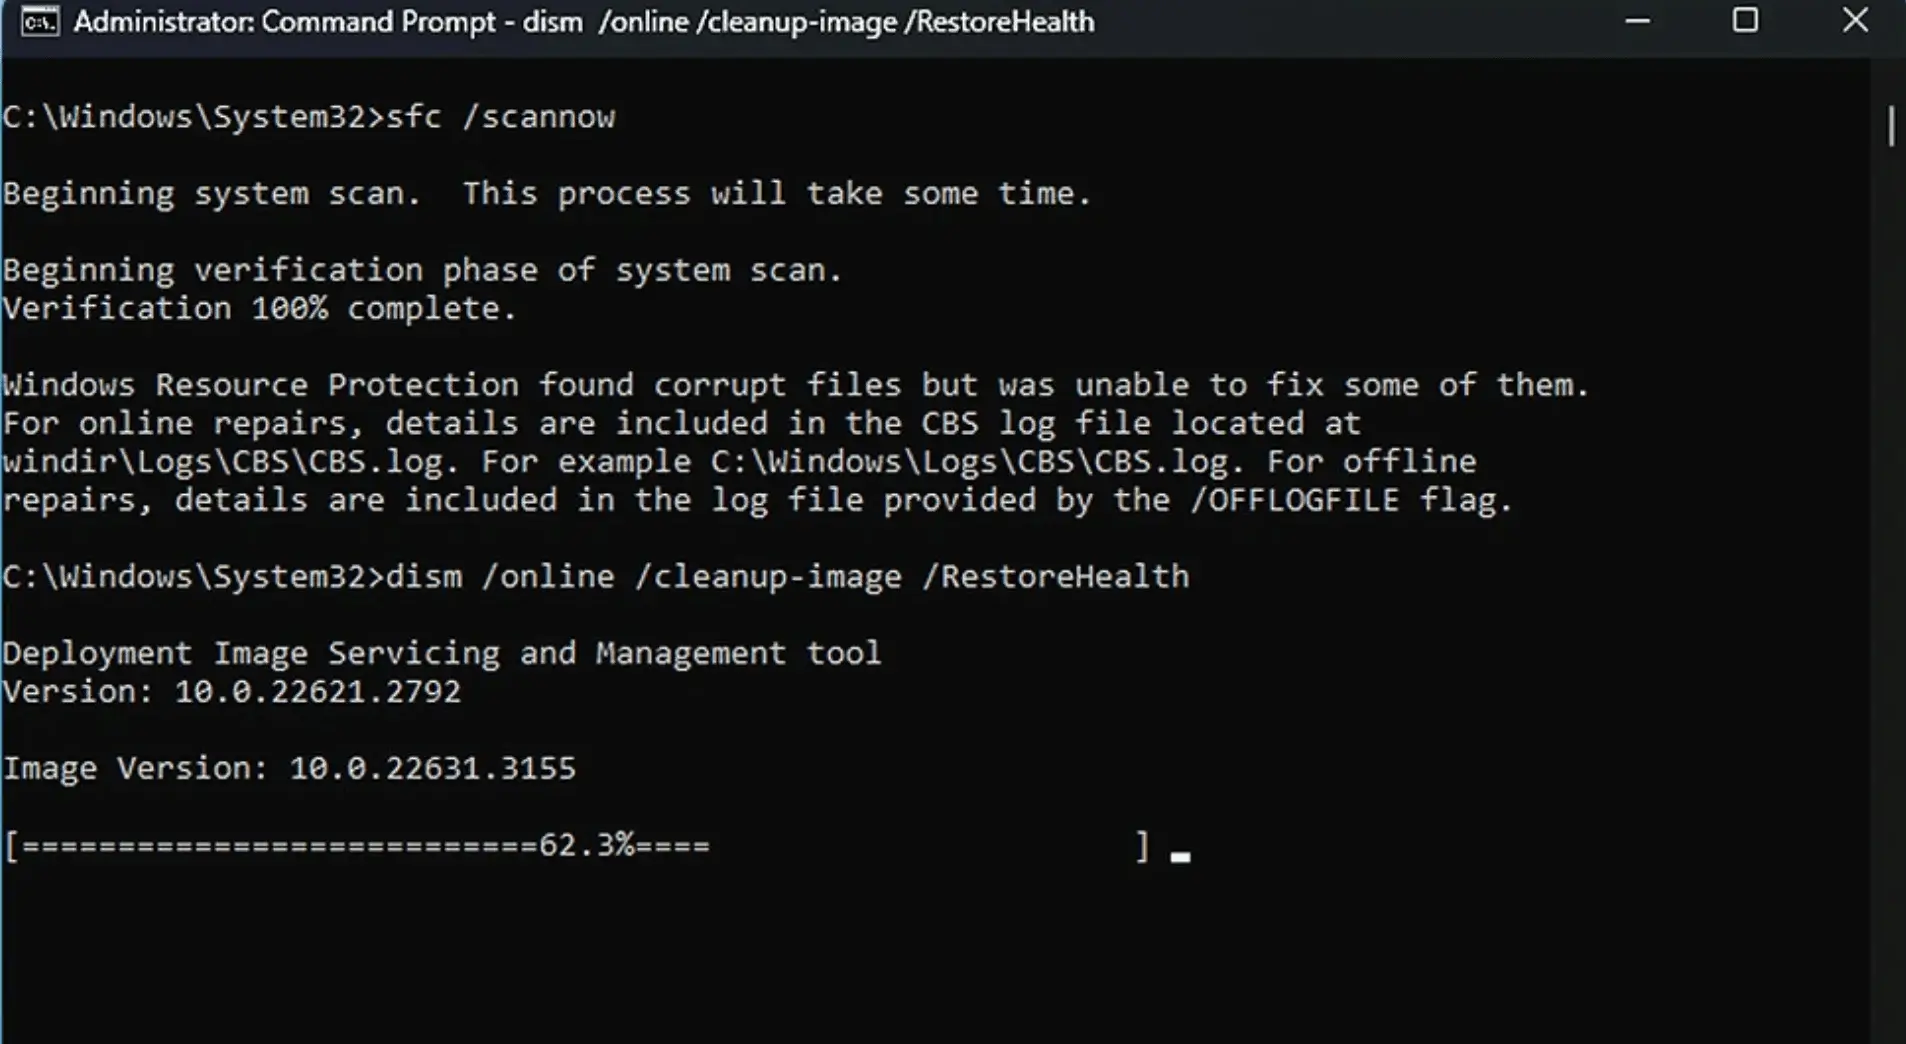
A "The restore operation completed successfully" message confirms the component store is healthy. After DISM finishes, run sfc /scannow again so SFC can repair the protected files it could not fix earlier. The DISM online cleanup-image pass followed by a second SFC scan resolves most corruption-driven hangs on Windows 10 and Windows 11.
How to adjust virtual memory to prevent hangs
When the machine runs low on memory, applications stall while Windows allocates space, and those stalls can surface as event ID 1002. Virtual memory (the paging file) provides disk-backed space that Windows uses when physical RAM fills up. If the paging file is too small, memory-intensive applications freeze, and increasing its size often stops the hangs.
- Press Win + R, type sysdm.cpl, and press Enter to open the System Properties (advanced system settings) dialog.
- On the Advanced tab, under Performance, click Settings.
- In Performance Options, open the Advanced tab and click Change under Virtual memory.
- Clear Automatically manage paging file size for all drives, select your system drive, and choose Custom size.
- Set the values. A common paging file size adjustment is an initial size of about one and a half times your installed RAM and a maximum of about three times RAM. Click Set, then OK.
- Restart the computer so the change takes effect.
On systems with sufficient RAM, allowing Windows to manage the paging file is usually adequate; set a custom size only if low-memory hangs have already occurred. A related check: an application waiting on a network resource can stall in the same way, and an IP address conflict is a common trigger. To resolve one, release and renew the address from an elevated Command Prompt with the following command:
sfc /scannow
ipconfig /release followed by ipconfig /renew
How to boot into Safe Mode to isolate the cause
Safe Mode is a diagnostic environment that loads only the core Windows drivers and services. Because it excludes third-party software, it is the most direct way to determine whether the faulting process behind event ID 1002 belongs to Windows or to an installed application.
- Go to Settings > System > Recovery (Update & Security > Recovery on Windows 10) and click Restart now under Advanced startup.
- After the reboot, choose Troubleshoot > Advanced options > Startup Settings > Restart.
- Press 4 (or F4) for Safe Mode, or 5 for Safe Mode with Networking.
You can also enable safe boot from msconfig: open it, go to the Boot tab, tick Safe boot, and restart. (Clear that checkbox afterward to boot normally again.)
Observe the application's behavior in Safe Mode. If it no longer hangs, a third-party program or driver is the cause, and clean boot troubleshooting will identify which one. If the hang still occurs in Safe Mode, the cause is more likely system file corruption or failing hardware, which points back to SFC and DISM, and to a memory test if the problem persists.
How to verify the fix and monitor for recurring hangs
After applying a fix, confirm the result. Reopen Event Viewer (eventvwr), go to Windows Logs > Application, and filter for event ID 1002 again. Sort by date and check whether any new entries have appeared since the change. If no new 1002 entries appear during normal use, the hang is resolved; if a new one appears, continue with the next fix in the sequence.
Manual checks in Event Viewer are practical for troubleshooting individual machines but become difficult to manage across multiple endpoints. For centralized monitoring, ManageEngine EventLog Analyzer helps identify event ID 1002 events through predefined reports and alerts, making it easier to detect recurring application hangs.
How ManageEngine EventLog Analyzer helps analyze and troubleshoot event ID 1002
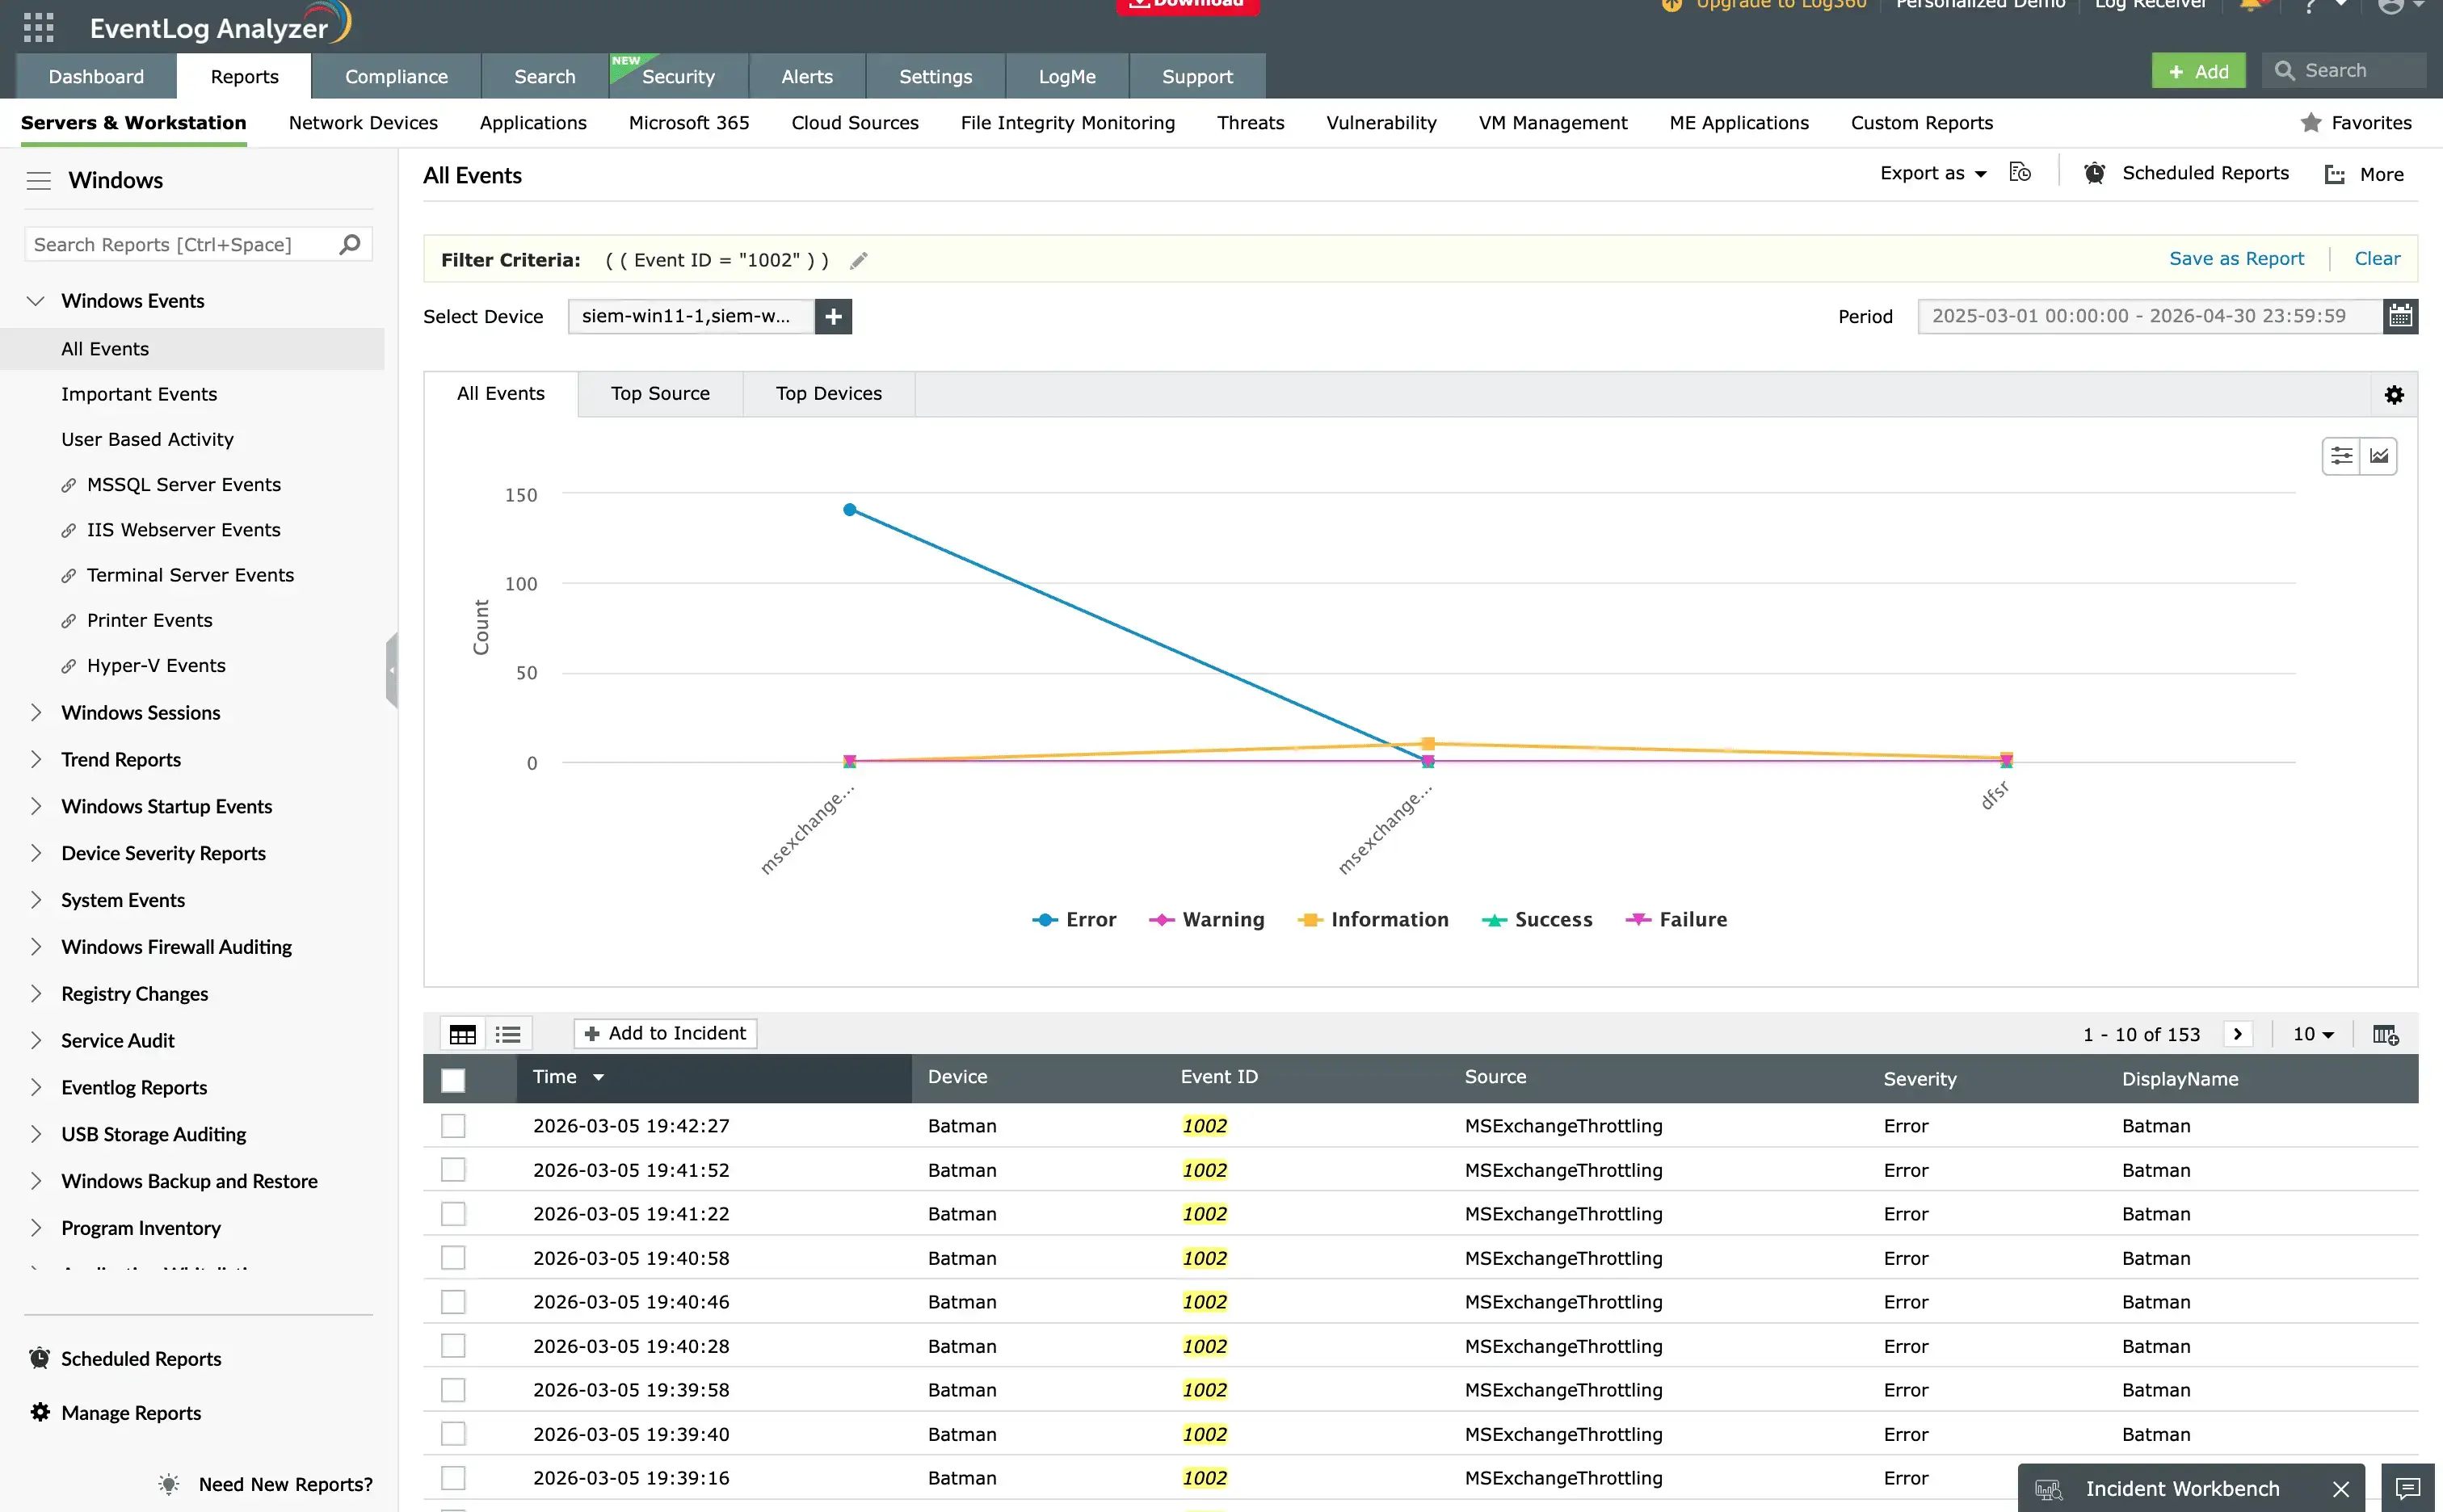
ManageEngine EventLog Analyzer is a centralized log management platform that collects and analyzes Windows event logs across endpoints from a single console. It helps IT teams monitor Application Hang events, investigate event ID 1002 occurrences, and identify recurring application issues across the environment. The solution also supports IT compliance auditing and forensic analysis, providing reports and alerts that help teams detect and investigate application hangs more efficiently.
Key capabilities of EventLog Analyzer for analyzing event ID 1002 entries include: predefined Application Hang reports, alert profiles for repeated hangs, field-based search and correlation, and archived log collection.
- Predefined Application Hang reports: List hanging applications, hang types, and affected hosts across the environment. A single application hanging on twenty machines appears as one trend rather than twenty separate entries, broken down by device, application, and time period, so recurring hangs are visible without manual filtering.
- Alert profiles for repeated hangs: Trigger when event ID 1002 exceeds a defined threshold within a time window, for example five hangs in an hour on the same host or application. Administrators are notified as a hang pattern forms rather than after users report it, and alerts can be scoped to specific machine groups or applications.
- Field-based search and correlation: The HistorySearchRequest and FieldCriteria capabilities apply time-range and field-based filtering to isolate hang events by application, host, or time period, which replaces manual timestamp matching in Event Viewer.
- Archived log collection: Keeps historical Application Hang data searchable after local logs are rotated out, so recurring hangs remain visible over time.
Each capability maps to the fields present in an event ID 1002 entry. Administrators get the same faulting-application and hang-type detail available in the local Application event log, aggregated across every Windows machine in the environment, with real-time alerting on repeated hangs.
Frequently asked questions about Event ID 1002
In the Windows Application event log, 1002 is not a status code in the networking or HTTP sense. It is the event ID for an Application Hang: a program stopped responding and Windows closed it. Read the faulting application name and hang type in the event to see which program hung and why.
When you see 1002 in Event Viewer under the Application log, it is an event ID rather than an application error code. Its source is Application Hang, and it means the named program stopped interacting with Windows and was closed. The fix depends on the faulting process and whether the cause is system file corruption, low memory, or a third-party add-in.
Resolve an application hang by identifying the faulting process from the event ID 1002 entry, then work through the fixes in order: run sfc /scannow, then DISM /Online /Cleanup-Image /RestoreHealth to repair system files; adjust virtual memory if the machine is low on RAM; and boot into Safe Mode to check whether a third-party app or driver is responsible. Re-check the Application log afterward to confirm the hangs have stopped.