How to check Windows crash logs
Last updated on:In this page
Windows crash logs are system-generated records that capture critical information about crashes, errors, or system failures that occur on a Windows machine. These logs are typically stored and can be accessed using the Event Viewer. Crash logs provide details such as the cause of the crash, the affected application or driver, and the system’s state at the time of failure.
Crash logs are essential for diagnosing and troubleshooting system issues, helping IT professionals and system administrators identify the root cause of problems such as blue screen of death (BSOD) errors, application crashes, or unexpected reboots. By analyzing these logs, users can pinpoint hardware or software issues, isolate malfunctioning components, and take corrective measures to prevent future crashes, ensuring system stability and performance. This article elaborates on the different ways of checking crash logs in Windows 11 and 10.

How to check crash logs in Windows 10 and 11
This section elaborates on the ways to troubleshoot a Windows device or application crash using the Event Viewer, the command-line interface, and crash dumps.
1. Using the Event Viewer
The Event Viewer is the primary tool for checking crash logs in Windows. It provides an organized way to browse and filter system events. To check the crash logs in a Windows 10 or Windows 11 system:
- Open the Event Viewer by pressing Win + R, entering eventvwr in the Run command prompt, and pressing Enter.
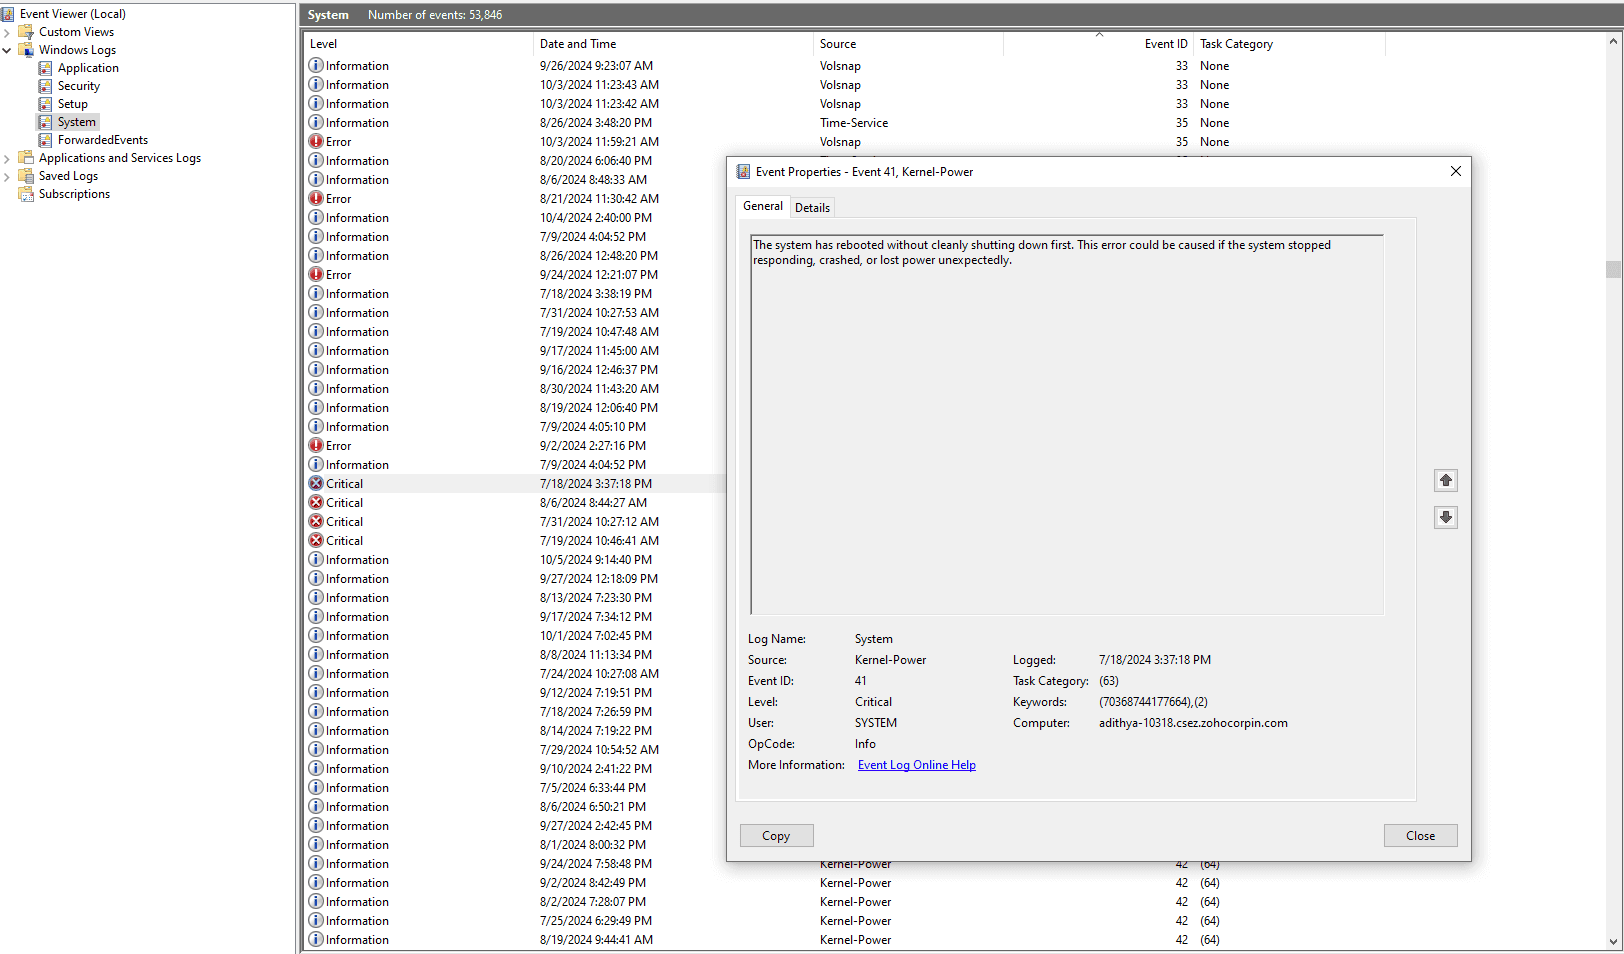
- In the left-hand pane, expand Windows Logs and select System. The Actions Menu will display a list of events.
- Click the Filter Current Log button in the Actions Menu. In the Filter window, check the boxes for Critical and Error. Click OK to apply the filter. The list will now show only events related to crashes and critical errors.
- Look for crash-related event IDs, such as 1001 (BugCheck) or 41 (Kernel-Power), which indicate system crashes or unexpected shutdowns. Click any entry to view detailed information, including the time of the crash, error codes, and the source.

2. Using the command-line interface
If you prefer using the command line, you can access crash logs via Command Prompt or PowerShell:
- Open Command Prompt or PowerShell as an administrator by pressing Win + X and selecting Command Prompt (Admin) or Windows PowerShell (Admin).
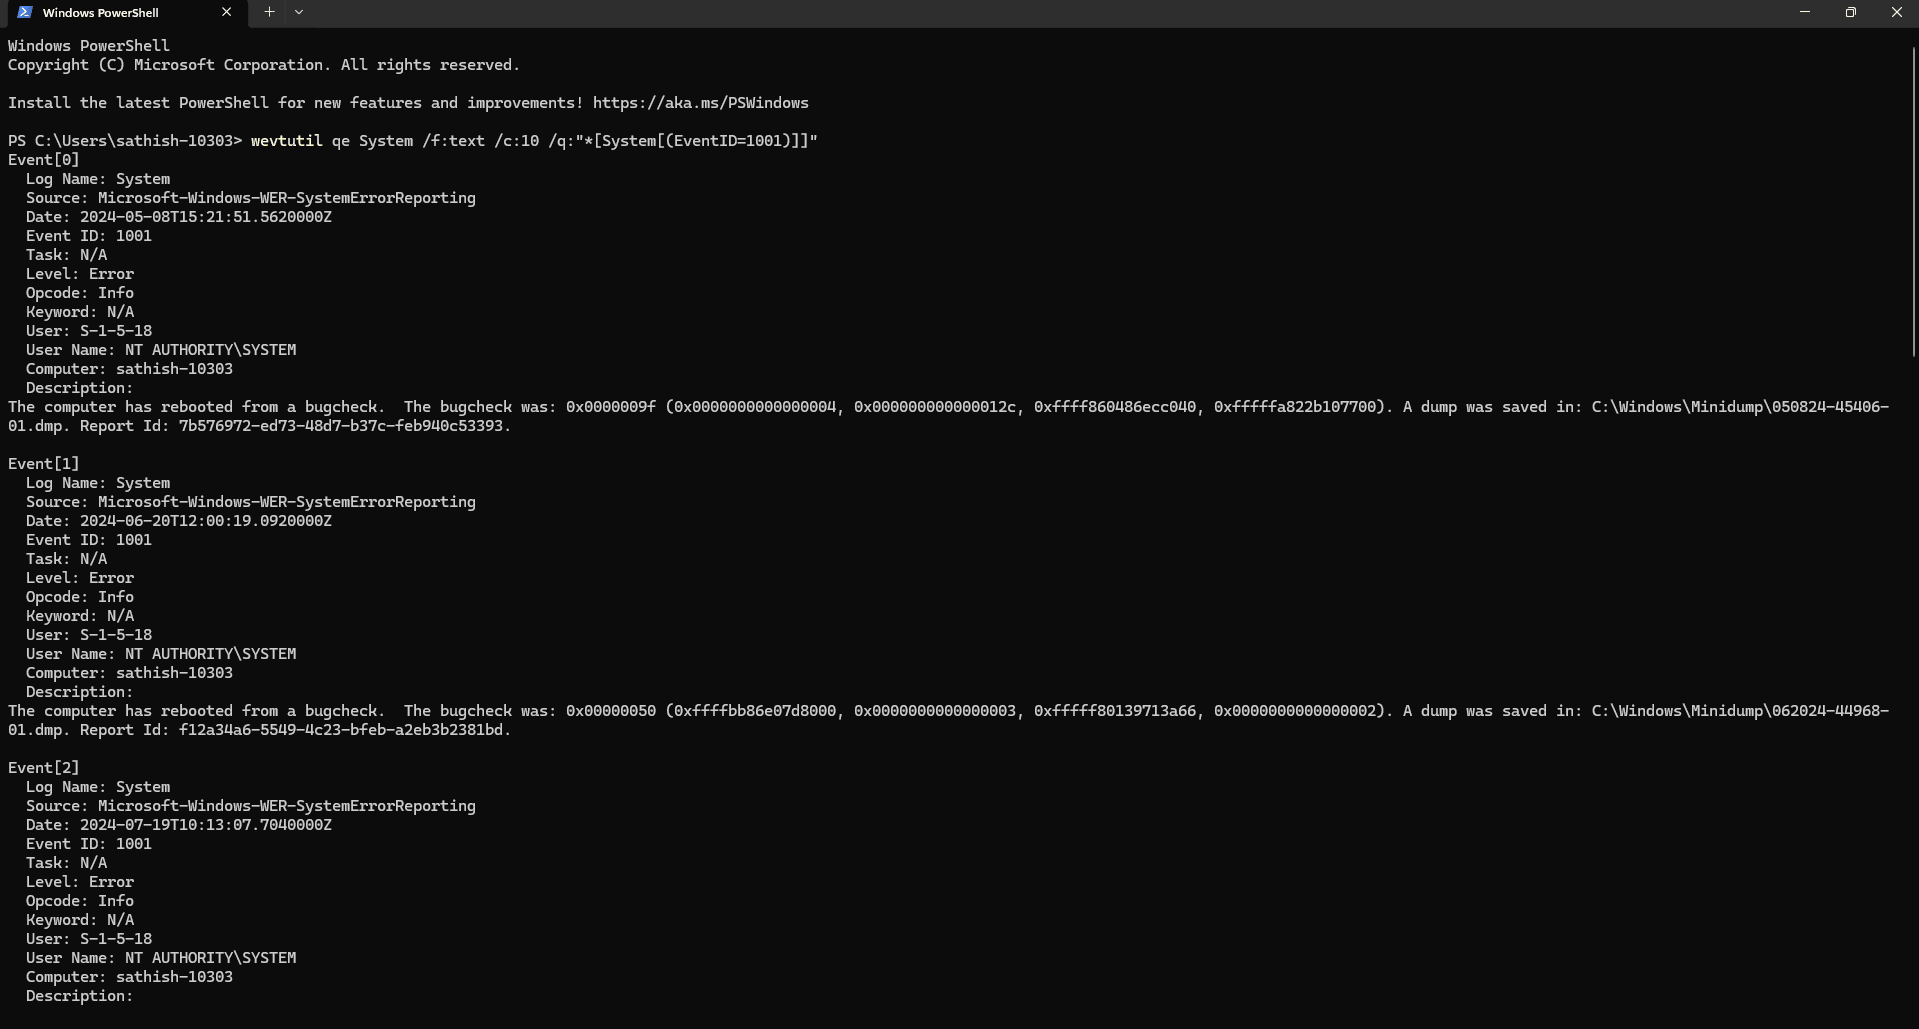
- Use the following command to display the last 10 crash events (event ID 1001) from the System logs:
wevtutil qe System /f:text /c:10 /q:"*[System[(EventID=1001)]]" - This command filters out crash events from the logs and provides a textual output. You can adjust the number of events (/c:10) as needed. The output will display event details, including the timestamp, the event ID, and error descriptions, allowing you to diagnose the problem without navigating through the Event Viewer.
Common Windows crash events
Once the crash logs are located, event IDs and error messages need to be interpreted to understand the cause. Here are some common event IDs associated with crashes:
- Event ID 41 (Kernel-Power): Indicates an unexpected system shutdown, often due to power supply issues or hardware failure.
- Event ID 6008: Indicates that the system shut down unexpectedly, which could be due to power failure or forceful shutdowns.
For each event, Windows logs additional data that includes error codes or driver details, helping to determine if the issue is hardware-related, software-related, or due to external factors.
Crash log analysis with WinDbg
- Windows creates minidump files whenever it crashes. These files contain a snapshot of the memory at the time of the crash and are located at C:\Windows\Minidump.
- If basic crash log analysis doesn’t provide enough insight, use WinDbg, a debugging tool from Microsoft, for a more detailed examination.
- Download and install the Windows Debugging Tools (part of the Windows SDK) from Microsoft's website.
- Open WinDbg and configure the symbol path, which allows WinDbg to map memory addresses to function names and variables for better crash data interpretation, by entering the following command in the console:
.sympath SRV*c:\symbols*http://msdl.microsoft.com/download/symbols - This command tells WinDbg to use Microsoft's symbol server for crash analysis.
- In WinDbg, go to File > Open Crash Dump and select the Minidump file. Type !analyze -v in the command window to run a detailed analysis of the crash dump.
- WinDbg will display information about the crash, including the BugCheck code and the faulty driver or component that caused the crash.
Analyzing crash logs
Crash logs may not directly point to software installations or updates as the cause of crashes. While logs indicate issues, investigating recent installations or updates is necessary to identify potential conflicts, even if not explicitly mentioned in the logs.
Steps to take and their impact
Updating drivers: After crash logs indicate hardware issues like faulty drivers, updating drivers for components like graphics cards, network adapters, and storage controllers should be your first step. Not updating drivers may result in recurring crashes and hardware failures.
Running diagnostic tools: If hardware issues are suspected but not clearly indicated by the logs, running diagnostic tools like MemTest86 for RAM and SMART diagnostics for hard drives helps to confirm or rule out hardware malfunctions. Skipping this may cause persistent crashes if faulty hardware is involved.
Considering software installations or updates: If no clear hardware fault is found, review recent software installations or updates. Even though crash logs might not always pinpoint problematic software directly, issues can still arise from them, and rolling back could resolve conflicts. Ignoring this step might leave underlying software issues unaddressed.
Running sfc /scannow: If system file corruption is suspected based on event logs or unexplained crashes, this command should be run to repair those files. Skipping this step could leave system-level issues unresolved, resulting in ongoing instability.
Performing a clean boot: Perform this if crash logs suggest conflicting background services or applications but do not identify the exact cause. A clean boot will help isolate the problematic services or applications. If this step is skipped, identifying the root cause may become more challenging, prolonging the instability.
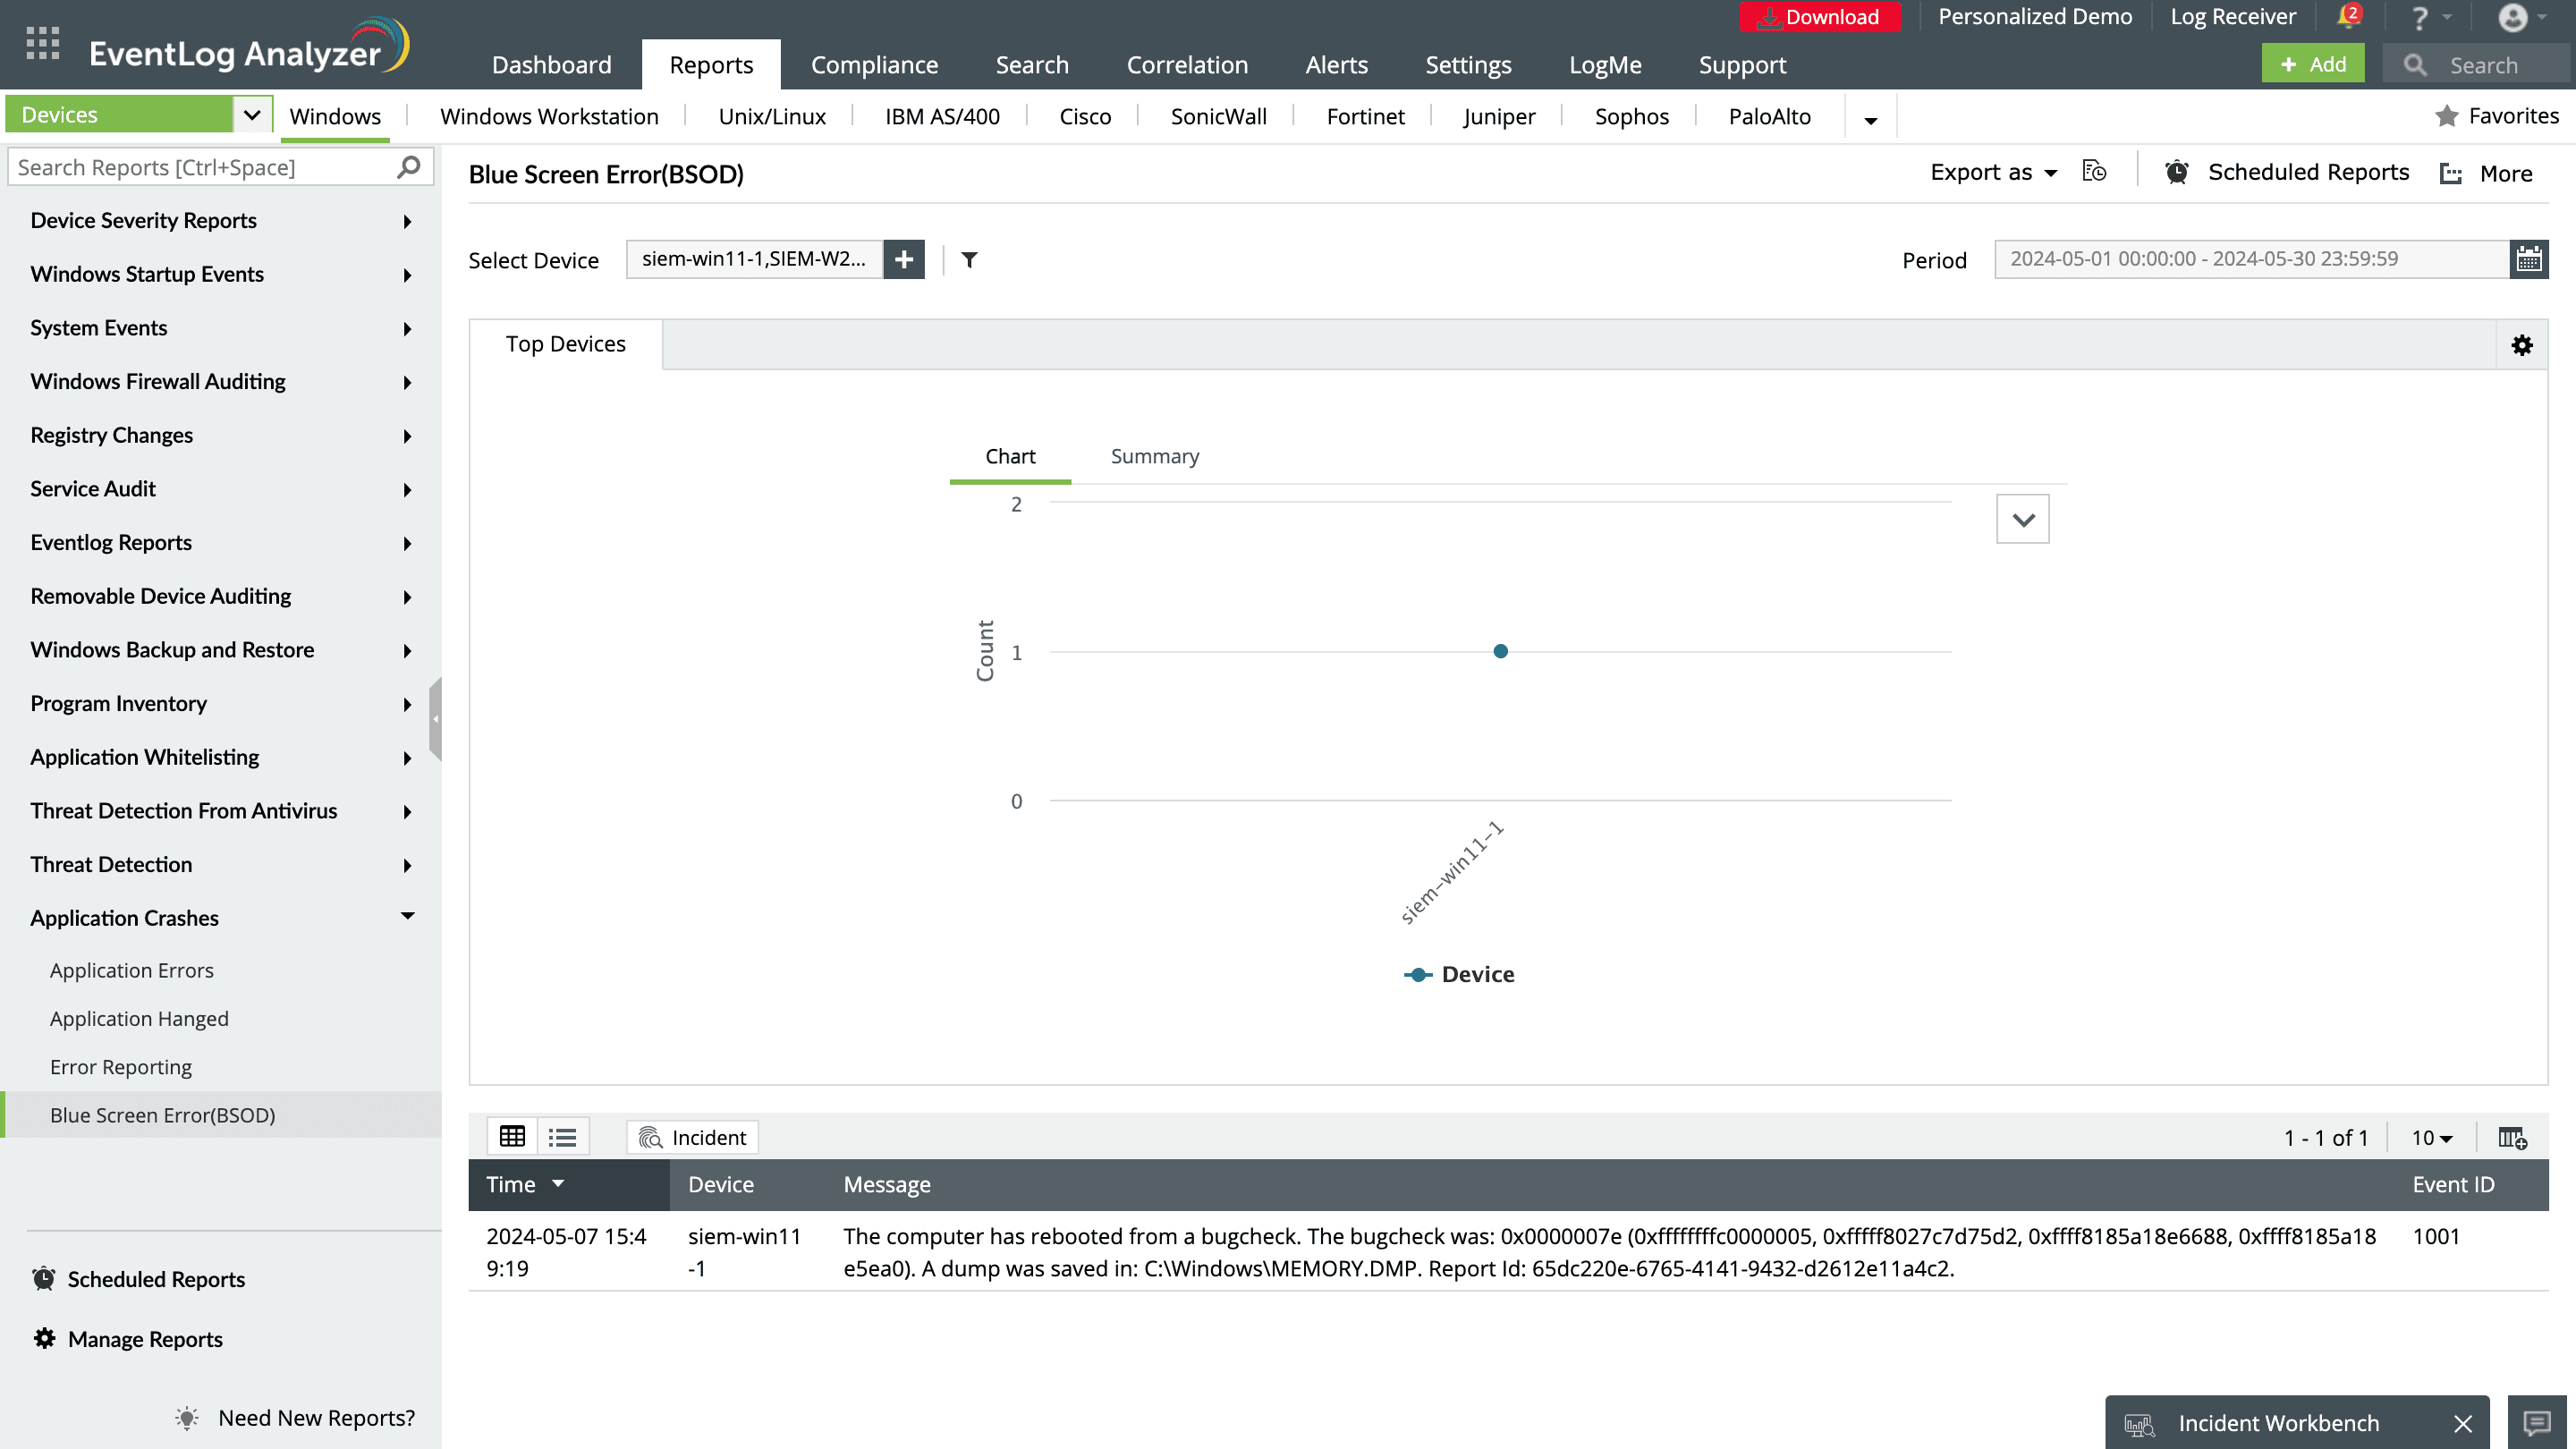
How EventLog Analyzer facilitates Windows crash log analysis
While manually checking the Event Viewer and dumps can be a starting point for troubleshooting Windows crashes, these methods may be less efficient due to the lack of centralized search capabilities and a user-friendly interface. Alternatively, ManageEngine EventLog Analyzer, comprehensive log management and IT compliance software, centrally collects and analyzes event logs from all Windows servers and workstations in your network, ensuring that crash events are captured effectively from multiple sources.
After analyzing the logs, EventLog Analyzer provides you with instant reports on Windows device and application crashes. These detailed reports indicate when and why the application crashed, identify any errors, and determine why critical device crashes like BSOD occurred. EventLog Analyzer's real-time alerting console allows you to get notified about critical application or server crashes, and it also comes with an intuitive search console that allows you to easily search through centralized Windows event logs to effectively conduct root cause analysis.