
- Home
- Logging Guide
- What is debug logging?
What is debug logging and what does it do?
In this page
- Introduction to logging levels
- Breakdown of log messages
- What is debug logging?
- Benefits of debug logging
- Best practices for debug logging
In the realm of technology, it's so important to keep yourself informed of everything that's happening around your network. That's due to today's information systems being susceptible to unknown threats that might lead to critical loss of your vital resources.
Introduction to logging levels
Logging is a key aspect of system monitoring and software development too, providing insights into application behavior and system performance. Logging levels categorize log messages based on their severity, allowing developers and system administrators to filter and prioritize information effectively.
The most common logging levels include DEBUG, INFO, WARN, ERROR, and FATAL. Let's break them down by their distinctions:
| Log level | Description |
|---|---|
| TRACE | The most detailed logging level, used for tracing the execution flow in the application. It provides extensive information about the internal state and is typically used for deep debugging. |
| DEBUG | This level is used for diagnostic purposes, providing detailed insights into the application's behavior. It includes information useful for troubleshooting and is often enabled in development environments. |
| INFO | General information about the application's operational status. It logs significant events that are informational in nature, such as application startup or successful task completion. |
| WARN | Indicates potential issues or unexpected behavior that does not halt the application. It serves as a warning that something may need attention but is not critical. |
| ERROR | Logs errors that occur during execution, indicating that a specific functionality has failed but the application can continue running. |
| FATAL | Represents severe errors that lead to application failure or critical issues affecting key functionalities, requiring immediate attention. |
To put this into perspective, imagine watching cricket.
- A INFO log is like watching the game highlights, capturing the important events, showcasing wickets, boundaries, and game-changing moments.
- DEBUG is like listening to the commentary keenly that provides context into significant moments and decisions during the game.
- TRACE captures every detail of the match, including every shot, catch, and player movement. It provides comprehensive insights into the game's flow and nuances, allowing you to analyze every aspect of the match in real-time.
The structured approach in categorizing logs into these levels helps in diagnosing issues and understanding system behavior better.
Breakdown of log messages
Log messages typically consist of several components that convey important information:
- Timestamp: Indicates when the log entry was created.
- Log Level: Specifies the severity of the message (e.g., DEBUG, INFO).
- Message: A clear description of the event or issue being logged.
- Contextual Information: Additional data, such as error codes, user IDs, or session details, that provide further context.
A well-structured log message enhances readability and facilitates easier troubleshooting.
What is debug logging?
Debug logging is a specific logging level that provides detailed information about the application's internal state during development and troubleshooting. It is more granular than other levels, offering insights into the flow of execution, variable values, and system interactions. Debug logs are primarily intended for developers to diagnose issues and ensure the system operates as expected. They often include verbose information that is not typically relevant for end-users but is essential for debugging purposes.
Benefits of debug logging
Debug logging offers significant advantages across various domains of software development and operations. Here’s an exploration of its benefits:
Detailed contextual information:
Debug logs capture extensive details about application behavior, including variable states, execution paths, and error messages at various points in time. This information is essential for understanding the conditions that led to an issue, allowing developers to pinpoint where things went wrong.
Reproducing errors:
Debug logs can document edge cases and specific conditions that lead to errors. This information is invaluable for developers trying to reproduce bugs, as it provides a clearer picture of what needs to be replicated.
Early detection of issues:
By continuously logging debug information during development, potential issues can be identified early in the life cycle before they escalate into more significant problems in production environments.
Filtering noise:
In complex systems, many events can occur simultaneously. Debug logging allows developers to filter through this noise by focusing on specific log entries that are relevant to the issue at hand. This targeted approach helps in isolating the root cause from unrelated log data.
Enhanced understanding of application behavior:
By examining debug logs, developers gain insights into how their application behaves under various conditions. This understanding is crucial for improving functionality and user experience.
Regulatory adherence:
Debug logs create comprehensive audit trails that document system and application activities. These logs are essential for regulatory requirements, as they provide a historical record of actions taken within the system, which can be crucial during audits or investigations.
Best practices for debug logging
Adhering to best practices can significantly maximize the effectiveness of debug logging and enhance its utility. Here are some best practices for debug logging:
Set appropriate log levels:
Use different logging levels (DEBUG, INFO, WARNING, ERROR, CRITICAL) to categorize messages based on their importance. During development, set the logger to DEBUG to capture detailed information, but switch to INFO or higher in production to reduce log clutter and improve performance.
Use meaningful log messages:
Ensure that log messages are clear and descriptive. They should provide enough context to understand what was happening in the application at the time of logging. Avoid vague messages that do not convey useful information.
Implement log rotation:
Use log rotation techniques to manage log file sizes and prevent them from consuming excessive disk space. This can be achieved using handlers like 'RotatingFileHandler' or 'TimedRotatingFileHandler'.
Avoid logging sensitive information:
Be cautious about logging sensitive data (e.g., personal identifiable information or security credentials). Implement measures to sanitize logs and prevent data leaks that could lead to compliance issues or security breaches.
Leverage debug-level logs with ManageEngine Log360 to implement full-on observability for your entire stack
ManageEngine Log360, is a cutting edge SIEM tool that tightly packs all your enterprise-grade security needs in one solution. It centralizes log collection, monitoring, correlation, analyzing, and archiving of logs across your network.
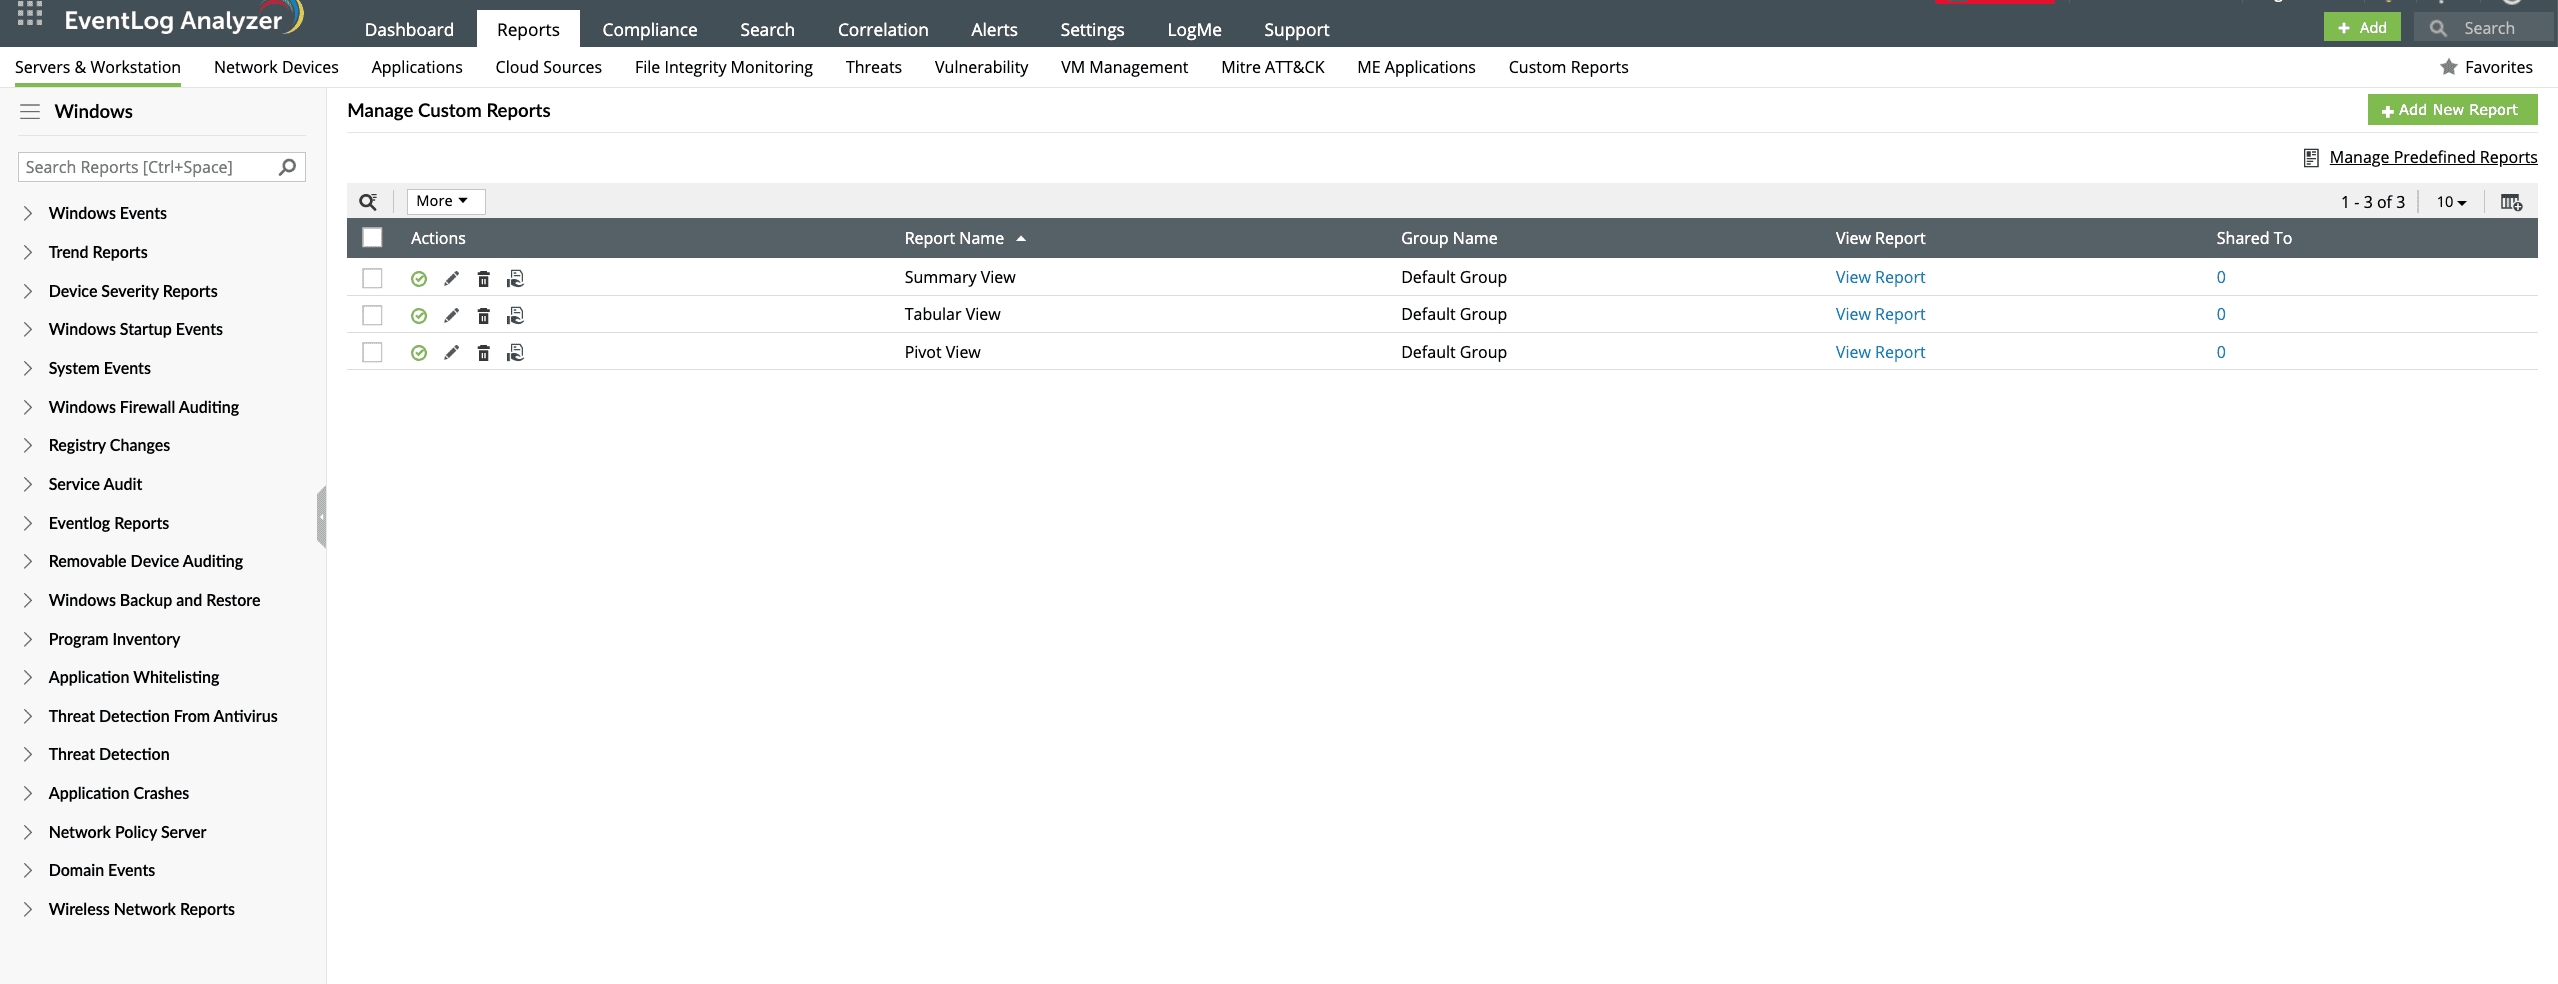
Log360 enables you to filter debug logs to set you up for swift analysis during the development phase of an application. With Log360, you can also build customizable reports for a quick overview.
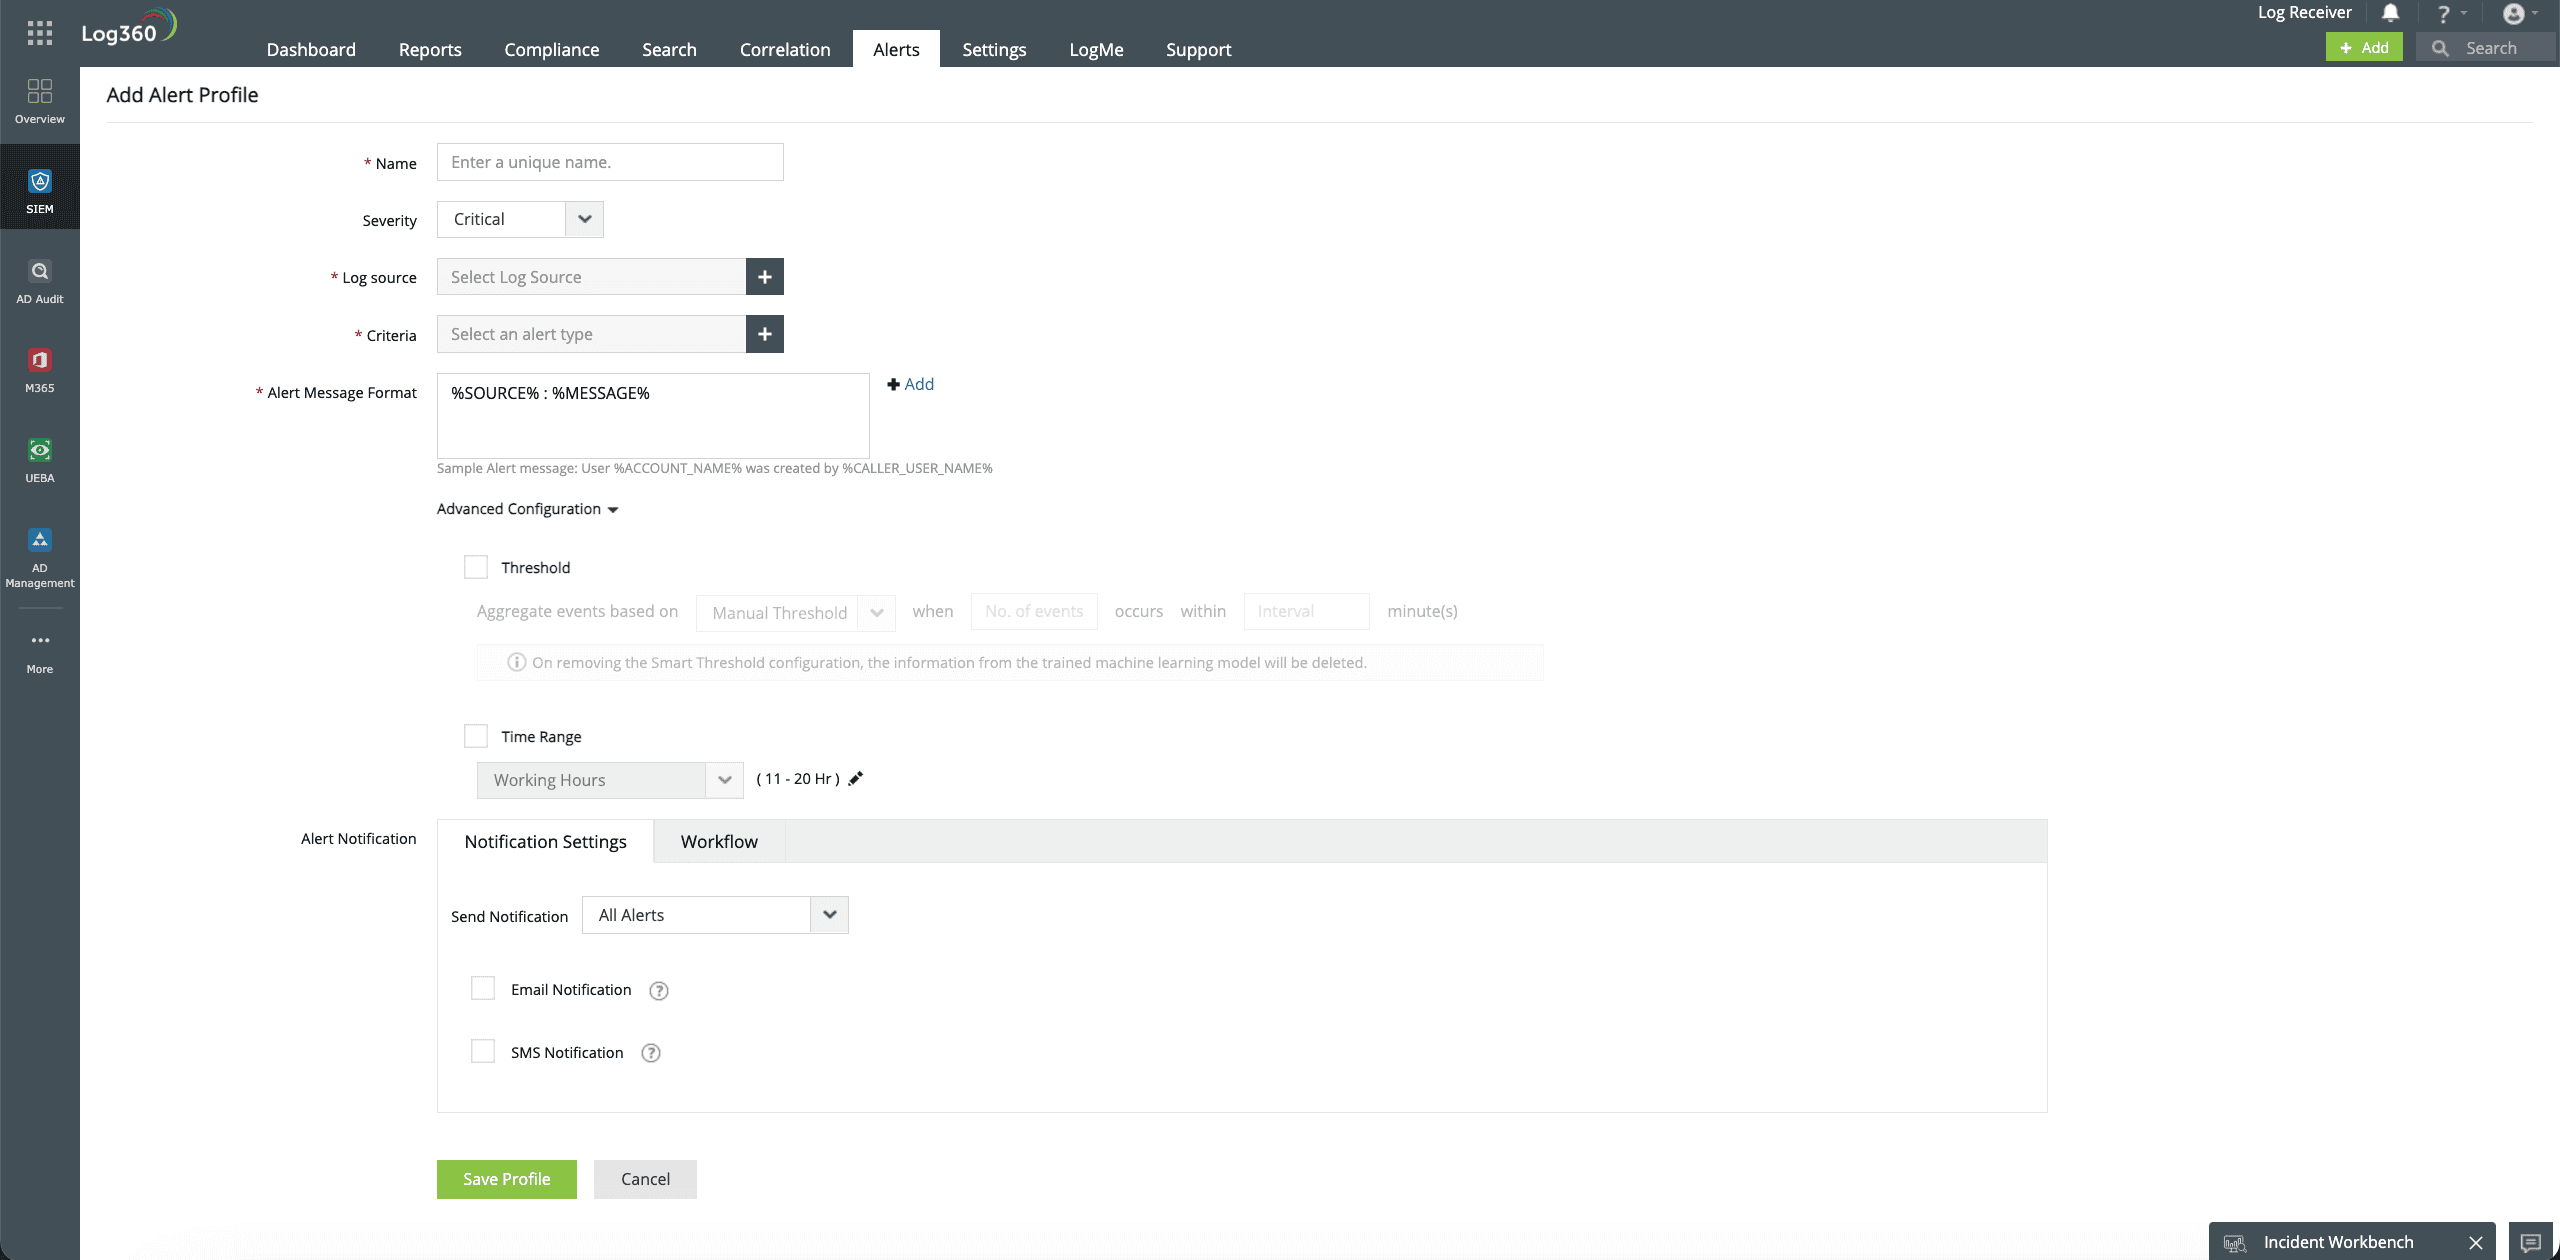
Log360 helps you avoid an overwhelming amount of unnecessary logs by ingesting the logs that've met predefined severity criteria for further processing. You can also set up alerts for critical events based on the log severity.
With Log360 correlation engine, you can group multiple events together to identify a pattern that might indicate an anomalous application behavior. This helps significantly reduce incident response times by paving the way for faster remediation of incidents.
Check out how Log360 helps you comply with regulatory standards like GDPR and CCPA for auditing purposes by generating predefined compliance reports.
