
Analyzing FortiGate syslog
Last updated on:In this page
- What is FortiGate syslog?
- Types of FortiGate logs
- FortiGate syslog message format
- FortiGate severity levels
- FortiGate syslog and EventLog Analyzer
- How to configure FortiGate syslog in EventLog Analyzer
- Common troubleshooting tips for FortiGate log collection
- FortiGate logs and EventLog Analyzer reports
- Why choose EventLog Analyzer
- What's next?
What is FortiGate syslog?
FortiGate syslog is the logging mechanism used by Fortinet firewalls to record critical operational, security, and traffic data. These logs from FortiGate devices are forwarded to external collectors or syslog servers in the structured key-value pair format. This ensures log data is retained securely, not only for compliance but also for troubleshooting and advanced security analysis.
Types of FortiGate logs
FortiGate logs are classified into the following types based on their functions.
| Log type | Function | Events involves |
|---|---|---|
| Traffic logs | These are the most voluminous logs, recording all network sessions that pass through the FortiGate firewall | Allowed, denied, or processed traffic controlled by a specific firewall policy |
| Unified threat management (UTM) logs | These logs are generated when a security profile inspects traffic and finds a violation or threat | Malware detection, intrusion attempts, and unauthorized access to prohibited websites or applications |
| Event logs | These logs track internal changes, system state, and administrative activity, vital for auditing and system health checks | User authentication and configuration changes |
| VPN logs | These logs audit VPN traffic and SSL-VPN tunnels | Monitors remote access and site-to-site connectivity |
FortiGate syslog message format
FortiGate logs use a proprietary key-value pair (KVP) format. This structure makes the logs highly readable for automated parsers.
Example log entry:
date=2025-12-23 time=17:45:18 devname="ELA" devid="FG234234567890" logid="0000000045" type="traffic" subtype="forward" level="warning" vd="root" srcip=192.178.1.200 srcport=52341 srcintf="port1" dstip=8.8.8.8 dstport=443 dstintf="wan1" proto=6 action="accept" policyid=1 sessionid=10045 duration=30 sentbyte=2500 rcvdbyte=2200
Key field definitions
| Field | Description |
|---|---|
| date/time | The exact timestamp when the event was generated |
| devname | The hostname of the FortiGate device |
| logid | A unique 10-digit identifier for the specific log message type |
| type | The broad category (e.g., traffic, UTM, event) |
| subtype | The specific sub-category (e.g., forward, virus, web filter, system) |
| level | The severity level of the log |
| action | The outcome of the event (e.g., accept, deny, close, block) |
| srcip / dstip | The source and destination IP addresses involved |
| policyid | The specific firewall policy ID that triggered the log |
FortiGate severity levels
FortiGate assigns a severity level to every log. When configuring the syslog server, FortiGate logs can be filtered using these levels to manage log volume.
| FortiGate level | Syslog severity | Numeric code | Description |
|---|---|---|---|
| emergency | Emergency | 0 | System is unusable |
| alert | Alert | 1 | Action must be taken immediately |
| critical | Critical | 2 | Critical conditions (e.g., hardware failure) |
| error | Error | 3 | Error conditions |
| warning | Warning | 4 | Warning conditions |
| notification | Notice | 5 | Normal but significant conditions |
| information | Info | 6 | Informational messages |
| debug | Debug | 7 | Debug-level messages |
FortiGate syslog and EventLog Analyzer
While FortiGate generates raw data and acts as a syslog forwarder, ManageEngine EventLog Analyzer provides the necessary layer of intelligence, transforming simple log files into actionable security insights.
In this integrated architecture, EventLog Analyzer functions as the dedicated, centralized syslog analyzer that indexes and parses the data using native parsers designed specifically for FortiGate's proprietary key-value format. This eliminates the manual effort of field extraction, ensuring immediate visibility into fields, making logs instantly searchable and ready for correlation and reporting.
Further, the logs are transmitted to EventLog Analyzer via TCP/TLS, ensuring reliable and secure log transportation.
ManageEngine EventLog Analyzer provides sophisticated syslog server and analyzer functionalities that provide comprehensive visibility into FortiGate activities and fortifies your network against security breaches.
How to configure FortiGate syslog in EventLog Analyzer
Prerequisites
Ensure the following before configuring the FortiGate device to ensure the receiver i.e., EventLog Analyzer is ready for log reception.
Configure the listening port: EventLog Analyzer server must be actively listening for incoming syslogs on UDP port 514.
Clear the firewall path: All intermediate and host-based firewalls must be open to allow traffic on UDP port 514 from FortiGate to the EventLog Analyzer server.
How to configure
For a step-by-step walk through on configuring FortiGate syslog in EventLog Analyzer, visit this page.
Next steps
To ensure successful configuration, trigger a test log message on the FortiGate device. Then, confirm if the logs appear in the EventLog Analyzer interface to validate that the entire setup is working properly.
Common troubleshooting tips for FortiGate log collection
Here are some common tips to ensure seamless FortiGate log collection.
- Ensure that FortiGate has a valid transmission route to the syslog server. Use the CLI command execute ping [Server_IP] to test connectivity.
- Logging every single traffic session can tax the CPU. If resources are low, change the severity level to Warning or disable Log Allowed Traffic on low-risk policies.
- If the SIEM tool isn't parsing logs correctly, ensure the format is set to default rather than RFC5424 unless the parser requires it.
FortiGate logs and EventLog Analyzer reports
EventLog Analyzer transforms raw FortiGate logs into visual, intelligence-driven reports, moving security teams from searching text to analyzing meaningful data.
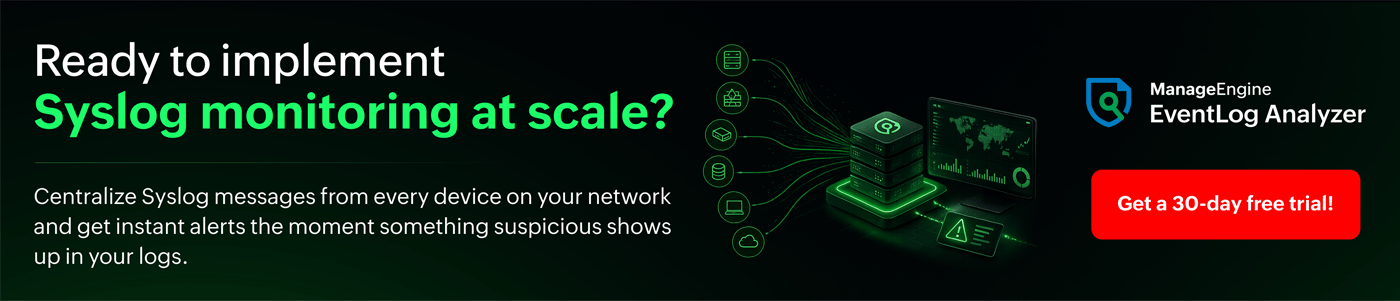
Traffic logs are parsed and indexed to Firewall Allowed Traffic and Firewall Denied Traffic report groups with reports on Traffic Trend and Top Traffic based on Source, Destination, Protocol, and Port.
Figure 1 depicts EventLog Analyzer's report on Top Traffic based on the Source under Firewall Allowed Traffic report group.
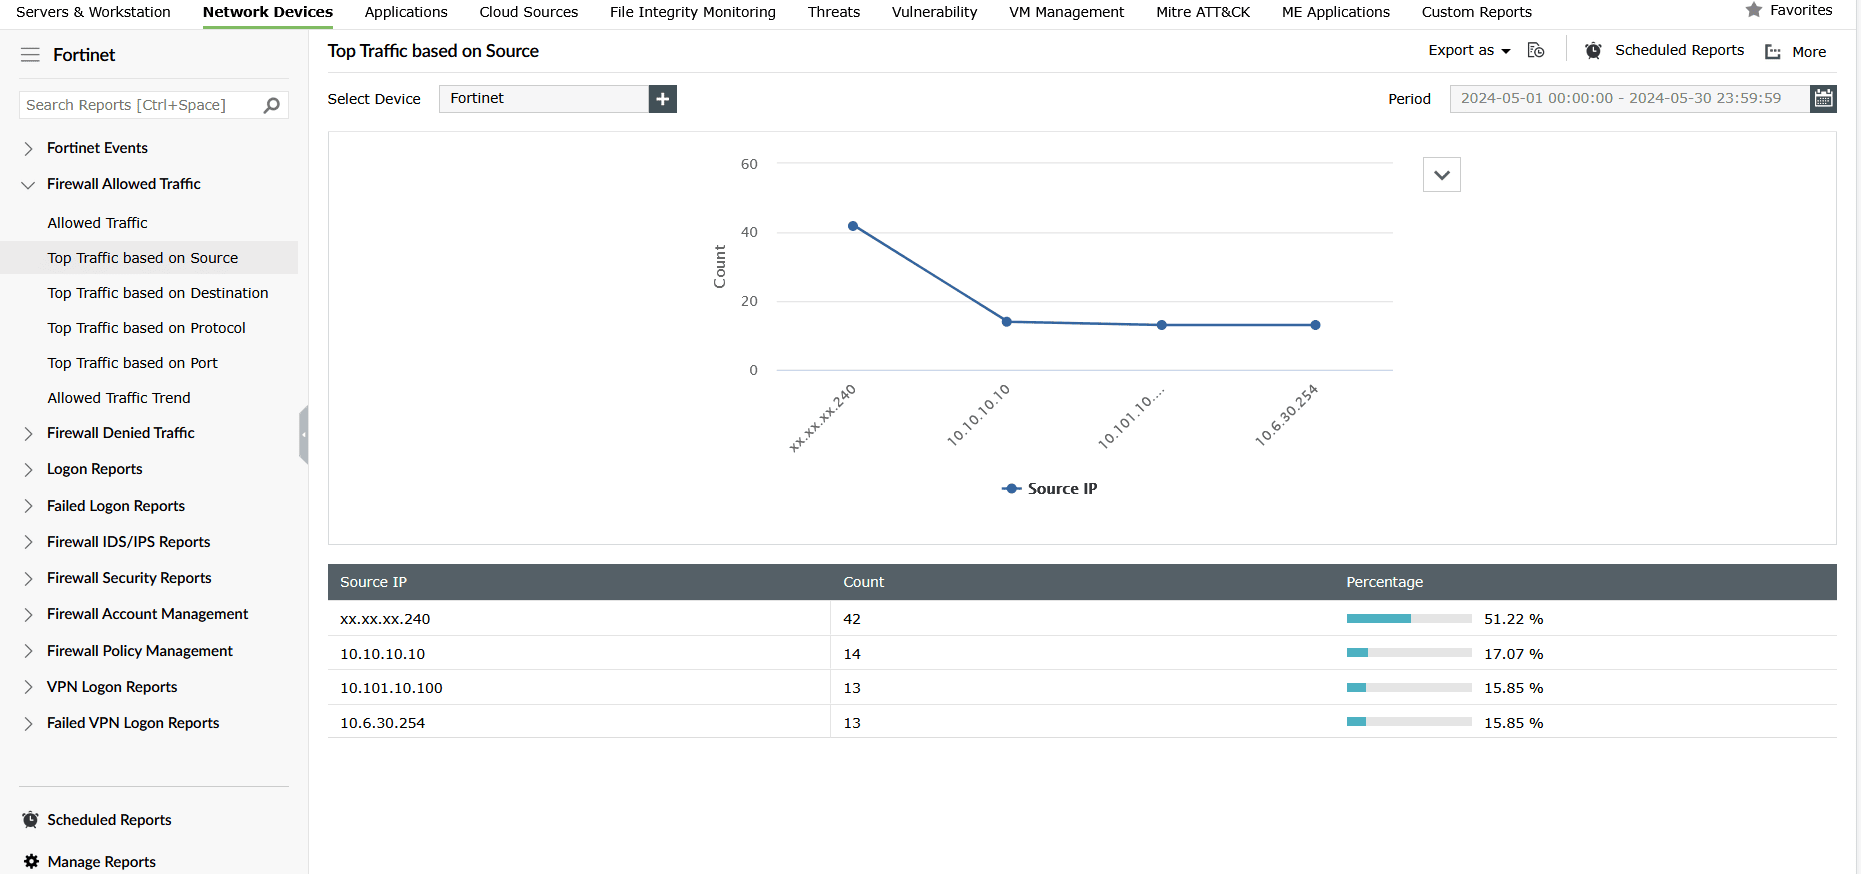
FortiGate's UTM logs are processed to generate detailed reports on malware attacks, IDS/IPS reports, and firewall security reports in EventLog Analyzer. These help security analysts detect and visualize malware and intrusion attempts, instantly mapping the threat source and severity.
Figure 2 shows EventLog Analyzer's Critical Attacks report in the Firewall IDS/IPS Reports group.
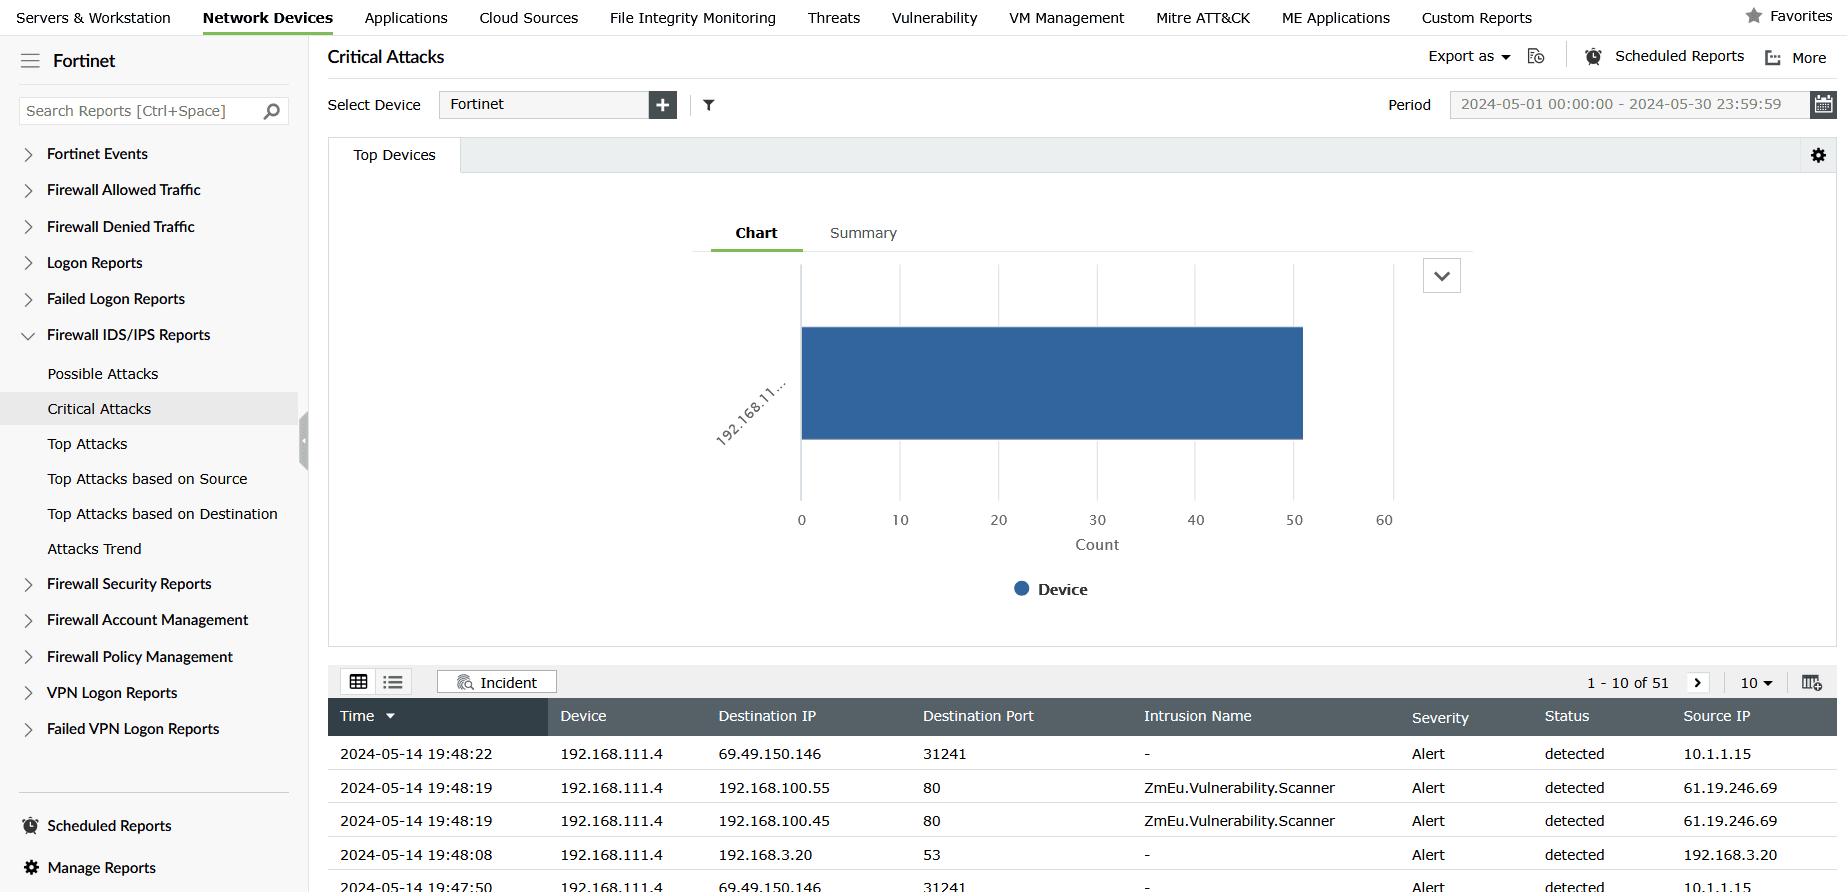
Event logs from Fortinet firewall are used for identifying who made what configuration change and when for troubleshooting, threat detection, and change management.
Figure 3 shows EventLog Analyzer's Policy Modified report in the Firewall Policy Management report group, which provides granular details on the modification of firewall policies.
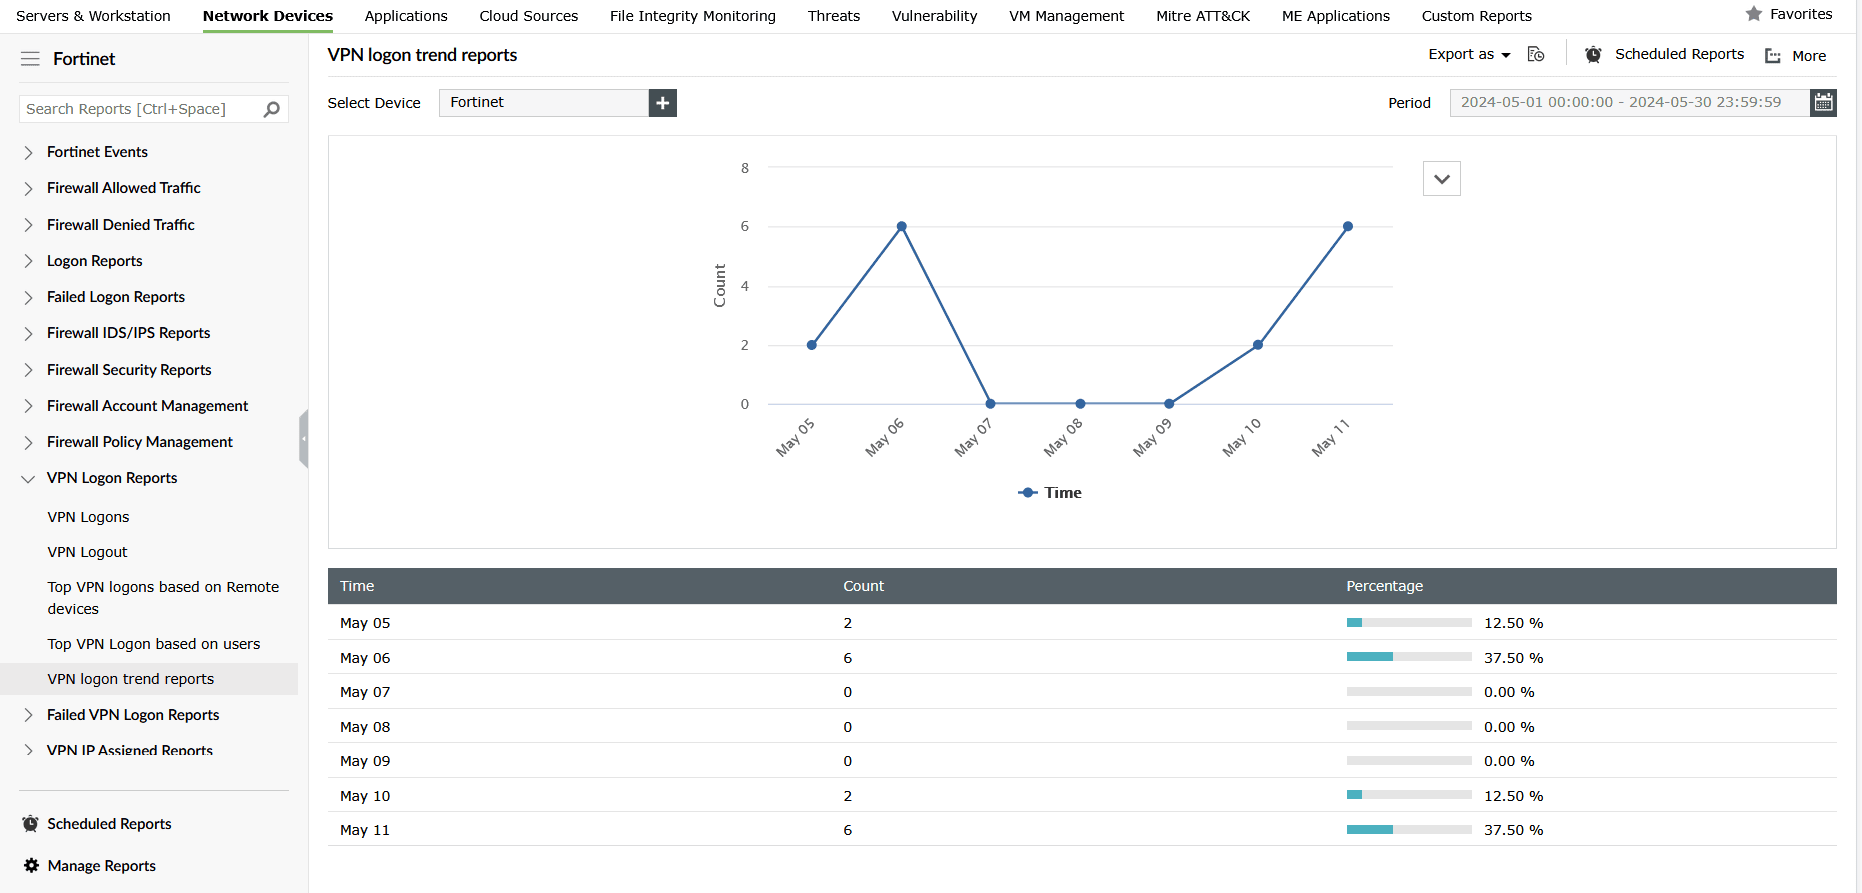
VPN logs from Fortinet devices are used to generate detailed reports on VPN activities such as VPN logons, logoffs, failed logons, logon trends based on devices and users, and more in EventLog Analyzer.
Figure 4 shows a VPN report in EventLog Analyzer that provides a graph on the VPN logon trend.
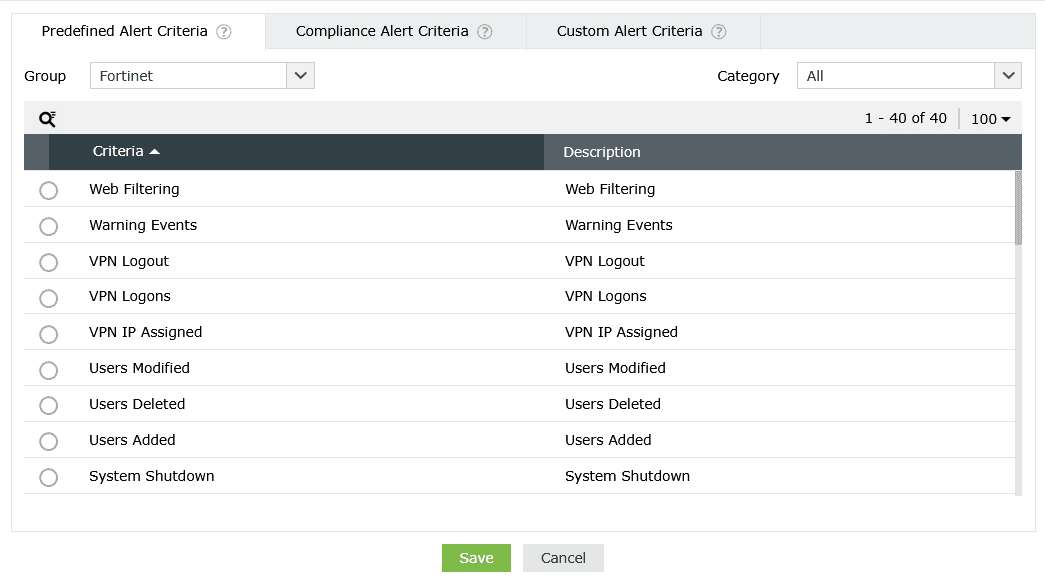
EventLog Analyzer also offers predefined alerts to monitor and detect suspicious activities on Fortinet devices in real time.
Figure 5 depicts a few critical alert criteria predefined in EventLog Analyzer to track Fortinet activities.
Why choose EventLog Analyzer
The combination of a FortiGate syslog forwarder and EventLog Analyzer creates a highly robust and efficient security monitoring solution that guarantees:
- Log integrity: EventLog Analyzer's internal collector ensures logs are delivered securely via TLS, making them tamper-proof and credible for forensic analysis.
- Proactive threat detection: EventLog Analyzer applies prebuilt detection rules against FortiGate data to ensure zero-day threats and sophisticated attacks are detected and contained in real time.
- Threat investigation: Analysts can use EventLog Analyzer's powerful forensic search to query months of indexed FortiGate data in seconds, moving from alert to resolution far faster investigation and threat remediation.
- Simplified compliance: EventLog Analyzer automatically generates necessary audit reports for standards like the PCI DSS, HIPAA, and SOX using the securely archived FortiGate data, facilitating compliance management.
What's next?
Make EventLog Analyzer your central syslog server to instantly index, manage, and analyze high-volume FortiGate syslogs to secure your enterprise with powerful, real-time security analytics.
