
Syslog Port 514
Last updated on:In this page
When it comes to network and system monitoring, port 514 serves as the default channel of syslog communication. It is the port through which devices, ranging from firewalls and routers to servers and applications, transmit event messages to a centralized logging server. Understanding the role of this port is crucial for ensuring smooth log collection and maintaining the security and reliability of your monitoring infrastructure.
Syslog data often contains sensitive information such as authentication attempts, configuration changes, and system alerts. Securing port 514 from unauthorized access or interception is essential, as misconfigurations or open ports can easily become entry points for attackers or cause communication breakdowns in your log pipeline.
What is port 514?
Port 514 is the default port assigned to Syslog, a standard protocol used to send system event messages from one device to another over a network. It facilitates centralized logging, enabling administrators to consolidate and analyze logs from multiple sources in one place.
There are two distinct transport mechanisms associated with port 514:
- UDP 514 (User Datagram Protocol): This is the traditional and most widely used form of syslog communication. It is connectionless, meaning messages are sent without verifying delivery. While this makes it faster and less resource-intensive, it also means that packets might be lost during network congestion.
- TCP 514 (Transmission Control Protocol): This provides a reliable, connection-oriented alternative to UDP. TCP ensures that all syslog messages are delivered in the correct order and retransmitted, if lost. It’s commonly used in environments that require guaranteed delivery, such as compliance-driven or security-critical systems.
In short, port 514 plays a central role in how syslog data moves across networks, serving as the common entry point for most deployments. Although many organizations continue to rely on TCP 514 for consistency and ease of configuration, the official Internet Assigned Numbers Authority, i.e., IANA-designated port for syslog over TCP is 601. Keeping this distinction in mind helps administrators align their deployments with best practices and select the transport method and port combination that best fits their reliability, performance, and compliance needs.
How port 514 works
At its core, port 514 acts as the communication channel between syslog clients (like routers, switches, firewalls, or servers) and a syslog server (such as ManageEngine EventLog Analyzer).
Here’s the basic workflow:
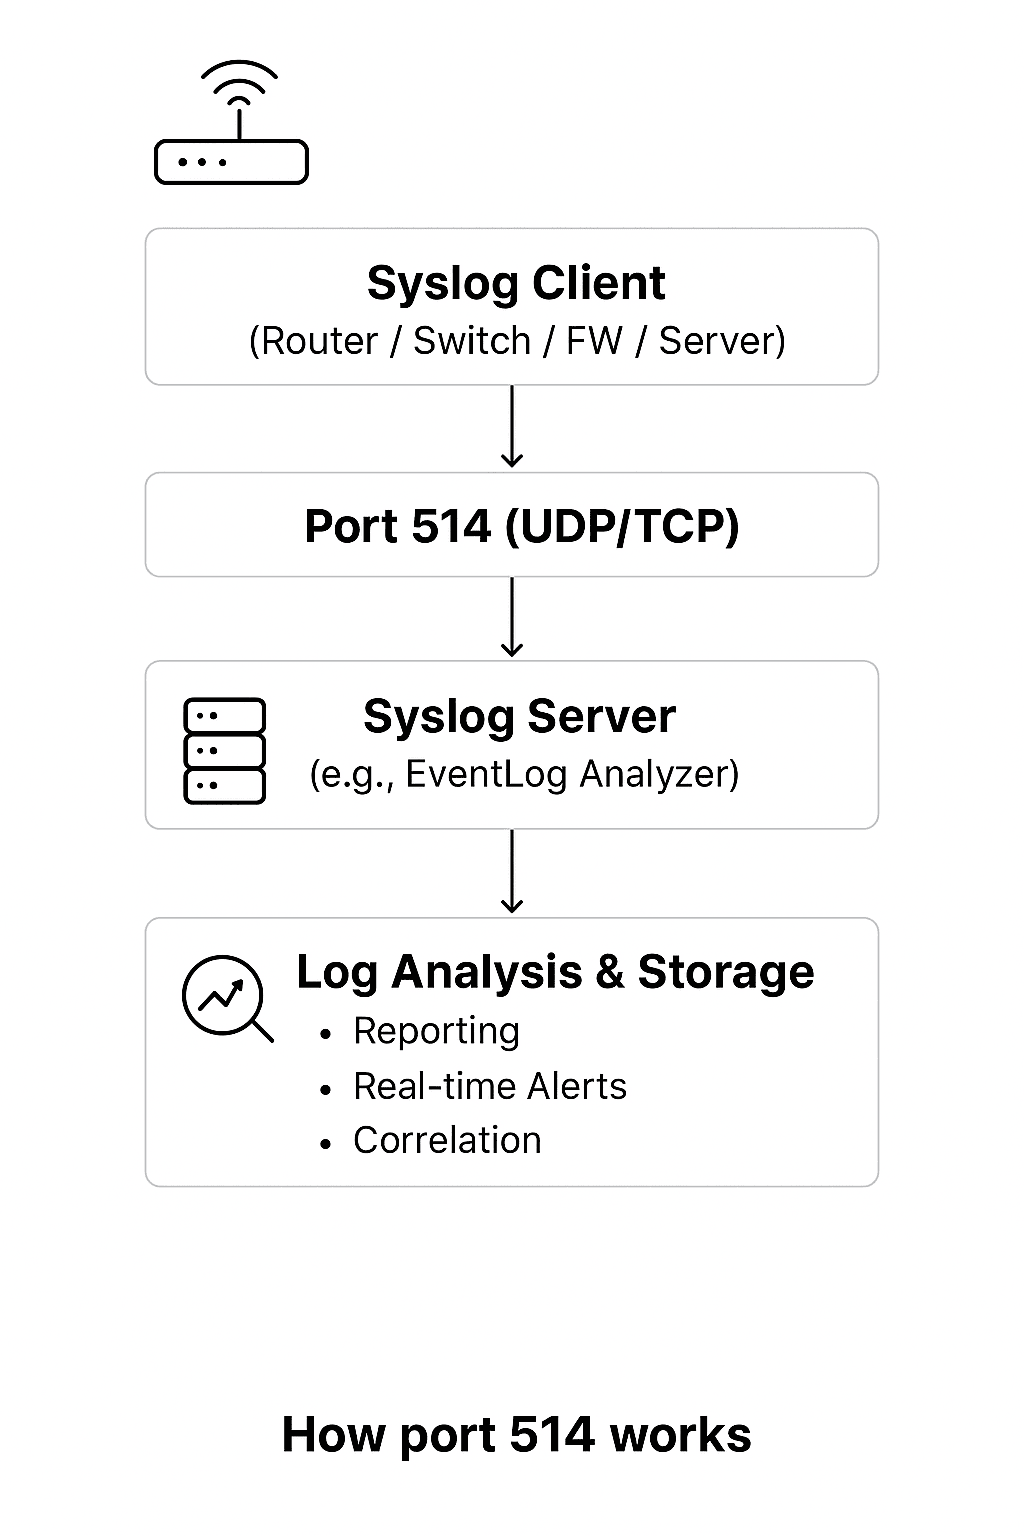
- Syslog client generates a message: A device detects an event like a failed login, configuration change, or security alert, and formats it into a standard syslog message.
- Message sent over port 514: The syslog client transmits the message using UDP or TCP on port 514, depending on how it’s configured.
- Syslog server receives and parses logs: A syslog server listens on port 514, receives incoming messages, parses them in real time, and categorizes them based on source, severity, and event type.
- Logs are analyzed and stored: Once received, the logs are stored securely and made available for reporting, alerting, and correlation across your IT infrastructure.
This simple flow ensures that all critical events across your devices are transmitted efficiently to your Syslog server for centralized monitoring and security analysis.
UDP vs. TCP on port 514 explained
Syslog can operate over UDP 514 or TCP 514, each serving different operational needs. Here’s a quick comparison to understand how they differ:
| Parameter | UDP 514 | TCP 514 |
|---|---|---|
| Connection type | Connectionless | Connection-oriented |
| Reliability | No guarantee of delivery (messages might be lost) | Guaranteed delivery with acknowledgments |
| Speed | Faster, lower overhead | Slightly slower due to connection setup |
| Use cases | High-volume or non-critical logs (e.g., network traffic) | Compliance and security-critical environments (e.g., audit trails) |
| Resource usage | Lightweight | More resource-intensive |
| Ordering of messages | Not guaranteed | Guaranteed (in sequence) |
| Message size limit | Traditionally limited to 1024 bytes per message (RFC 3164), though some implementations extend this | Supports larger message sizes and structured data (RFC 5424), making it suitable for verbose logs |
EventLog Analyzer supports both UDP and TCP-based syslog collection, giving you the flexibility to choose between performance and reliability depending on your infrastructure and compliance requirements.
Security implications and risks of port 514
Although port 514 is essential for syslog communication, it also introduces notable security risks when left open, exposed, or improperly configured. Traditional syslog over UDP 514 or TCP 514 transmits data unencrypted and unauthenticated, making it vulnerable to interception, forgery, and manipulation. Attackers can exploit these weaknesses to mislead monitoring systems or gather sensitive intelligence about your environment.
Below are the primary risks associated with port 514:
- No encryption (plaintext transmission): Syslog messages sent over port 514 are not encrypted. Any attacker with access to the network path can intercept and read sensitive log data, gaining insights into system behavior, infrastructure, and security events.
- Log spoofing and injection: Because syslog lacks message authentication, attackers can craft and inject fake syslog messages. This can be used to generate false alerts, hide malicious activity, or pollute security logs with misleading information.
- Source IP spoofing: Syslog does not verify the identity of the sender. Attackers can spoof the source IP address to impersonate trusted devices, making forged logs appear legitimate. This increases the difficulty of tracing attacks and compromises the integrity of monitoring data.
- Replay attacks: Captured syslog messages can be retransmitted later because the protocol provides no protection against replay attempts. This can distort event timelines, trigger misleading alerts, and disrupt forensic investigations by injecting old or duplicated messages into the log stream.
- UDP flooding (DoS attacks): Due to its connectionless nature, UDP 514 is particularly vulnerable to flooding attacks. A high volume of malicious packets can overwhelm the syslog collector, causing delays, dropped logs, or complete service disruption.
- No delivery guarantees: UDP provides no acknowledgment or retransmission. Critical logs may be silently lost during network congestion, making it unsuitable for environments that require complete log fidelity for compliance or forensic use.
- Highly scanned and exploited: Port 514 is widely known as a syslog port and is routinely scanned by attackers. Open listeners allow adversaries to map devices, identify security tools, and gather intelligence that can be used for targeted attacks.
- Exposure of high-value telemetry: Syslog messages often carry operational details, configuration changes, authentication events, and security alerts. Exposure of this telemetry gives attackers valuable visibility into network architecture and potential weaknesses.
Using the default, unsecured port 514 for syslog creates significant exposure. It allows attackers to easily read, inject, or disrupt log data, undermining the reliability and integrity of your entire security monitoring system.
Best practices for securing and optimizing port 514
To mitigate the risks outlined above and ensure secure, reliable log forwarding, adhere to these best practices for port 514:
- Restrict access with firewall rules and ACLs: Limit inbound syslog traffic to trusted IPs and subnets only. Implement ACLs on network devices and firewalls for an additional layer of source control.
- Use encryption for sensitive data: Switch to Syslog over TLS (on port 6514) to prevent interception and tampering. This is critical for compliance-driven environments. Alternatively, encrypt traffic using VPN or SSH tunnels.
- Choose the right protocol for the need: Prefer TCP 514 over UDP for critical logs where reliable, in-order delivery is required. Use UDP 514 only for high-volume, non-critical data where some loss is acceptable.
- Isolate and monitor syslog traffic: Place syslog servers on dedicated, monitored network segments. Actively monitor port activity for anomalies such as unknown source devices, abnormal volume surges, or malformed messages.
- Harden the syslog server infrastructure: Run the syslog service under a non-privileged account, disable unused listeners, and enforce OS-level security policies. Regularly patch the syslog service and device firmware, and audit listener configurations and firewall rules.
How EventLog Analyzer reinforces these best practices
EventLog Analyzer provides built-in capabilities that make securing and managing syslog on port 514 significantly easier:
- Supports UDP, TCP, and TLS (6514) for secure, reliable log ingestion.
- Allows port-level restrictions and custom listener ports for isolation.
- Provides real-time alerts for unknown syslog senders, abnormal surges, or port anomalies.
- Offers built-in parsing, normalization, and centralized retention to meet compliance requirements.
By adhering to these best practices, you can ensure your use of port 514 is not only functional and reliable, but also secure and compliant with modern security standards.
Checking and opening port 514
Before configuring syslog forwarding, the first critical step is to verify that port 514 is open and actively listening on your syslog server.
Here's how you can check the port status:
On Linux:
sudo netstat -tulnp | grep 514
# or
sudo ss -tuln | grep 514
On Windows:
netstat -ano | findstr :514
Opening port 514
On Linux (using UFW):
sudo ufw allow 514/udp
sudo ufw allow 514/tcp
sudo ufw reload
On Windows (using PowerShell):
New-NetFirewallRule -DisplayName "Allow Syslog UDP 514" -Direction Inbound -Protocol UDP -LocalPort 514 -Action Allow
New-NetFirewallRule -DisplayName "Allow Syslog TCP 514" -Direction Inbound -Protocol TCP -LocalPort 514 -Action Allow
Once you've confirmed the port is open and properly configured, your syslog server will be ready to reliably receive log messages from across your network.
Troubleshooting common issues
Even with proper configuration, syslog communication over port 514 can encounter issues. This table helps you quickly diagnose and resolve common problems.
| Issue | Possible cause | Resolution |
|---|---|---|
| No logs received | Firewall blocking port 514 | Allow UDP/TCP 514 in local and network firewalls. |
| No logs received (UDP vs. TCP behavior) | UDP: Silent drop; TCP: Connection refused | For UDP, use packet capture (tcpdump -i any port 514) to detect traffic. For TCP, check client-side connection errors. |
| Intermittent message loss | Using UDP in high-traffic networks | Switch to TCP 514 or enable retransmission. |
| Complete log loss when primary server fails | UDP has no failover; TCP failover not configured | For critical devices: (1) Configure TCP with a secondary syslog server IP (if supported), or (2) Use a load balancer/virtual IP in front of multiple syslog servers. |
| Duplicate or out-of-order messages | Network congestion or UDP characteristics | Use TCP for ordered delivery. |
| Unauthorized Syslog entries | Open port 514 accessible from public network | Restrict incoming IPs and use ACLs. |
| Corrupted or spoofed messages | Lack of encryption | Use syslog over TLS (port 6514). |
| Syslog service not responding | Rsyslog or EventLog Analyzer service stopped | Restart service and check configuration files. |
| Service cannot bind to port 514 | SELinux or AppArmor blocking access | Check /var/log/audit/audit.log for SELinux/AppArmor denials. For SELinux, allow port 514 with: use semanage port -a -t syslogd_port_t -p udp 514 (use -m if it already exists). |
| UDP packets arriving but not processed | Server receive buffer overflow (net.core.rmem_max too low) | Increase UDP buffer size using: sysctl -w net.core.rmem_max=26214400 and restart the syslog daemon. |
Testing syslog communication
Use the logger command on Linux to send a test message:
# For TCP (if supported by your logger version):
logger --tcp -n [syslog_server_ip] -P 514 "Test syslog message via TCP"
# For UDP (default):
logger -n [syslog_server_ip] -P 514 "Test syslog message via UDP"
By methodically checking these common failure points, you can rapidly restore log flow and ensure the reliability of your critical monitoring data.
What are the alternatives to port 514?
While port 514 is the traditional standard, modern environments often require more secure or flexible configurations.
- Port 6514 - Syslog over TLS (RFC 5425): The widely accepted secure alternative, providing end-to-end encryption and authentication. Ideal for compliance mandates like the PCI-DSS and HIPAA.
- Port 601 - Reliable syslog over TCP (RFC 3195): A standards-based improvement for guaranteed message delivery in high-volume environments.
- Custom high ports (e.g., 10514, 20514): Used to avoid common port scans and isolate logging traffic, especially in containerized environments.
- RELP (Reliable Event Logging Protocol): A modern transport alternative that ensures transaction-based, lossless log delivery. Often paired with rsyslog, it eliminates the message loss risks associated with UDP and improves reliability compared to traditional TCP-based syslog.
EventLog Analyzer supports these alternatives, enabling you to choose the best fit for your security and network topology.
How does EventLog Analyzer use port 514 and turn it into a security asset?
ManageEngine EventLog Analyzer listens to port 514 (TCP and UDP) and port 6514 (TLS) by default, providing a hassle-free setup to receive and process syslog messages from diverse network and security devices. Users don’t need to manually configure these ports, EventLog Analyzer automatically begins listening for incoming syslog data as soon as it’s deployed.
When a device sends syslog messages to EventLog Analyzer over port 514, the application performs the following key functions:
- Collection: Listens on port 514 (UDP/TCP) to receive incoming data from multiple sources.
- Parsing and normalization: Parses, categorizes, and normalizes messages into a consistent format.
- Indexing: Stores parsed logs with full-text search capability for instant retrieval.
- Correlation and alerting: Applies rules to detect patterns or anomalies and triggers real-time alerts.
- Storage and reporting: Securely stores and indexes events for long-term retention and compliance reporting.
Transforming port 514 from a data channel into a security asset
Understanding port 514 is the first step, operationalizing it securely at scale is the next. ManageEngine EventLog Analyzer elevates your syslog infrastructure beyond basic collection, turning raw data into actionable security intelligence by providing:
Raw syslog data on port 514 only tells you what happened. EventLog Analyzer tells you what it means:
- Contextual insights: Raw syslog data on port 514 only tell you what happened. EventLog Analyzer tells you what it means, such as correction rules can connect a firewall deny event (syslog) with a subsequent successful VPN login (syslog) and privileged file access (Windows event), surfacing potential lateral movement in seconds
- Threshold-based alerts: Notifies you when failed login attempts from a single IP exceed normal patterns.
- Anomaly detection: Flags unusual syslog sources or unexpected message volumes that could indicate spoofing or DoS attempts against port 514 itself.
Securing your syslog infrastructure
EventLog Analyzer helps you implement the security best practices outlined above:
- Supports TLS on port 6514 for encrypted log transport.
- Alerts on syslog messages from unknown or unauthorized source IPs.
- Archives logs with tamper-proof timestamps for compliance (PCI DSS, HIPAA, SOX).
- Provides audit trails of all configuration changes to your syslog listeners.
Stop letting valuable security data simply pass through your network. With EventLog Analyzer, you can harness the full power of port 514 to build a more visible, secure, and compliant IT environment, without the hassle of manual setup.
What's next?
Turn your syslog data into your greatest security asset.
EventLog Analyzer is the all-in-one syslog management solution you need. It acts as a high-performance syslog server, ready to handle the demands of your modern network.
Frequently asked questions (FAQs)
Syslog traditionally uses UDP (User Datagram Protocol) on port 514 for its low overhead and fast transmission. However, it can also use TCP (Transmission Control Protocol) on port 514 for reliable, connection-oriented delivery that guarantees message receipt and order.
The secure port for syslog is port 6514, which is used for Syslog over TLS as defined in RFC 5425. This port provides encryption for log data in transit, preventing interception and tampering, and is the recommended alternative to the unencrypted port 514.
The primary difference is security:
- Port 514 (UDP/TCP): Transmits syslog messages in plain, unencrypted text. It is fast and widely supported but vulnerable to interception.
- Port 6514 (TLS): Encrypts all syslog traffic using Transport Layer Security. It is essential for protecting sensitive log data and meeting compliance requirements.
Yes, a syslog server can be configured to listen for both UDP and TCP traffic on port 514 simultaneously. This allows you to receive logs from devices configured for either protocol from the same port.
Common causes include firewall blocking port 514 (UDP/TCP), incorrect server IP in device configuration, network congestion dropping UDP packets, or the syslog daemon not listening on the expected interface/protocol. When fixing this issue, verify connectivity and the daemon configuration first.
