Enterprise firewall management for every site, from one console
ManageEngine Firewall Analyzer Enterprise Edition unifies firewall monitoring across every site, with distributed log collection, traffic analysis, rule optimization, risk assessment, and compliance auditing.
- Place a probe at each site to collect and store firewall logs locally, and control everything from one Central server.
- Scale out to 3,000 firewalls and 10 million rules by adding servers.
- Support 50+ firewall vendors with centralized visibility and control across distributed environments.
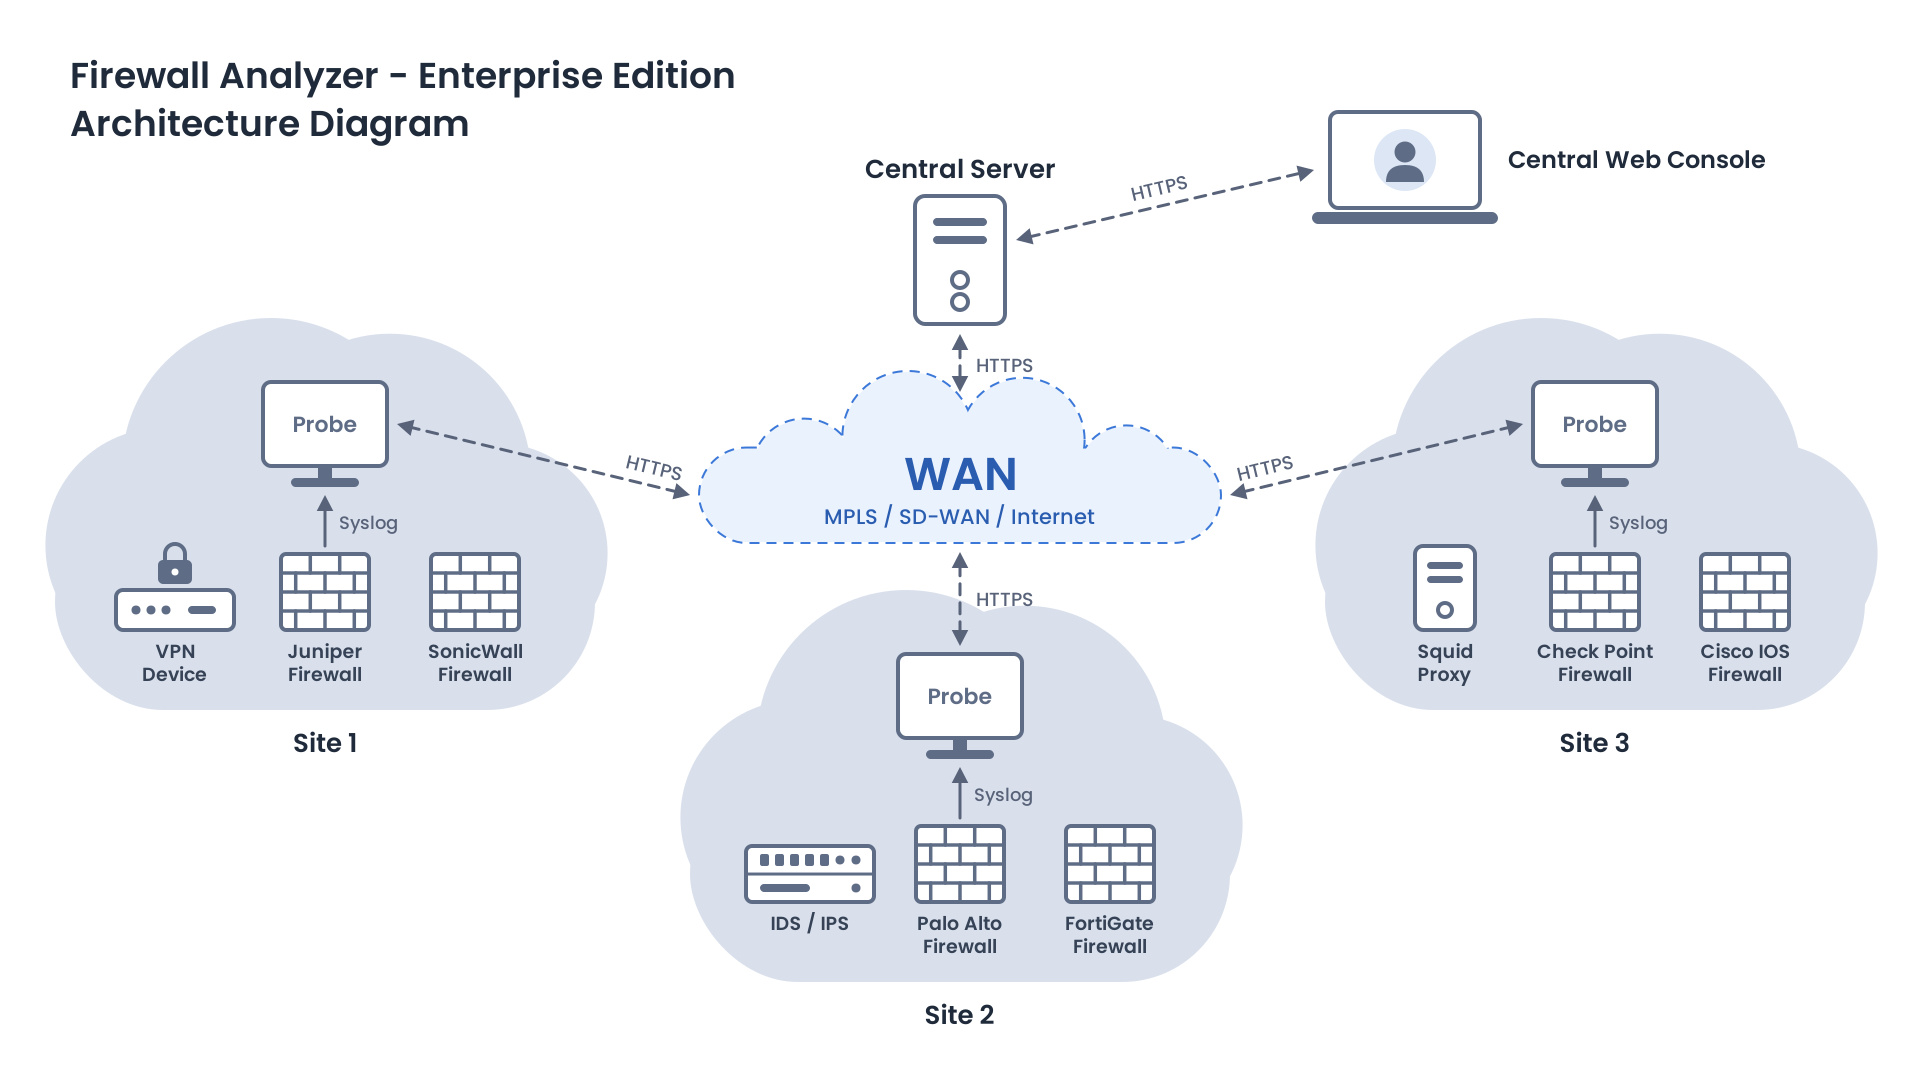
Why do you need enterprise firewall management?
Every new branch, data center, or cloud edge adds firewalls, vendors, and growing rule sets. Risky, unused, and expired rules often go unnoticed until an audit or incident. Centralizing logs strains WAN links and creates a single point of failure. Enterprise firewall management keeps log collection local while providing centralized visibility into rules, risks, changes, and compliance.
Distributed firewall monitoring with central control
Centralized log collection across distributed networks
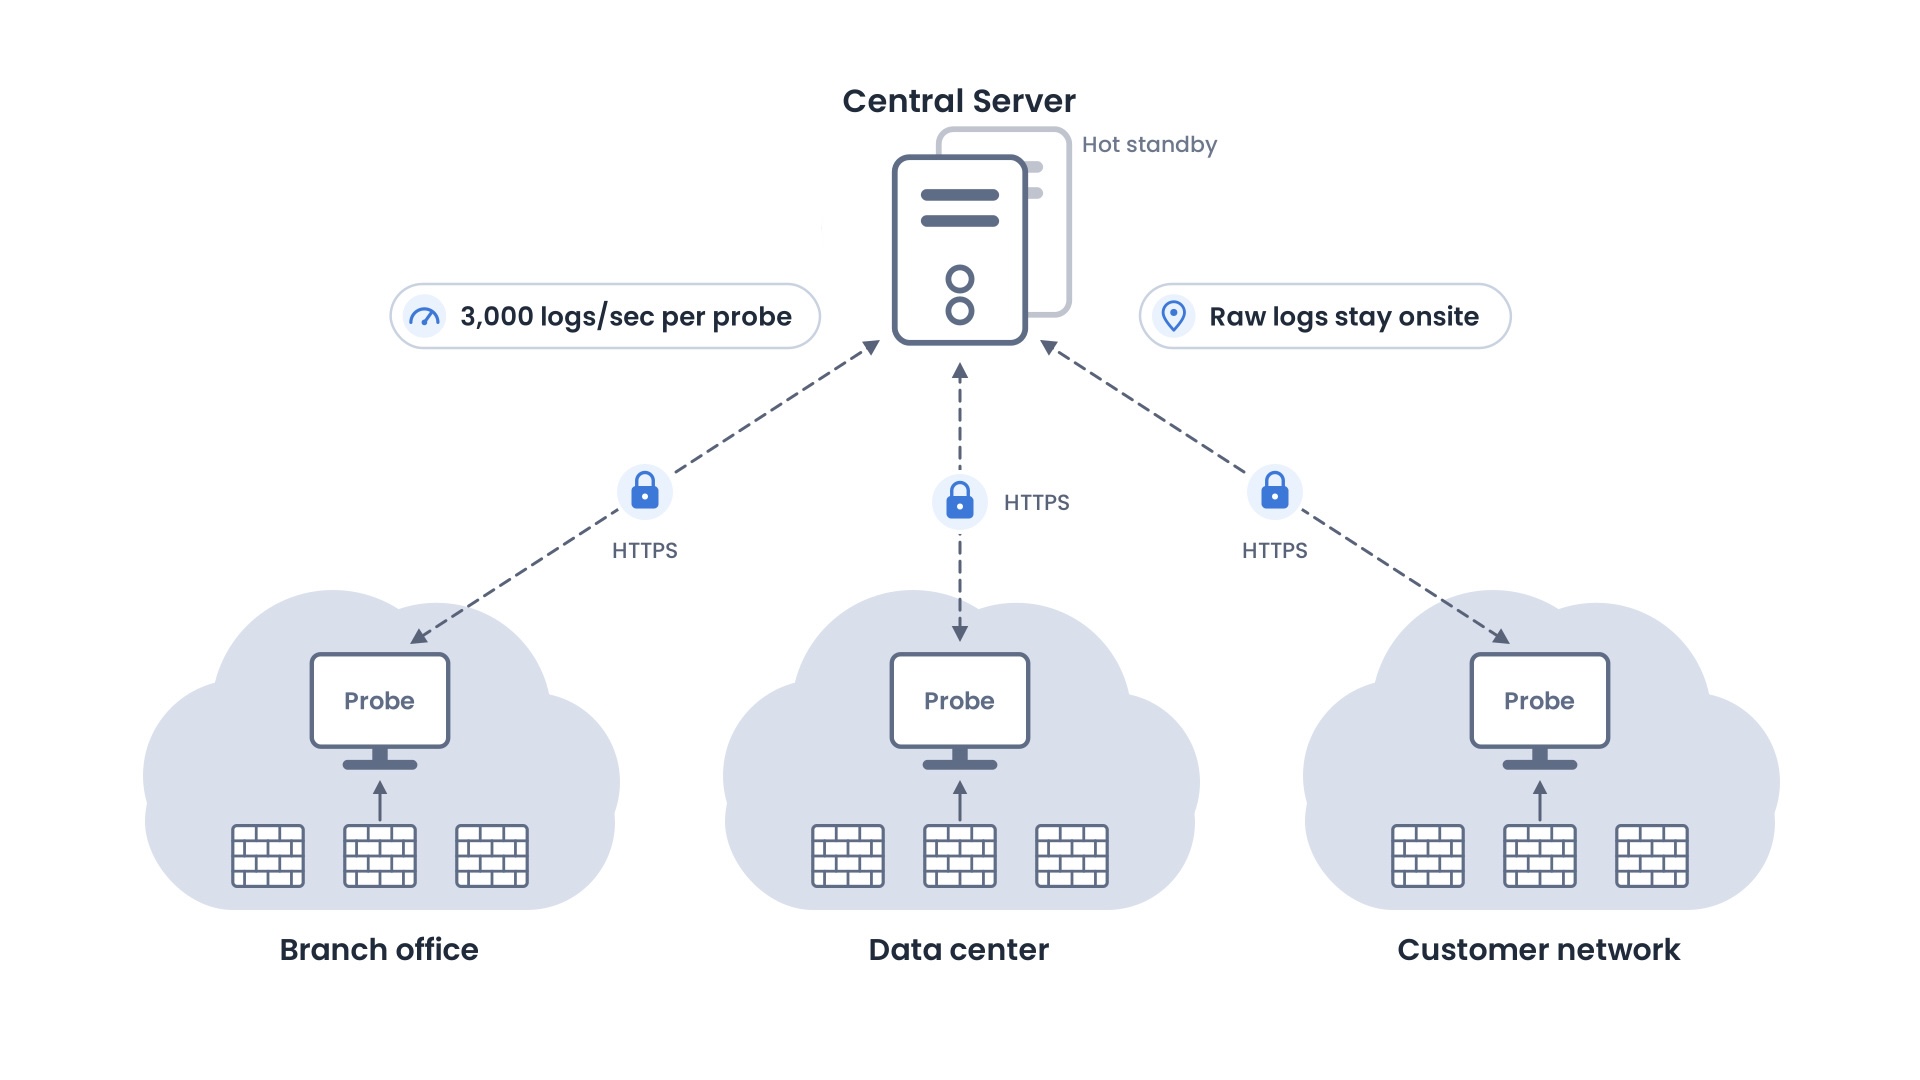
Firewall Analyzer Enterprise Edition uses a Central server and distributed probes. Probes collect, store, and analyze local firewall syslogs. Central manages probes and licensing, while raw logs stay onsite unless archived centrally.
- Deploy a probe in each branch, data center, or customer network; each one handles up to 3,000 logs per second.
- Manage up to 60 Probe servers from a single Firewall Analyzer Central Server.
- Apply one device-based license on Central and share it across every probe as sites grow.
- Encrypt Central—probe traffic with HTTPS, and protect Central and probe servers with the hot-standby failover add-on.
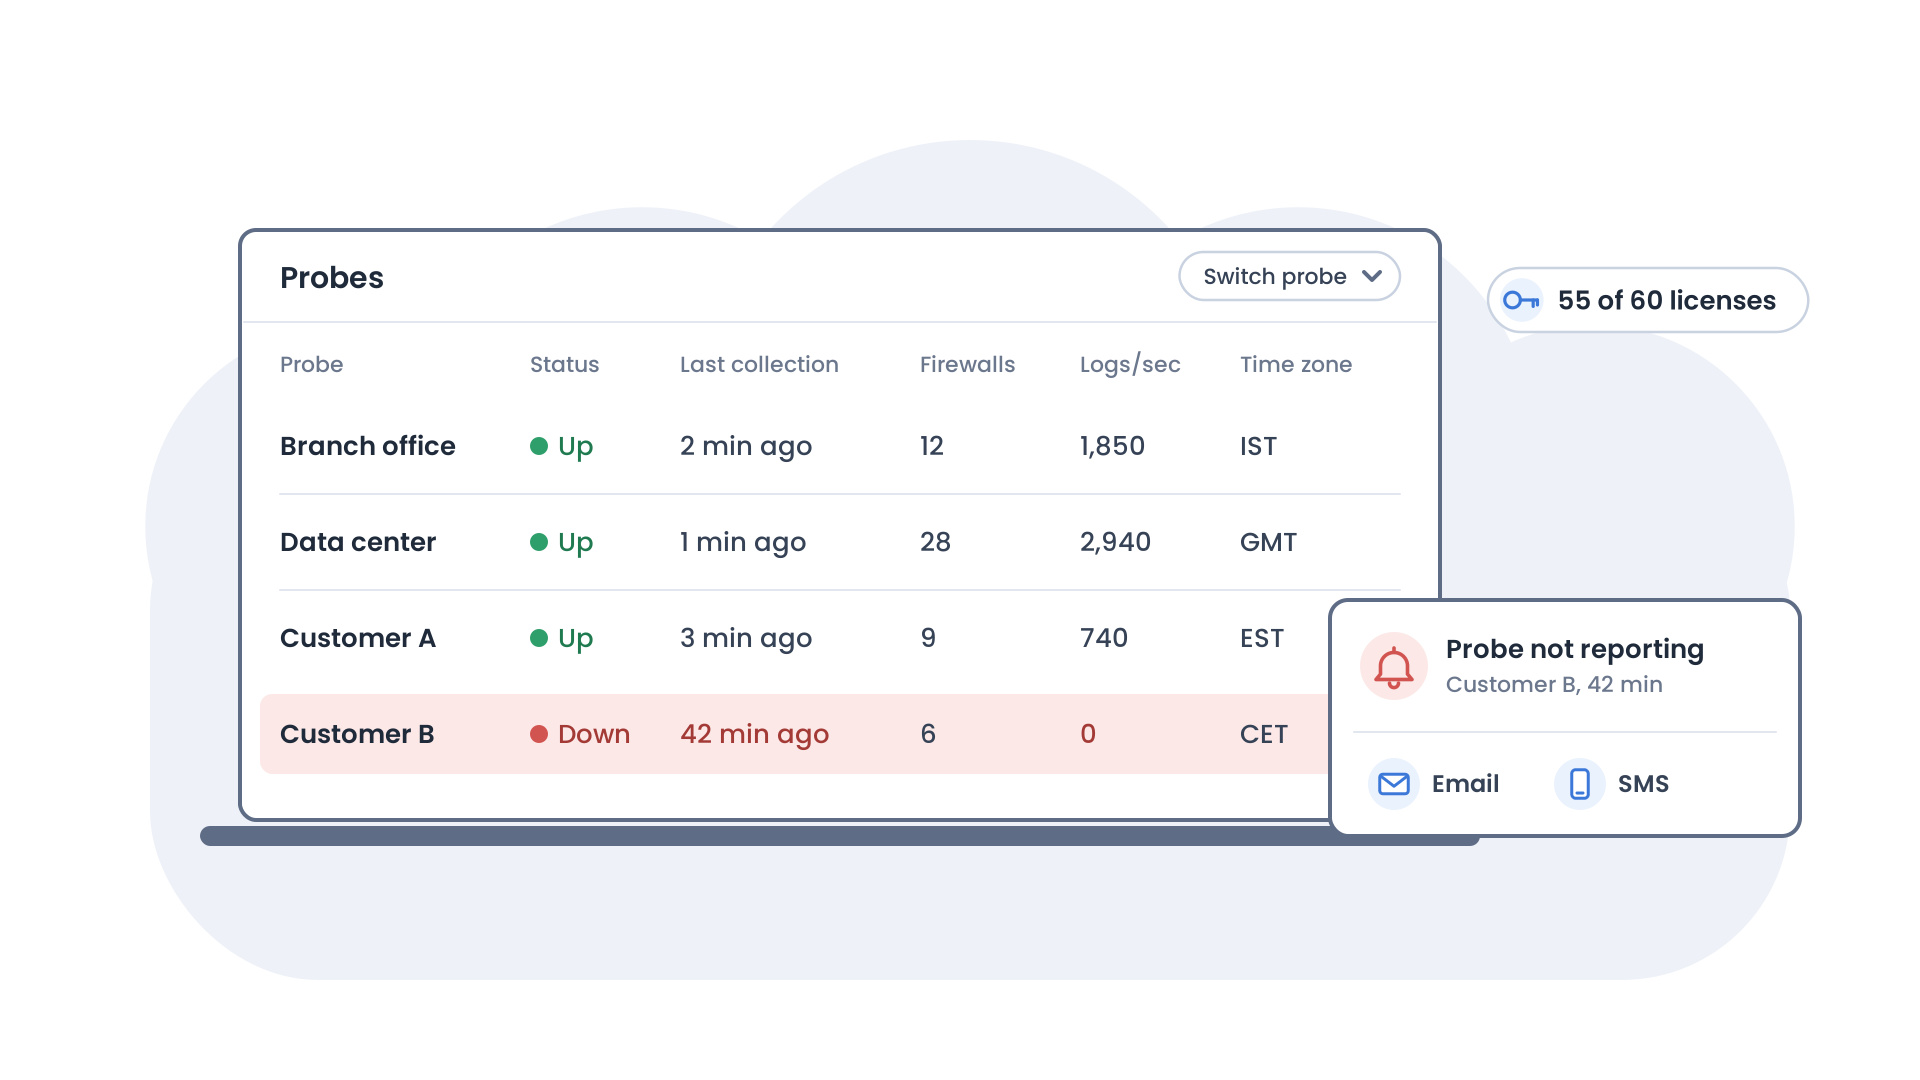
Monitor every probe and every firewall from a single console
The Central server consolidates firewall data from connected probes, enabling cross-site reporting, centralized probe monitoring, and quick access to individual site dashboards, alarms, and logs.
- Track each probe’s status, last log collection time, firewall count, log rate, and time zone on one page.
- Analyze traffic, users, VPN activity, security events, and compliance across multiple sites from a centralized view.
- Switch between probes to access dashboards, live reports, alarms, and archived logs without signing in to remote servers.
- Manage or unmanage device licenses across sites and receive email or SMS alerts when probes stop reporting within your configured time window.
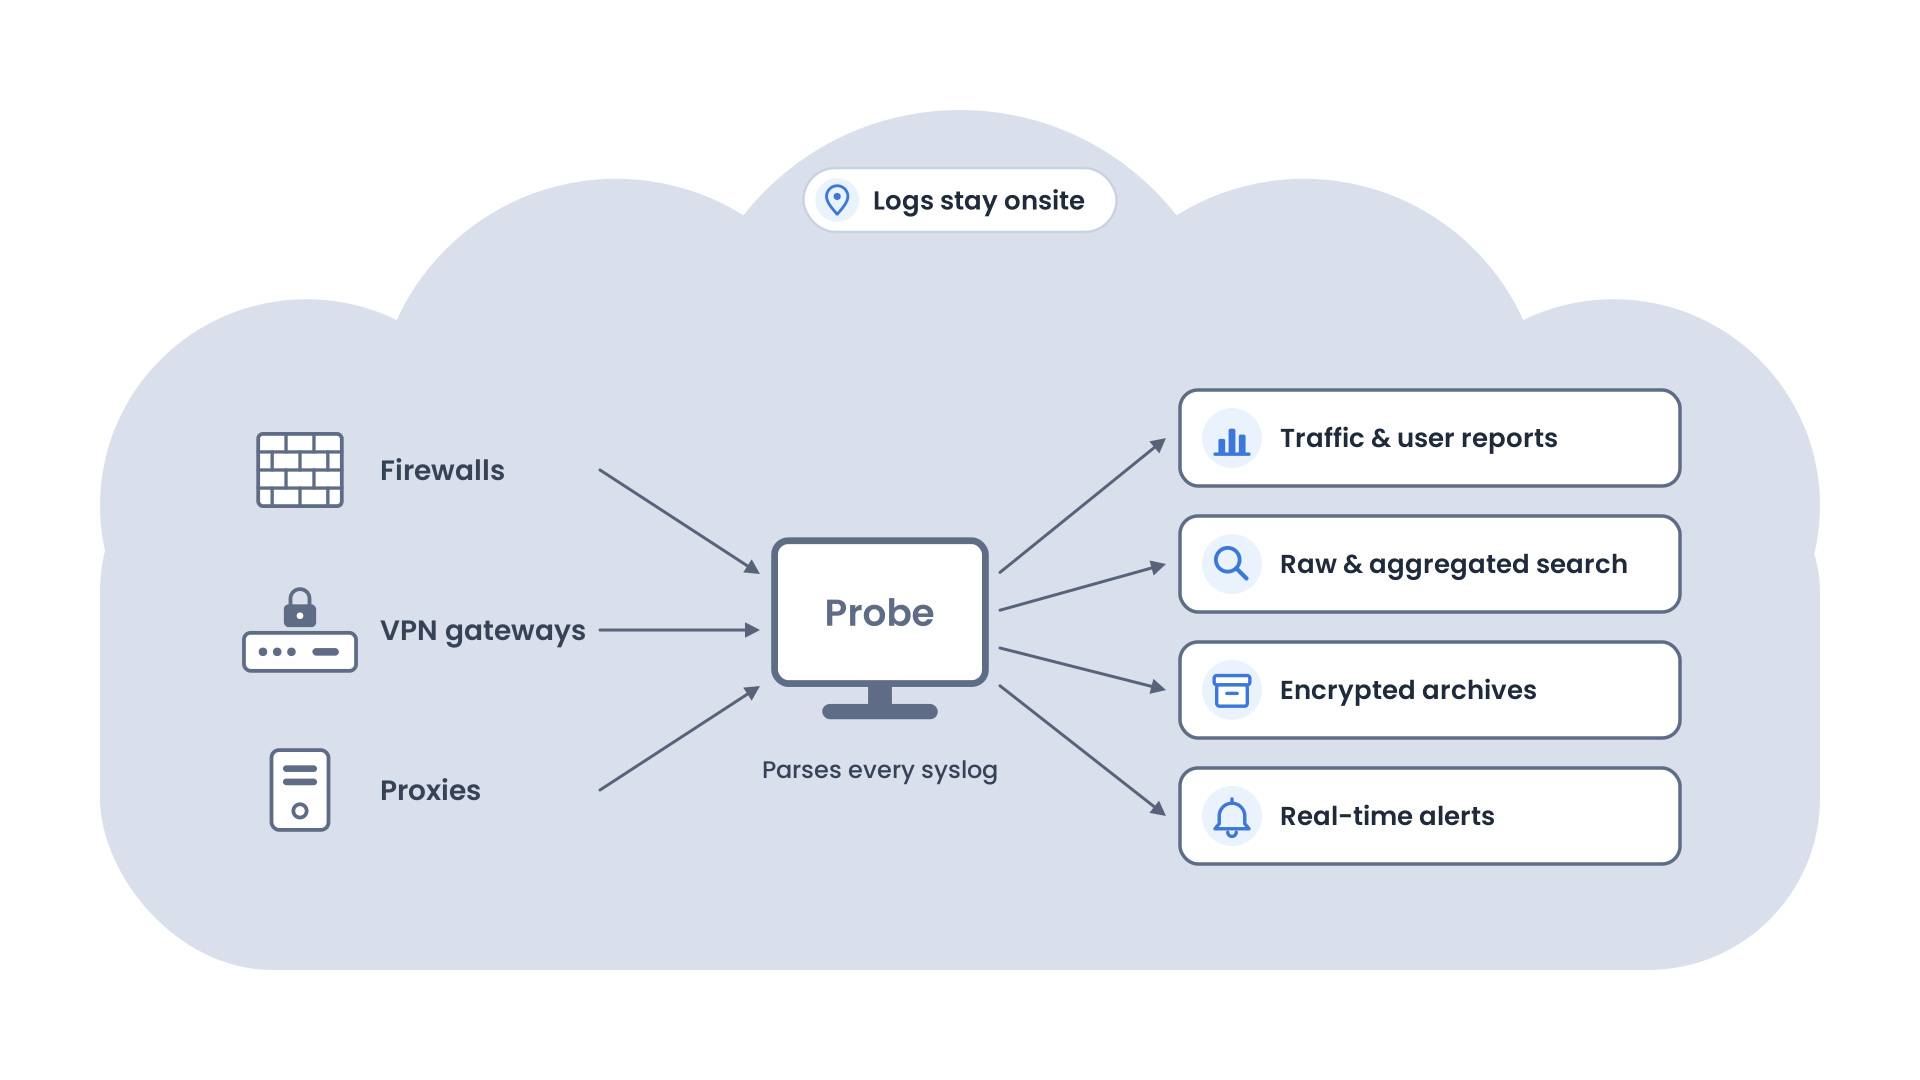
Analyze firewall, VPN, and proxy logs without moving them
Each probe parses the syslogs from its firewalls, VPN gateways, and proxies, so reports and searches run close to the data. Security teams get traffic, threat, VPN, and web-usage reports for any site. Raw and aggregated search support incident investigations.
- Report on bandwidth, top users, applications, and websites accessed at each location.
- Investigate attacks, virus events, denied traffic, and failed VPN logins with raw and aggregated log search.
- Archive logs with encryption and time-stamping, and set retention by years, months, or weeks.
- Trigger real-time alerts on attacks, behavioral anomalies, and bandwidth spikes.
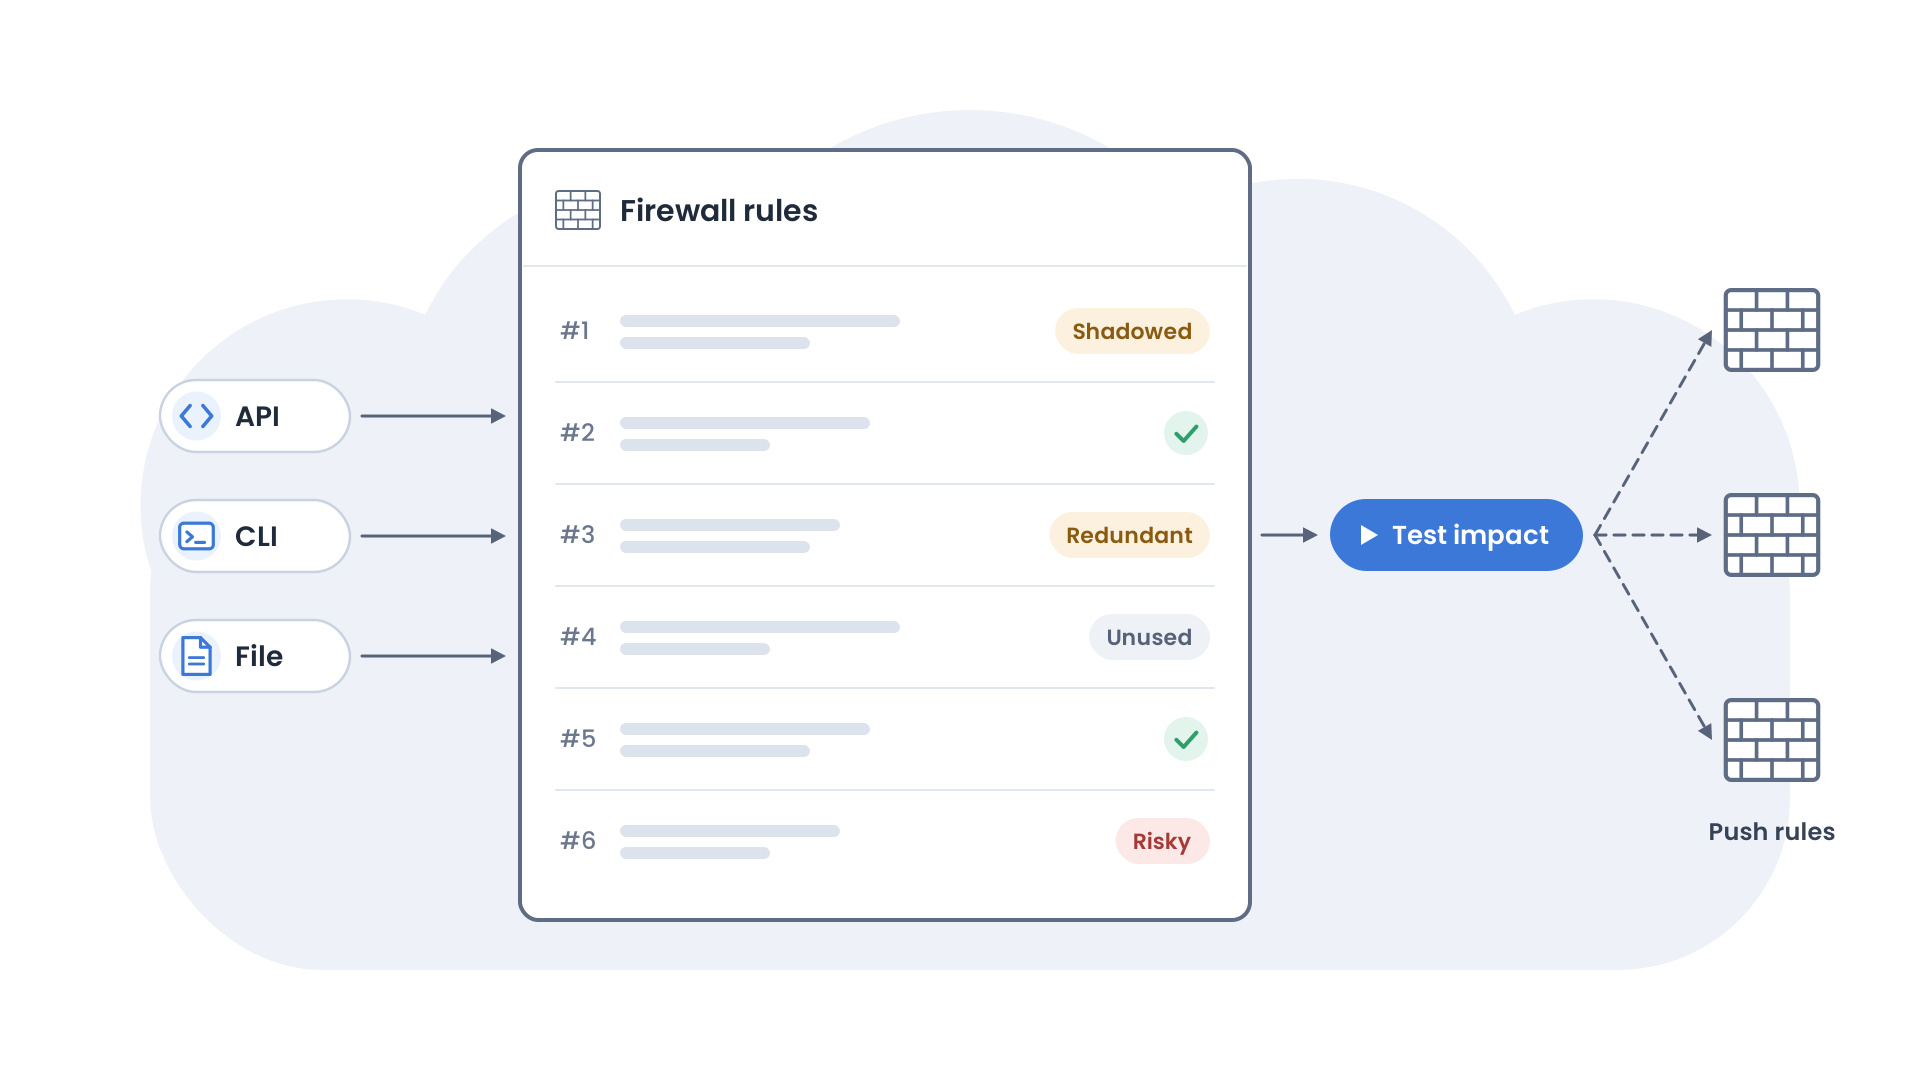
Clean up and secure firewall rules across your network
Firewall Analyzer collects rule configurations through APIs, CLI, or file imports. Identify risky rules, track traffic usage, and assess the impact of proposed rule changes before deployment across supported firewall vendors.
- Find shadowed, redundant, and correlated rules, and apply rule reorder recommendations.
- Flag unused, expired, and risky rules, scored against standard or custom risk profiles.
- Test a new rule’s impact before deployment, then push objects and rules to multiple firewalls at once.
Prove compliance and catch risky changes at every site
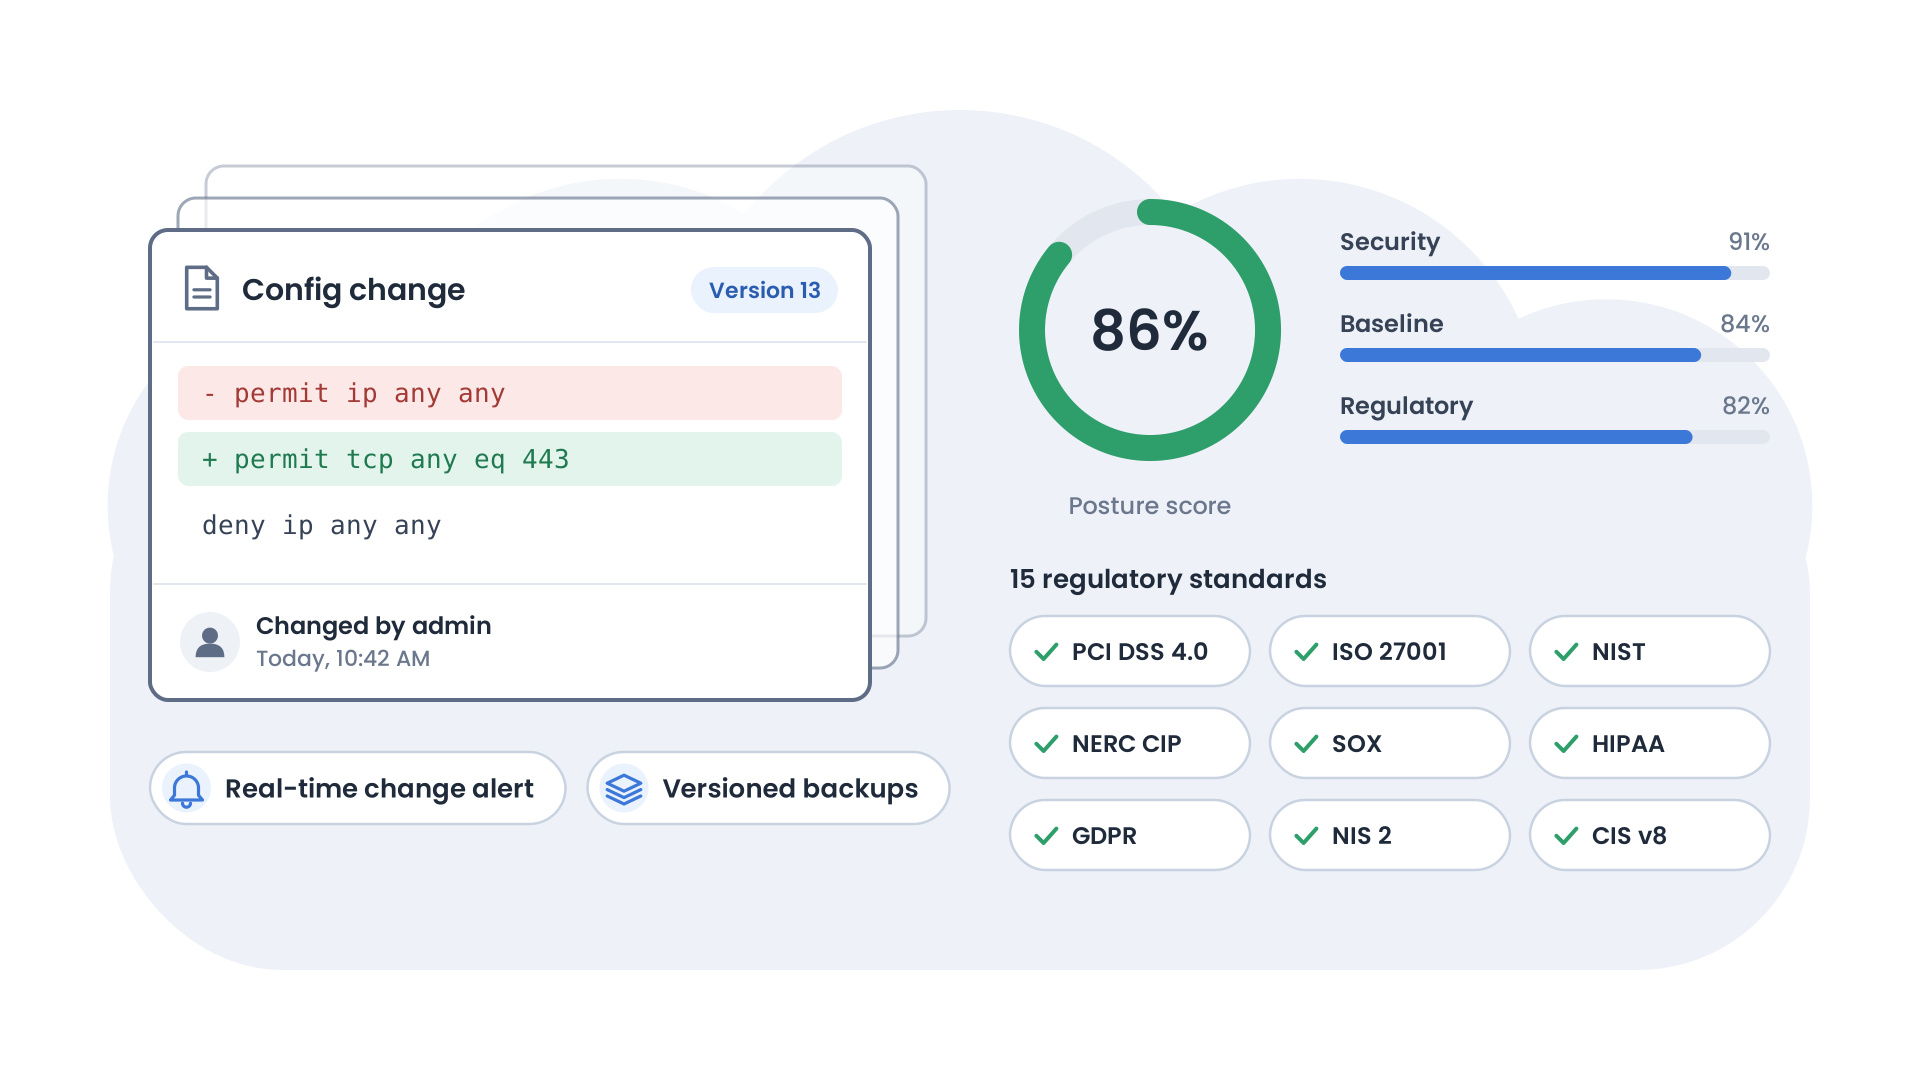
Each probe tracks configuration and rule changes, backs up configurations on schedule, and versions every change. The same rule data supports compliance checks across 15 regulatory standards, keeping audit evidence ready across regions.
- Get real-time alerts on rule and configuration changes, including who made each change and when.
- Compare policy versions and review rule change history for any firewall or device group.
- Audit against PCI DSS 4.0, ISO 27001, NIST, NERC CIP, SOX, HIPAA, GDPR, NIS 2, CIS Controls v8, and more.
- Score each firewall’s security, baseline, and regulatory posture, and run security audit reports that include VPN configuration.
Simplify firewall role-based access control and integrations
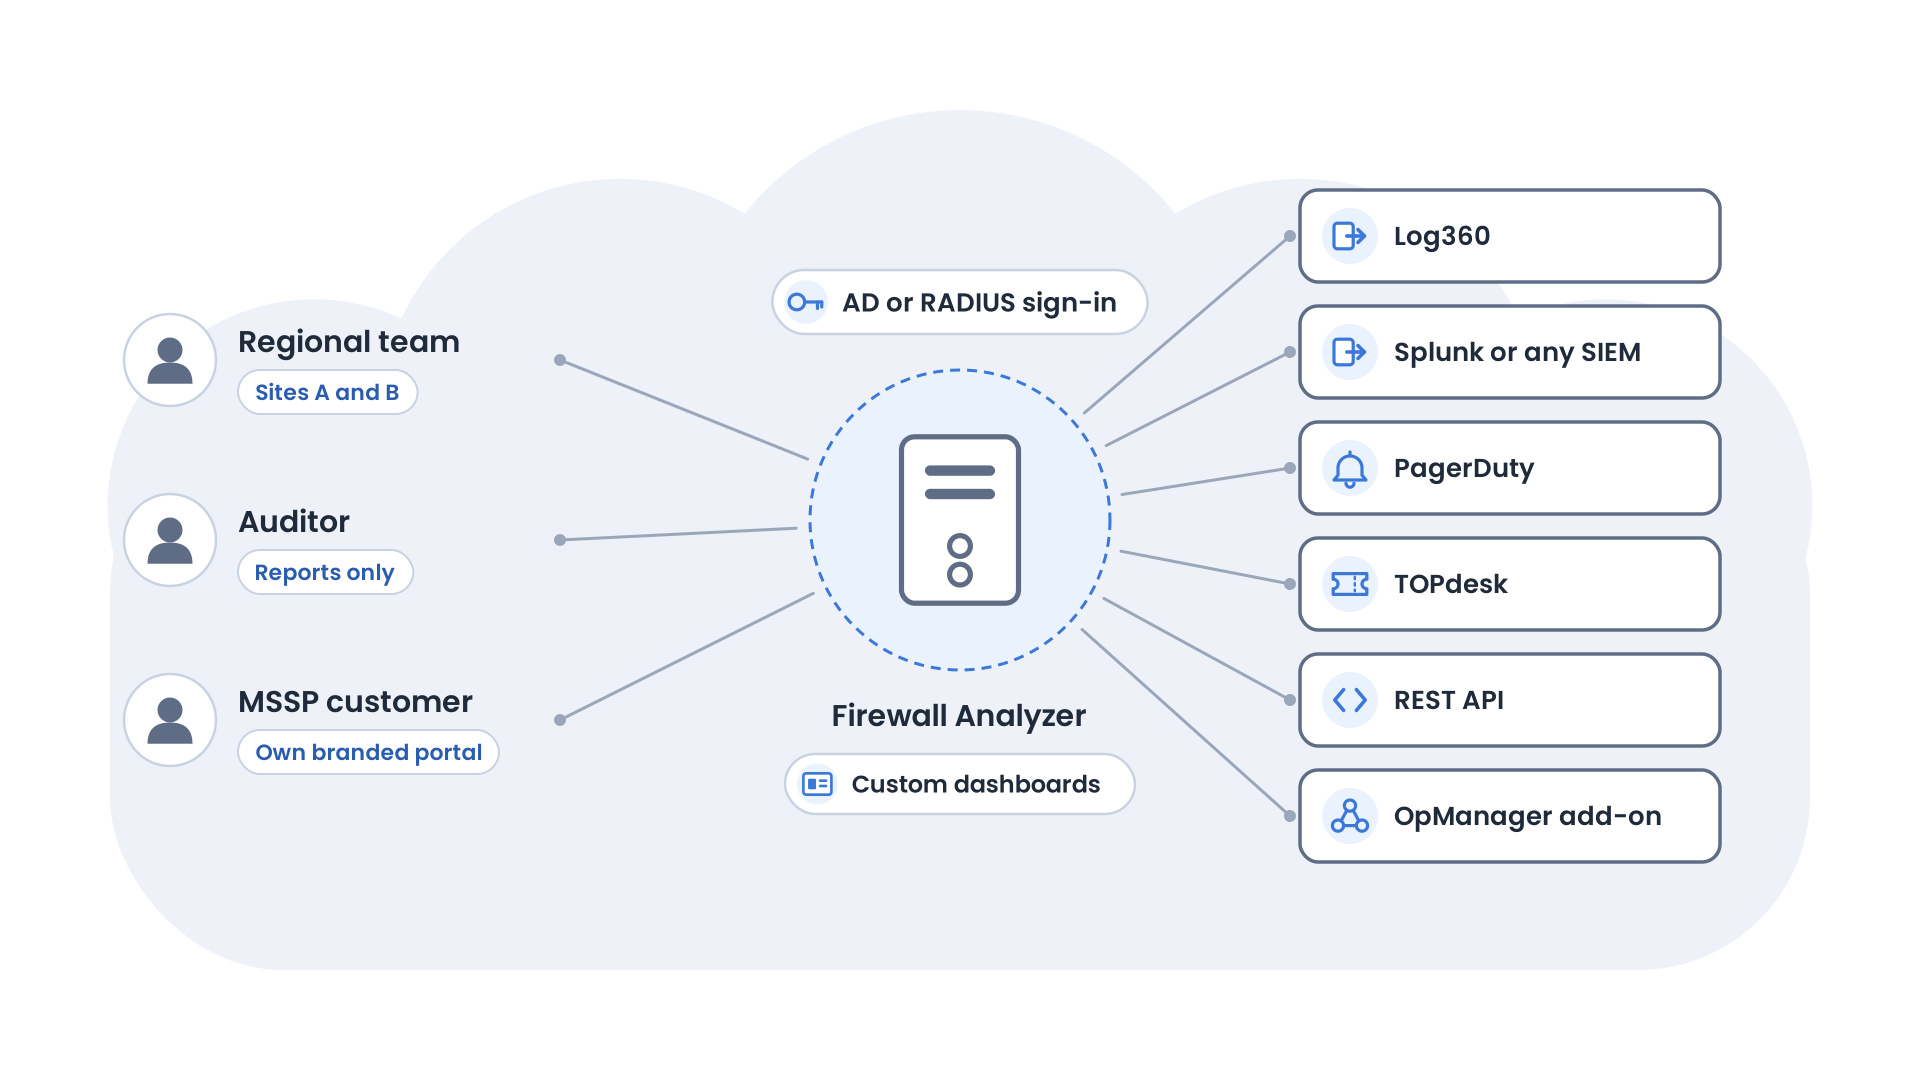
Manage users centrally and assign access to specific probes and firewalls. Regional teams access their sites, auditors access relevant reports, and MSSP customers view only their environments through your rebranded portal.
- Scope operators to specific probes, firewalls, or device groups, and authenticate with Active Directory or RADIUS.
- Rebrand probes and build custom dashboards by customer, region, or business unit.
- Forward alarms and audit logs to Log360, Splunk, or any SIEM, and raise incidents in PagerDuty or TOPdesk.
- Automate reporting through the REST API, or use Firewall Analyzer as an add-on to OpManager for integrated firewall monitoring.
Works with the firewall vendors you already run
Log analysis for firewalls, VPNs, and proxies from 50+ vendors, with rule and compliance management.
RAID arrays
- IBM Storwize
- IBM FlashSystem
- NetApp FAS
- Dell EMC Unity
Tape libraries
- IBM TS4500
- Quantum Scalar
- HPE StoreEver MSL
- Dell EMC ML
FC switches
- Brocade 6520
- Cisco MDS 9148
- HPE SN6700B
- IBM SAN24B-6
What Enterprise Edition delivers for distributed security teams
Enterprise Edition gives you one governed view of firewall security across every location, without forcing every log through a single server.
Scale without rebuilding
Add probes as you add sites, acquisitions, or customers, all under one Central server and one license.
Reduce infrastructure load
Logs stay on the probe that collected them, so WAN links carry management traffic instead of raw syslog.
Consistent security everywhere
The same rule analysis, risk scoring, and compliance checks run at every site, for every vendor.
Streamline audits
Access compliance evidence, change history, and raw logs across all sites from one console.
FAQs on enterprise firewall management
Answers to common questions about deploying, licensing, and scaling Firewall Analyzer Enterprise Edition.
- Central server: Intel Xeon quad-core 3.5 GHz processor with 8 threads or higher, 8 GB RAM, and 100 GB disk space. The processor should have a combined PassMark score of at least 7,000.
- Probe server: For up to 500 logs per second, an Intel Xeon quad-core 3.5 GHz processor with 8 threads, 8 GB RAM, and 25 GB of disk space per day is recommended. For higher log rates, 16 GB RAM and additional 25 GB of disk space per day for every 500 logs per second are recommended.
Resources to dig deeper
Real-time firewall observability using Firewall Analyzer
Learn the basics of ManageEngine Firewall Analyzer through this youtube video.
- Firewall Device Management
- » Firewall Log Management
- » Firewall Log Analysis
- » Importing Firewall Log Files
- » Log Forensic Analysis - Raw & Formatted Log Search and Reports
- » Firewall Log Archiving
- Firewall Log Analysis
- Security Device Log Analysis
- Compliance
- MSSP Specific Features
- Troubleshooting Tool: