Add Hosts
Add a host in the user interface, using any one of the following menu options:
- Home tab > Hosts > +Hosts
- Tabs: +Add > Hosts
- Settings tab > Manage Hosts: Add
 |
Note: The default Host Types are Windows, UNIX, IBM AS/400, Cisco Device and Syslog Device. For adding custom/new host types click on the '+' icon and enter the new host type name. |
Adding Host Groups
You can also group your hosts into a particular Host Group. The default host groups available are Windows Group, Unix Group and Default Group (which contains all the hosts). To add a new host group, click on + button beside the Host Group field in Add New Host page.
Note: You cannot add a single host in two or more host groups, since it creates conflict.
Adding different host types
Add Windows host
In all Windows hosts, ensure that WMI, DCOM are enabled; logging is enabled for respective module/ object. To forward the Windows event logs in the syslog format use the third party utility like SNARE.
-
Select the host type as Windows. Optionally, use the '+' icon to create new host type for your host
-
Enter the host name(s). Enter multiple host names separated by comma.
Tip: you can also copy the comma separated host names from a text file and paste in this field
-
If you have logged in as an Administrator, you will see the Pick Hosts option. Use the Pick Hosts link to select one or multiple host(s) from a Domain/ Workgroup
Pick Hosts
-
Select the domain or workgroup from which you want to choose the host(s).
-
Use Select All option to select all the hosts of the workgroup or domain listed in the box below. Alternatively, use the search box to search for the required host(s).
-
The box lists all the hosts of the selected domain/workgroup or host(s) of the search result
-
Use the Login as Domain User option to access the all selected host(s) with domain user credentials
-
Click Update button to add the hosts using Pick Host option
-
If you cannot find host(s) of your interest listed in the selected domain or workgroup, use the Re-Scan the <domain or workgroup> link to scan the selected domain or workgroup
-
If you cannot find host(s), domain(s), OU(s), work group(s) of your interest, listed in the whole network, use the Re-Scan the complete network link to scan the complete network
-
Select the host group. For Windows host type, Windows Group will be the default selection. Optionally, use the '+' icon to create new host group to assign the configured host(s).
-
The Domain Name field is optional only if the host machine is in the local workgroup. Ensure to manually type-in the domain name of the host(s). If Pick Hosts menu is used, Domain Name field will be filled automatically
-
Enter the Login Name (refers to user name) and Password to access the configured host(s). The user account should have admin privileges to fetch the logs. Use the Verify Login link to validate the credentials. If multiple hosts are selected, ensure that the credentials are valid for all the hosts
-
Enter the Monitor Interval to configure the frequency at which EventLog Analyzer should fetch the log from the hosts. By default, 10 minutes is the minimum monitor interval.
-
Click Save button to add the host(s). Use Save & Add More button to add more hosts
|
Caution: If EventLog Analyzer has been installed on a UNIX machine, it cannot collect event logs from Windows hosts. However, third party applications can be used to convert the Windows event logs to Syslog and forward it to EventLog Analyzer. |
|
Note:
Collect Logs: If you want to collect historic logs present in the Windows event viewer, click the Collect Logs 'folder' icon on the top right side of the Add New Host screen. The Collect Logs window pops down. In that, select the check box 'Collect Historic Logs present in EventViewer' to collect the historic logs. If the check box is selected, EventLog Analyzer will collect all the historical logs present in the Windows Event Viewer. If the check box is unselected, EventLog Analyzer will collect only the logs of the past one hour. Caution: Historic Log collection activity is CPU and Memory resource intensive. We suggest you to use it judiciously. |
Add UNIX host / Cisco devices / Syslog devices
UNIX/ Linux hosts configured to send Syslog data to the EventLog Analyzer on either of the default Syslog ports (513 & 514) need not be added as UNIX hosts in EventLog Analyzer and they will be automatically added to the list of hosts. Troubleshoot if UNIX/ Linux hosts/ devices not automatically added to the list of hosts. If the hosts, devices are not added in the Hosts list, follow the troubleshooting procedure given below.
- Check the connectivity between the EventLog Analyzer server and the UNIX/ Linux host or device. Use the 'ping' command and check if UNIX/ Linux machine is reachable from Eventlog Analyzer server and vice-versa
- Logon to EventLog Analyzer user interface, click on Show Listener Port(s) Details and check if the ports 513, 514 are up and getting listened
- In case, the default port is down, meaning the port is occupied by some other application, then you can forward the syslog to any other port which is free and ensure that you add that port in EventLog Analyzer product or free the port by stopping the application which uses it
- Check whether the packets are forwarded in the default UDP ports 513, 514 or the custom configured port from the UNIX/ Linux machines
- If the machine is not getting added still, check if any firewall (like Windows Firewall or any other services) is blocking the port. If so, unblock the port
- If the issue persists, use any packet capturing tool like Wireshark or Ethereal and ensure that syslogs are forwarded from the UNIX/ Linux machine
Cisco Devices (Switches and Routers), Hypervisor, and VMware, or any other Syslog devices
In the case of these devices, you have add them as UNIX hosts in EventLog Analyzer. Before adding them as hosts, ensure that Syslog Daemon is configured in those hosts or devices.
-
Select the host type as UNIX. Optionally, use the + icon to create new host type for your host
-
Enter the host name(s). Enter multiple host names separated by comma. Tip: you can also copy the comma separated host names from a text file and paste in this field
-
Select the host group. For UNIX host type, UNIX Group will be the default selection. Optionally, use the + icon to create new host group to assign the configured host(s)
-
Enter the Syslog Listener Port through which the UNIX host(s) will be sending the syslog
-
Click Save button to add the host(s).
-
Use Save & Add More button to add more hosts
|
Note: In Linux hosts, ensure that the syslog daemon is running and verify the port number to configure in EventLog Analyzer. |
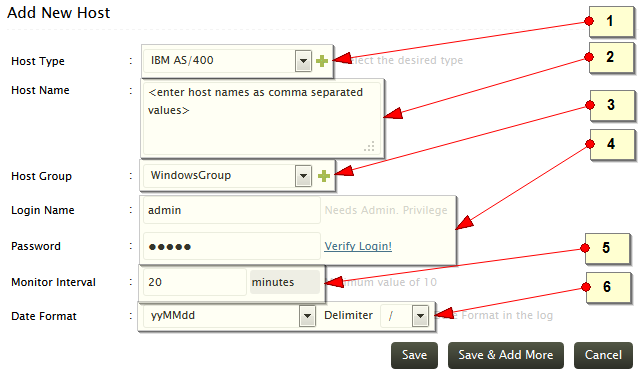
Adding IBM iSeries (AS/400) Host
Keep the ports 446-449,8470-8476,9470-9476 open in EventLog Analyzer to receive IBM AS/400 machine logs.
-
From the Add New Host page, choose IBM AS/400 as the Host Type
-
Use the Host Name box to type a single host name, or a list of host names separated by commas
-
Select the Host Group to which the hosts need to be added. Click the '+' icon to create a new host group
-
Enter the admin previlage 'Login Name' and 'Password'. Verify the login using the 'Verify Login' link beside the password text
-
Specify the Monitor Interval field, to configure the frequency at which EventLog Analyzer should fetch the log from the IBM AS/400 machines. By default, 10 minutes is the minimum monitor interval.
-
Select the Date Format and the Delimiter Date Format in the log. This is the date format used in the logs that will be collected from the IBM AS/400 hosts
If you are done, click Save to add this host and return to the list of hosts monitored. If you want to add more hosts, click Save and Add More to add this host, and then add more hosts
|
The user account with which the EventLog Analyzer is logging in to AS400 must have the authority level of 50. Otherwise, the application will not be able to login to fetch History logs. |
Adding VMware Host
-
From the Add New Host page, choose UNIX as the Host Type and add the VMware host as UNIX host as per the steps given above.
-
Configure the syslog in the VMware as per the steps given below.
-
After the EventLog Analyzer starts receiving the syslogs from the VMware host, edit the VMware host details and make host type as Hypervisor. Follow the steps given below:
- Click the Edit Host Details icon of VMware host, Edit Host Details page opens up.
- In that, choose Hypervisor as the Host Type.
- Click Save Host Details to make this host as VMware host and return to the list of hosts monitored.
Adding Oracle Application
To configure hosts for which you want to monitor Oracle logs carry out the procedure given below.
Add the Oracle Application server as a new Windows Host (if the Oracle application is running on a Windows machine) as per the procedure given or as a new Linux Host (if the Oracle application is running on a UNIX machine) as per the procedure given.
After adding as Windows or Linux Host, select Settings > Configurations: Manage Applications: Add: Oracle menu or or Home tab > Applications > Actions: +Oracle menu. The Configure Oracle Hosts page opens up. In the Add Host text field, enter the host name of the Oracle application server. Click the Save icon besides the text field. Existing Oracle Application hosts are listed below the text field as Existing Hosts.
After Configuring Oracle Hosts in EventLog Analyzer, carry out the configuration given below in Oracle server.
Oracle Server Configuration
Reference: http://download.oracle.com/docs/cd/B28359_01/network.111/b28531/auditing.htm#CEGBIIJD
For Oracle server installed in Windows platform
connect to sqlplus
- Change audit parameter using below query
ALTER SYSTEM SET AUDIT_TRAIL=OS SCOPE=SPFILE;
- Restart the Oracle server to get the changes effected.
For Oracle Server installed in Unix platform
To enable Oracle syslog auditing, follow the procedure given below:
- Assign a value of OS to the AUDIT_TRAIL initialization parameter, as described in 'Enabling or Disabling the Standard Audit Trail'
For example: ALTER SYSTEM SET AUDIT_TRAIL=OS SCOPE=SPFILE;
- Manually add and set the AUDIT_SYSLOG_LEVEL parameter to the initialization parameter file, initsid.ora.
Set the AUDIT_SYSLOG_LEVEL parameter to specify a facility and priority in the format AUDIT_SYSLOG_LEVEL=facility.priority.
facility: Describes the part of the operating system that is logging the message. Accepted values are user, local0–local7, syslog, daemon, kern, mail, auth, lpr, news, uucp, and cron.
The local0–local7 values are predefined tags that enable you to sort the syslog message into categories. These categories can be log files or other destinations that the syslog utility can access. To find more information about these types of tags, refer to the syslog utility MAN page.
priority: Defines the severity of the message. Accepted values are notice, info, debug, warning, err, crit, alert, and emerg.
The syslog daemon compares the value assigned to the facility argument of the AUDIT_SYSLOG_LEVEL parameter with the syslog.conf file to determine where to log information.
For example, the following statement identifies the facility as local1 with a priority level of warning:
AUDIT_SYSLOG_LEVEL=local1.warning
See Oracle Database Reference for more information about AUDIT_SYSLOG_LEVEL.
-
Log in to the machine that contains the syslog configuration file, /etc/syslog.conf, with the superuser (root) privilege.
-
Add the audit file destination to the syslog configuration file /etc/syslog.conf.
For example, assuming you had set the AUDIT_SYSLOG_LEVEL to local1.warning, enter the following:
local1.warning /var/log/audit.log
This setting logs all warning messages to the /var/log/audit.log file.
- Restart the syslog logger:
$/etc/rc.d/init.d/syslog restart
Now, all audit records will be captured in the file /var/log/audit.log through the syslog daemon.
- Restart the Oracle server so that changes are effected.
Adding Print Server
To configure Print Servers for which you want to monitor the logs carry out the procedure given below.
Add the Print Server as a new Windows Host as per the procedure given.
After adding as Windows, select Settings > Configurations: Manage Applications: Add: Print Server menu or Home tab > Applications > Actions: +Print Server menu. The Configure Print Server page opens up. In the Add Host text field, enter the host name of the Print Server. Click the Save icon besides the text field. Existing Print Servers are listed below the text field as Existing Hosts.
After Configuring Print Server in EventLog Analyzer, carry out the configuration given below in Print Server.
Print Server Configuration
Enable Print Server Log
Open Event Viewer > Application and Service Logs > Print Service, right click and select 'Enable Log'. This will enable logging for the corresponding 'Admin', 'Debug' or 'Operational' processes. The logs will be available under Event Viewer.
Note: Carry out the following registry configuration only for a 64-bit Windows OS machine:
- Open the registry editor 'regedit' of the Print Server machine in the Command Line Window
- Navigate to ComputerHKEY_LOCAL_MACHINESYSTEMCurrentControlSetserviceseventlog
- To create a new key,right click on eventlog, click new > key. You can name the key as Microsoft-Windows-PrintService/Operational or Microsoft-Windows-PrintService/Admin or Microsoft-Windows-PrintService/Debug as per your logging process requirement.
- For instance, if you need to enable logging for Operation process, create a new key with the name Microsoft-Windows-PrintService/Operational
This will convert the Log type to 'Administrative' thus enabling you to perform search and generate reports out of these logs
The above configuration is not required for a 32-bit Windows OS machines
Enabling Terminal Services Logs
To monitor logs from the Terminal Server, you need to configure it as below,
Add the Terminal Service as a new Windows Host as per the procedure given.
After adding the host as the Windows host, go to Settings > Configuration > Manage Applications > Add: Terminal menu. alternatively you can also use the following navigation Home Tab > Applications > Add Live host option.
Now Configure App Server page opens up. In the Add Host text field, enter the host name of the Terminal Server which is already added. Click the Save icon beside the text field. Select theApplication type as Terminal. Existing Print Servers are listed below the text field as Existing Hosts
After Configuring Terminal Services in EventLog Analyzer, carry out the configuration given below in your Terminal Server
Configuring Terminal Server
Open Event Viewer > Application and Service Logs > Terminal Logs, right click and select 'Enable Log'. This will enable logging for the corresponding 'Gateway'' or 'Operational' processes. The logs will be available under Event Viewer
Note:
Carry out the following configuration only for a 64-bit Windows OS Machine:
- Open the registry editor 'regedit' of the Terminal Server machine in the Command Line Window
- Navigate to Computer \HKEY_LOCAL_MACHINE\SYSTEM\CurrentControlSet\services\eventlog\
- To create a new key,right click on eventlog, click new > key. You can name the key as
Microsoft-Windows-TerminalServices-Gateway/Operational
- For instance, if you need to enable logging for Operation process, create a new key with the name Microsoft-Windows-TerminalServices/Operational
This will convert the Log type to 'Administrative' thus enabling you to perform search and generate reports out of these logs
The above configuration is not required for 32 bit Windows OS versions
Enabling Windows Firewall Logs
To monitor the Windows Firewall logs, you need to initially add the Windows host from which the Firewall logs are to be collected.
For EventLog Analyzer to collect Windows Firewall logs, follow the below procedure to enable Windows Firewall logging
-
Open your Event Viewer.
-
Go to Application and Service Logs > Microsoft > Windows > Windows Firewall With Advance Security > Firewall
-
Right Click in Firewall and select 'Enable Log'
This will enable the logging for Windows Firewall and the logs will be available under Event Viewer.
To perform search and generate report out of these logs,carry out the following registry configuration
-
Open your registry editor, 'regedit' of your Windows host in Command Line window
-
Navigate to ComputerHKEY_LOCAL_MACHINESYSTEMCurrentControlSetserviceseventlog
- Right click on 'eventlog' and create a new key as Microsoft Windows - Windows Firewall With Advanced Security/Firewall
Enabling Hyper V logs
To monitor Hyper V Logs, add the Windows Server from which the Hyper V logs are to be collected.
For EventLog Analyzer to collect Hyper V logs, follow the below procedure
-
Open your Event Viewer
-
Go to Application and Service Logs>Microsoft>Windows
- Right click on the following options and select 'Enable Log'
- Hyper-V-Config
- Hyper-V-High-Availability
- Hyper-V-Hypervisor
- Hyper-V-Integration
- Hyper-V-SynthFC
- Hyper-V-SynthNic
- Hyper-V-SynthStor
- Hyper-V-VID
- Hyper-V-VMMS
This will enable the logging for Hyper V Logs and the logs will be available under Event Viewer.
To perform search and generate report out of these logs,carry out the following registry configuration
-
Open your registry editor, 'regedit' of your Windows host in Command Line window
-
Navigate to ComputerHKEY_LOCAL_MACHINESYSTEMCurrentControlSetserviceseventlog
- Right click on 'eventlog' and create new keys with the following name
- Microsoft-Windows- Hyper-V-Config
- Microsoft-Windows-Hyper-V-High-Availability
- Microsoft-Windows-Hyper-V-Hypervisor
- Microsoft-Windows-Hyper-V-Integration
- Microsoft-Windows- Hyper-V-SynthFC
- Microsoft-Windows-Hyper-V-SynthNic
- Microsoft-Windows- Hyper-V-SynthStor
- Microsoft-Windows- Hyper-V-VID
- Microsoft-Windows- Hyper-V-VMMS
Enabling Stackato Logging
EventLog Analyzer automatically adds and collects your stackato logs upon executing the following command in your tty console,
$kato config set logyard drainformats/<Format Name>[<PRI>{{.Text}}]
$kato drain add <Drain Name>udp://EventLog Analyzer Server>:<udp_port> -f <Format Name>
|
Note:<Format Name>,<Drain Name> and PRI are user defined values.
Example:
$kato config set logyard drainformats/systail-ela-local[{<13>{{.Text}}]
$kato drain add ela udp://ELA:514 -f systail-ela-local
By default, EventLog Analyzer uses 513 and 514 as default UDP ports. In case if you have changed the UDP port number, specify the same here.
|
Logyard will now drain all the logs in the format name as specified to EventLog Analyzer's UPD port number as give. EventLog Analyzer can now collect all the stackato logs as syslogs and analyze them with special reports.
Configuring the Syslog Service on a UNIX Host
-
Login as root user and edit the syslog.conf file in the /etc directory.
-
Append *.*<space/tab>@<server_name> at the end, where <server_name> is the name of the machine on which EventLog Analyzer is running.
-
Save the configuration and exit the editor.
-
Edit the services file in the /etc directory.
-
Change the syslog service port number to 514, which is one of the default listener ports of EventLog Analyzer. But if you choose a different port other than 514 then remember to enter that same port when adding the host in EventLog Analyzer.
-
Save the file and exit the editor.
-
Restart the syslog service on the host using the command:
/etc/rc.d/init.d/syslog restart
For configuring syslog-ng daemon in a Linux host, append the following entries
destination eventloganalyzer { udp("<server_name>" port(514)); };
log { source(src); destination(eventloganalyzer); };
at the end of /etc/syslog-ng/syslog-ng.conf, where <server_name> is the ip address of the machine on which EventLog Analyzer is running.
Configuring the Syslog Service on a HP-UX/Solaris/AIX Host
-
Login as root user.
- Edit the syslog.conf file in the /etc directory as shown below.
*.emerg;*.alert;*.crit;*.err;*.warning;*.notice;*.info;*.debug <tab-separation>@<server_name>
|
Note: For Solaris host, it is just enough to include *.debug<tab-separation>@<server_name> in the syslog.conf file. |
where, <server_name> is the name of the machine where EventLog Analyzer server or Service is running. Just ensure that only a tab separation alone is there in between *.debug and @<server_name>.
-
Save the configuration and exit the editor.
-
Edit the services file in the /etc directory.
-
Change the syslog service port number to 514, which is one of the default listener ports of EventLog Analyzer. But if you choose a different port other than 514 then remember to enter that same port when adding the host in EventLog Analyzer.
- Start the syslog daemon running on the OS. You need to just execute the below command.
Usage : /sbin/init.d/syslogd {start|stop}
Command to be executed :
(for HP-UX) /sbin/init.d/syslogd start
(for Solaris) /etc/init.d/syslog start
(for Solaris 10) svcadm -v restart svc:/system/system-log:default
(for IBM AIX) startsrc -s syslogd
Configuring the Syslog Service on VMware
All ESX and ESXi hosts run a syslog service (syslogd), which logs messages from the VMkernel and other system components to a file.
To configure syslog for an ESX host:
Neither vSphere Client nor vicfg-syslog can be used to configure syslog behavior for an ESX host. To configure syslog for an ESX host, you must edit the /etc/syslog.conf file.
To configure syslog for an ESXi host:
On ESXi hosts, you can use the vSphere Client or the vSphere CLI command vicfg-syslog to configure the following options:
- Log file path: Specifies a datastore path to the file syslogd logs all messages.
- Remote host: Specifies a remote host to which syslog messages are forwarded. In order to receive the forwarded syslog messages, your remote host must have a syslog service installed.
- Remote port: Specifies the port used by the remote host to receive syslog messages.
To configure syslog using vSphere CLI command :
For more information on vicfg-syslog, refer the vSphere Command-Line Interface Installation and Reference Guide.
To configure syslog using vSphere Client:
-
In the vSphere Client inventory, click on the host.
-
Click the Configuration tab.
-
Click Advanced Settings under Software.
-
Select Syslog in the tree control.
-
In the Syslog.Local.DatastorePath text box, enter the datastore path to the file where syslog will log messages. If no path is specified, the default path is /var/log/messages.
The datastore path format is [<datastorename>] </path/to/file> where the path is relative to the root of the volume backing the datastore.
Example: The datastore path [storage1] var/log/messages maps to the path / vmfs/volumes/storage1/var/log/messages.
-
In the Syslog.Remote.Hostname text box, enter the name of the remote host where syslog data will be forwarded. If no value is specified, no data is forwarded.
-
In the Syslog.Remote.Port text box, enter the port on the remote host where syslog data will be forwarded. By default Syslog.Remote.Port is set to 514, the default UDP port used by syslog. Changes to Syslog.Remote.Port only take effect if Syslog.Remote.Hostname is configured.
-
Click OK.
Configuring the Syslog on Cisco Switches
-
Login to the switch.
-
Go to the config mode.
-
Do the below configuration to configure the switch (here, we have used Catalyst 2900) to send the logs to the EventLog Analyzer server:
<Catalyst2900># config terminal
<Catalyst2900>(config)# logging <EventLog Analyzer IP>
For the latest catalyst switches
Catalyst6500(config)# set logging <EventLog Analyzer IP>
We can also configure other options like logging facility , trap notifications, etc. .. as
Catalyst6500(config)# logging facility local7
Catalyst6500(config)# logging trap notifications
|
Note: The same commands are also applicable for Cisco Routers.
Please refer Cisco® documentation for detailed steps on configuring syslog in the respective routers or switches. Contact eventlog-support@manageengine.com if the syslog format of your cisco devices are different from the standard syslog format supported by EventLog Analyzer. |

