
How to view syslog messages
Last updated on:In this page
What is a syslog viewer?
A syslog viewer is a tool used to read, filter, and interpret syslog messages generated by network devices, servers, and applications. These syslogs capture crucial system activities such as login attempts, kernel errors, service restarts, and network configuration changes. While you can view syslogs as plain text files, they’re often unstructured and difficult to analyze. A syslog viewer transforms this data into a readable and actionable format, making it easier to identify errors, monitor real-time events, and trace security incidents.
Syslog viewers can be:
- Command-line based, for on-system log inspection using tools like tail, less, or grep.
- GUI-based, offering graphical dashboards for easier analysis.
- Web-based, enabling centralized monitoring of syslogs across distributed or hybrid environments.
How to view syslogs in Linux using built-in tools
Linux systems store their log files under the /var/log/ directory. Depending on your distribution, you’ll find logs such as:
- /var/log/syslog — General system activity logs
- /var/log/messages — System and kernel messages (RHEL/CentOS)
- /var/log/auth.log — Authentication and authorization logs
- /var/log/kern.log — Kernel-related logs
You can view these logs using tools like cat, less, grep, or tail -f for real-time monitoring.
What if log files are empty or missing?
Sometimes, you may find these log files empty or not present at all. This usually indicates that the syslog daemon isn't installed, running, or properly configured. Popular syslog daemons include rsyslog, systemd-journald, and syslog-ng, and they must be enabled and configured to capture system events. To check whether rsyslog is running, use:
sudo systemctl status rsyslog
Most log files in /var/log/ require root privileges to read. If you receive Permission denied errors, prefix your commands with sudo.
If the service is not active, you’ll need to start or configure it to begin capturing logs. For detailed steps on configuring the syslog daemon, refer to our rsyslog configuration guide.
1. Using tail - Displays the last few lines of a log file and updates them in real time.
Syntax:
sudo tail -f /var/log/syslog
Use case: Ideal for monitoring live updates, such as service restarts or failed login attempts.
Each log entry typically includes:
- Timestamp: Event date and time (e.g., Nov 15 10:25:41)
- Hostname: System from which the message originated
- Facility and severity: Encoded in the message priority value; not always displayed in text logs
- Process info: Name and PID (e.g., sshd[1234])
- Message: Event description (e.g., Failed password for root.)
2. Using less - Lets you navigate large log files page by page.
Syntax:
sudo less /var/log/syslog
3. Using grep – Filters log entries based on specific keywords or patterns.
Syntax:
sudo grep "error" /var/log/syslog
You can use regular expressions (regex) to refine searches:
Syntax:
sudo grep -E "failed|denied|timeout" /var/log/syslog
4. journalctl – Displays logs collected by the systemd journal.
Syntax:
sudo journalctl -xe
To view logs for a specific service:
Syntax:
sudo journalctl -u sshd.service
5. Using dmesg - Displays kernel ring buffer messages.
Syntax:
sudo dmesg -T | tail -50
The -T flag shows human-readable timestamps. Use this for hardware errors, driver issues, or boot problems.
Note on systemd-journald: Modern Linux distributions (Ubuntu 16.04+, RHEL 7+, Debian 8+) use systemd-journald as the primary logging mechanism. The journal stores logs in binary format, which journalctl reads. Traditional text files in /var/log/ are often populated by rsyslog forwarding from journald. If journalctl shows logs but /var/log/syslog is empty, your system may be configured to use only the journal.
These commands are lightweight, built into all major Linux distributions, and ideal for quick troubleshooting on individual servers but become limited when managing multiple devices or high log volumes.
The log output from these commands typically follows the syslog format defined in RFC 5424, which includes fields like priority, facility, timestamp, and message content. Curious about these codes? Check out our guide on Syslog formats.
GUI-based Syslog viewers
GUI-based Syslog viewers provide a graphical interface for viewing and analyzing syslog messages without relying solely on command-line tools. They are ideal for sysadmins who prefer visual dashboards, interactive filtering options and real-time charts.
Unlike plain text editors, GUI-based Syslog viewers help you:
- View logs by severity or source using intuitive filters and color-coded displays.
- Search and highlight keywords or patterns in large volumes of syslogs.
- Drill down into specific events to identify the root cause of an issue.
- Export logs and reports in formats such as CSV, PDF, or HTML for compliance or documentation.
Popular GUI-based Syslog viewers examples include:
- Kiwi Syslog Server: A Windows-based GUI syslog viewer that provides real-time syslog monitoring and alerting.
- Paessler PRTG Network Monitor: A comprehensive GUI-based tool that collects and displays syslog data alongside network performance metrics, and provides customizable sensors, alerts for centralized monitoring.
- ManageEngine EventLog Analyzer: The solution includes an advanced graphical console that displays syslog trends, and event distributions with built-in dashboards and reports.
Explore our curated list of popular tools for centralizing and analyzing syslogs in real time.
Web-based Syslog viewers
Web-based Syslog viewers provide a browser-accessible interface for centralized log management across distributed environments. Instead of installing separate tools on each system, administrators can log in from any browser to view, search, and analyze syslogs in real time.
Advantages of web-based Syslog viewers include:
- Centralized log collection: Collect and view syslogs from Linux, Windows, and network devices from a single dashboard.
- Multi-user collaboration: Multiple admins can simultaneously access and investigate events.
- Cloud support: Monitor syslogs from both on-premises and cloud workloads.
- Role-based access control (RBAC): Ensure secure access to logs based on user roles and responsibilities.
- Data visualization: Use interactive charts and widgets to visualize event frequency, source activity, and log severity distribution.
These syslog viewers often include APIs and cloud integrations, making them suitable for organizations running workloads on AWS, Azure, or hybrid cloud infrastructures. Web-based syslog viewers such as ManageEngine EventLog Analyzer enable real-time monitoring, alerting, and forensic analysis.
Syslog viewing techniques
Once you've chosen a syslog viewer, these techniques help you work with log data more effectively.
Real-time Syslog viewing
Real-time Syslog viewing helps you detect and respond to incidents as they happen. Instead of manually checking logs after an issue occurs, real-time tools continuously stream incoming messages letting you instantly spot failed SSH logins, service crashes, or configuration changes. Utilities like tail -f can monitor real time logs but dedicated syslog viewers provide centralized dashboards, alerts, and search filters for quicker insight. Real-time syslog viewer helps you to:
- Detect security breaches and unauthorized access attempts.
- Track system resource usage and performance bottlenecks.
- Receive instant alerts on critical events.
With EventLog Analyzer, you can monitor syslog data in real time across your entire IT infrastructure. Its integrated syslog viewer provides live dashboards, advanced correlation, and instant alerts, helping you identify threats early, minimize downtime, and strengthen overall network security.
Filtering and searching Syslog effectively
When handling large volumes of syslog data, effective filtering and searching are crucial for identifying critical events, minimizing noise, and improving incident response time. By using filters, regular expressions (regex), and pattern highlighting, you can quickly locate logs that matter most to your investigation.
1. Use filters to narrow down log data
Syslog messages often come from multiple devices such as servers, routers, firewalls, or applications, which can quickly overwhelm you with data. Filtering helps you focus on the events that are truly relevant.
- Filter by severity: Display only logs of a particular severity level (e.g., warning, error, or critical) or from a specific service.
- Filter by source or hostname: Focus on logs from a specific device or IP address.
- Filter by time range: Analyze logs within a defined timeframe to correlate events that occurred during an outage or security incident.
Applying filters in your syslog viewer helps eliminate unnecessary noise, allowing you to focus on actionable insights instead of raw log streams.
2. Search using regular expressions (regex)
Regex-based searches enable advanced pattern matching within unstructured syslog data. Instead of searching for fixed keywords, you can create flexible search patterns to detect variations in error messages, usernames, or IP addresses. For example, to find all failed SSH login attempts:
Syntax:
grep -E "Failed password for .* from" /var/log/auth.log
Regex searches are particularly useful for uncovering recurring errors, anomalies, or security events that might otherwise go unnoticed in large log files.
3. Highlight patterns for quick identification
Most syslog viewers support highlighting specific keywords or patterns, such as “error,” “failed,” or “timeout”, to make frequent issues stand out visually. This feature speeds up log analysis, enabling you to spot problems and security anomalies at a glance.
4. Understand structured vs. unstructured logs
- Structured logs: These logs (for example, JSON-formatted logs) are easier to parse and filter since fields like timestamp, hostname, and severity are predefined.
- Unstructured logs: These are free-form text logs that require regex or text-based filters to extract useful information. While they offer flexibility, they demand more effort to analyze and correlate.
ManageEngine EventLog Analyzer automatically parse structured and unstructured logs, support advanced search queries, and provide visualization capabilities that help you identify critical trends faster.
Best Syslog viewer tools for different platforms
Syslog management requirements vary across environments, whether you’re running Linux servers, UNIX systems, or network devices. Choosing the right syslog viewer helps centralize and analyze logs efficiently. For enterprise use, ManageEngine EventLog Analyzer stands out as one of the most comprehensive syslog viewers available. It collects and correlates syslogs in real time, enabling you to monitor system activity and detect potential issues proactively.
Other syslog viewers include Kiwi syslog server, Syslog watcher, and Graylog. While these tools offer solid performance for basic log viewing and collection, EventLog Analyzer provides a more integrated, compliance-driven approach with built-in analytics and correlation features that go beyond simple log aggregation.
Experience advanced syslog viewing with EventLog Analyzer
Looking for a unified platform to simplify syslog management across Linux, UNIX, and network devices? Get started with ManageEngine EventLog Analyzer today!
How does EventLog Analyzer help in viewing and analyzing syslog?
ManageEngine EventLog Analyzer simplifies syslog management by providing a centralized platform to collect, view, and analyze syslog data from Linux, Unix, and network devices in real time. The solution supports both UDP and TCP syslog protocols, ensuring reliable log collection from diverse sources, including routers, switches, firewalls, and servers. Instead of toggling between terminal sessions across multiple servers, EventLog Analyzer consolidates syslog data from your entire infrastructure into a single searchable interface.
From command line to visual analysis:
- Unified view: Aggregate syslogs from Linux, Unix, routers, firewalls, and switches without SSH hopping between systems.
- Pre-built parsers: Once the syslog messages are received, EventLog Analyzer automatically parses and categorizes them based on fields such as timestamp, severity, and source, making it easier to interpret large volumes of data.
- Instant filtering: Apply filters based on attributes like device IP, log severity, facility, or keywords, enabling instant isolation of relevant events and faster root-cause analysis during investigations.
- Live tail with context: View syslogs in real time with contextual metadata attached, helping you detect and troubleshoot issues the moment they occur similar to tailing logs on the terminal, but with actionable insights.
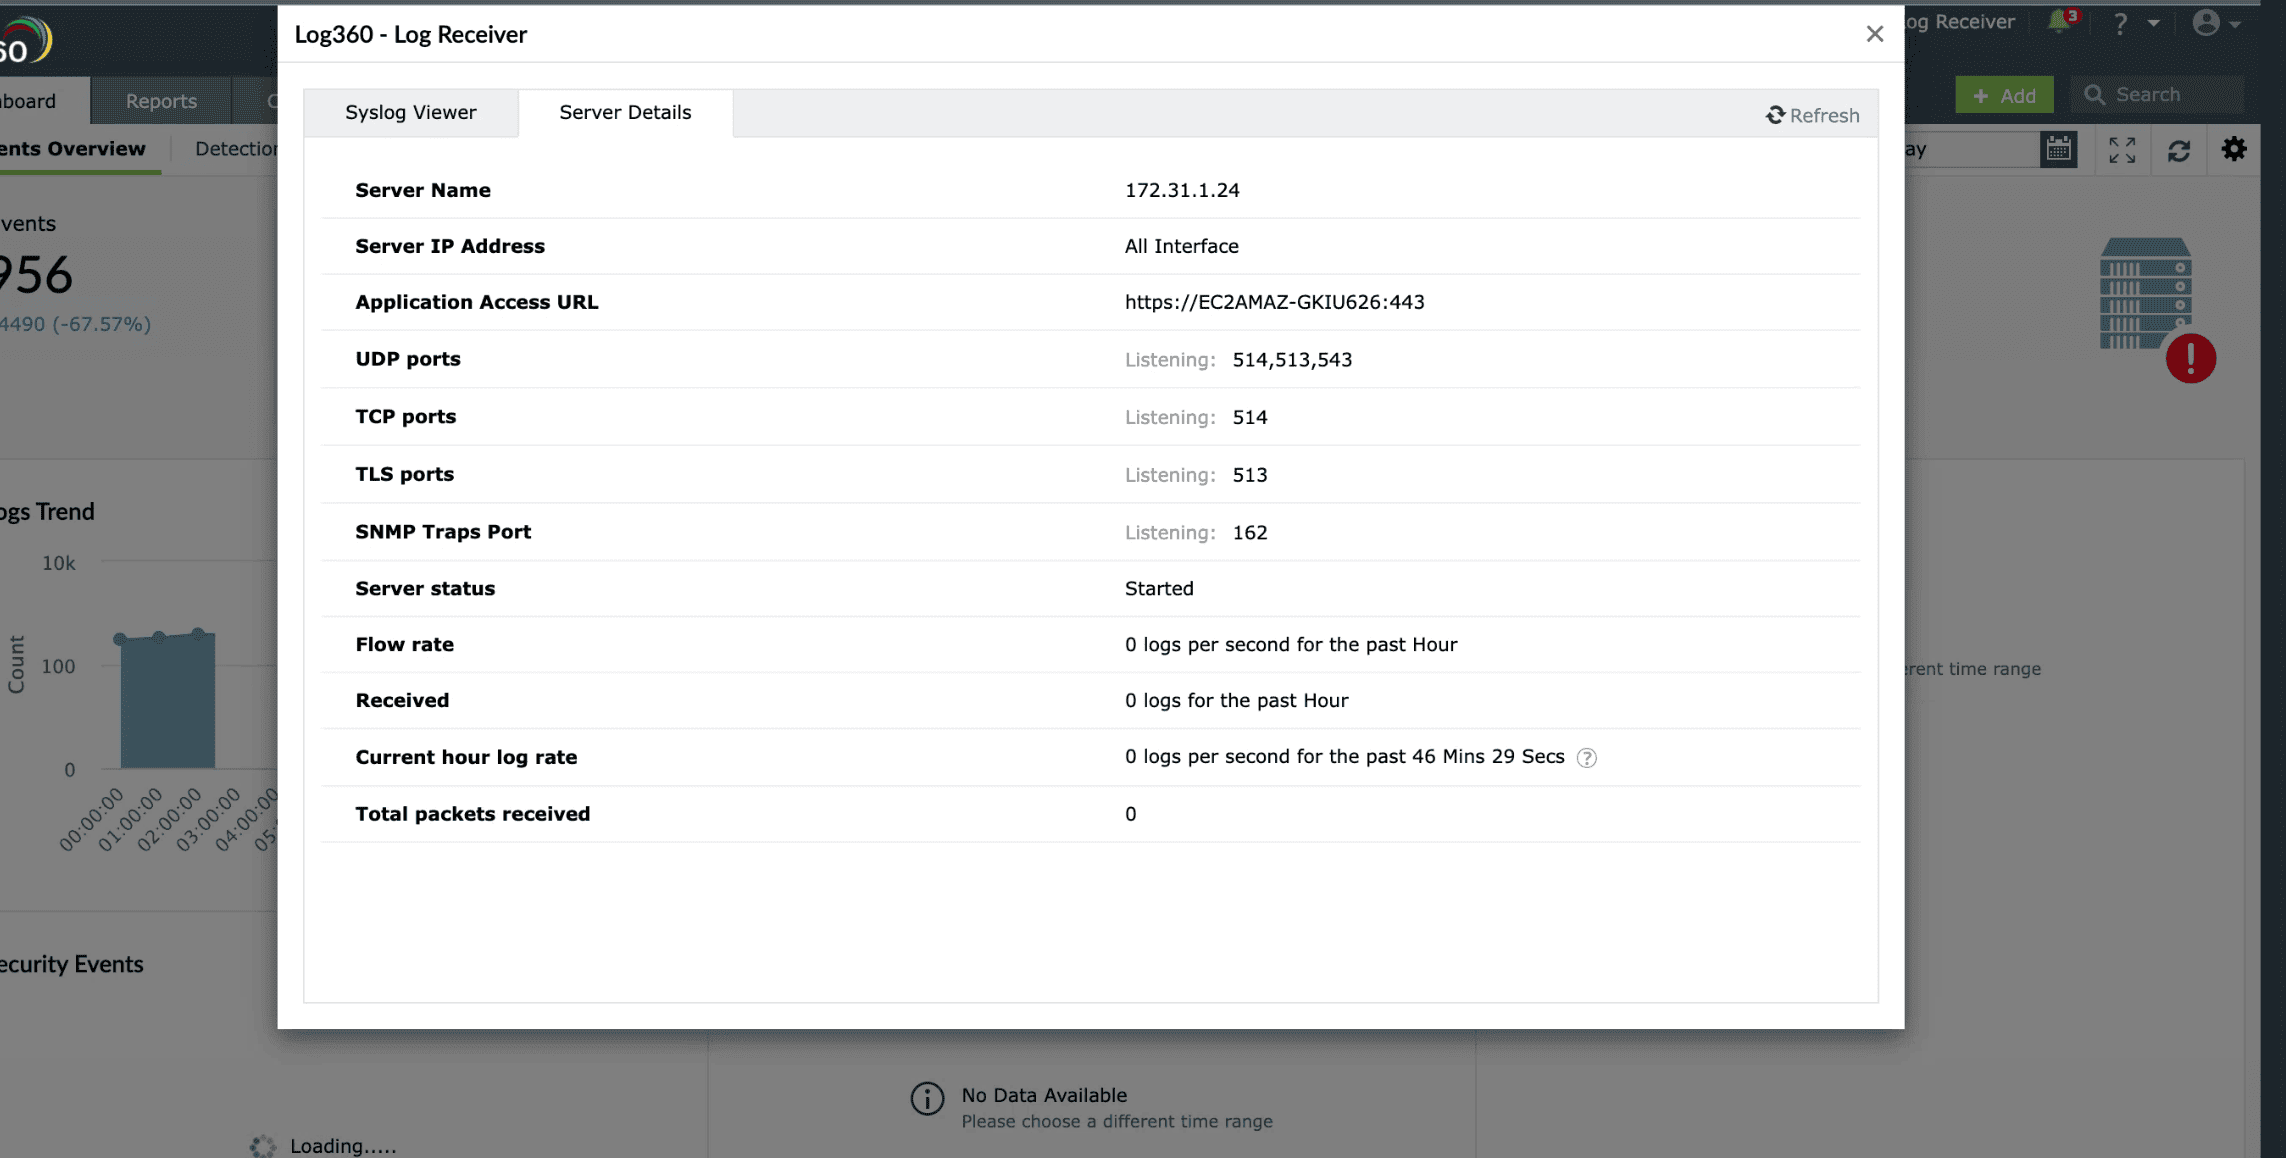
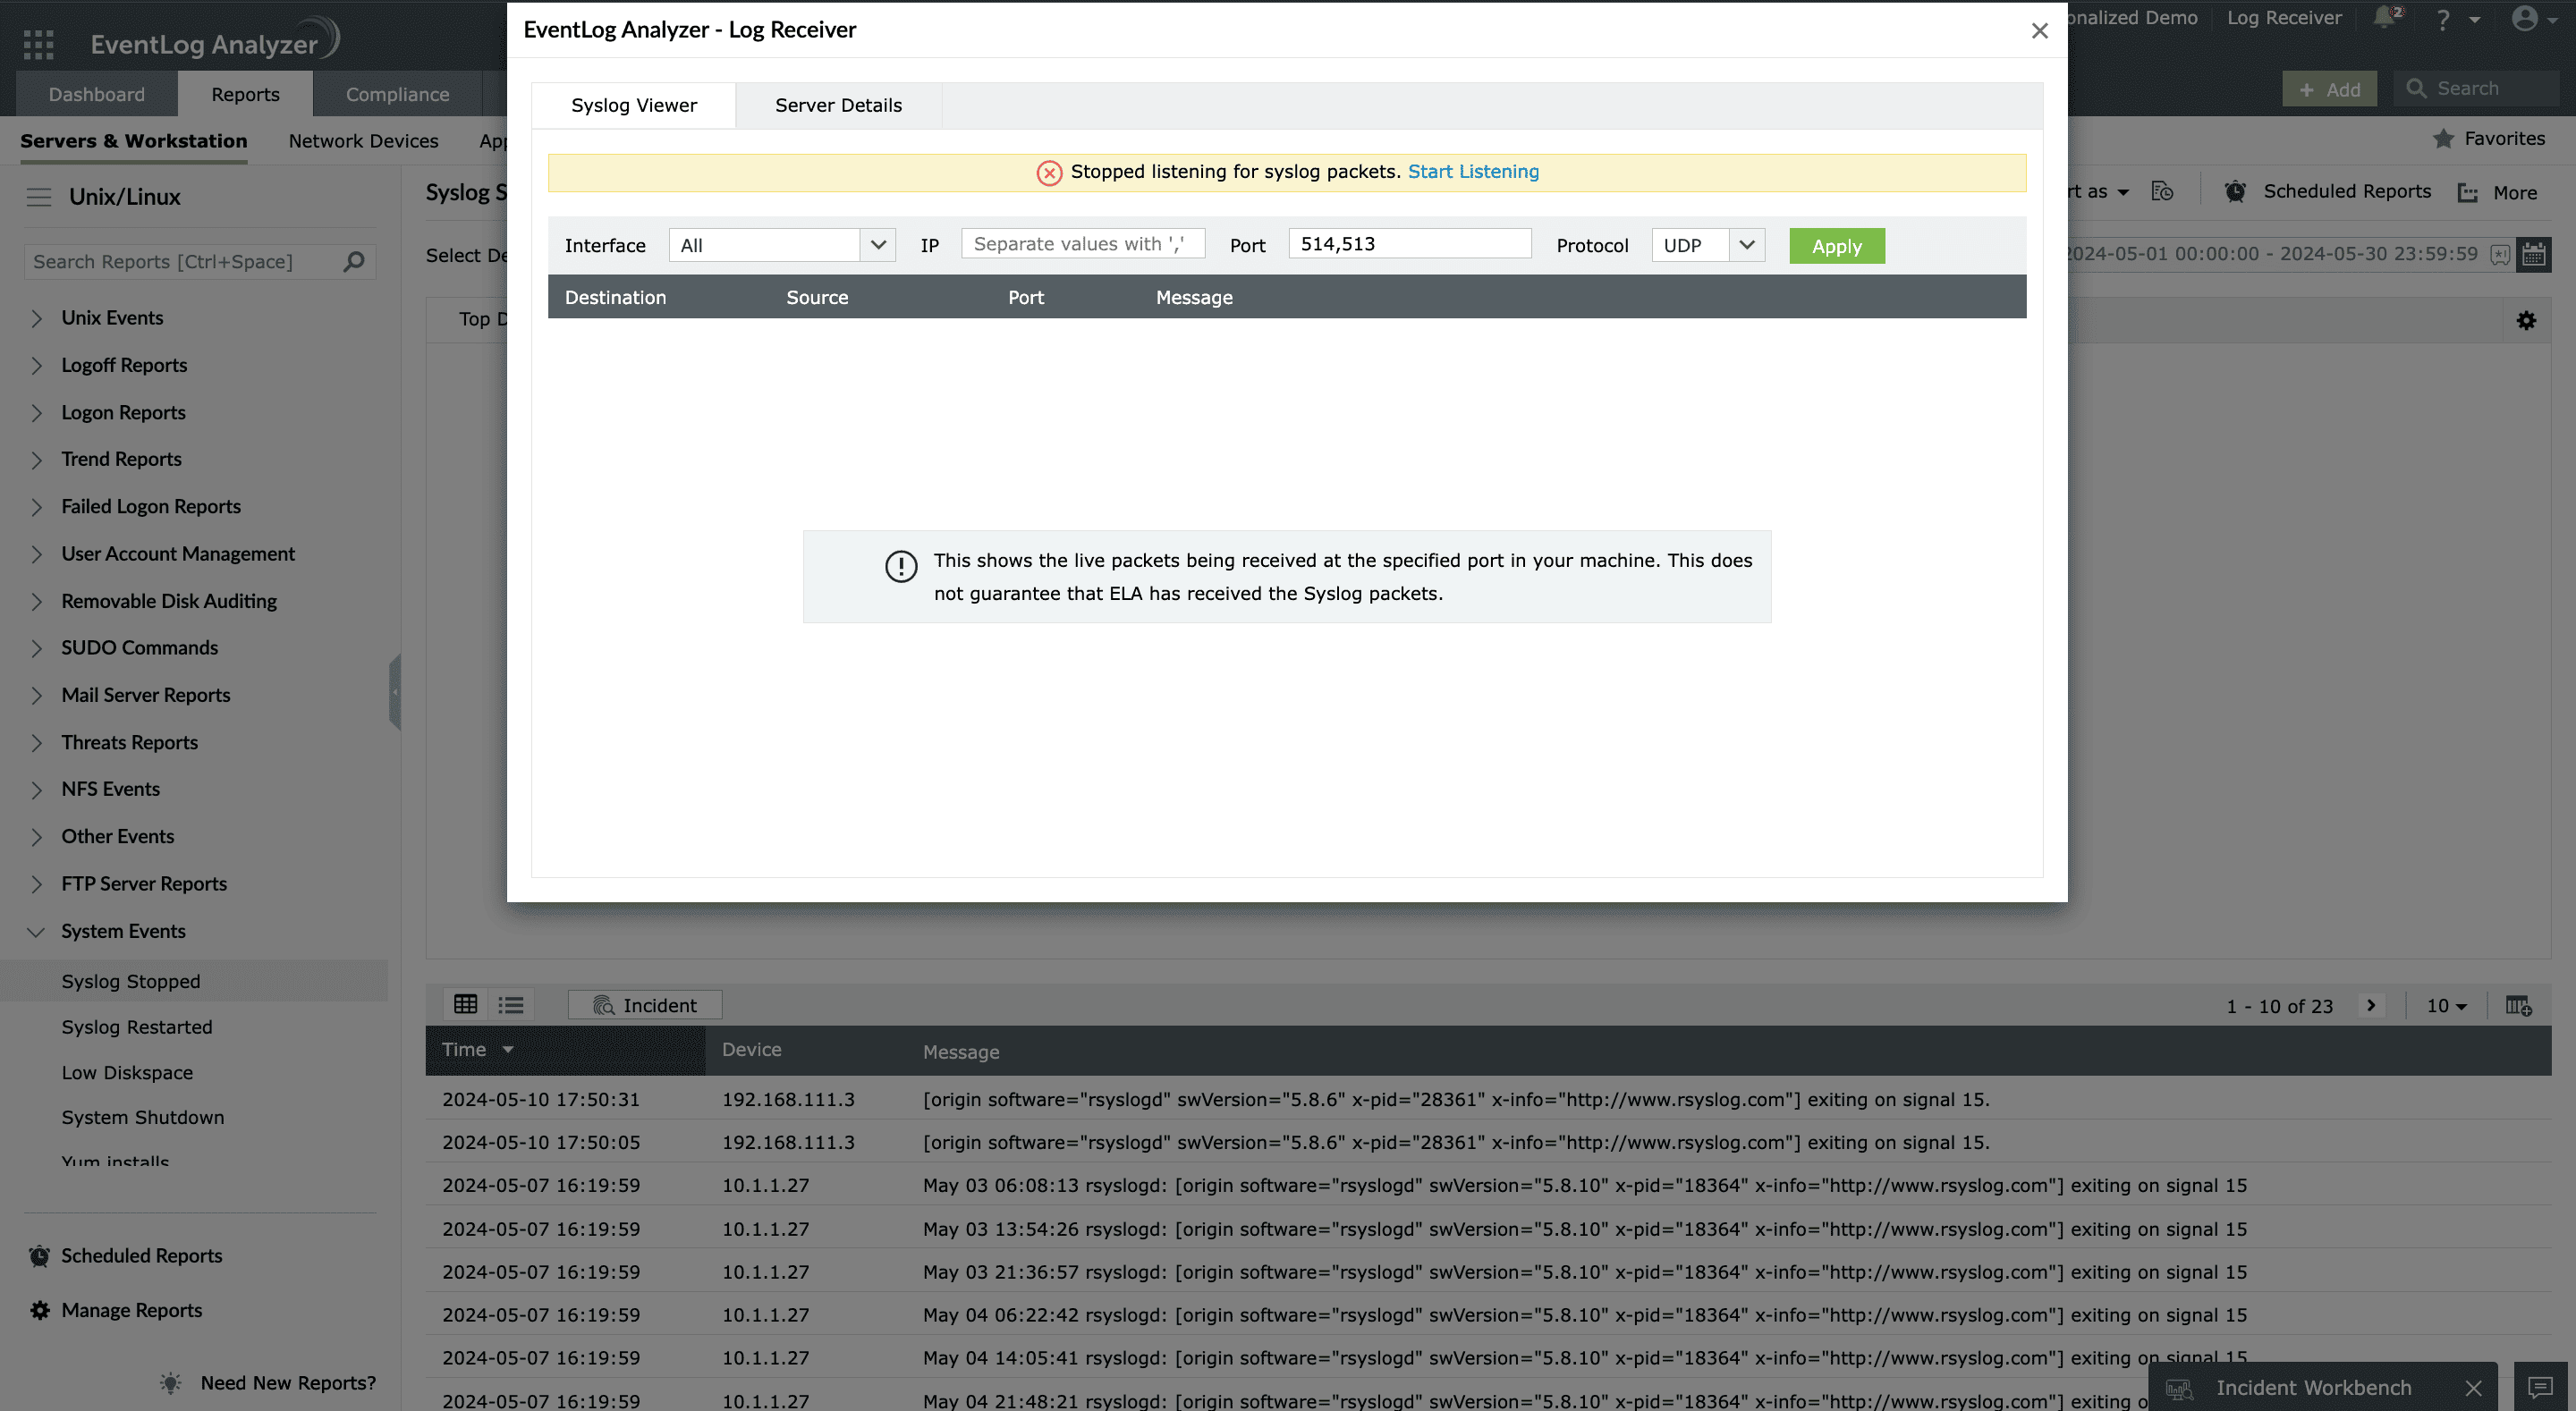
Syslog receiver:
EventLog Analyzer includes a built-in syslog receiver that listens for incoming syslog messages over UDP/TCP and captures them in real time, providing a central point to receive logs from network devices, servers, and security systems without needing additional configuration or external collectors. You can track the flow rate, packets received, and the message load here.
Go beyond basic viewing:
- Instant search: Find specific events in seconds using keywords, fields, logical operators, or device criteria, eliminating the need for manual grep or command-line filtering.
- Suspicious activity detection: By correlating syslogs and applying behavioral analytics, EventLog Analyzer detects anomalies such as repeated failed logins, unusual access patterns, privilege abuses, and configuration changes that may indicate security incidents.
- Compliance mapping: Syslog events are automatically mapped to major regulatory frameworks including PCI DSS, SOX, GDPR, and HIPAA making it easier to generate audit-ready evidence and demonstrate compliance during assessments.
EventLog Analyzer's intuitive dashboards and built-in reporting make it ideal for enterprises seeking visibility, scalability, and regulatory compliance in one solution.
FAQs
A syslog viewer helps sysadmin read, filter, and analyze syslog messages generated by servers, network devices, and applications. Instead of manually parsing text files, a syslog viewer organizes and displays logs with filters, color-coded severity levels, and real-time alerts.This helps sysadmins quickly identify errors, detect security incidents, and ensure system stability.
Syslog is the standard logging protocol used in Linux and network devices to collect and transmit system messages. Event Viewer, on the other hand, is a Windows-based GUI tool that displays application, security, and system logs generated by Windows operating systems.
Syslog files are typically stored in the /var/log/ directory. The common log files include:
- /var/log/syslog – General system logs.
- /var/log/auth.log – Authentication and login-related logs.
- /var/log/kern.log – Kernel-related logs.
- /var/log/messages – System-wide messages.
The exact location may vary depending on the Linux distribution and syslog daemon (rsyslog, syslog-ng, or journald).
Windows systems do not use syslog natively. Instead, they store events in the Windows Event Viewer. You can access it by running: eventvwr.msc. However, if your environment uses a syslog server, tools like EventLog Analyzer can collect and display Windows logs alongside syslog data from Linux and network devices in a single console.
To open a log file in Linux, use any text viewer or command-line tool such as:
Syntax:
cat /path/to/logfile
less /path/to/logfile
tail -f /path/to/logfile
These commands let you read log entries or monitor them in real time. For advanced log analysis and centralized viewing, use a syslog management tool like EventLog Analyzer.
What's next?
Interested in knowing more about how EventLog Analyzer can help you view, analyze, and archive syslog data across your IT environment? Explore our solution with a 30-day free trail.
