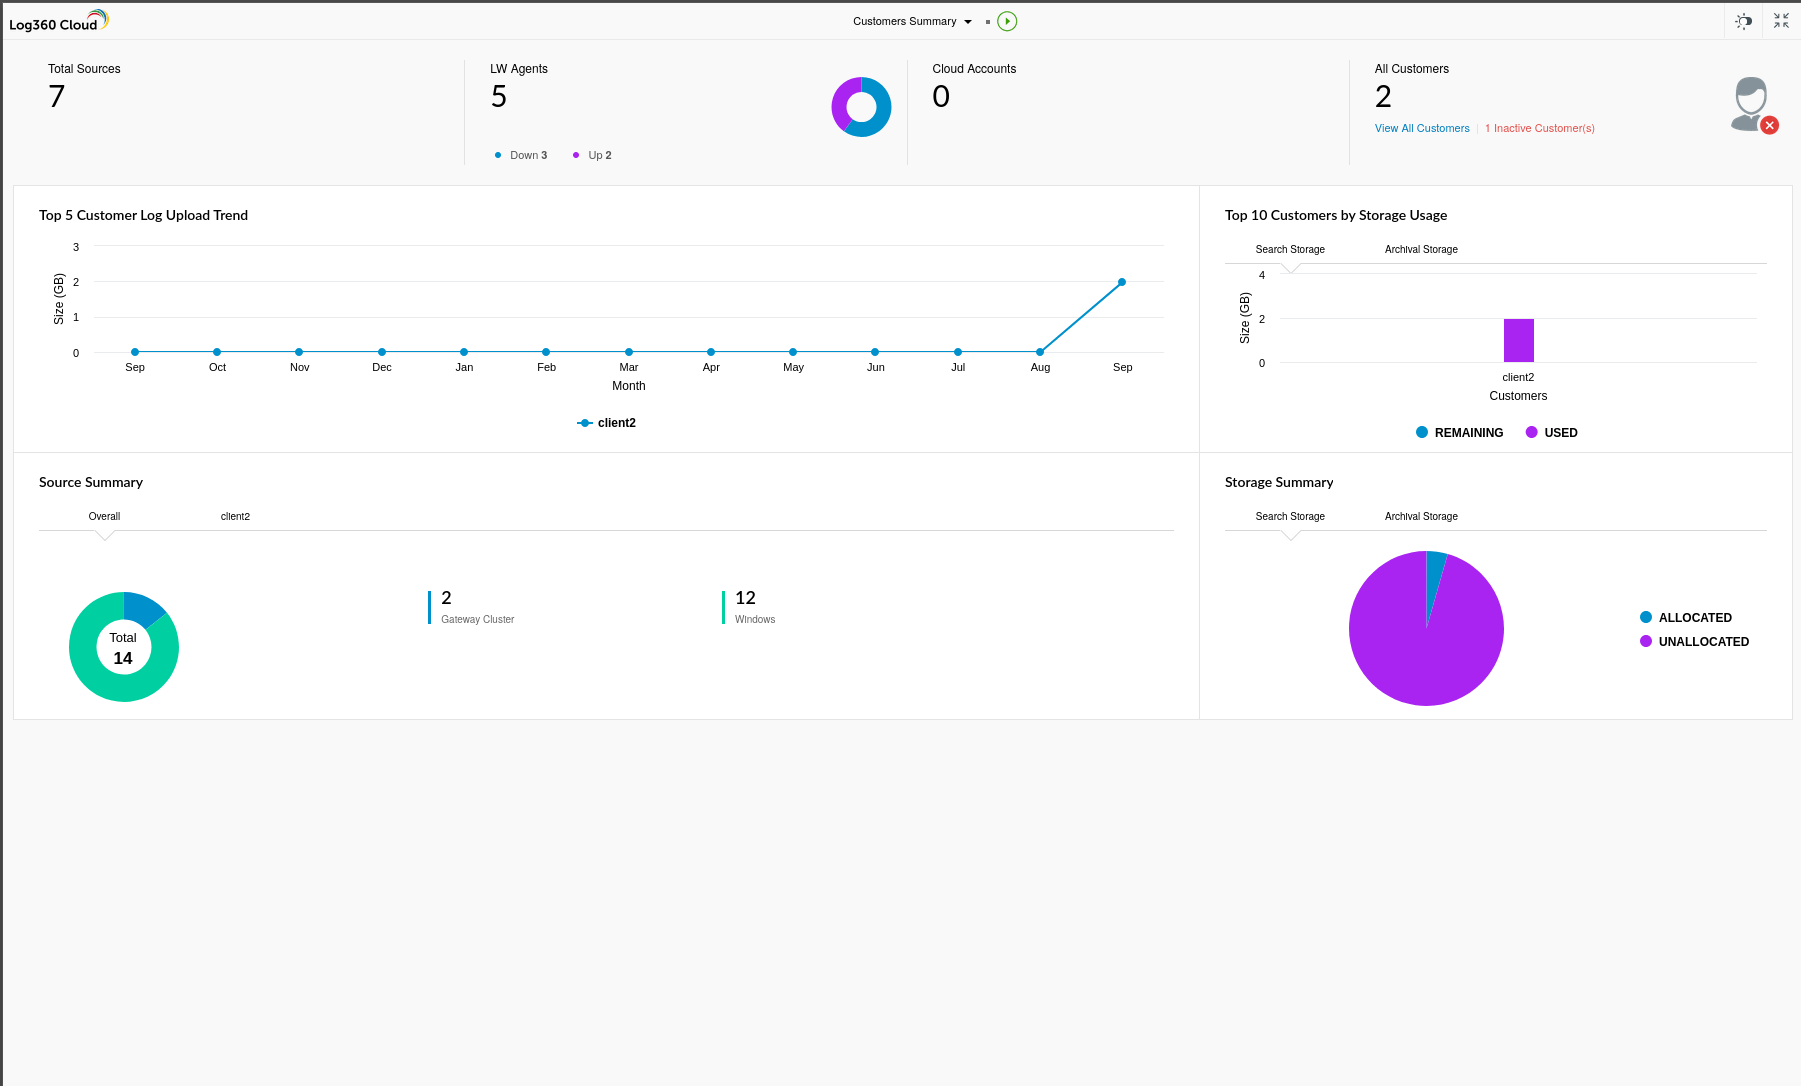
Log360 Cloud MSSP edition provides a near real-time dashboard that provides resource allocation and usage data of all the Customers at a glance. This dashboard is accessible only to the Admin by default.
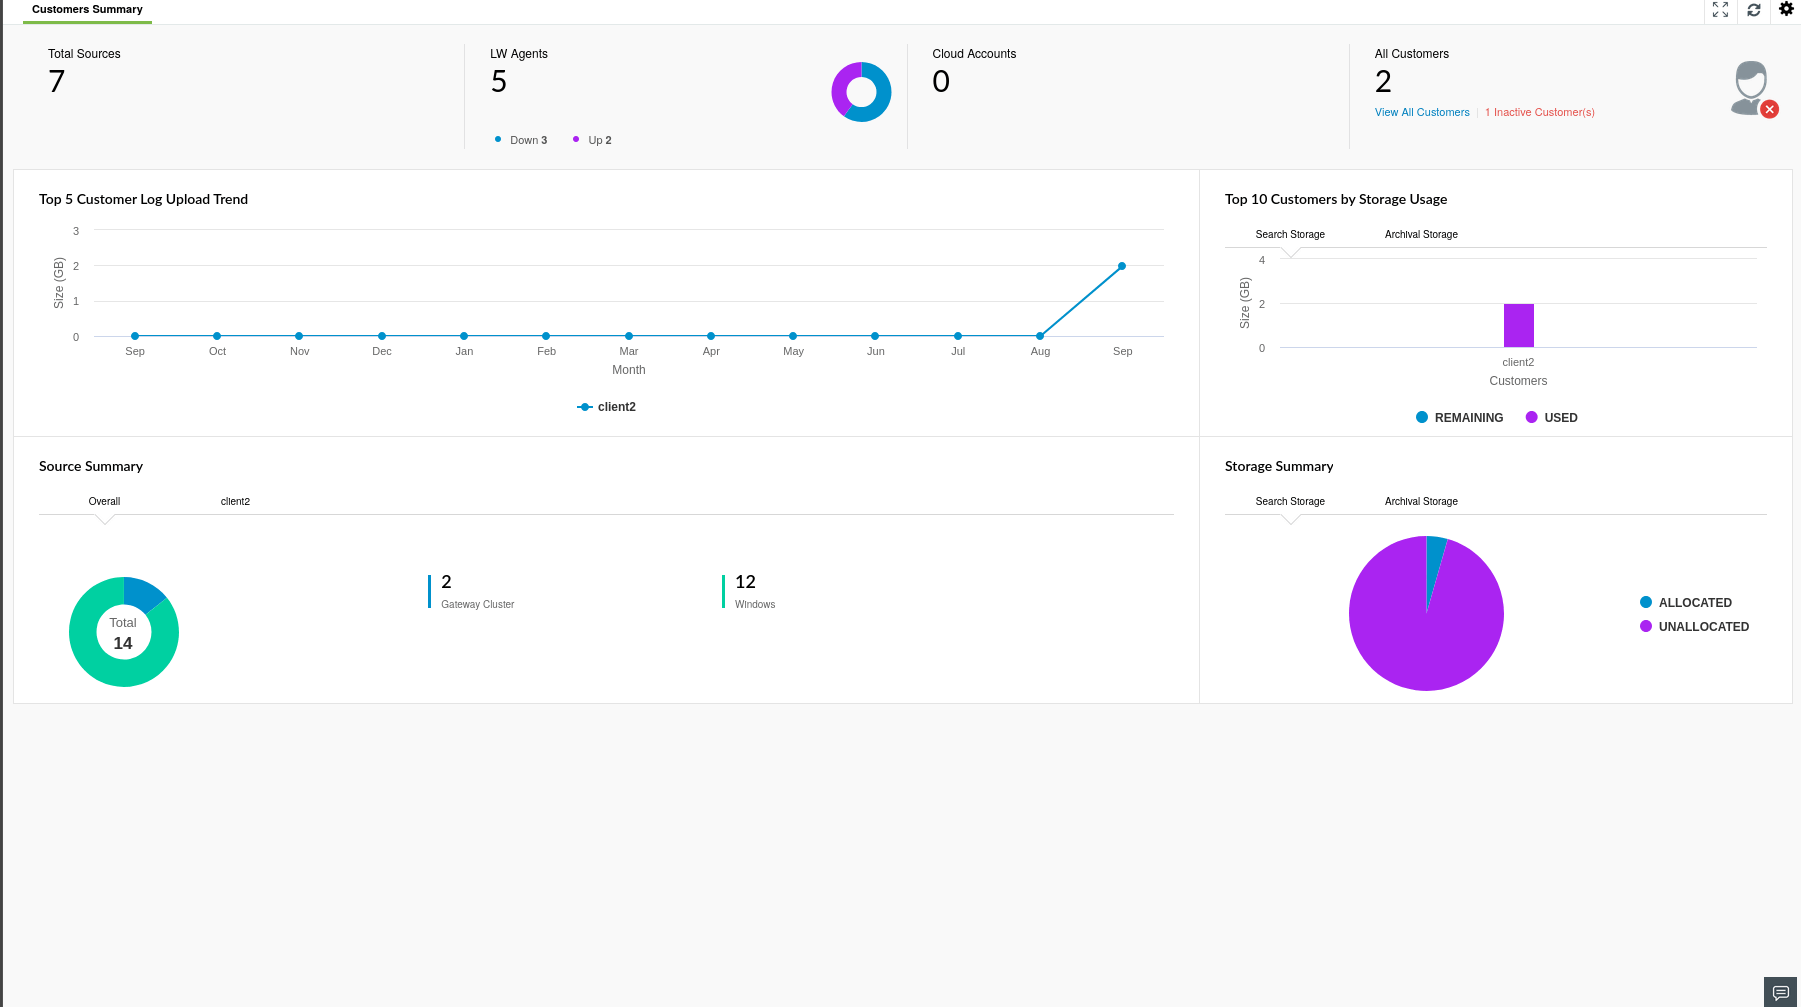
The widgets on this dashboard are as explained below:
| Widget Name | Widget function |
|---|---|
| Top panel |
Total sources: Total number of log sources for all Customers combined. LW agents: Total number of lightweight agents deployed across all customer environments. Cloud accounts: Total number of cloud sources configured across customer environments. All Customers: Displays the total number of Customers. The View All Customers option lets you view the list of all Customers. |
| Top 5 customer Log Upload Trend | This widget showcases the monthly logging trends of all Customers. The x-axis represents the time range. The y-axis represents the volume of log data uploaded by each customer in GB. Each customer is represented by a different color in the line graph. |
| Source Summary | This widget shows the number and type of log sources from each customer environment. |
| Storage Summary | Shows the unallocated and allocated percentage of the total storage space. |
| Storage used by Customers (Top 10, in the order of usage) | Shows the amount of used and allocated storage for individual Customers. |
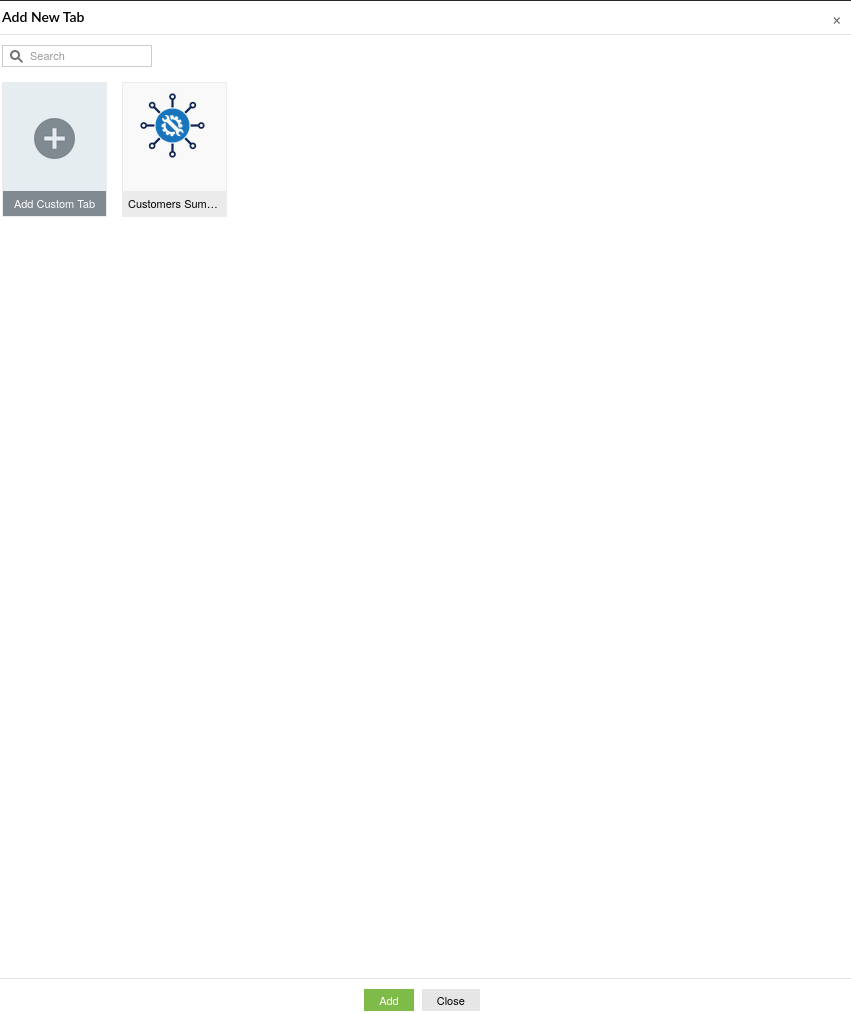
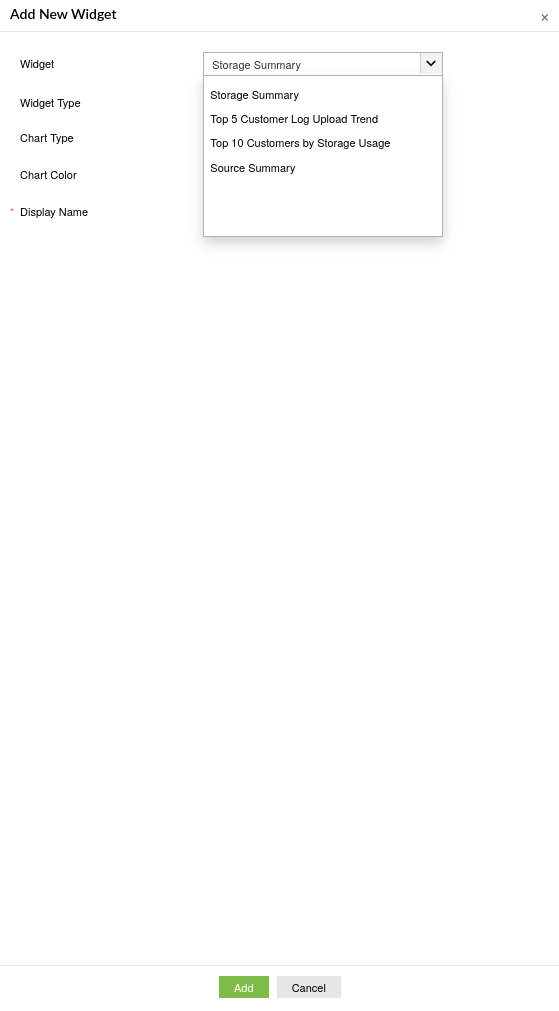
To customize the dashboard, you have the following options:
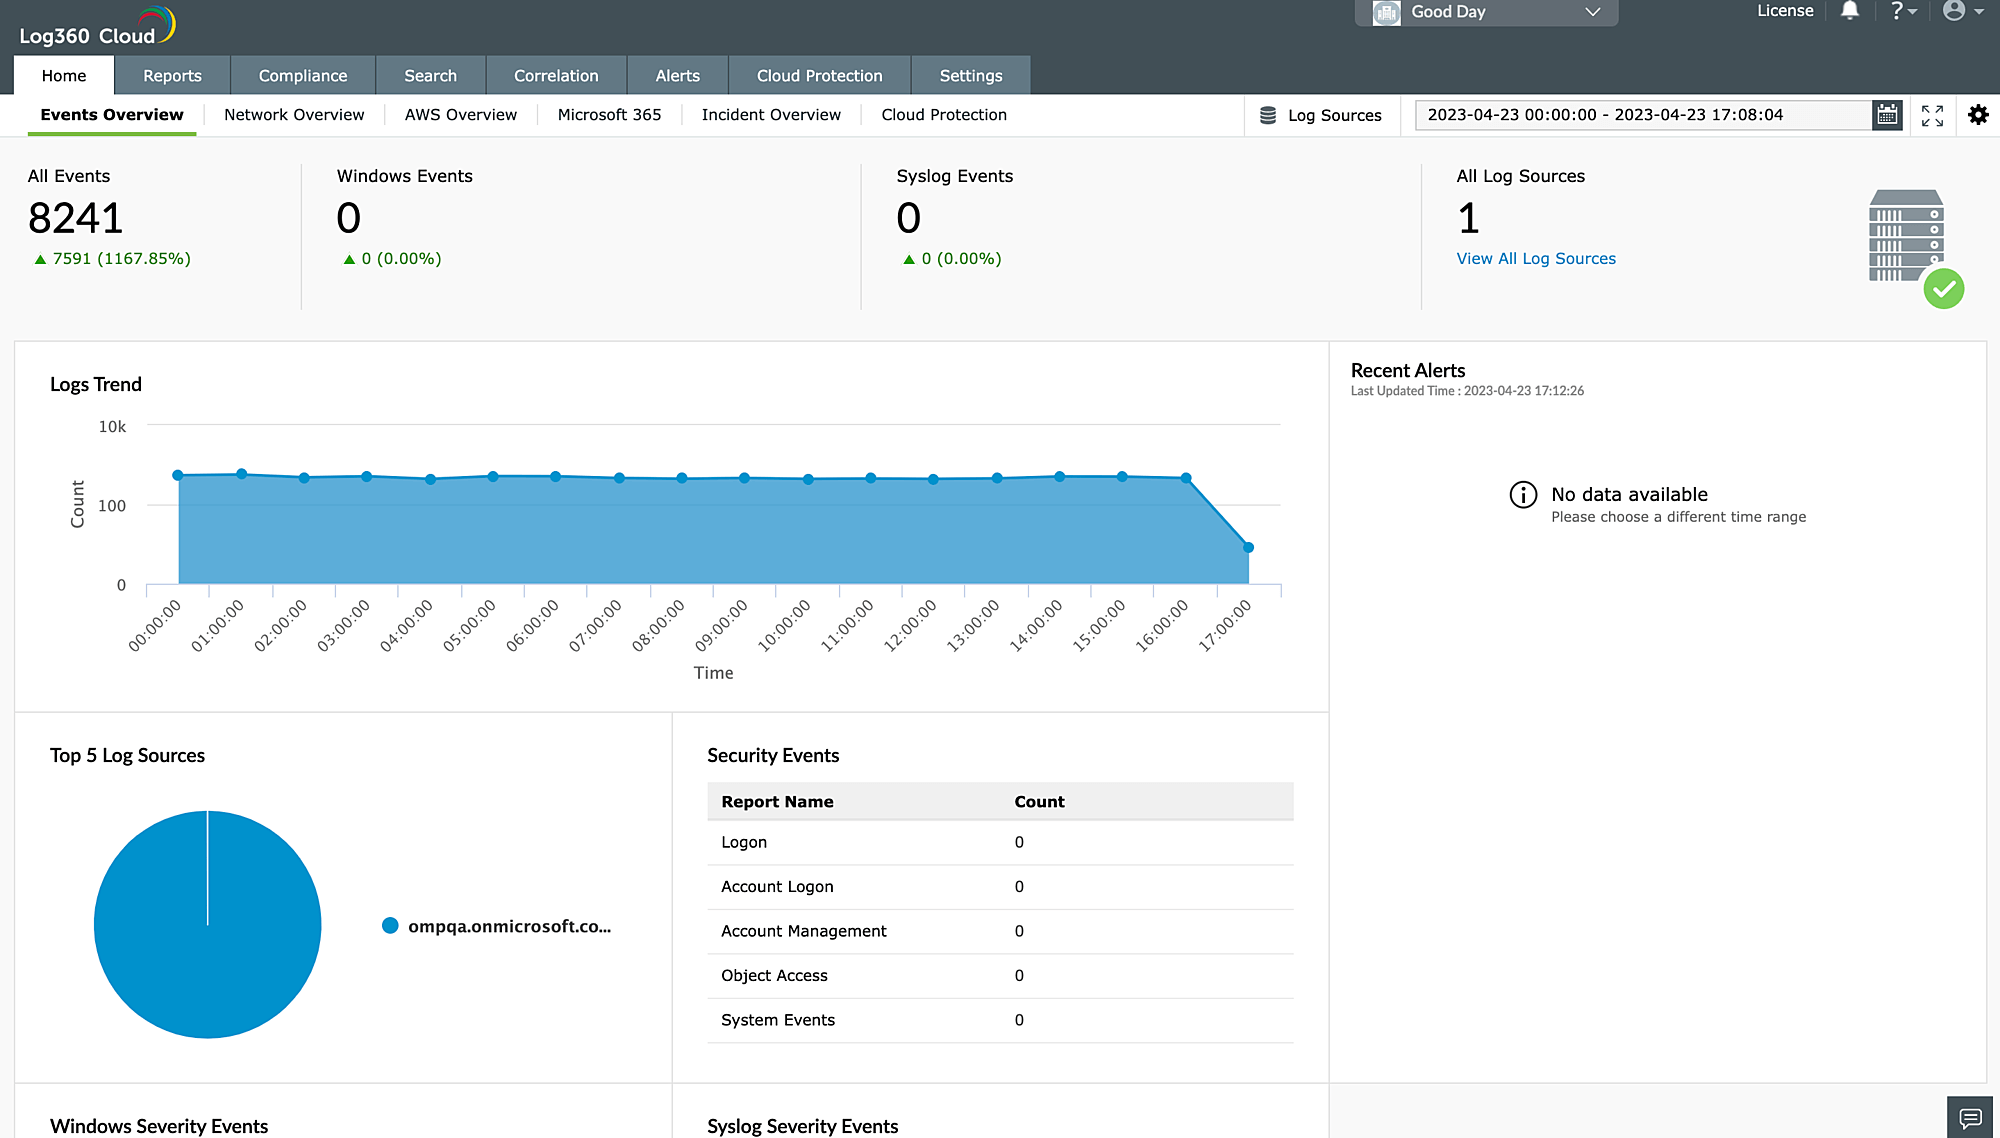
Every MSSP customer has a near real-time dashboard that presents security data in the form of graphs and charts. The dashboard helps you discern anomalies quickly, investigate threats and attack patterns, and get insights from log trends.
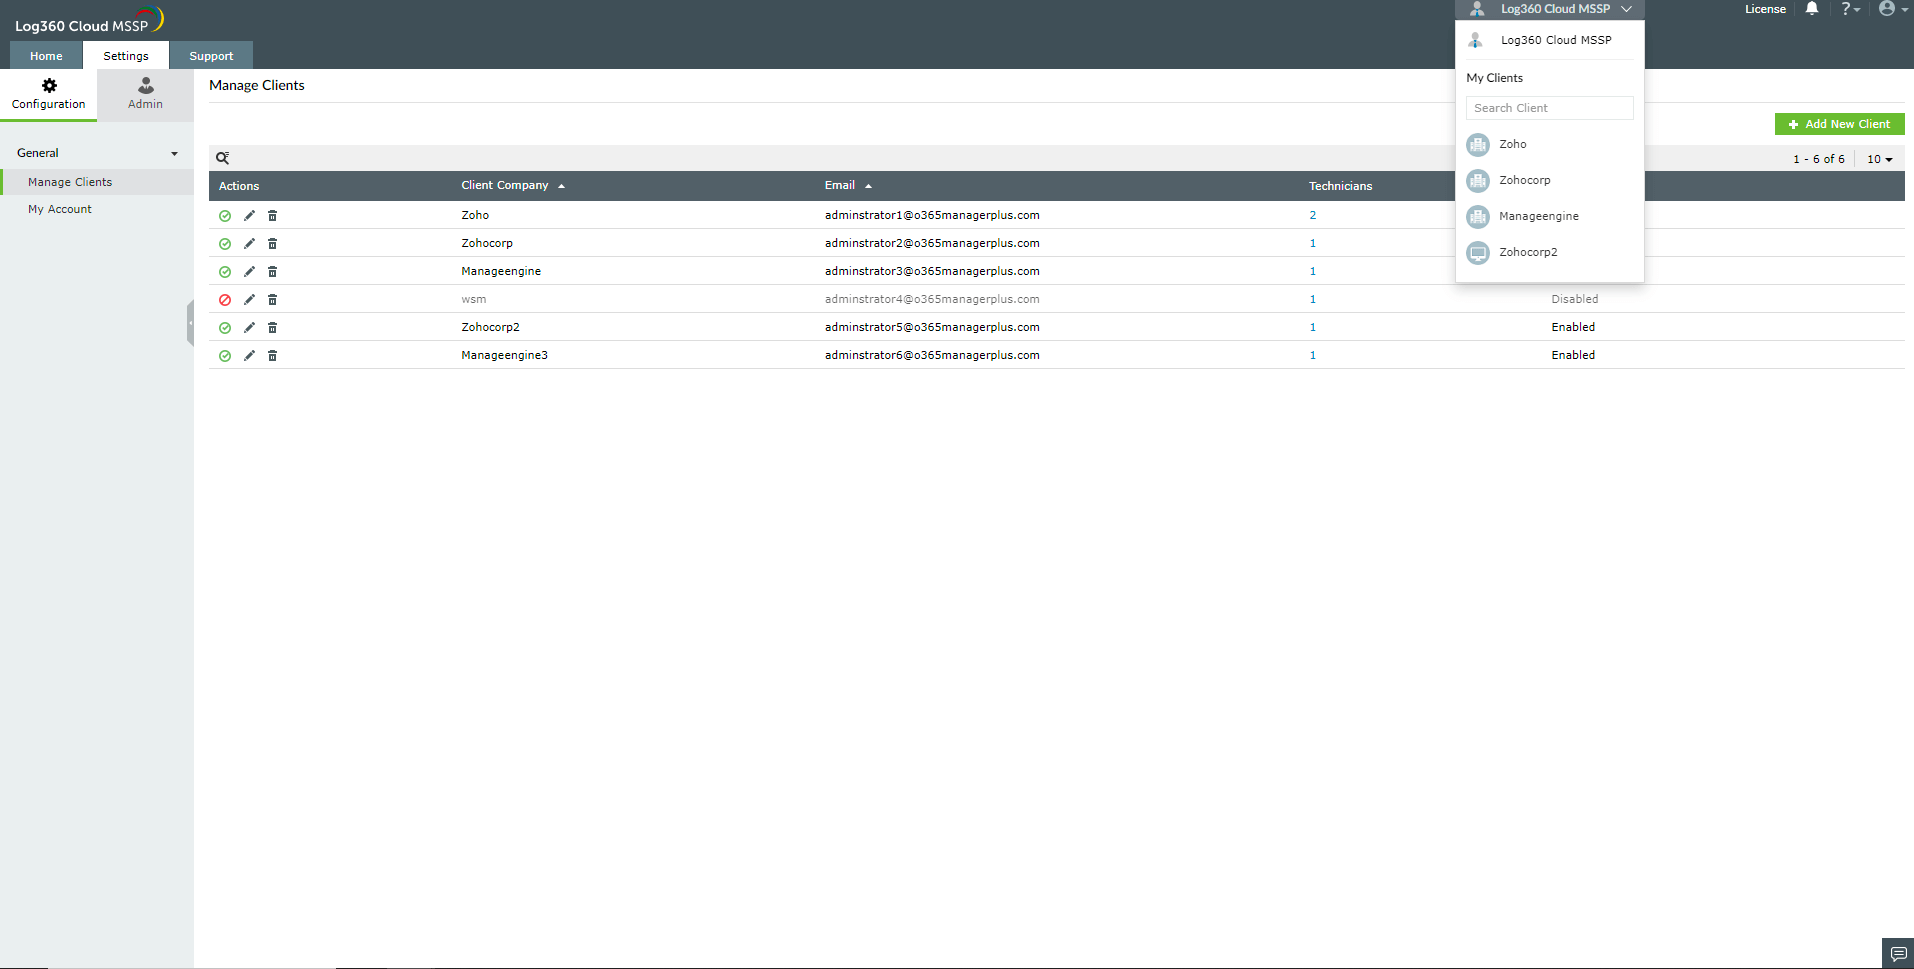
To navigate to the Customer Dashboard, click on Log360 Cloud MSSP dropdown on the top grey panel and choose the customer you want to view, as shown in the image below.
This dashboard is accessible only to technicians who have permission to view the customer data. Since it is customizable, the technician can add widgets to monitor parameters specific to the customer requirements.