An end-to-end monitoring tool for all your Microsoft applications.
Microsoft applications form the core of most organizations' IT infrastructure, which is why it's critical to focus on monitoring the entire Microsoft stack. That means monitoring all business-critical apps in physical, virtual, cloud, and hybrid environments. With Applications Manager, you can ensure complete visibility over your Microsoft environment and deliver unparalleled performance.
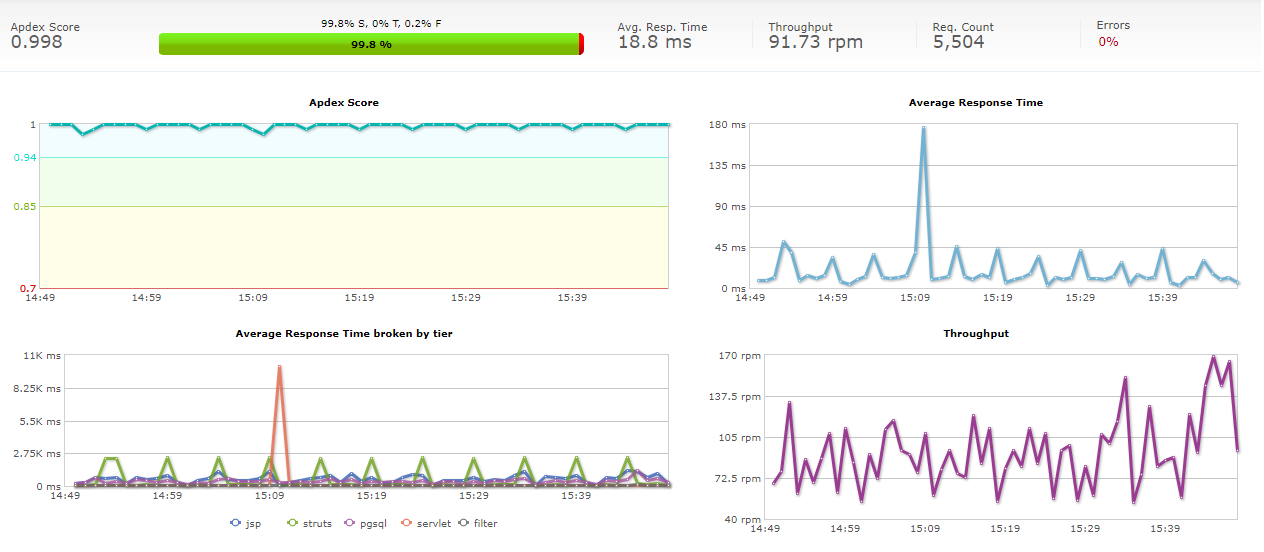
Monitor the performance of all tiers of your complex .NET web applications, from end-user interactions to database calls, with Applications Manager's APM Insight. Dig into transactions to view exception stack traces and SQL queries for slow or failed requests. Troubleshoot code latencies and pinpoint the root cause of issues. Identify time-consuming transactions, slow database calls, database usage, and more using detailed graphs, and gauge the overallexperience of your users when they interact with your apps. Learn more.
Get complete insight into key performance metrics on CLRs, URLs, SQL queries, and so on. Understand the health of your CLR by monitoring important metrics like response time, throughput, garbage collection time, memory usage, and disk I/O.
Applications Manager provides broad support for Microsoft Azure services, including Azure Service Bus, Azure Virtual Machines, Azure Storage, AzureCloud Services, and Azure SQL Database. Get an aerial view of all virtual machines within your Azure environment and track their operational status and health. Automatically discover application topologies and visualize application dependencies in the cloud with ease. Drill down into IT relationships and map them effortlessly to identify faults and troubleshoot faster. Track key metrics like throughput statistics of queues, relay topics, established connections, blocked queries, and CPU read/writes. Learn more.
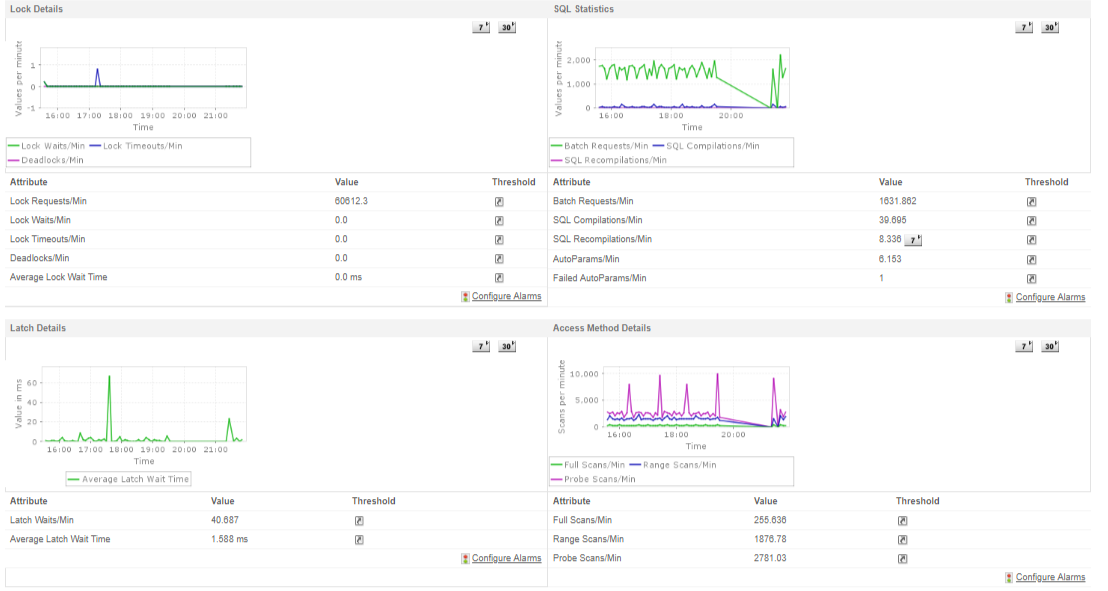
Visualize and monitor MS SQL database farms with ease using the SQL monitor. Connect to the database source and monitor various metrics like table column values, memory usage, connection statistics, scheduled jobs, access details, and replication topology. Get notified when there are issues and troubleshoot them quickly. Learn more.