The toughest challenges in network performance monitoring aren’t solved by just adding more alerts or tweaking thresholds. They stem from deeper issues- like incomplete visibility across hybrid environments, steep learning curves for admins, blind spots in discovery and setup, alert noise that hides real incidents, weak integration with IT workflows, poor capacity planning, and the absence of predictive or automated responses. These roadblocks make it harder for teams to stay proactive and keep networks efficient.
Here are the challenges we’ll outline and the questions we’ll be answering:
- Achieving the 'right' amount of visibility for your organization
- Extended learning curve- IT personnel have to go through an extensive onboarding
- Getting discovery and setup right before monitoring even begins
- Overwhelming flood of alarms- there's lot of data, but little information!
- Slow correlation of alarms and incidents impacting remediation efforts
- Friction in integrating with the entire IT management ecosystem of the organization
- Improper tracking, planning and allocation of resource for optimum usage
- Lack of predictive and automation capabilities
- How can OpManager solve these challenges?
- More on network performance monitoring challenges
Achieving the 'right' amount of visibility for your organization
Defining what level of visibility truly matters is the first hurdle. Every organization draws that line differently, and the gaps left behind often cause bigger problems.
- Every IT environment defines “enough” visibility differently; some focus on device uptime/high availability, others on application paths or wireless coverage.
- Problems often arise when monitoring tools only scratch the surface: limited metrics, partial discovery in hybrid setups, or shallow visibility into WAN, wireless, or virtualized layers. These blind spots make troubleshooting and SLA commitments fragile.
- A mature NPM solution must cover availability, latency, QoS, capacity, and flows- while also tying metrics to business services and modern constructs like VMware, Hyper-V, Citrix, Nutanix, or Cisco ACI. Without that breadth, teams spend more time guessing than solving.
Extended learning curve- IT personnel have to go through an extensive onboarding
Network performance monitoring isn't plug and play. Getting people up to speed on a monitoring platform takes more than flipping a switch- without consistency and simplicity, the learning curve stretches uncomfortably long.
- Teams have to juggle multiple protocols like SNMP, WMI, CLI, and flows; understand different metrics and alert semantics; and constantly tune thresholds to avoid false alarms.
- When multiple monitoring tools are also added to the mix, context switching becomes a real burden, often slowing down incident response.
- Complexity only grows further with lack of standardization; consistent dashboards, templates and alert logic on single platform.
Getting discovery and setup right before monitoring even begins
Discovery is the foundation of network monitoring, but it’s also where many projects stumble.
- If credentials are missing or misapplied, devices will be invisible to any network monitoring solution. If SysOIDs or device categories are wrong, key metrics go unmonitored.
- Without a structured discovery process- starting with pre-loading the right credentials, ensuring SNMP/CLI/WMI access, applying fine-tuned templates for device categories, using automated rules to attach monitors and groups, and scheduling rediscovery to capture ongoing changes- the device inventory quickly becomes inaccurate. This leads to inefficient monitoring, blind spots, and false negatives that may linger until an outage forces attention.
Overwhelming flood of alarms- there's lot of data, but little information!
Dashboards drown in alerts, making it hard to distinguish real incidents from the clutter.
- Threshold fluctuating, duplicate alerts, and device-level warnings stack up quickly, hiding the real incident in a flood of noise.
- This results in alert fatigue, where IT teams face an overwhelming number of alarms and are left trying to interpret each one and decide what to prioritize. As a result, mean time to acknowledge (MTTA) and mean time to resolve (MTTR) nosedive.
Slow correlation of alarms and incidents impacting remediation efforts
When incidents strike, speed depends on connecting the dots quickly- but without correlation, related signals remain scattered.
- A spike in CPU, interface errors, a recent configuration change, and event logs may all point to the same root issue, but only if the tool can connect them.
- Absence of correlation and context means IT teams will spend more time piecing signals and data points together like a puzzle before troubleshooting can even begin.
Friction in integrating with the entire IT management ecosystem of the organization
Monitoring becomes more valuable when it fits into broader IT workflows. Without integration, alerts remain stuck in the monitoring tool, slowing resolution.
- Alerts that are raised need to tie into incident and change workflows- creating ITSM tickets, updating CMDBs, reaching the right stakeholder etc.
- Absence of seamless integration will cause teams to fall into “swivel chair” operations, manually copying details between tools and slowing down response.
Improper tracking, planning and allocation of resource for optimum usage
Capacity shortfalls and congestion often trace back to poor planning and lack of traffic oversight.
- When storage and bandwidth resources aren’t properly tracked or allocated, networks end up running inefficiently.
- Poor storage capacity planning leads to sudden shortfalls, forcing teams into reactive firefighting when logs or performance data exceed limits.
- Similarly, without disciplined traffic shaping, a few heavy applications or spikes can choke links, causing slower response times for business-critical services. A lack of traffic pattern analysis- like spotting upper/lower spikes or sustained congestion- means bandwidth is wasted in some areas while starved in others.
- Over time, this inefficiency degrades performance, inflates costs and complicates capacity upgrades.
Lack of predictive and automation capabilities
Networks move faster than manual/traditional monitoring can handle, and without prediction or automation, teams are always reacting late.
- At scale, static dashboards and manual thresholds struggles to keep up with dynamic nature of networks, where problems surface before admins can even notice.
- Absence of predictive techniques hamper spotting anomalies early, anticipating saturation trends, and suggesting proactive optimizations.
- Lack of implementation of network automation for common problems only add to the already stacked responsibilities for the IT admin.
Can OpManager solve these challenges?
We've so far mapped all the hurdles, let's now sketch how OpManager closes those gaps through purpose-built capabiities that works together to blunt the sharpest edges.
Visibility with breadth
- OpManager collects and tracks thousands of performance metrics across nearly every corner of your IT infrastructure- routers, switches, firewalls, servers, virtual machines, wireless access points, storage arrays, and WAN links.
- It also supports major enterprise platforms like VMware, Hyper-V, Citrix, Nutanix, Exchange, and Active Directory, along with Cisco ACI for modern data center fabrics.
- IT teams can track real-time availability, health, and performance data in one place. Interface traffic, packet errors, and WAN conditions like latency or packet loss clearly so you don’t miss bottlenecks or hidden trouble spots.
- OpManager gives organizations the coverage they expect, across layers and environments, with the flexibility to focus on what matters most for their business priorities.
Network monitoring simplified and unified
One of the common struggles with NPM is the steep learning curve- too many tools, each with its own dashboards, alert styles, and workflows.
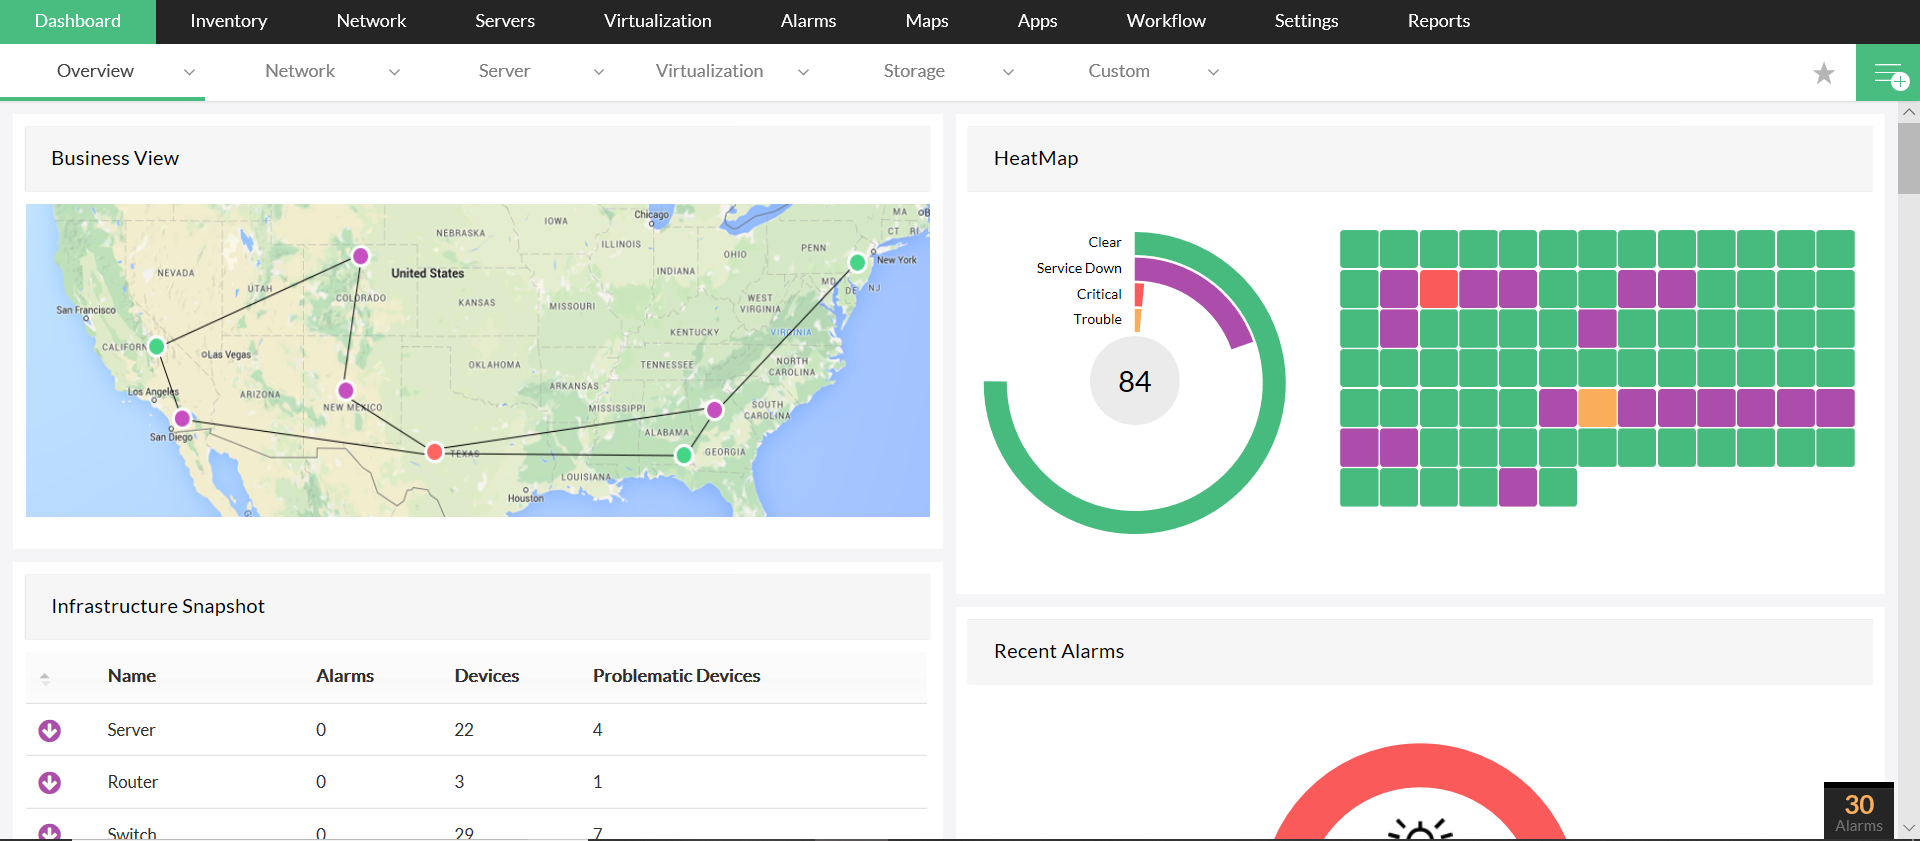
- OpManager reduces that burden by unifying dashboards and offering a consistent way to visualize health, traffic, and system performance.
- Instead of bouncing between consoles for network, server, and WAN insights, teams can stay inside one platform.
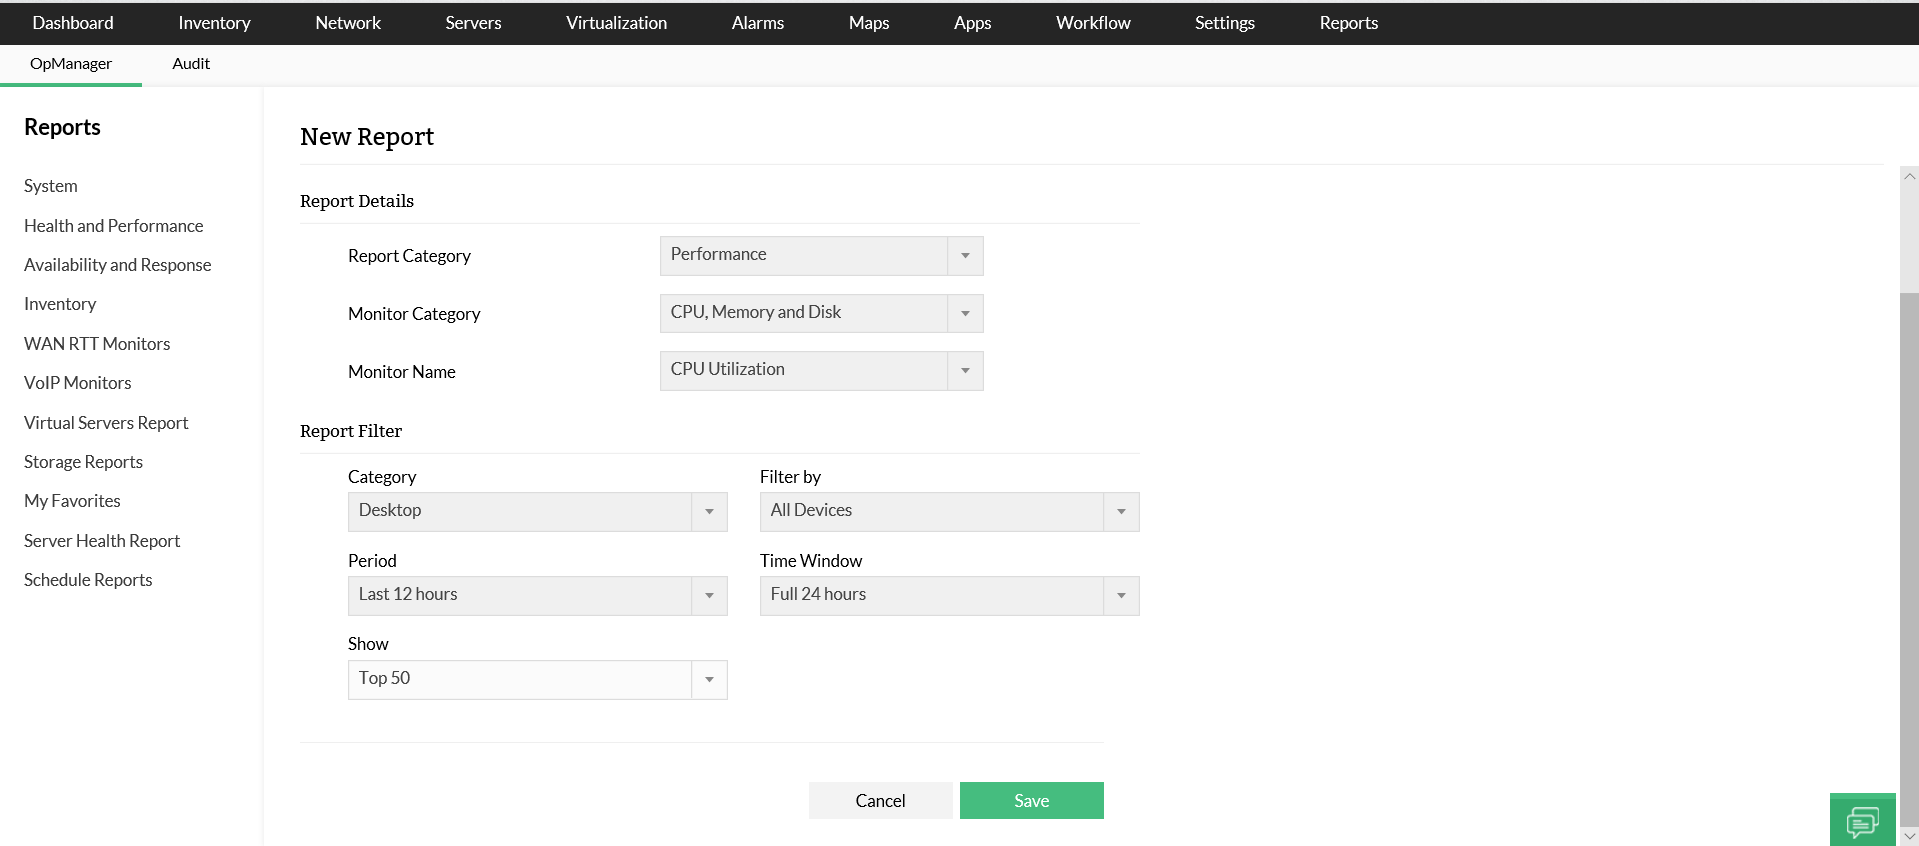
- Built-in reports and ready-to-use features (like availability charts, CPU/memory monitoring, and traffic analytics) help new operators learn the ropes quickly without getting bogged down in setup work.
- This translates to less context switching, fewer tools to juggle, and more confidence for operators.
Faster monitoring setup and configuration
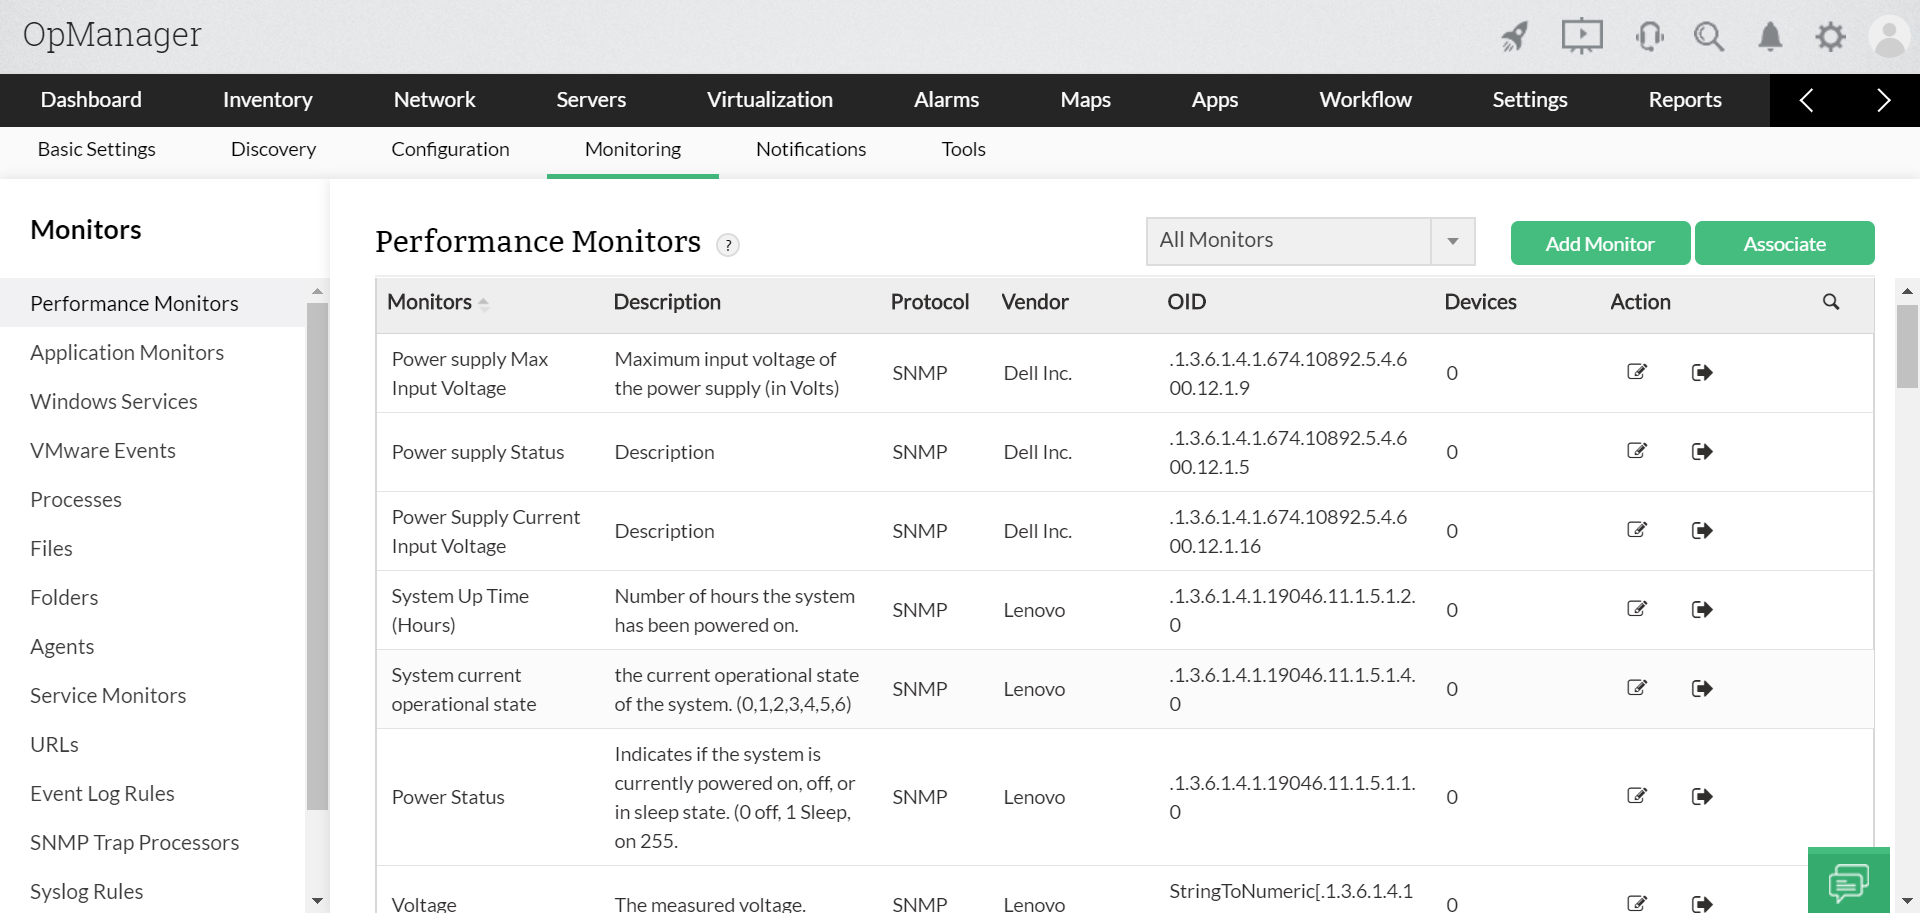
OpManager comes with over 11,000 device templates pre-loaded.
- Instead of starting from scratch, teams can apply these templates automatically during discovery.
- Credentials can also be pre-loaded and applied in bulk, while discovery rules classify devices correctly and attach monitors at scale.
- If a new device shows up, rediscovery updates it without manual intervention. This turns configuration into a predictable, repeatable process rather than a painful, device-by-device grind.
- For the IT teams, this means quicker setup, correct classification from the start, and reliable monitoring data without missing or misconfigured devices.
Alert noise reduction via correlation
Monitoring and alerting is meaningless if it just shows you duplicate notifications, threshold fluctuatuons, and device-level noise that buries the real issue.
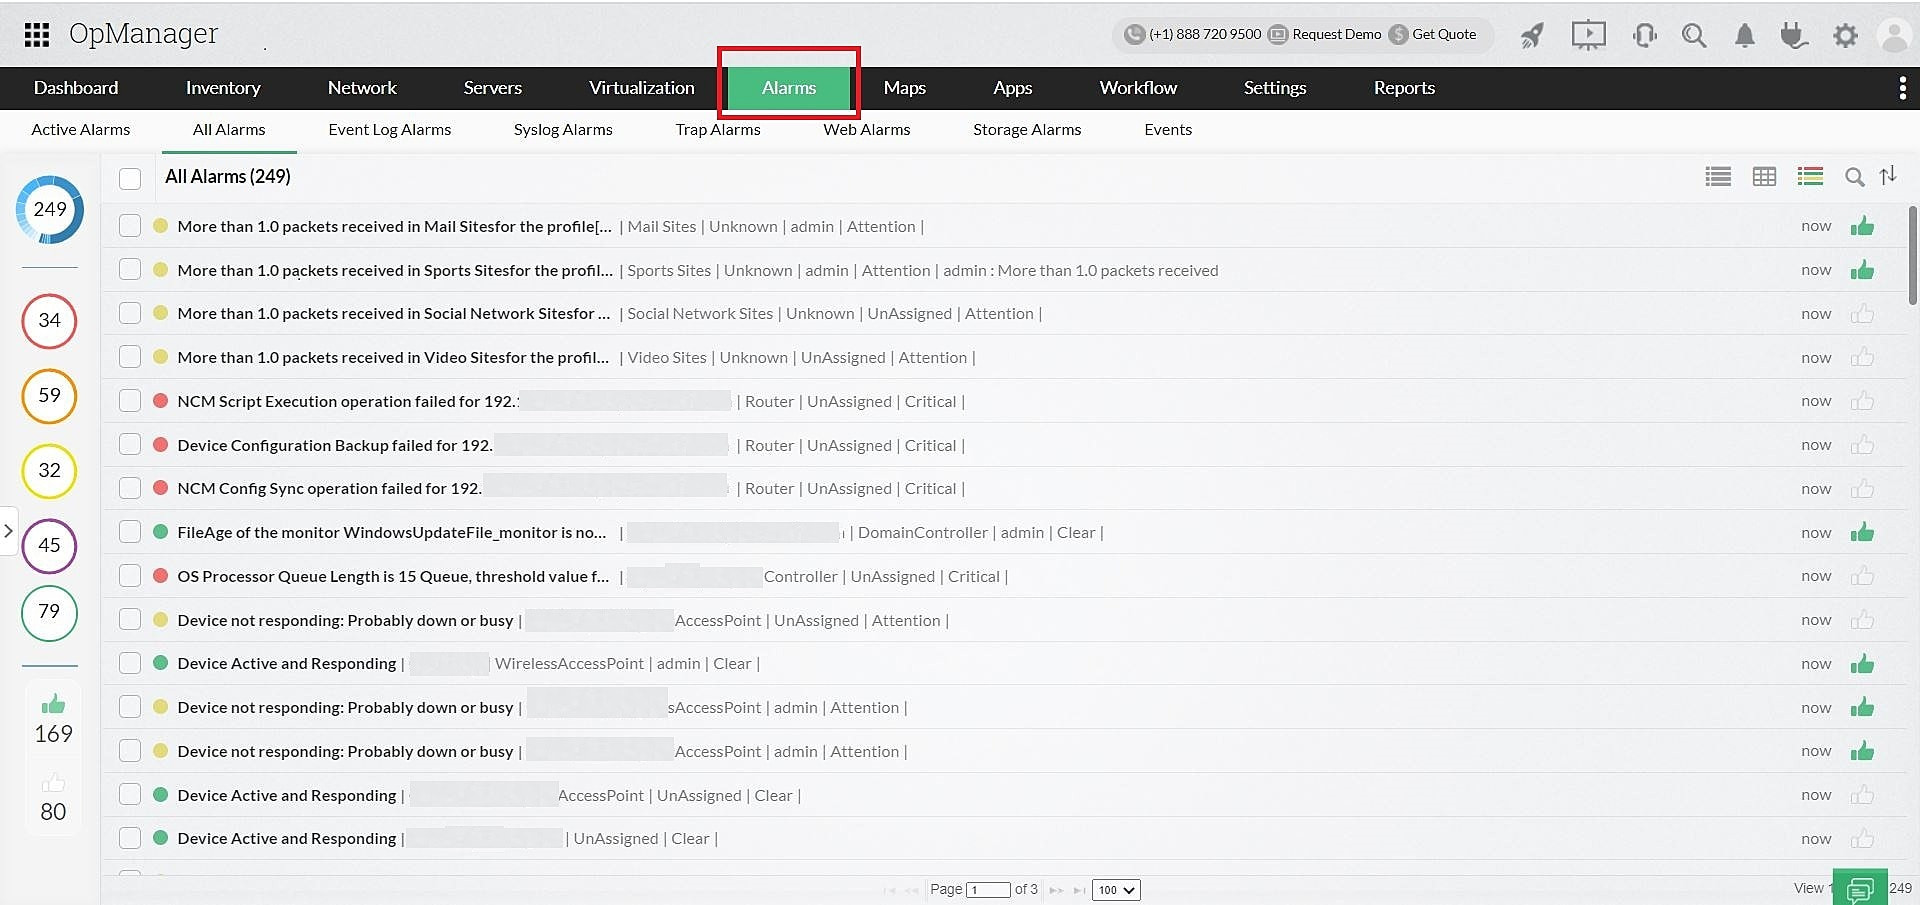
- OpManager’s Alarm Correlation Rules let you define conditions that matter, like multiple related metrics failing within a time window. Instead of 20 device alerts firing, you get one incident that reflects the actual problem.
- Dependency awareness also ensures that when a core switch goes down, you don’t get flooded with alarms from every downstream device. Severity and rearm logic help prioritize and prevent repeated noise.
- IT teams will now have reduced fatigue, clearer prioritization, and alerts that reflect meaningful risk rather than noise.
Integrations that complete the incident flow
OpManager recognizes that integrations are vital to complete the IT management game in any organization.
- OpManager integrates with platforms like ServiceNow, Jira, and ServiceDesk Plus ensuring that critical alerts turn into actionable tickets enriched with context. Its multi-channel notifications (email, SMS, chat, webhooks) guarantee that events aren’t trapped in the monitoring console.
- Workflows can automatically acknowledge alarms, trigger scripts, or sync data with CMDBs, creating smoother collaboration across teams.
Manage and monitor capacity/traffic needs
- OpManager combines capacity planning reports with predictive trend analysis to show when storage, CPU, or bandwidth will run out- so teams can plan upgrades before crunch time.
- With the NetFlow add-on, OpManager digs into traffic flows to reveal which apps, users, or protocols consume bandwidth, making traffic shaping practical. Admins can identify sustained spikes, set thresholds for upper/lower traffic limits, and analyze usage patterns over days or months.
- This enables smarter allocation, prevents bottlenecks, and ensures storage and bandwidth scale in step with business needs- without wasting money or overprovisioning.
AI/ML-powered prediction and automation
- OpManager goes a step beyond reactive monitoring, by pairing long-term performance histories with baselining and anomaly detection to predict trouble before it hits users. For example, traffic patterns and deviations can be flagged early, pointing to segments at risk of saturation.
- Automated workflows then trigger pre-set actions, moving toward self-healing operations. This also makes change planning safer, since potential stress points are identified in advance.
- Implement proactive approach, where issues are caught and remediated early, reducing downtime and the risk of poor user experience.
Overcome network performance monitoring challenges with OpManager
Download 30-day free trialCustomer reviews
Case Studies - OpManager
Awards & Honors
- Recognized as a May 2019 Gartner Peer Insights Customers' Choice for Network Performance Monitoring and Diagnostics Software
- Recognised as an April 2019 Gartner Peer Insights Customers' Choice for IT Infrastructure Monitoring Tools.
- Network Management and Monitor Vendor of the Year 2018, 2019
- Entered the 2019 Gartner NPMD Magic Quadrant.
- Ranked #2 in the Infotech Research Software Reviews Data Quadrant 2018.


