Server monitoring is critical for ensuring the performance, availability, and security of the IT infrastructure. A lack of proper monitoring mechanism can lead to issues like server overload and misconfigurations. All this effectively leads to applications' slowdown or security vulnerabilities. This is where server monitoring tools become helpful. By continuously tracking metrics, detecting anomalies, and gaining visibility into the configuration changes, the tools reduce the chance of downtime. However, while using traditional server tools, human mistakes are inevitable and can have severe consequences.
A notable example is the 2017 Equifax data breach, which affected 147 million people. The breach was partly due to a delayed detection of a server vulnerability, emphasizing the importance of automating server monitoring to prevent such incidents. On this page, we will discuss:
- Why server monitoring automation matters?
- Essentials of server automation
- How OpManager helps in server automation?
Why server monitoring automation matters?
Automation greatly reduces manual intervention in daily repetitive, time-consuming monitoring tasks. Automation takes the burden off IT teams ensuring that servers remain healthy, available, and secure by proactively identifying issues, responding to alerts with automatic workflows without waiting for human effort.
Essentials of server monitoring automation
Server monitoring automation is not just about eliminating the manual effort; it’s about addressing the most common server monitoring challenges that IT teams face every day. Let’s see what they are and how automation helps overcome them:
Alert fatigue
- The challenge: IT teams are often overwhelmed with flood of alerts. Due to the vast amount of alerts (many of which are redundant or irrelevant), IT teams may fail to address the most critical ones, and that can lead to serious consequences.
- The automation fix: You can solve this by implementing AI-based intelligent alerting systems with anomaly detection and event correlation features to raise meaningful alerts for genuine issues. This reduces the alert noise and ensures your team focuses on what matters the most.
Lack of real-time visibility
- The challenge: Delay in data collection means delayed decision making and timely action. By the time your IT team notices the issue, users are already affected.
- The automation fix: With real-time monitoring and instant alerts on network issues, IT teams can proactively prevent server downtime or performance degradation before it impacts users.
Siloed monitoring systems
- The challenge: Enterprise organizations have separate teams to monitor different parts of the infrastructure. Each team relies on separate tools that compartmentalize data, hindering data correlation and increasing the troubleshooting time.
- The automation fix: Use a centralized tool that supports monitoring for all types of servers including virtual machines, containers, and applications. A single console to monitor the entire server ecosystem eliminates silos and speeds up troubleshooting.
Scalability problems
- The challenge: As infrastructure expands to meet the growing business demand, it is vital to track resource utilization, anticipate demand, and plan capacity expansion to prevent resource crunch issues.
- The automation fix: Leverage tools with data forecasting capabilities that generate automatic alerts on future demand.
Root cause analysis
- The challenge: Often, the challenging part in the troubleshooting process is to find the root cause of the problem. Since each layer of the IT stack is inter dependent it becomes difficult to spot the origin of the issue.
- The automation fix: Latest server monitoring tools with AI- and ML-driven features gather the data (metrics, logs, and events), correlates them and helps you narrow down the root cause pretty quickly. It tells you where the problem lies, predicts what might happen next based on historical data analysis and suggests corrective actions.
How OpManager automates server monitoring with AIOps?
OpManager leverages AIOps-driven automation to address common server monitoring challenges, helping IT teams stay proactive, reduce downtime, and optimize resources.
1. Adaptive Thresholds – overcoming alert fatigue
Manual configuration of thresholds is time consuming, especially for an enterprise wide network. Further, it requires IT admins to understand the usual usage levels of each devices to set the minimum and maximum threshold values. This method can lead to misconfigurations and generates a large number of alerts that can overwhelm IT teams.
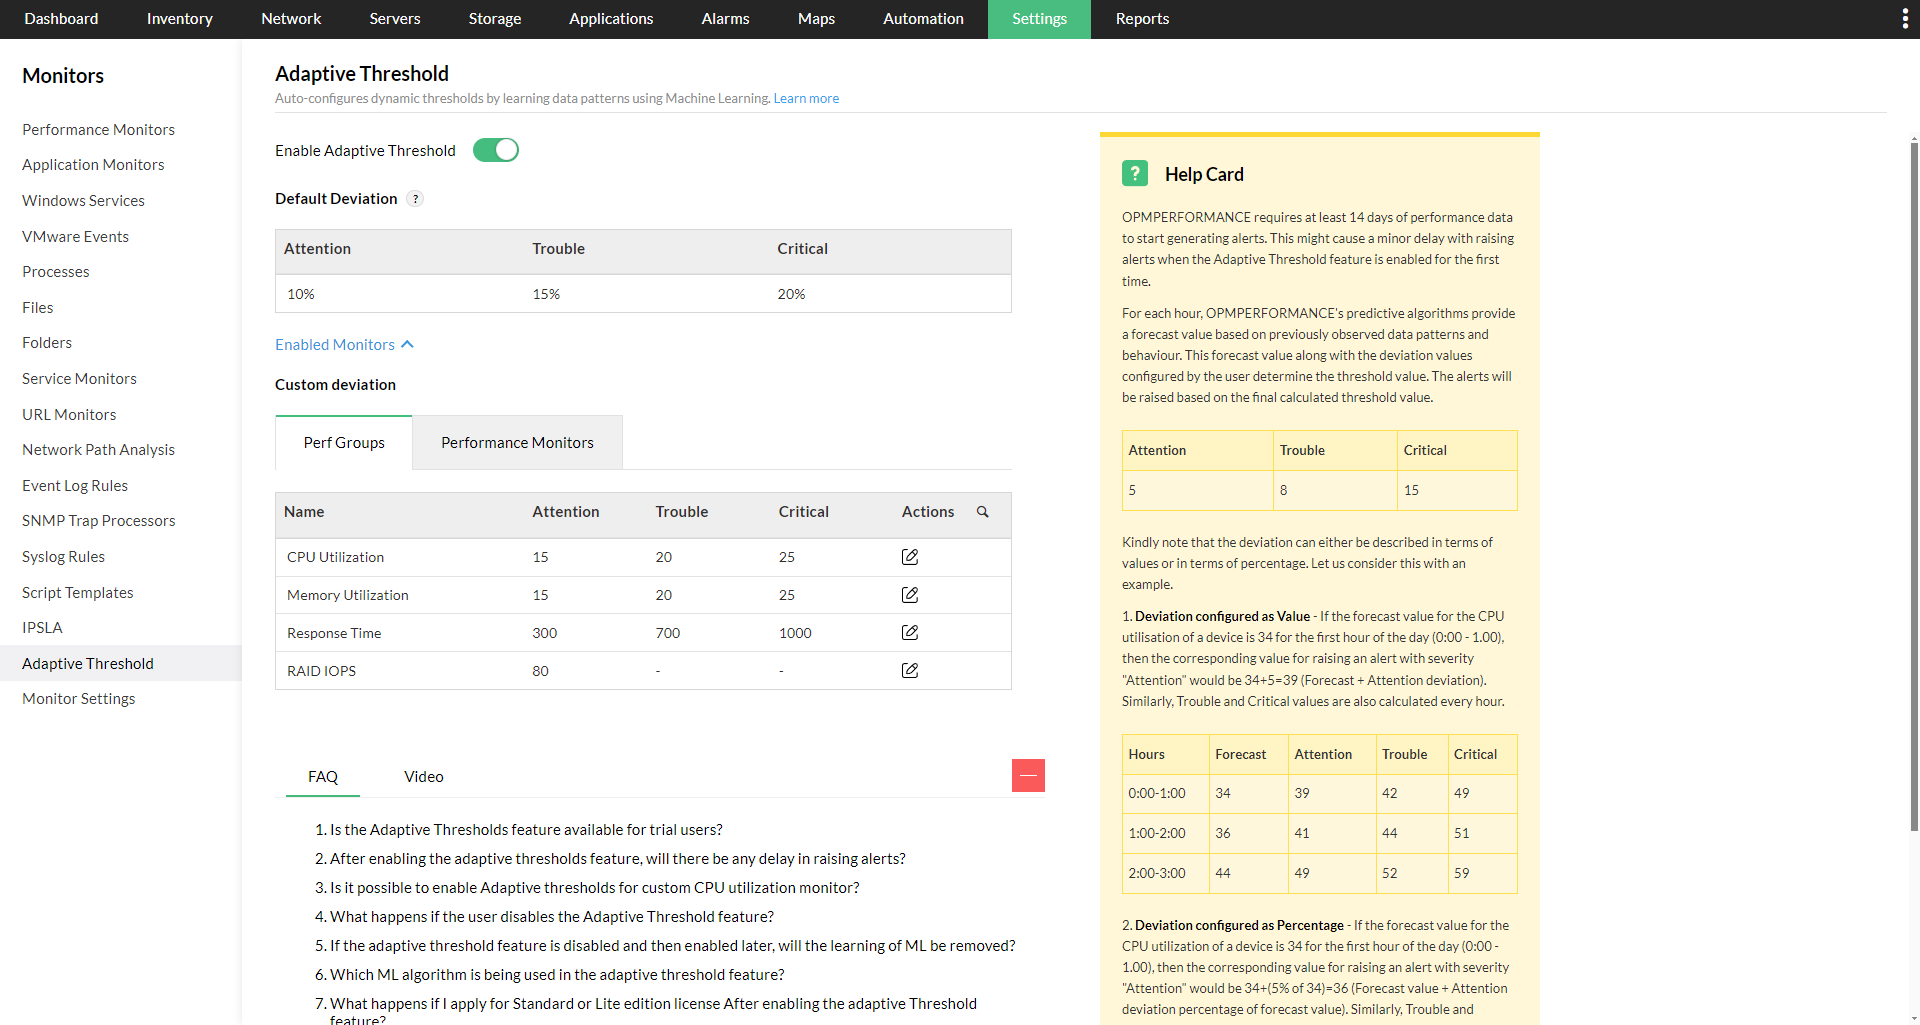
OpManager's adaptive thresholds feature utilizes the power of machine learning and that automatically adjusts the threshold for each device based on historical performance and trends. This ensures that alerts generated are meaningful and actionable, reducing noise and helping teams focus on genuine issues.
2. Proactive alerts and Zia Chatbot for real-time visibility
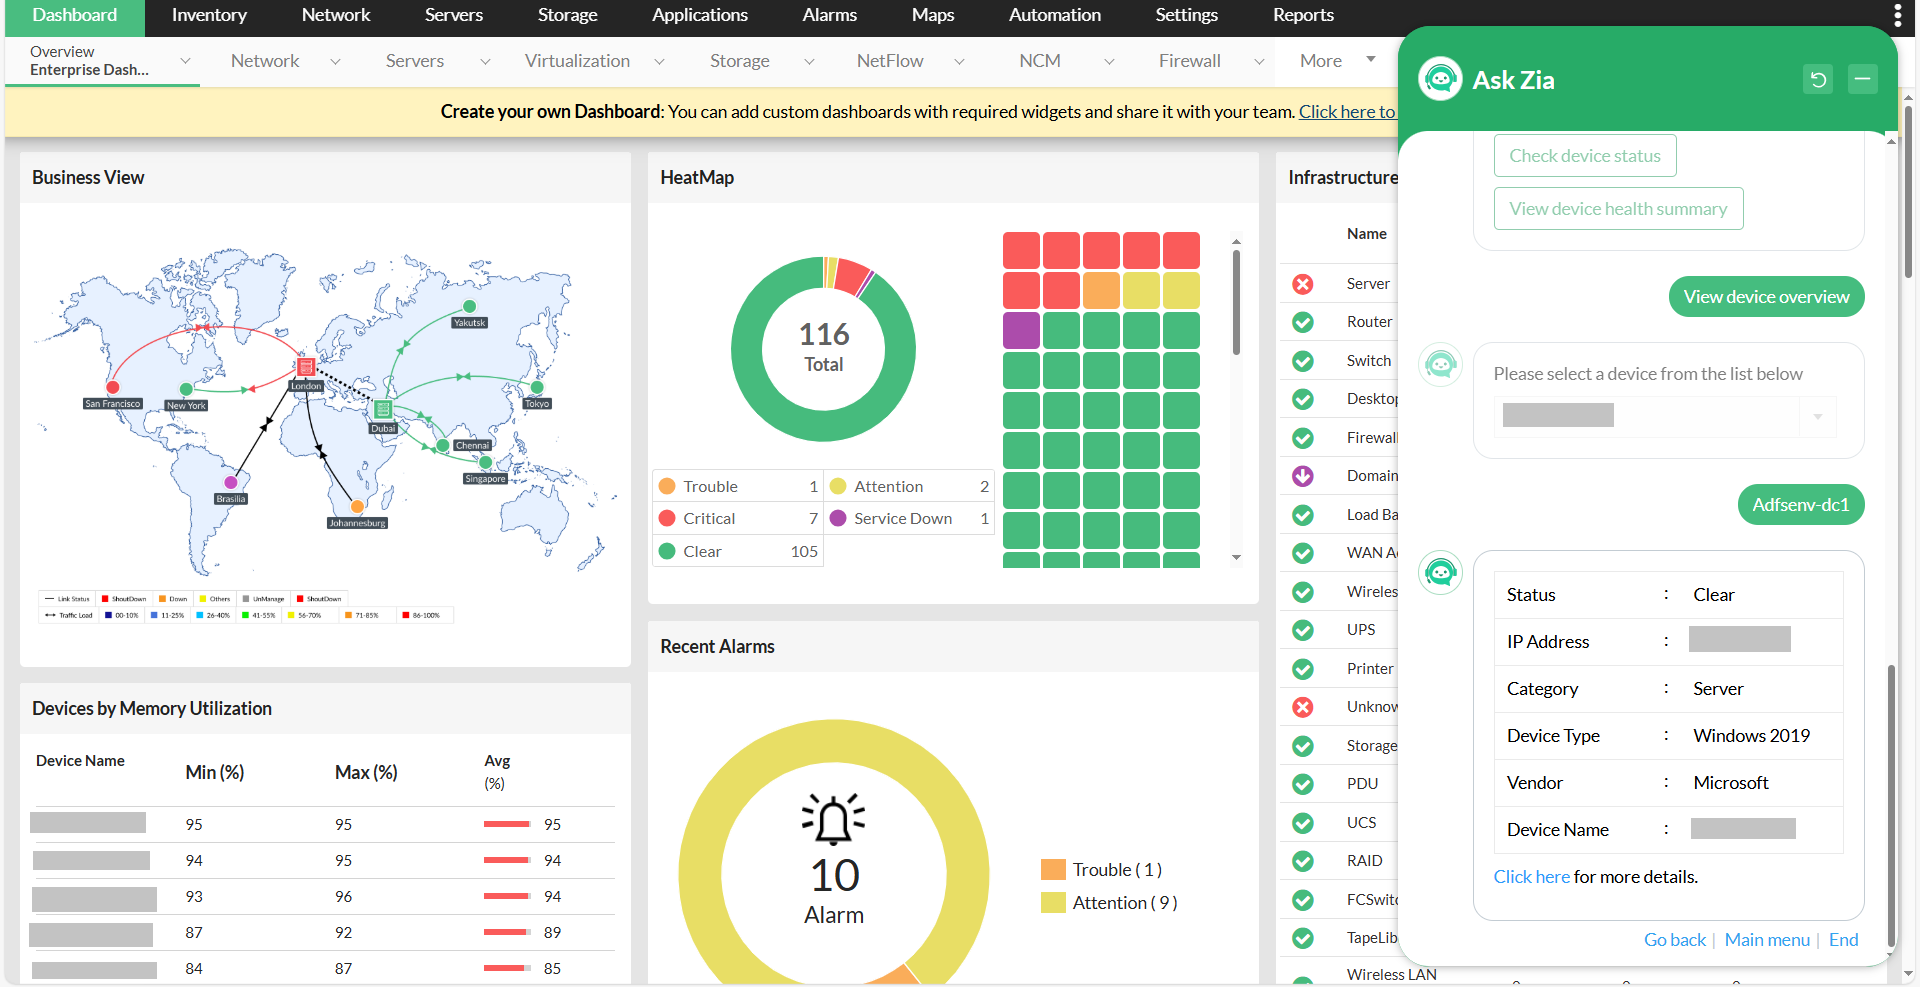
Delayed detection of issues can impact user experience and business operations. OpManager raises proactive alerts whenever threshold violations are noticed, enabling you avoid potential issues.
The AI-driven Zia Chatbot provides answers to your queries anytime with a single pre-defined prompt. You can get key information on the device overview, device health summary, device operational status, and device-specific alarms, or perform device functions like ping or traceroute without much manual work. Effectively, with these features, IT teams get real-time visibility into server health and take quick actions before problems escalate.
3. Centralized server dashboard to eliminate data silos
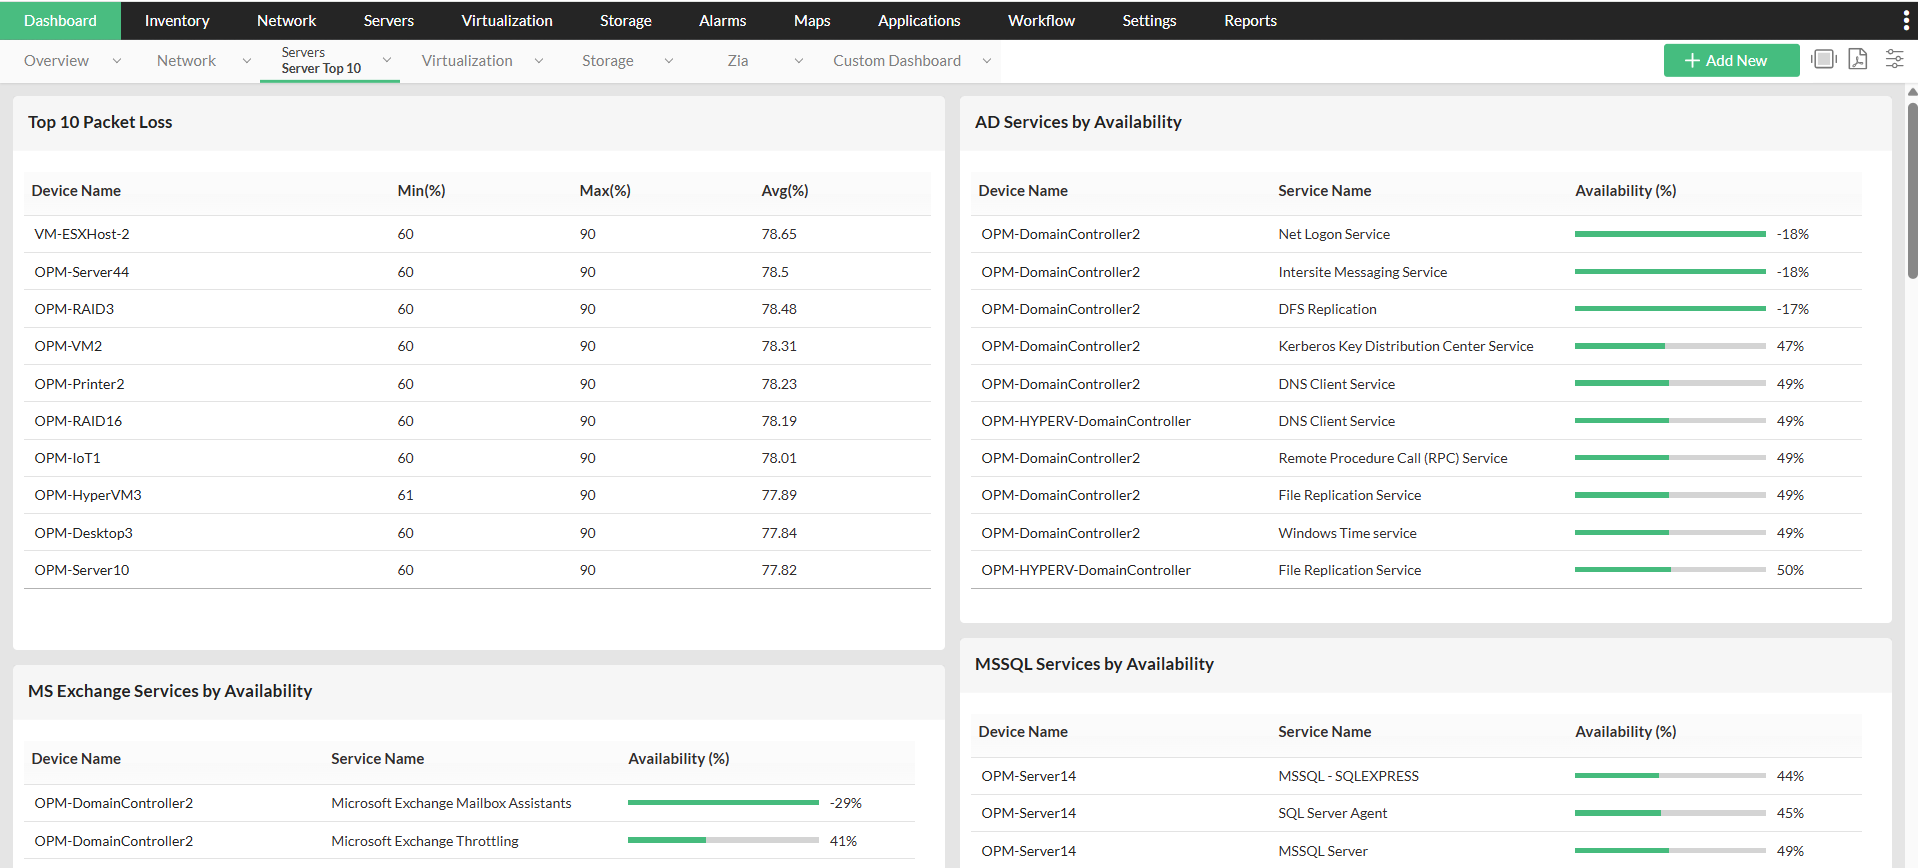
Managing multiple servers, VMs, and containers with separate tools creates blind spots. OpManager’s dedicated server dashboard provides a unified, at-a-glance view of server performance. For example, the dashboard provides important data such as the top servers by CPU or disk utilization, the availability of Windows services, all from a single console.
4. Zia dashboard - for scalability and intelligent recommendations
Predicting resource usage in dynamic environments is challenging. With OpManager's Zia dashboard, you can accurately predict when your server resources will be exhausted, understand the implications of the potential issues, and fix them proactively.
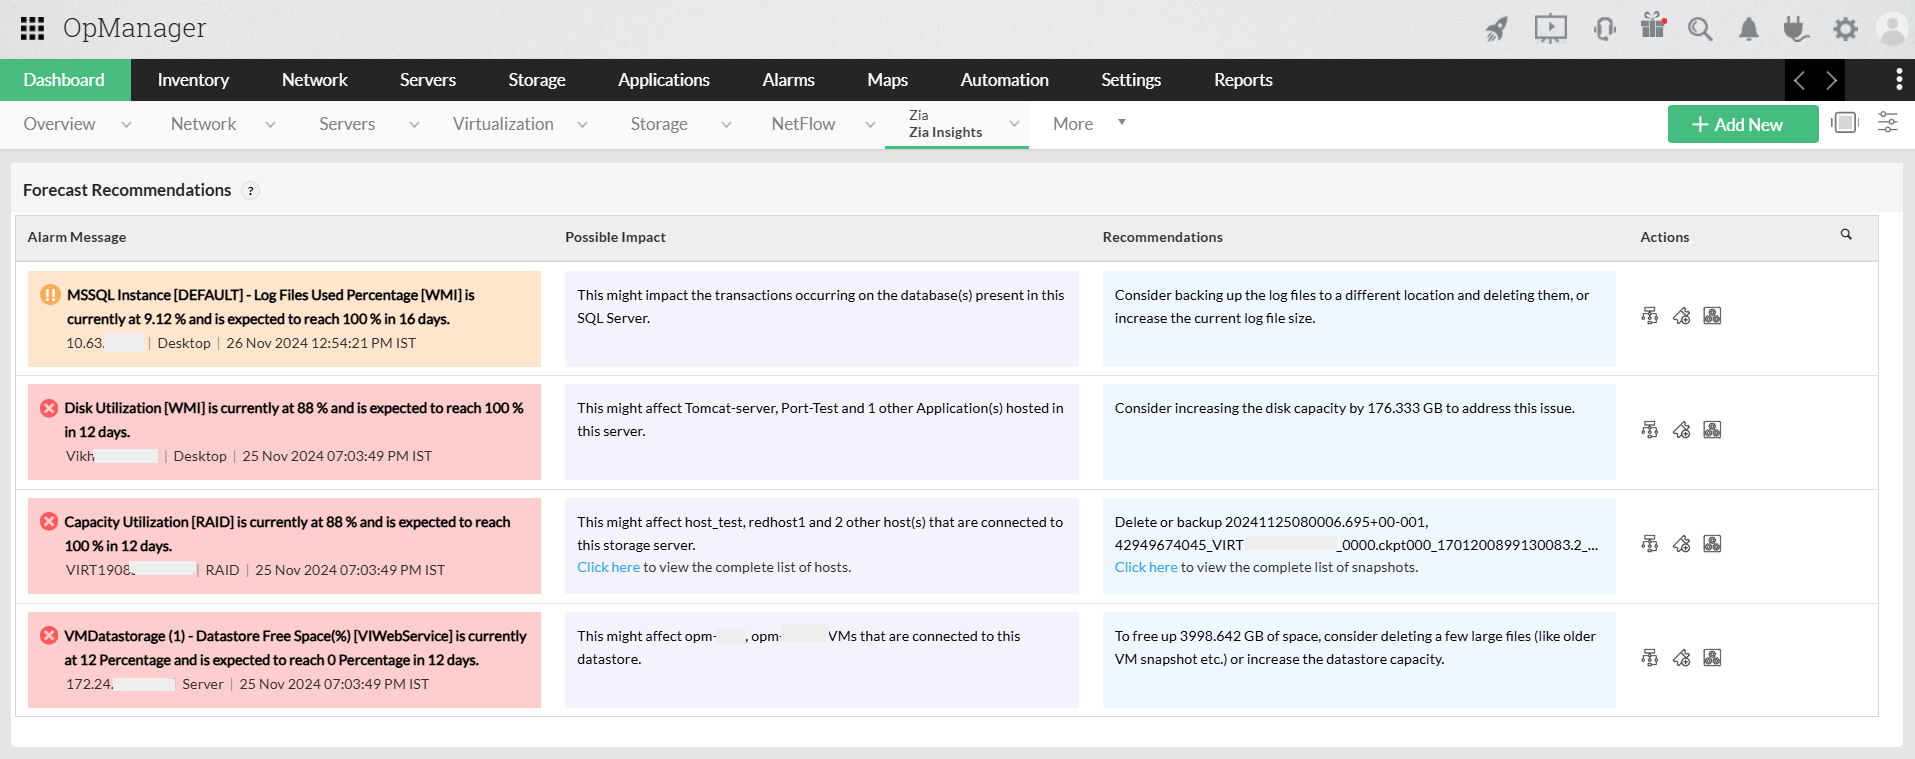
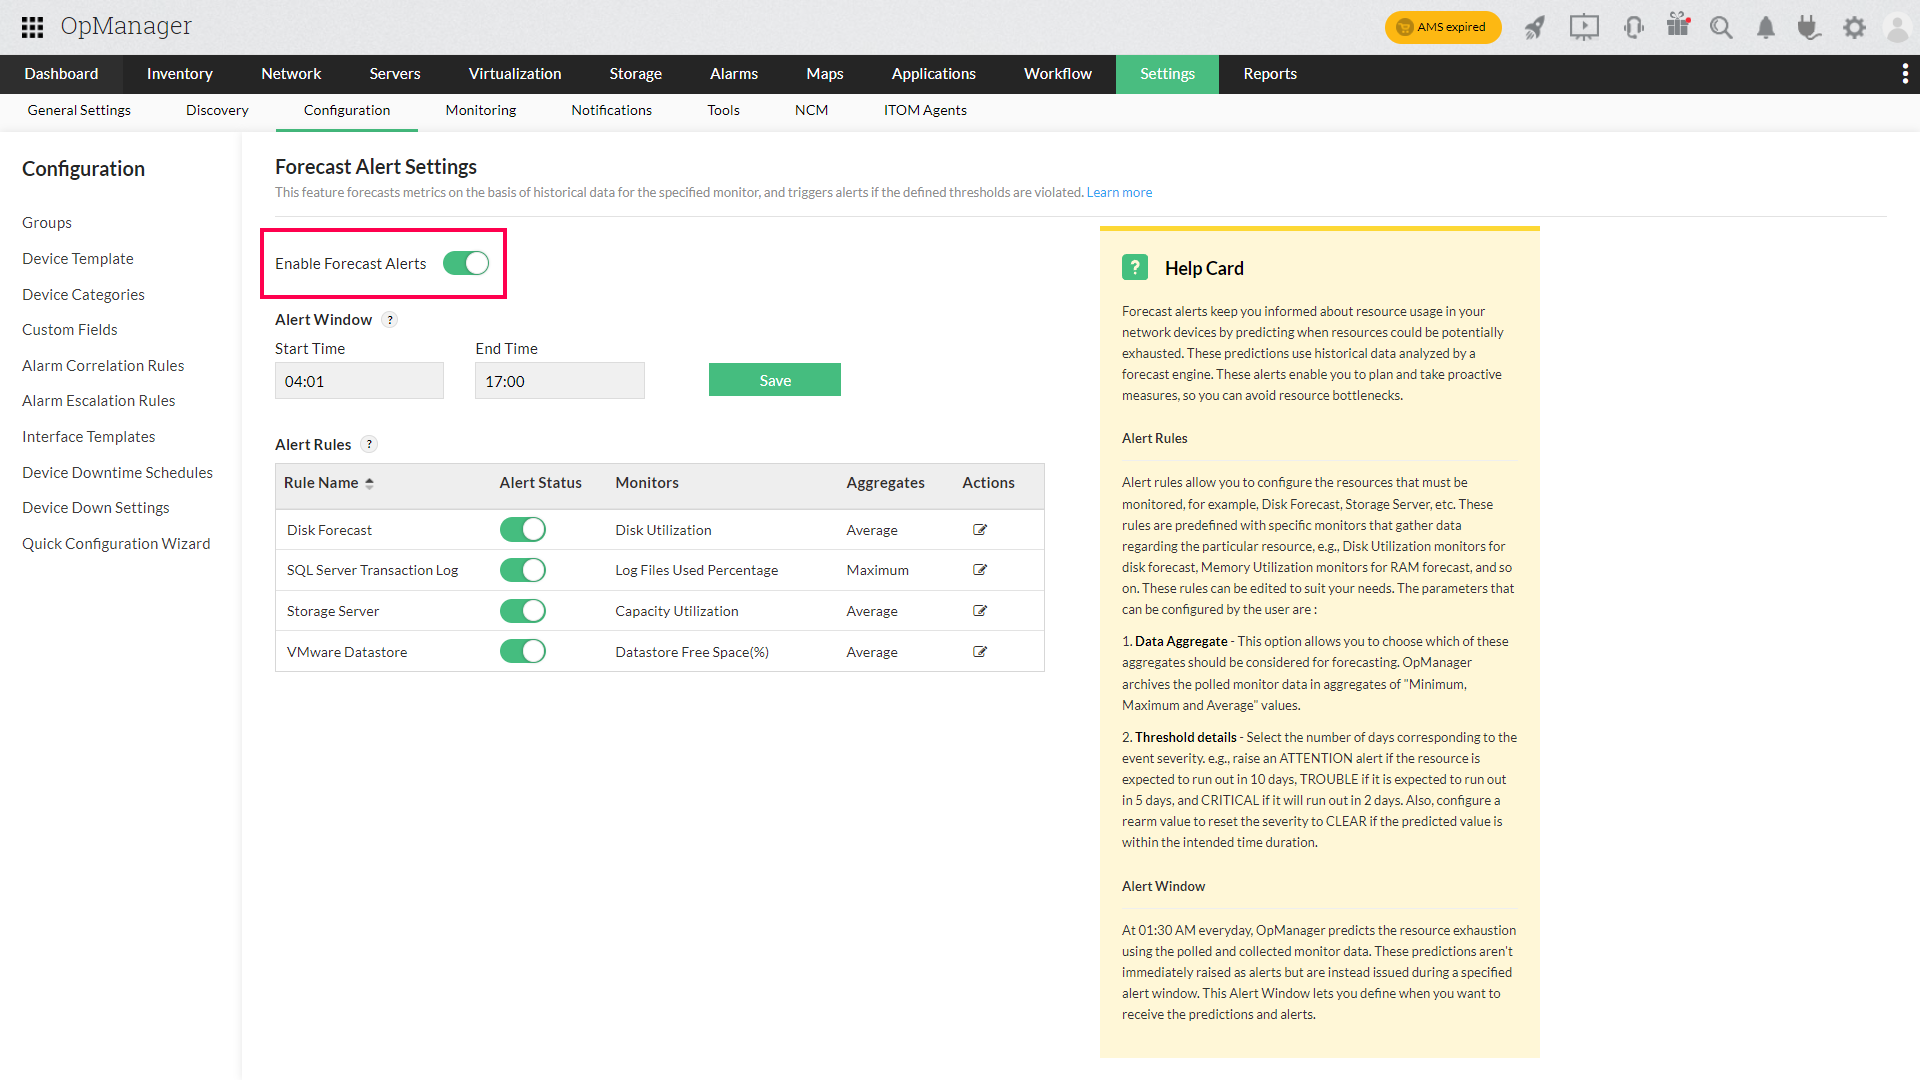
By configuring the forecast alerts, you can get timely notifications on when your critical resources such as disk space, or VM data store free space will run out and plan well in ahead.
OpManager also has a dedicated capacity planning dashboard that gives you an overall picture of the servers that are overutilized or under utilized, useful for efficient resource allocation. It also has a separate widget for forecast alerts that shows the alerts for devices that are projected to breach utilization thresholds. It also offers AI-based recommendations for resource optimization, such as capacity upgrades, load redistribution, or retirement of underused assets.
5. Zia Insights – for analysis and decision making
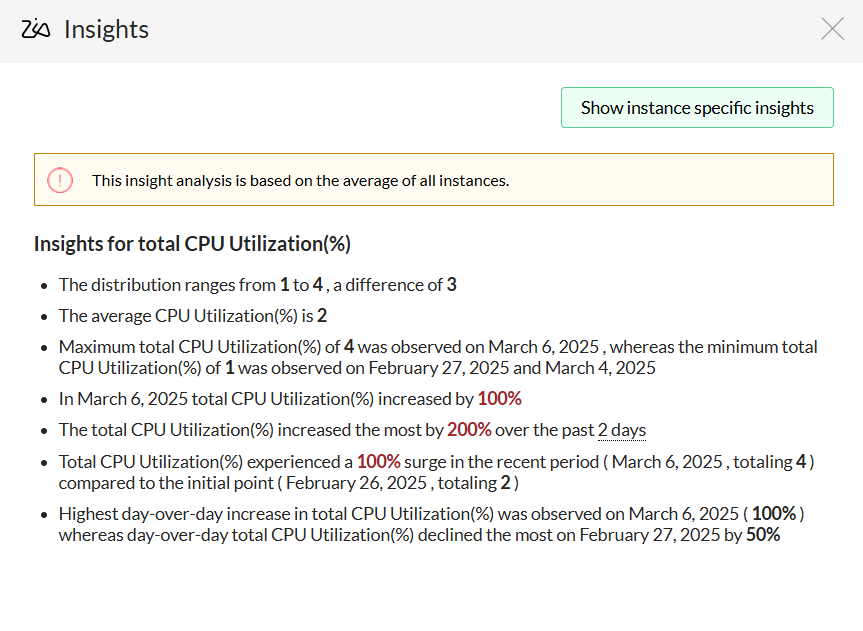
Zia Insights in OpManager provide meaningful insights into performance metrics. These insights are available for graphs in OpManager that contain numeric values, allowing users to gain easier understanding and deeper visibility using comparison analysis, variance analysis, and other key comparisons.
For example, on the CPU utilization graph, you can gain insights like Day-over-day percentage increase or decrease (to spot abnormal behavior), the CPU cores that contribute the most to total utilization (to precisely identify the actual root cause) and other actionable insights. These insights enable your IT team to take data-backed decisions quickly without any guess work.
6. Workflow automation
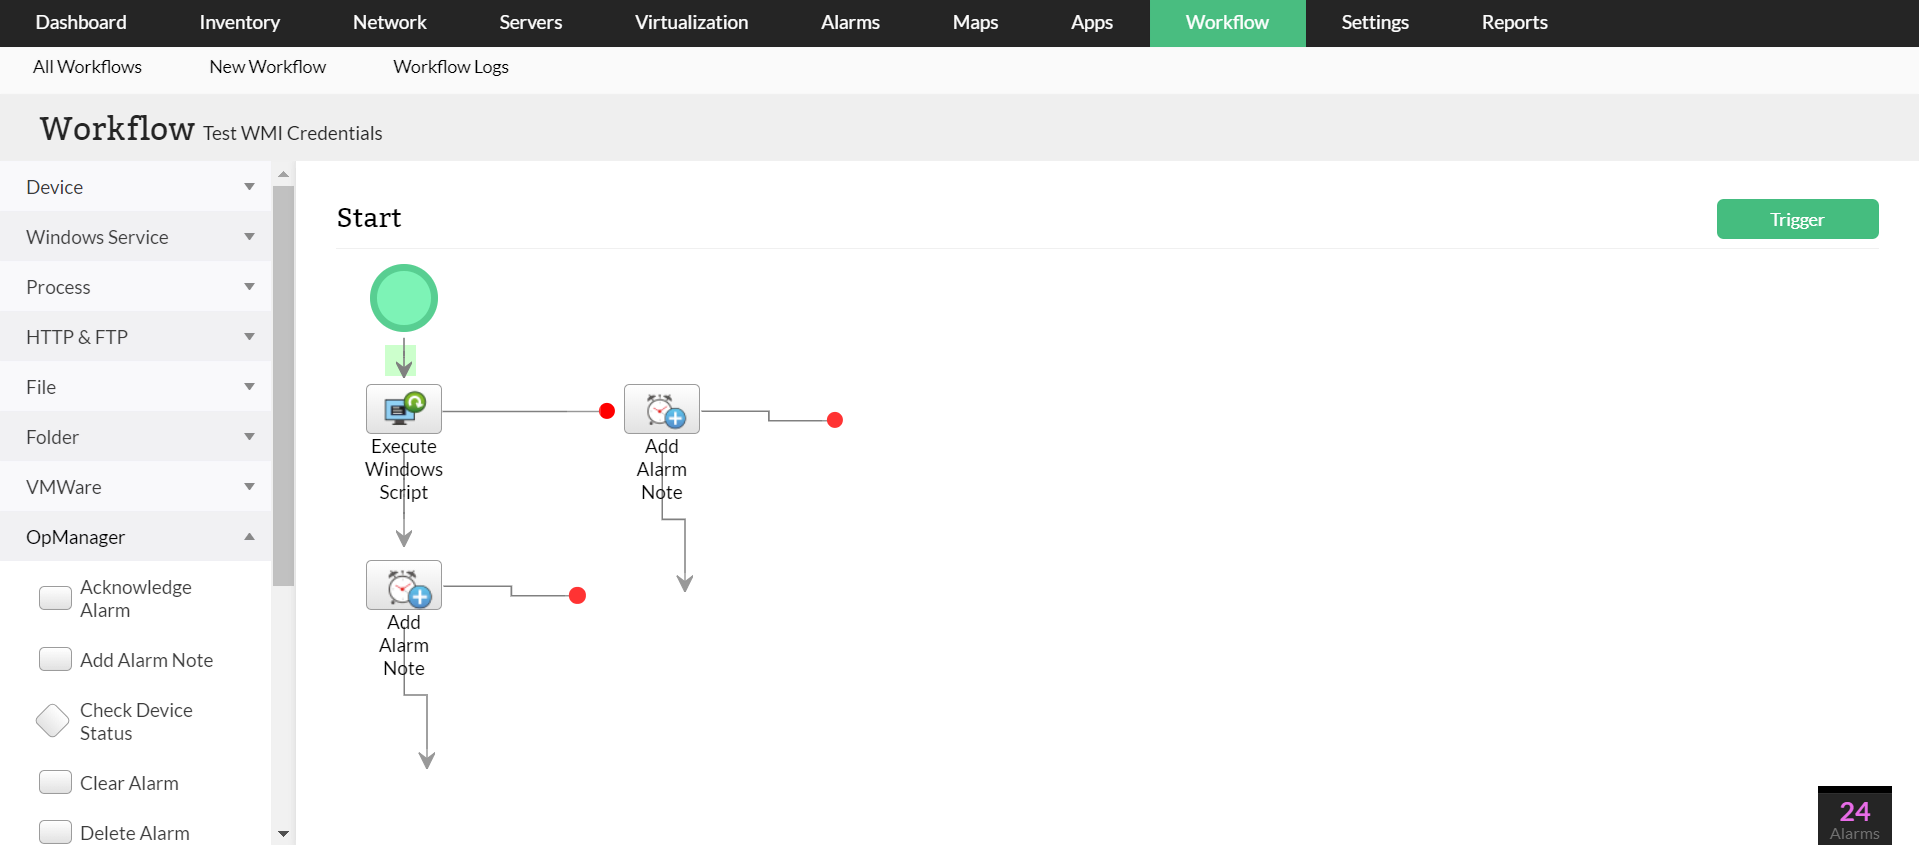
OpManager’s Workflow Automation feature enables IT teams to automate routine, repetitive troubleshooting and maintenance tasks without writing a single line of code. Creating a workflow is pretty simple with its intuitive drag-and-drop approach. You can create and execute custom workflows for actions like restarting services, running scripts, stopping a process. This not only reduces human error but also ensures faster incident response and improves uptime.
Automate server monitoring now with OpManager
Download 30-day free trialTo learn more about these features and how it can help manage your network better, take a free personalized demo or try our product for yourself with our free edition.
FAQs on Server Monitoring Automation
How does automation reduce downtime in server monitoring?
+Can automated server monitoring handle hybrid and cloud environments?
+Make your server uptime monitoring simple and efficient with OpManager
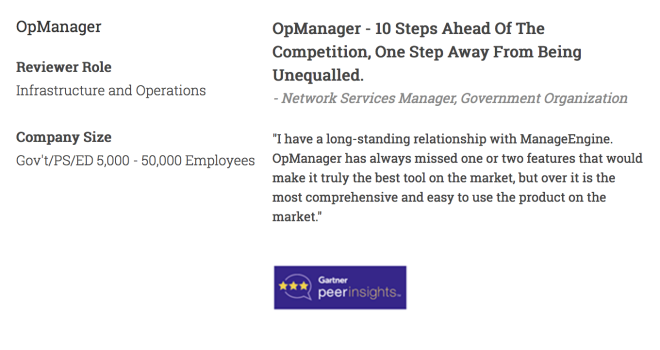
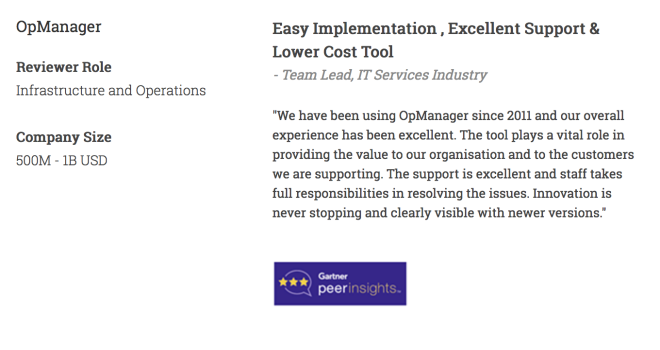
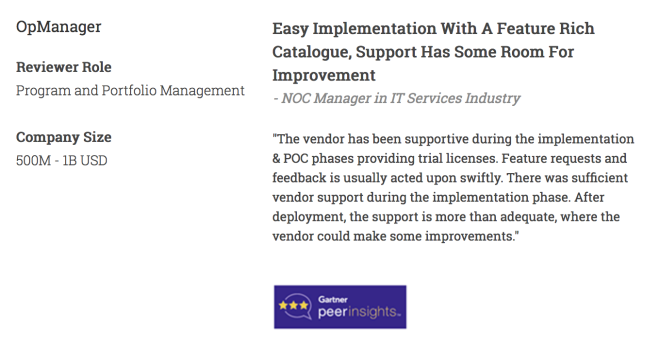
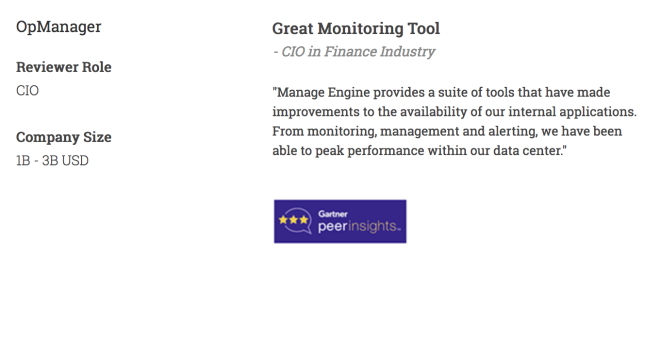
Download OpManager nowCustomer reviews
More than 1,000,000 IT admins trust ManageEngine ITOM solutions to monitor their IT infrastructure securely
Case Studies - OpManager
Awards & Honors
- Recognized as a May 2019 Gartner Peer Insights Customers' Choice for Network Performance Monitoring and Diagnostics Software
- Recognised as an April 2019 Gartner Peer Insights Customers' Choice for IT Infrastructure Monitoring Tools.
- Network Management and Monitor Vendor of the Year 2018, 2019
- Entered the 2019 Gartner NPMD Magic Quadrant.
- Ranked #2 in the Infotech Research Software Reviews Data Quadrant 2018.
R
