Comprehensive monitoring for your SQL server estate
Monitor your Microsoft SQL server database infrastructure regardless of whether they are running in Windows, Linux, Docker containers or hosted on Azure, with Applications Manager's SQL server monitoring features.
Monitor SQL server memory
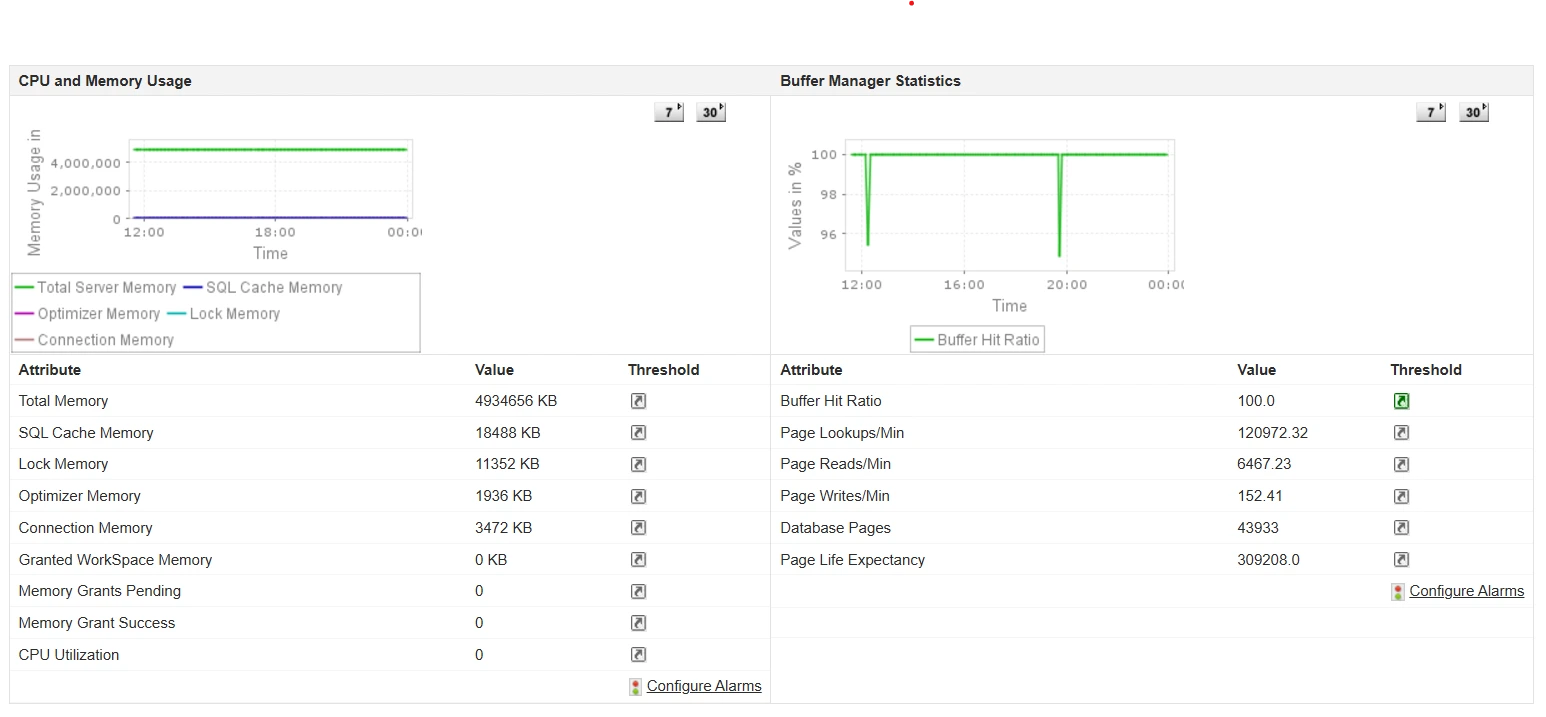
The SQL server utilizes memory for different operations, such as managing locks, user connections, caching SQL server execution plans, and facilitating the query optimizer. Insufficient memory allocation can often lead to slow query performance and increased disk I/O.
With Applications Manager's SQL server monitoring interface, track detailed memory metrics to ensure that your SQL server has sufficient memory and get notified before the server is under or over-provisioned. Become aware of low cache memory, high lock and connection memory to identify heavy locking, inefficient query plans, and connection leaks.
High values of pending memory grants can indicate that queries are waiting for memory resources to become available, and low memory grant success rates can lead to query delays. Configuring alarms for these metrics can help prevent performance slowdowns.
Keep an eye on cache performance metrics
- Monitor cache metrics to analyze the efficiency of your server's caching mechanisms. Prevent thrashing or undersized caches by getting notified when hit ratios are lower than normal. Gain insights about the buffer cache and buffer manager to understand how well your SQL Server manages its buffer pool.
- Understand how well your SQL server is utilizing its buffer cache by checking the buffer cache hit ratio (BCHR). A BCHR below 90% indicates potential performance issues as your SQL server is frequently accessing disk storage which can lead to increased latency and slower query response times. Alongside BCHR, also observe the Page Life Expectancy (PLE) and memory grants pending metrics to identify when performance tuning may be necessary.
- Monitor read/write rates to pinpoint high I/O activity. Get details about the access methods that help you become aware of scans being performed on the tables and indexes. High numbers of full scans might indicate missing indexes or poorly optimized queries.
- Monitor the plan cache hit ratio and gain insight into:
- High compilation rates
- Memory pressure
- Frequent plan invalidations
- Poor performing queries
- Workload characteristics (stable or highly variable)
- Evaluate the impact of changes in database configuration, application code or server hardware.

Detect lagging queries instantly
Database query optimization is crucial for maintaining a high-performing, efficient, and cost-effective database environment. The first step to query optimization is getting insights into various aspects of query performance.
With Applications Manager's effective SQL server monitoring software, you can instantly evaluate query performance and implement optimization actions to enhance database performance.
| Metric |
Description |
Optimization Action |
| Top Queries by CPU |
Queries consuming the most CPU resources |
Optimize to reduce CPU load, improving overall server performance. |
| Top Queries by I/O |
Queries generating the most disk I/O operations |
Optimize to reduce disk read/write times, decreasing latency and improving performance. |
| Top Queries by CLR |
Queries with heavy CLR usage |
Optimize to reduce the overhead of CLR operations, freeing up resources for other tasks. |
| Top Waits by Waiting Tasks |
The most significant wait types and associated tasks |
Analyze and address these waits to reduce query delays and enhance throughput. |
| Top Slow Running Queries |
Long-running queries |
Optimize to improve application responsiveness and reduce user wait times. |
| Most Frequently Executed Queries |
High-frequency queries |
Optimize to implement substantial performance improvements due to their frequent execution. |
| Most Blocked Queries |
Queries causing significant blocking |
Resolve blocks to improve the flow of query execution, reduce wait times and enhance overall performance. |
| Top Queries by Lowest Plan Reuse |
Queries with poor execution plan reuse |
Optimize to reduce the need for plan recompilations to save CPU resources and speed up query execution. |
| Cost of Missing Indexes |
Potential performance improvements through indexing |
Implement suggested indexes to speed up data retrieval operations. |
| Top Components by Memory Usage |
Memory-intensive components |
Optimize memory usage to ensure that the server runs efficiently and prevent memory bottlenecks. |

Tired of firefighting SQL issues? See how proactive monitoring works in 15 minutes
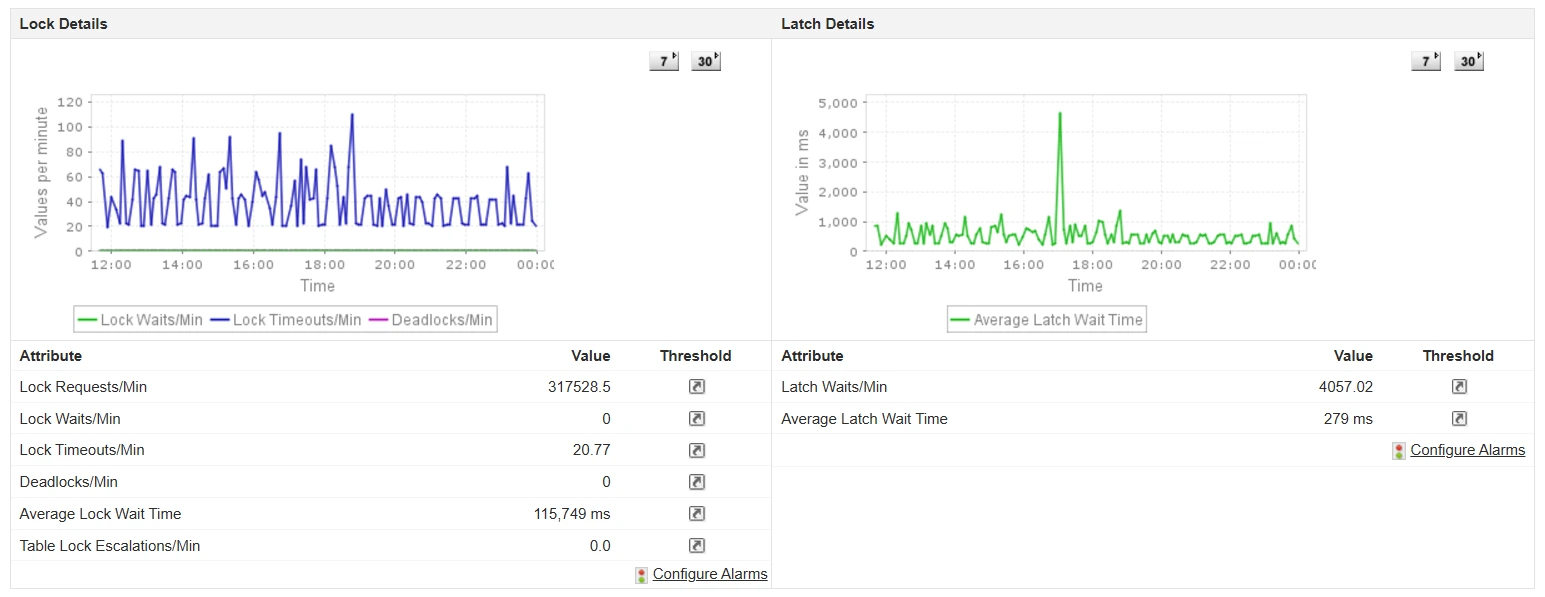
Monitor SQL server deadlocks
Proactively diagnose deadlocks to avoid problems such as transaction failures, increased latency, resource contention, application crashes, performance degradation, as well as end user frustration. Applications Manager can pinpoint the queries or stored procedures that participate in deadlocks. You can then analyze execution plans associated with these queries to identify potential optimizations.

Monitor SQL server session metrics
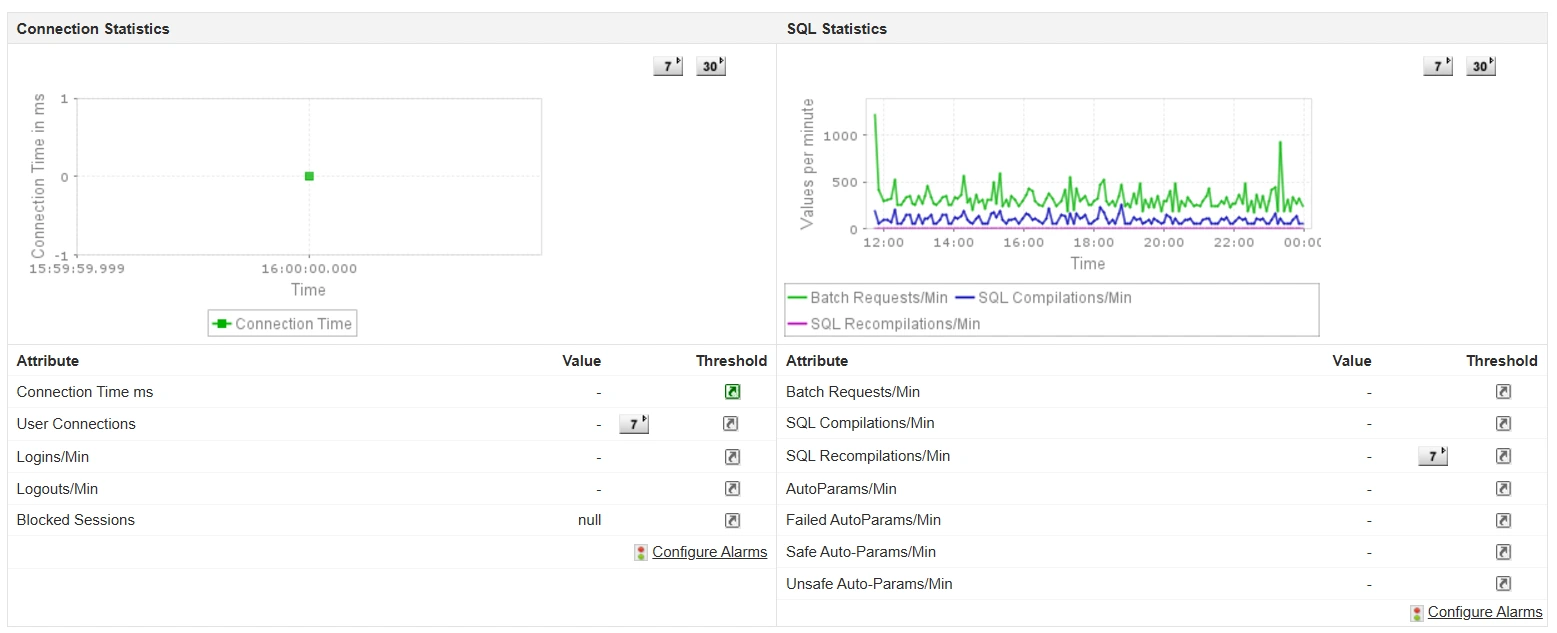
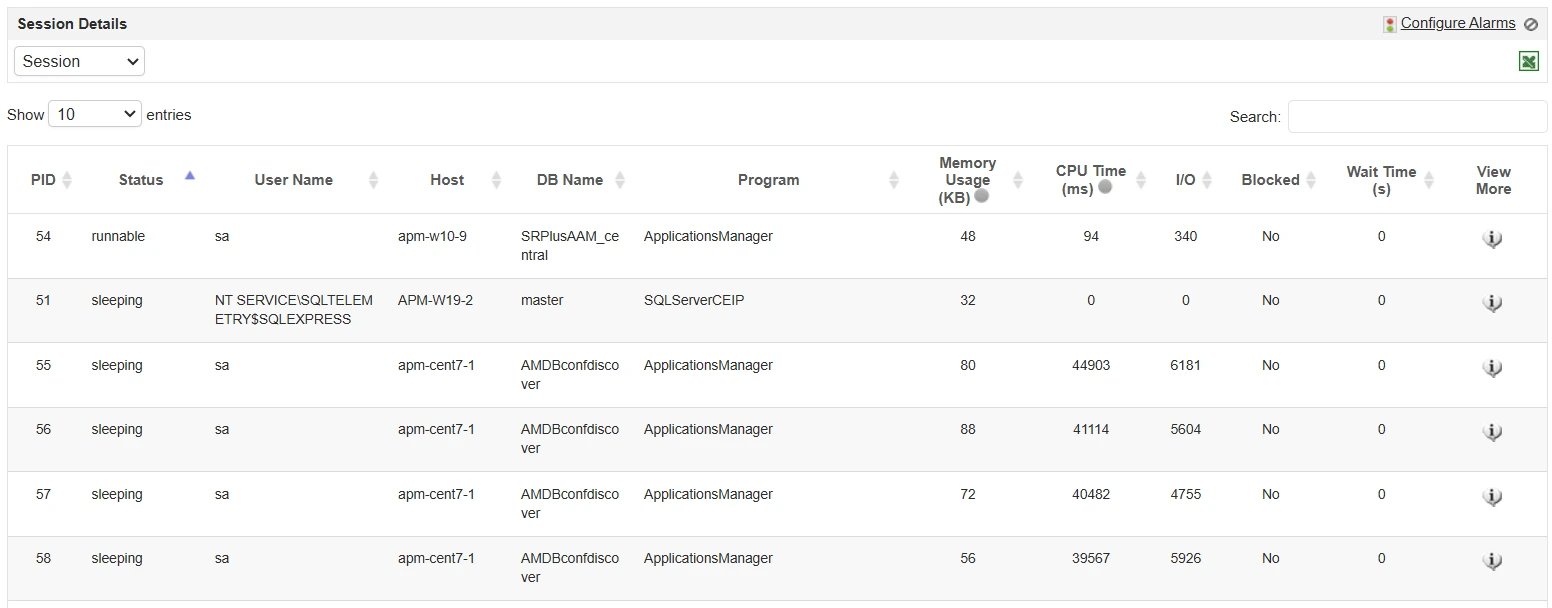
Keep an eye on user connections, logins, logouts, and blocked sessions to ensure that your server is handling user activity efficiently and troubleshoot any irregularities. Get detailed SQL statistics, including batch requests, SQL compilations, and recompilations per minute to detect inefficiencies and optimize query performance.
Streamline your SQL server backup operations
Curating an effective SQL server backup and recovery plan not only avoids unnecessary downtime but also enhances reliability after a sudden failure. With Applications Manager's SQL monitoring, you can implement an effective, fool-proof backup and recovery routine.
Set up backup jobs and schedule the frequency based on your requirement to ensure that the data can be restored in the event of an unexpected failure - without logging into SQL Server Management Studio. Get notified whenever a backup job fails, over the medium of your choice (email/text/Slack). Identify why the job failed and resolve the same to enhance database server reliability. Detect damaged backups and also track its age.

Ensure uninterrupted database availability
To ensure continuous availability of your database. Applications Manager helps you
- Keep track of database mirroring sessions and logs and get notified instantly when there is a synchronization issue.
- Get real-time insights about the status of publications and subscriptions. Detect out-of-sync subscriptions by tracking the Expiration Status to prevent data loss.
- Become aware of replication agents' status to ensure that the replication process runs smoothly without any hassles.
- Monitor availability groups and their corresponding replicas. Detect differences in data sync between primary and secondary databases by tracking Redo Queue and Log Sent Queue.
- Discover fail-over readiness to analyze possibility of data loss during a manual failover.
Evaluate SQL job executions with ease
- Identify job execution failures and long run times instantly.
- Analyze job execution patterns to ensure that critical jobs run successfully and plan your resources effectively.
Intelligent alerts
Get notified the moment your database goes down. Leverage AI-assisted algorithms to identify anomalies and receive alerts on the go through the channel of your choice - email, sms, or slack!
Forecast storage - eliminate guesswork
Use forecast reports to predict future usage and plan capacity effectively.

