- Core web vitals: You must be able to track Largest Contentful Paint (LCP) for visual loading, First Input Delay (FID) or Interaction to Next Paint (INP) for responsiveness, and Cumulative Layout Shift (CLS) for visual stability. These are also critical for your SEO rankings.
- Error context: It is not enough to know a JavaScript error occurred. You need the stack trace, the specific browser version, and the user's breadcrumb trail leading up to the crash.
- Session-level detail: Look for tools that allow you to pivot from an aggregate "average load time" down to a specific user's session. This allows you to see exactly what went wrong for a frustrated customer.
This guide provides a practical roadmap for evaluating real user monitoring solutions, focusing on the capabilities that matter in production environments while helping you avoid common pitfalls such as tool sprawl and unpredictable costs.
When do you actually need a dedicated RUM tool?
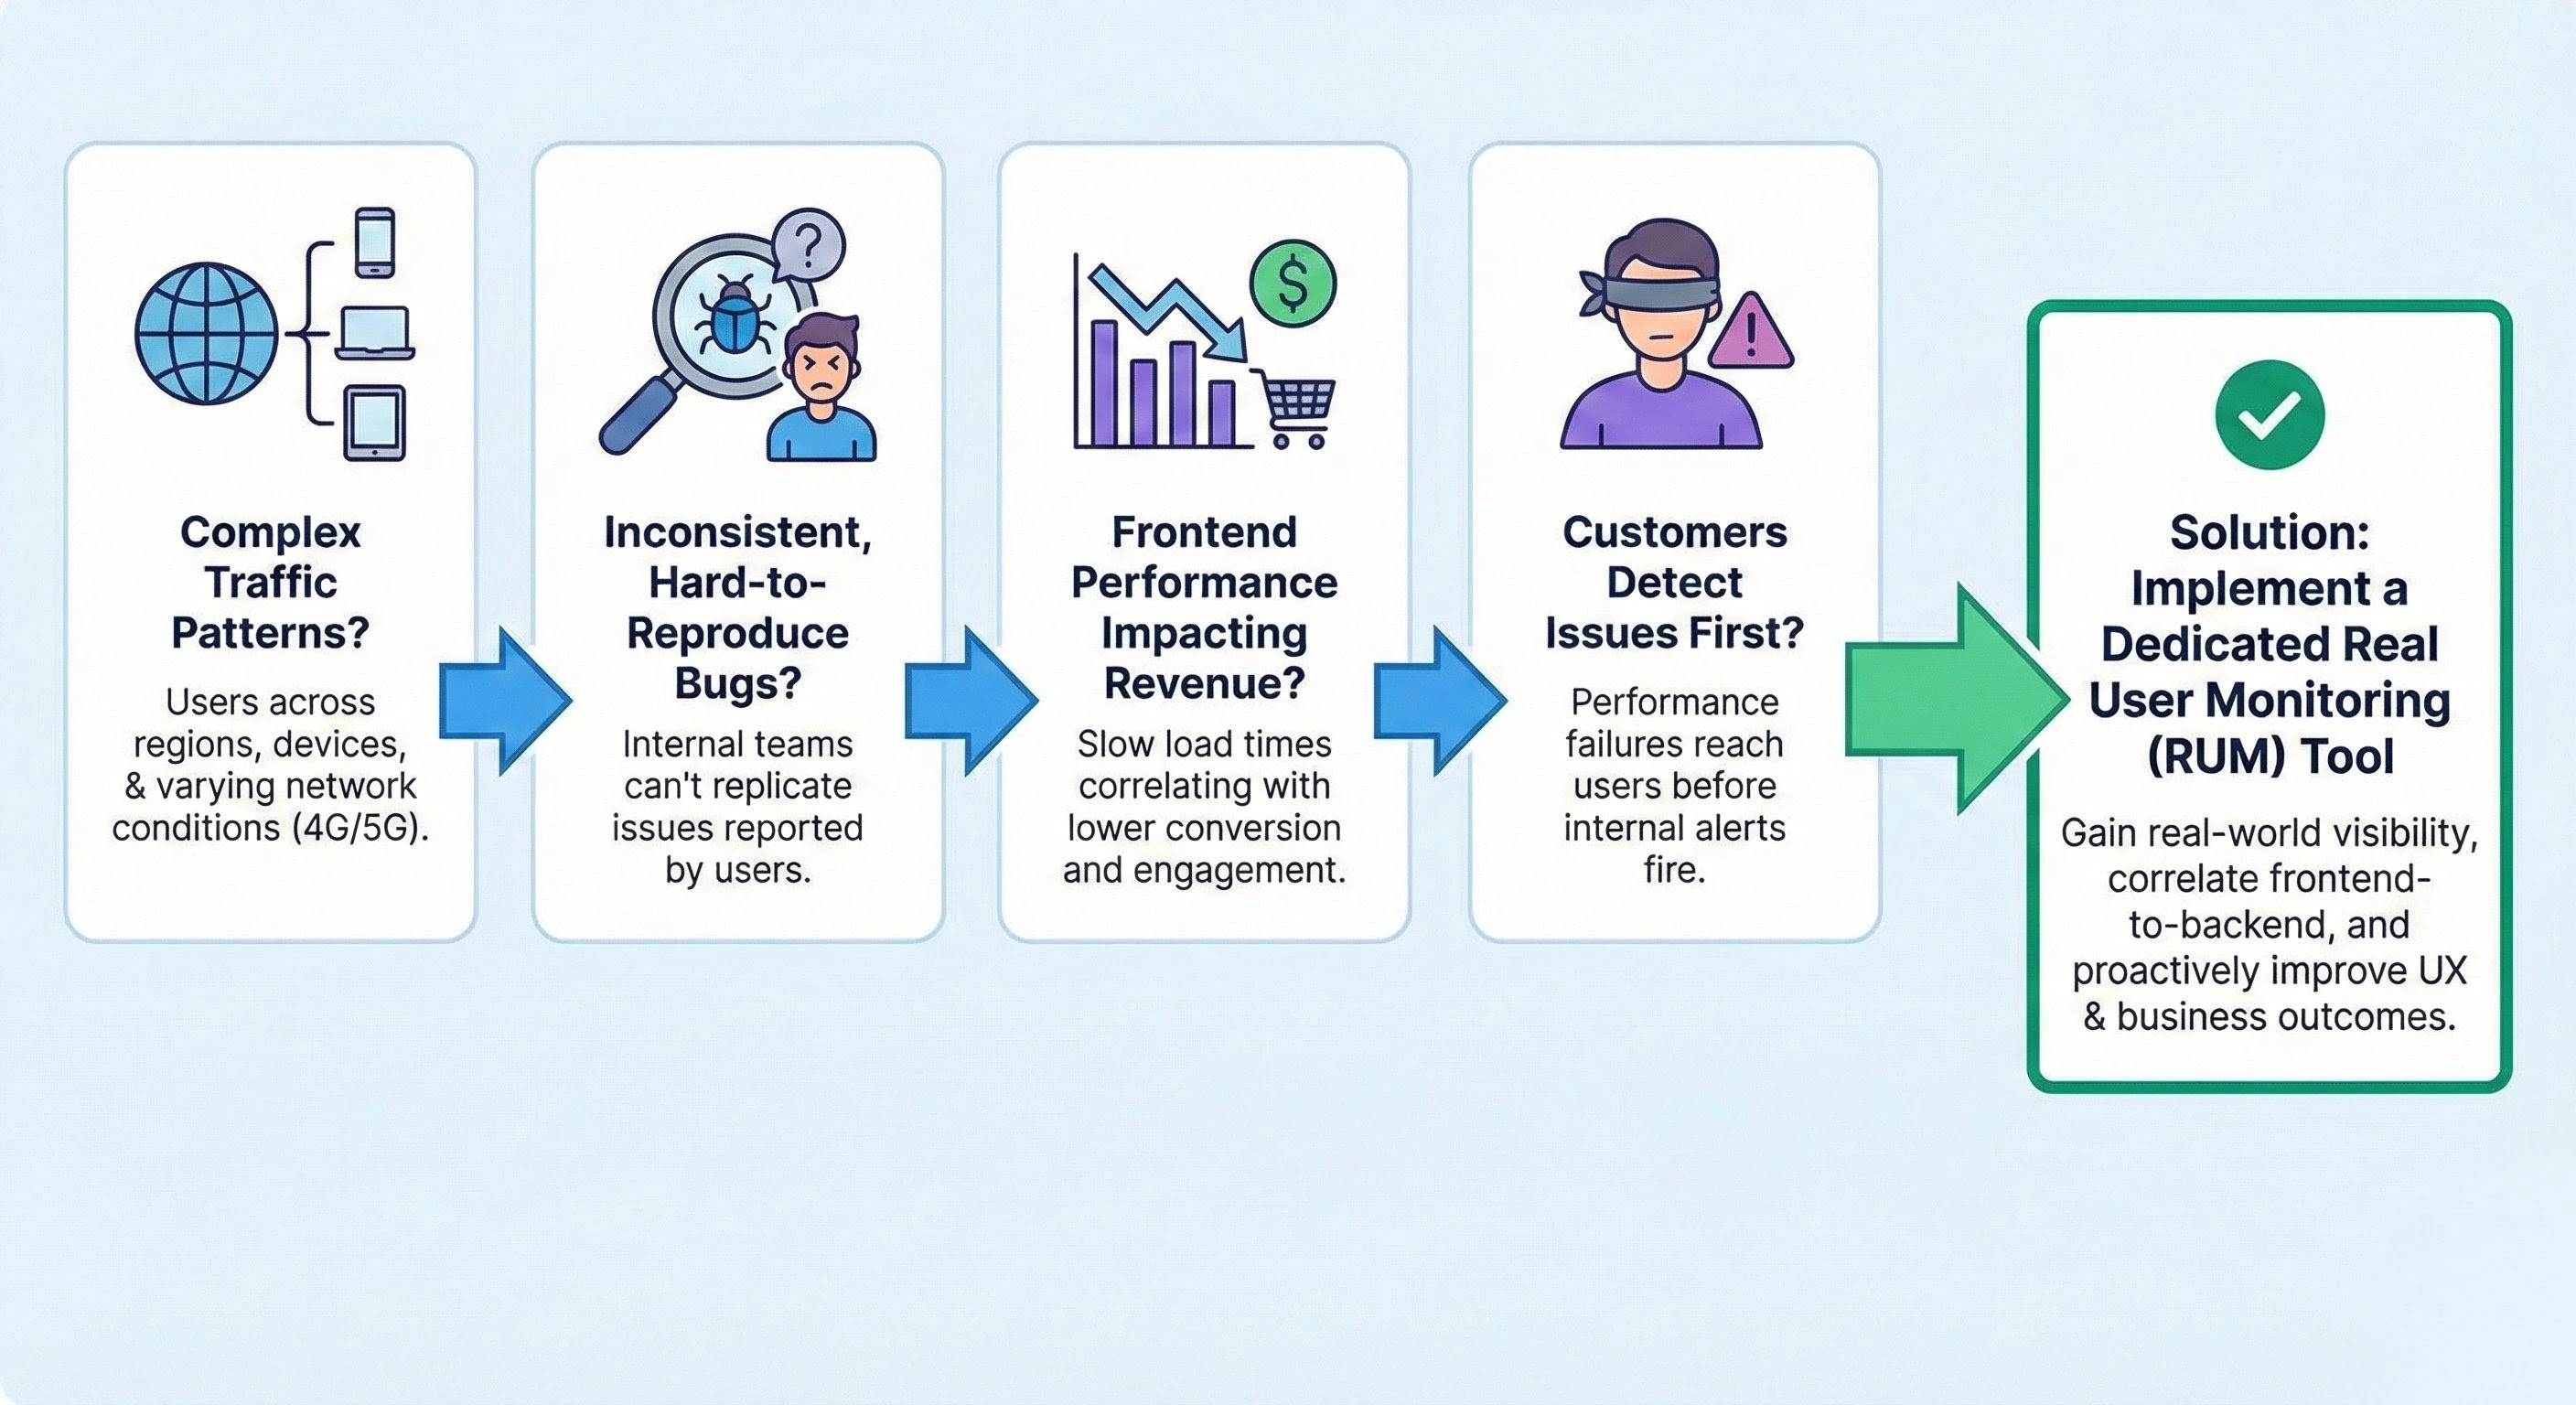
Not every application requires a high-end real user monitoring solution from the first day of launch. However, dedicated RUM becomes a necessity rather than a luxury when:
- Traffic complexity increases: Users access your application from multiple regions, mobile devices, and variable network conditions such as 4G and 5G.
- The “works on my machine” problem persists: Performance issues are reported inconsistently and cannot be reproduced in local or staging environments.
- Business stakeholders demand answers: Product and marketing teams need to understand how frontend delays impact conversions, engagement, and revenue.
- Frontend performance limits growth: Backend systems are optimized, yet user engagement continues to decline.

If your team is frequently hearing about performance failures from customers before your internal monitoring alerts go off, your current visibility is insufficient.
Critical evaluation criteria for RUM solutions
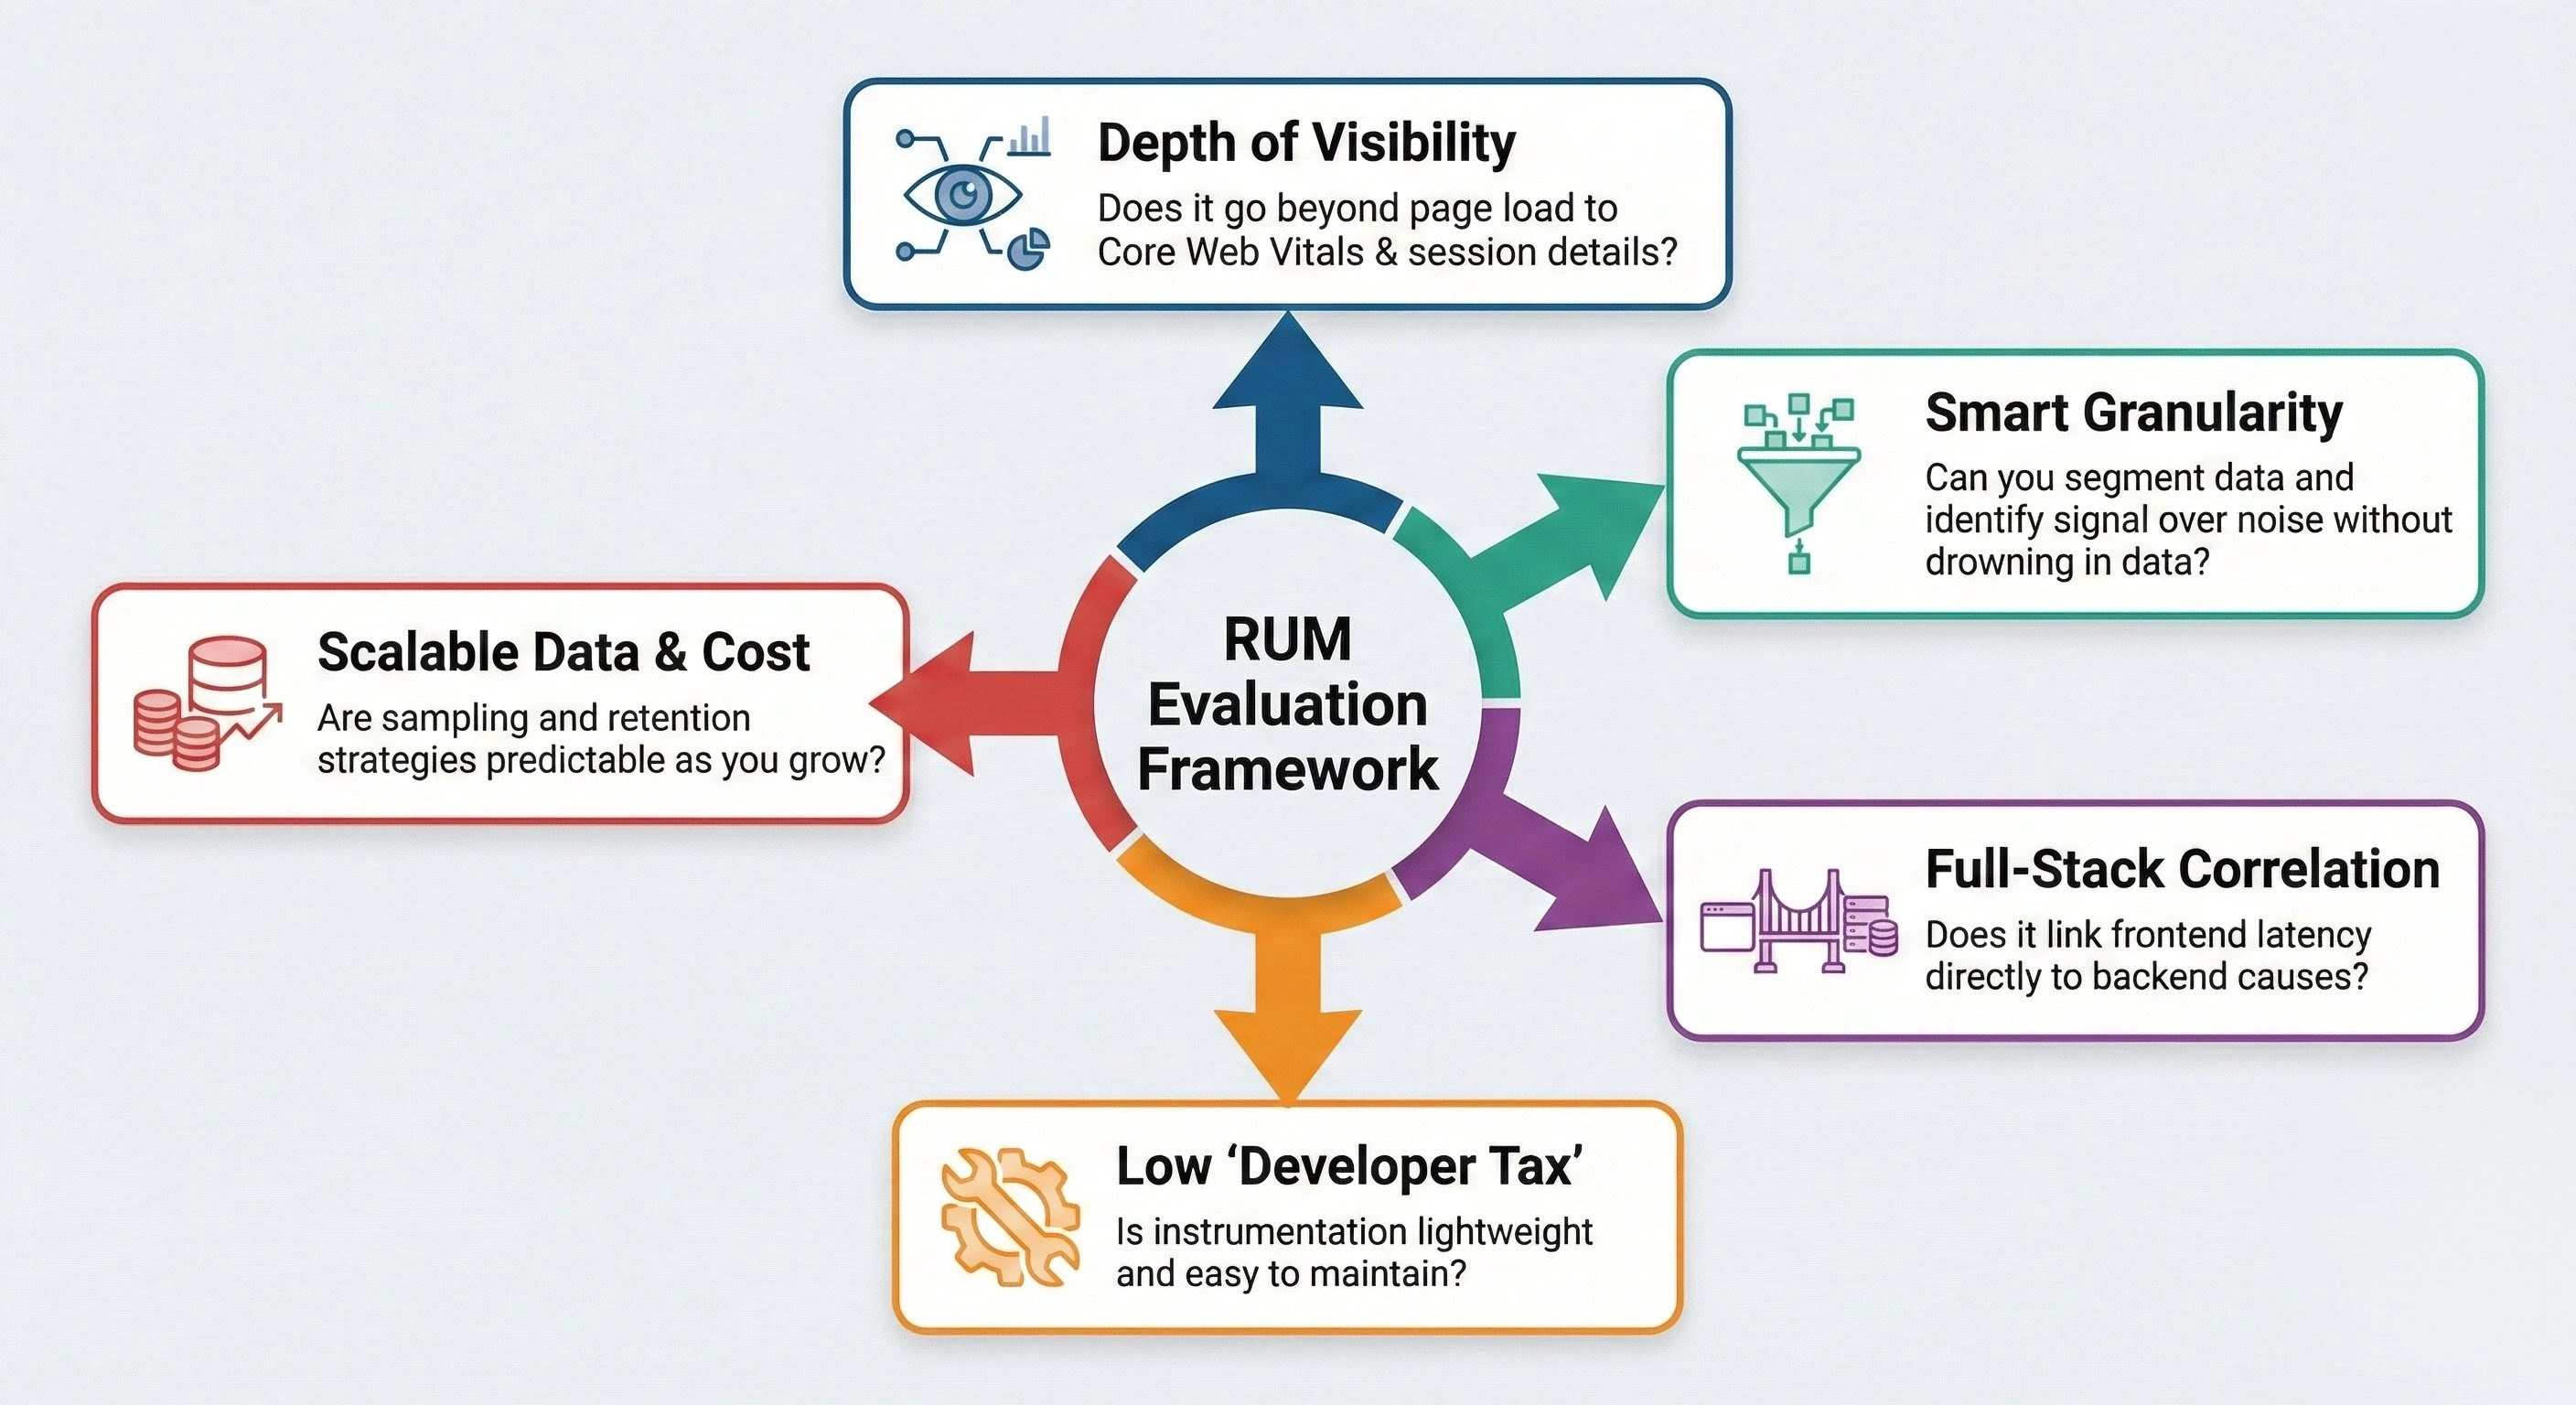
1. Depth of user experience visibility
A modern real user monitoring tool must look past simple page-load metrics. You need to understand the interactivity of the site. This includes:
2. Granularity without the data firehose
RUM tools collect an enormous amount of data. The challenge is not gathering the information, but making it useful. Evaluate whether a tool can:
- Segment intelligently: Can you filter performance by geography, device type, connection speed, or specific page groups like "Checkout" versus "Blog"?
- Surface outliers: Averages are often misleading. You want to see the 95th and 99th percentiles, as these represent the users who are having the worst experiences and are most likely to churn.
- Provide "Signal over noise": If the tool sends an alert for every minor spike, your team will eventually ignore the dashboard. Look for intelligent alerting that recognizes meaningful deviations from the baseline.
3. Closing the gap between frontend and backend
Real user monitoring data tells you that a user experienced a slow page load, but it rarely tells you why on its own. A high-quality solution should act as a bridge.
It should correlate frontend latency with backend performance metrics. For instance, if a page is slow, the tool should show you if the delay was caused by a slow API response, a heavy database query, or a third-party script like an ad-tracker. Reducing the friction between the frontend and backend teams is the fastest way to lower your Mean Time to Resolution (MTTR).
4. Instrumentation and maintenance overhead
Some real user monitoring tools require extensive manual tagging or complex SDK configurations that break every time you update your site. During your evaluation, ask:
- How heavy is the script? A RUM tool that adds 100ms to your page load time is part of the problem, not the solution.
- Is it easy to deploy? Can it be injected via a simple script tag or a Tag Manager without rewriting your application code?
- How much maintenance is required? As you add new features or pages, will the RUM tool automatically pick them up, or will you need to manually configure new "trackers" every time?
5. Data retention and sampling strategies
For high-traffic applications, recording every single user interaction can be prohibitively expensive and technically unnecessary.
- Intelligent sampling: Does the tool allow you to capture 100% of data for critical paths (like the "Buy Now" button) while sampling only 10% of data for less critical pages?
- Retention periods: How long is the granular data kept? You may need several months of data to compare year-over-year performance during peak seasons like Black Friday.
- Cost predictability: Many vendors charge per "event" or "session." Ensure you model your costs based on your highest traffic peaks so you aren't surprised by a massive bill during a successful marketing campaign.

Common oversights in RUM tool selection
- Dashboard glamour: A tool might have beautiful charts, but if you cannot click on a data point to see the underlying cause, it is just a vanity metric tool.
- Ignoring privacy requirements: Ensure the tool allows for easy PII (Personally Identifiable Information) masking. You want to see user behavior without accidentally capturing their passwords or credit card numbers.
- Treating RUM as a standalone tool: RUM is most effective when it is part of a unified observability stack. If your RUM tool doesn't talk to your infrastructure monitoring or your synthetic testing tools, your team will waste time manually stitching data together.
Final checklist for decision makers
- Real-world accuracy: It captures the experience of actual users across all devices and networks.
- Full-stack context: It connects frontend symptoms to backend causes.
- Scalable economics: The pricing model fits your growth without punishing you for increased traffic.
- Operational speed: It provides actionable insights that allow a developer to start a fix within minutes of a reported issue.
The right real user monitoring tool does more than just show you that your site is slow. It tells you exactly who is affected, why it is happening, and what the business impact will be if you don't fix it.
Deep dive: ManageEngine Applications Manager
While many real user monitoring tools are moving exclusively to the cloud, ManageEngine Applications Manager remains a go-to for teams that require "behind the firewall" security or manage massive hybrid environments.
1. Full-stack context in one screen
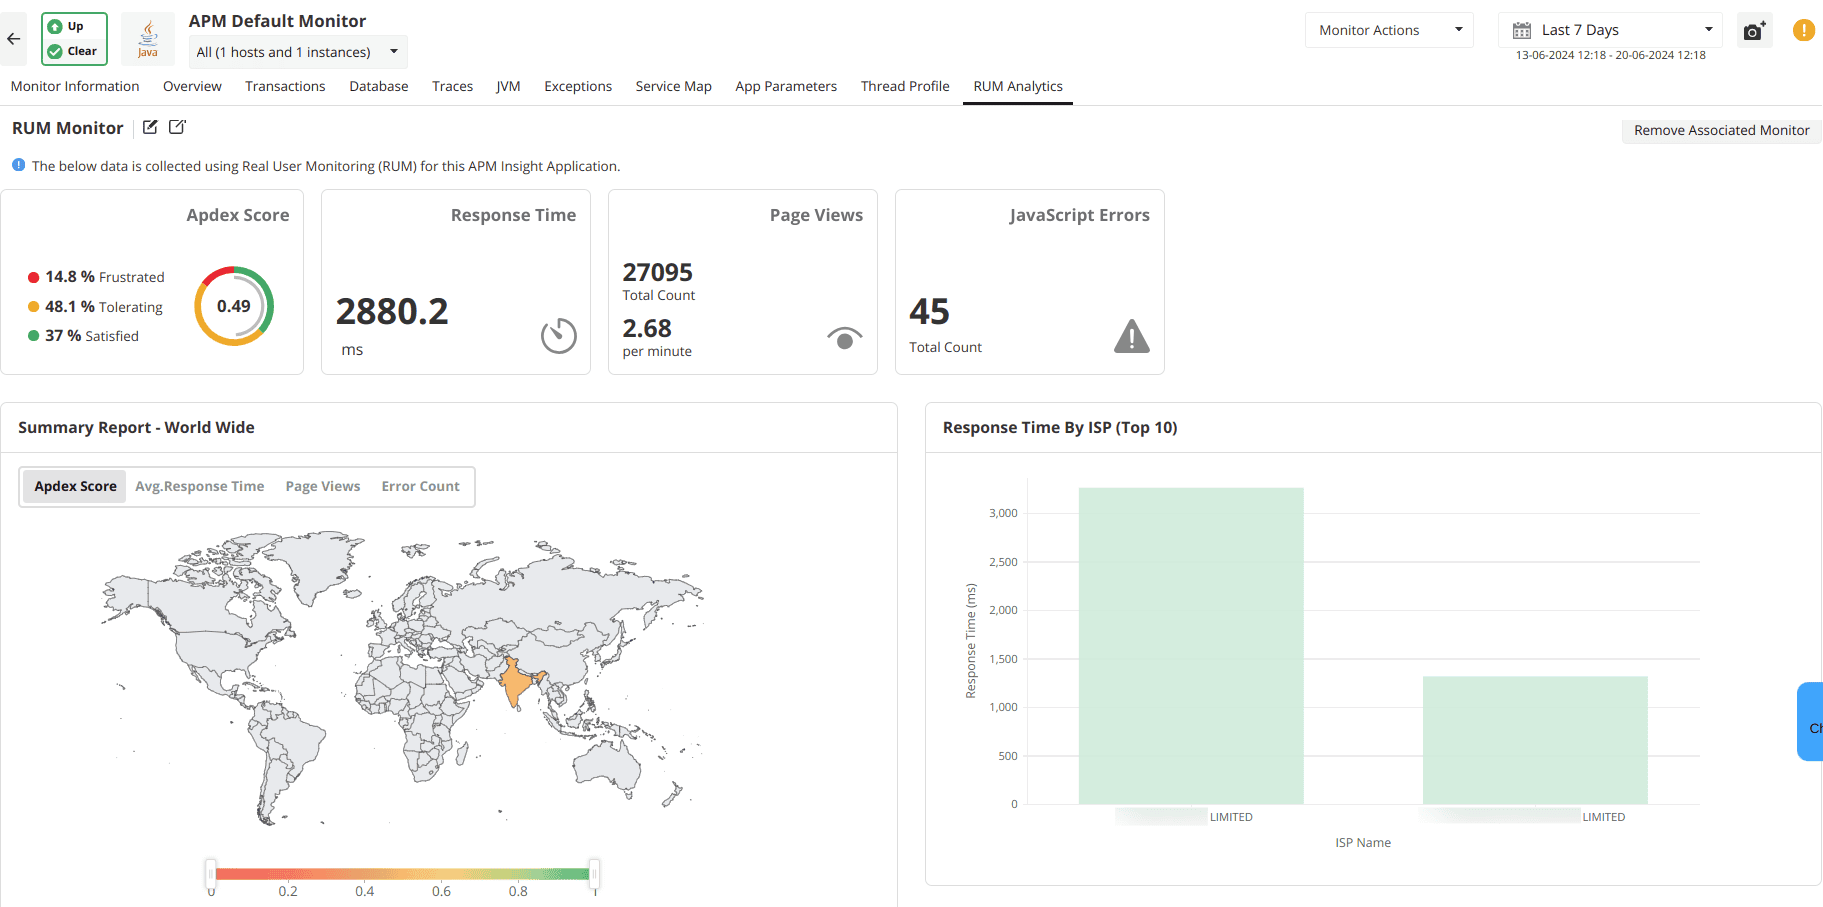
Applications Manager combines real user experience metrics with backend application, database, and server performance in a single analytics view. This enables faster correlation between user-facing issues and infrastructure bottlenecks.
2. Designed for hybrid and legacy environments
Unlike cloud-only RUM tools, Applications Manager supports traditional enterprise technologies such as Oracle databases, SAP systems, and VMware environments alongside modern architectures.
3. Predictable cost model for high-traffic applications
Applications Manager's Pricing is based on monitored applications rather than per-session usage. This prevents unexpected cost spikes during traffic surges or successful campaigns.
4. Behind-the-firewall deployment
Applications Manager can be deployed on-premises, allowing organizations in regulated industries to retain full ownership of user experience data while enforcing local PII masking and compliance policies.

The impact of real user monitoring goes much further than simple metrics and page load times. It serves as a vital strategic asset that allows organizations to maintain high application standards, prepare effectively for future scaling, and protect their digital revenue. By converting complex telemetry into clear and actionable steps, real user monitoring gives technical teams the confidence to move faster while delivering consistent value to the business. With Applications Manager, you have access to a robust real user monitoring platform that centralizes these insights, enabling you to identify bottlenecks before they affect your customers and ensure a flawless digital journey. Try a 30-day, free trial now!

