Using PowerShell scripts to check CPU and memory utilization in Exchange involves running commands that query system resources used by Exchange processes. This typically includes leveraging the Get-Process cmdlet to monitor Exchange-related services and using performance counters for detailed insights. The steps mentioned below can be used to check CPU and memory utilization in your Exchange environment using Windows PowerShell. ManageEngine Exchange Reporter Plus, an extensive tool used for reporting, auditing, monitoring, and creating alerts for critical activities in your Exchange environment, can also be used for this purpose.
The following table is a comparison on how to check CPU and memory utilization in Microsoft Exchange using Windows PowerShell and Exchange Reporter Plus.
Windows PowerShell
Steps to check CPU utilization using Windows PowerShell
- Note down the required parameter Exchserver, where Exchserver refers to the Exchange server for which you would like to check the CPU utilization.
- Execute the following PowerShell script with the required parameter and its value.
- Get-WmiObject
- ComputerName <Exchserver>
- -Class win32_processor
- -ErrorAction Stop
- Measure-Object
- Property LoadPercentage
- Average
- Select-Object
Steps to check memory utilization using the Windows PowerShell:
- Note down the required parameter, Exchserver.
- Execute the following PowerShell script with the required parameter and its value.
- Get-WmiObject
- ComputerName <Exchserver>
- Class win32_operatingsystem
- ErrorAction Stop
Copied
$Memory = ((($ComputerMemory.TotalVisibleMemorySize - $ComputerMemory.FreePhysicalMemory) * 100) / $ComputerMemory.TotalVisibleMemorySize)
$RoundMemory = [math]::Round($Memory, 2)
Click to copy entire script
Exchange Reporter Plus
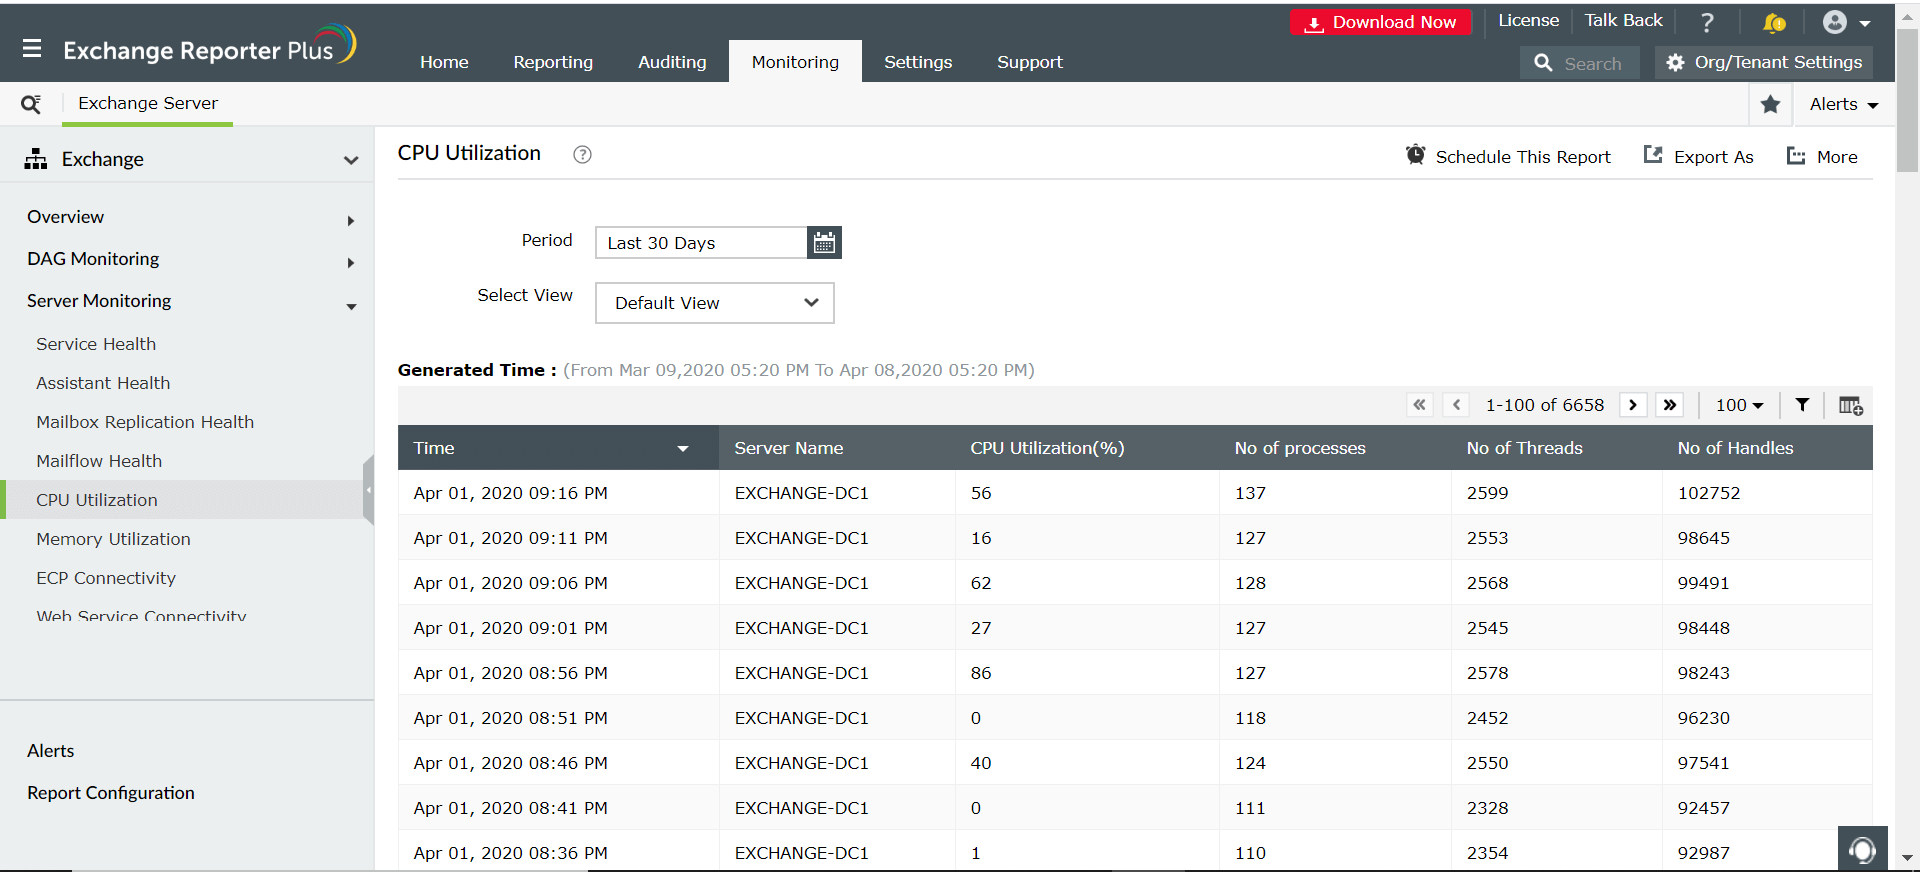
Steps to check CPU utilization using Exchange Reporter Plus
- Log in to Exchange Reporter Plus and navigate to Monitoring > Server Monitoring > CPU Utilization.
- Enter the Period for report generation.
- Select the type of view in which you want the report to be presented.
Steps to check memory utilization using Exchange Reporter Plus
- Log in to Exchange Reporter Plus and navigate to the Monitoring > Server Monitoring > Memory Utilization.
- Enter the Period for report generation.
- Select the type of view in which you want the report to be presented.
Limitations of using Windows PowerShell for checking CPU and memory utilization
- Administrators must have the following permissions if they wish to execute the above-mentioned PowerShell script.
- Local Administrator rights
- The Exchange Organization Management role
- Remote PowerShell access
- Only technicians with PowerShell expertise can execute these commands, and the time-consuming nature of PowerShell scripts can impact productivity.
Benefits of using Exchange Reporter Plus to check CPU and memory utilization
- Eliminate Exchange privilege elevation: Delegate custom roles to technicians to fetch reports regarding your Exchange environment without the need to elevate their native Exchange privileges.
- Script-free reporting: Generate comprehensive reports on various aspects of your Exchange environment without the need to memorize or execute complex PowerShell scripts.
- 24/7 endpoint and service monitoring: Monitor Exchange Server services, databases, database availability groups, storage, and email queues to ensure a hassle-free environment.
- Over 450 intuitive reports: Generate comprehensive reports on all aspects of Exchange Server, Exchange Online, and Skype for Business. These reports can be exported as CSV, HTML, PDF, XLS, or XLSX files.
- Customized audit profiles: Create actions that you want to audit, and schedule profiles to generate audit reports at regular intervals.
- Mailbox content search: Perform pattern- and keyword-based searches to find important information in your organization's mailboxes.
- Real-time alerts: Configure alert profiles to receive immediate SMS or email notifications when a specific alert is triggered.
- Exchange migration: Transfer emails, contacts, tasks, and calendars from Exchange Server to Exchange Online with ease.
Effortlessly check CPU and memory utilization in your Exchange environment.
Try now for free