The Get-HealthReport and Get-ServerHealth cmdlets are used to learn about the health of the Exchange Server and understand if all the services are running as expected, or if there is an issue anywhere.
Examples of Server health cmdlets:
Eg. Get-HealthReport -Identity Exchserver
Using this cmdlet you can retrieve the health information of the server named Exchserver.
Eg. Get-ServerHealth -Identity ExchServer
This cmdlet fetches health stats for server ExchServer.
Though both the cmdlets return almost the same results, they vary when it comes to the alert values they display regarding server status. Exchange Reporter Plus, an Exchange reporting, change auditing and monitoring tool does the data collection job on your behalf and offers reports about the health of of the Exchange Server. You can also configure alerts to get real-time notifications.
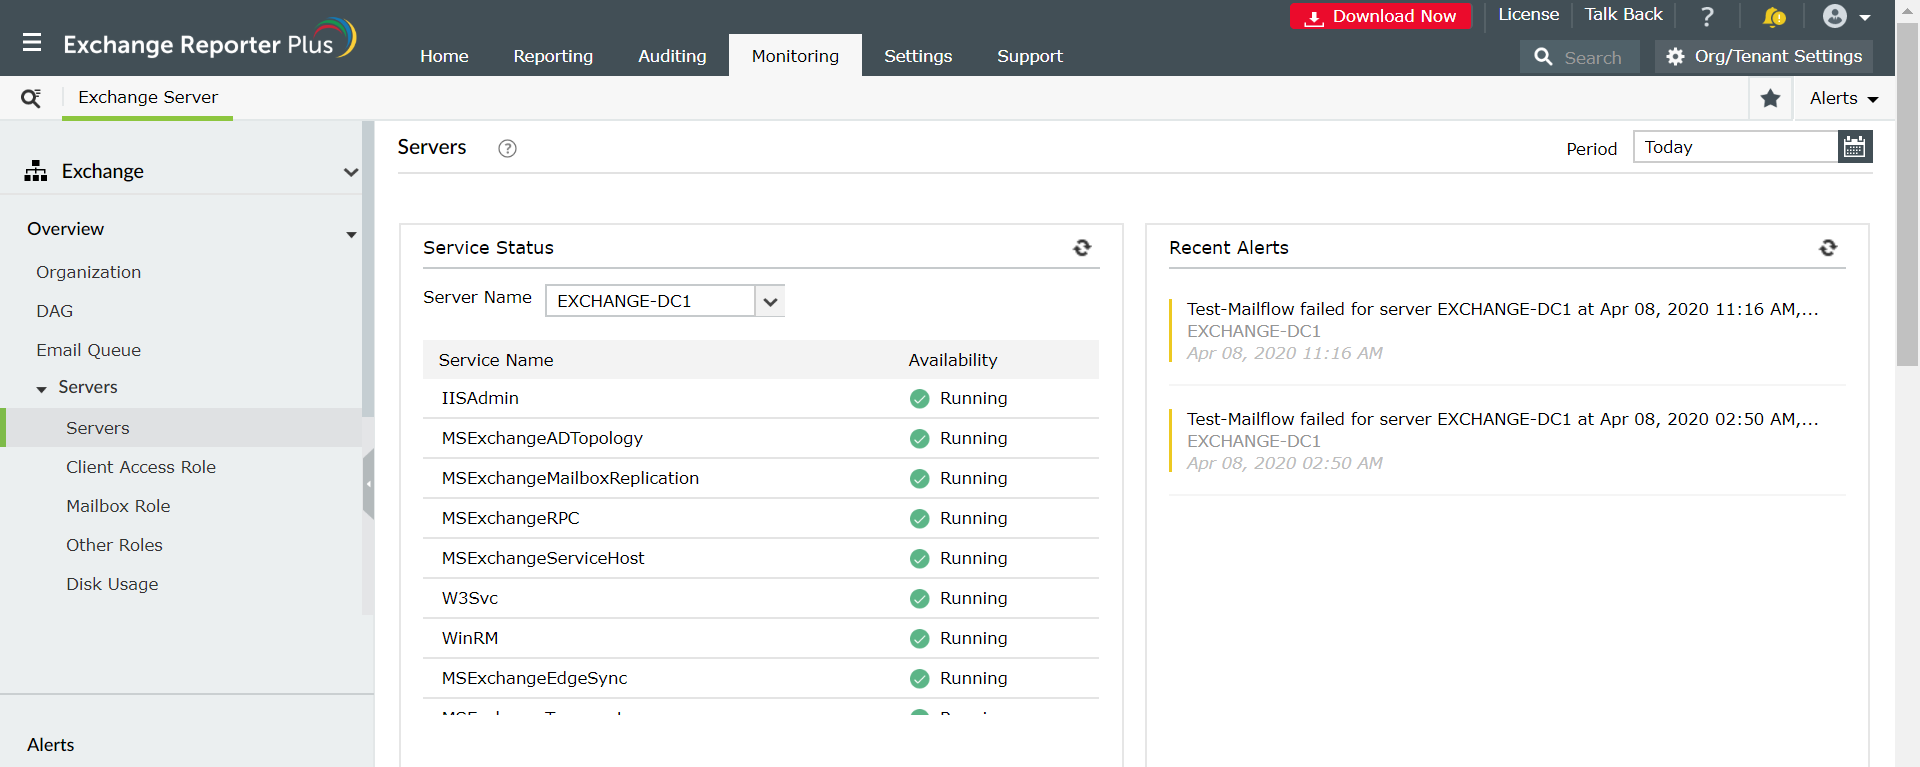
Getting insights about Exchange Server health using Exchange Reporter Plus:
Exchange Reporter Plus offers multiple reports to monitor the Exchange Server health such as service reports, replication stats, CPU, memory utilzation reports and more.
List of Server health monitoring reports available:(Click here to learn more about the reports)
- Service Health
- Assistant Health
- Mailbox Replication Health
- Mailflow Health
- CPU Utilization
- Memory Utilization
- ECP Connectivity
- Web Service Connectivity
- IMAP Connectivity
- POP Connectivity
- ActiveSync Connectivity
- Mailbox Space Health
- Hub transport health
- Store Health
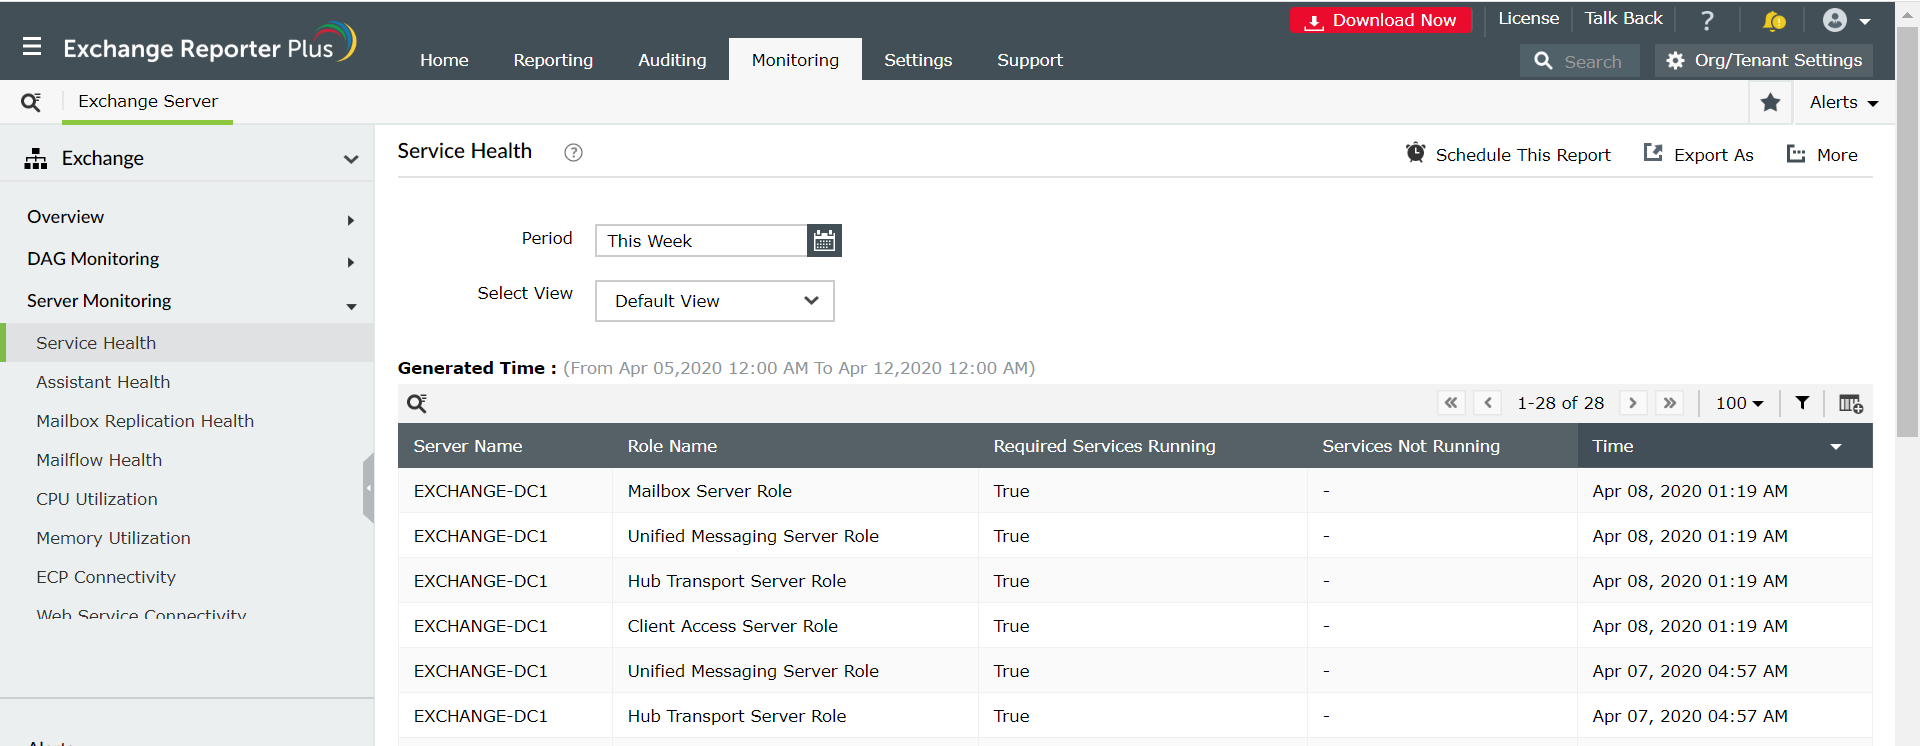
Steps to generate Database Availability Group reports in Exchange Reporter Plus:
- Go to the Monitoring tab on the top pane.
- Expand the Server Monitoring drop-down.
- Choose a report from the set of reports available.
- Enter a period for report generation.
- Select a view before you generate the report (summary, default or custom view).
Choose Exchange Reporter Plus to meet your monitoring needs:
- Report Scheduling: Schedule reports to generate them automatically and send them to concerned authorities such as IT admins and managers through email.
- Quick access and export options: Add reports as favourites to access them easily and export reports to different file formats: such as PDF, HTML, XLS and CSV.
- Filter and alerting options: Add or remove columns from the report generated to view information relevent to your needs. Use advanced filters options available to customize your search and configure alerts for auditing and monitoring reports and receive immediate notifications through email or SMS.
- Technician Delegation: Delegate different reports to different technicians. Have control over who gets access to what.
- Easy-to-analyse reports: Generate reports on periodic basis, per domain basis, tenant-wise or get an overall summary as you choose. Get graphical and dashboard representation of complex analytical data.
Click here to learn more about how Exchange Reporter Plus reports helps eliminate long hours of PowerShell scripting.