The Get-DatabaseAvailabilityGroup cmdlet is used to retrieve status and other information about various DAGs available in your Exchange organization. DAGs are the secondary storage objects that act as backups and copies for all the logs in Exchange Server’s primary database (if you choose to make copies).
Examples of Get-DatabaseAvailabilityGroup cmdlets:
Eg. Get-DatabaseAvailabilityGroup ExchBackup1 | Format-List
You can use this cmdlet to fetch real-time status about the ExchBackup2 DAG.
These cmdlets might look simple and easy. But the real trick is when you keep adding parameters to refine your search. Typing long PowerShell cmdlets can become tedious and time-consuming. The meticulous work of looking for errors like a misplaced comma or wrongly-placed hyphen can add more burden. But don't worry, Exchange Reporter Plus offers a way out.
Getting insights into DAG using Exchange Reporter Plus:
Exchange Reporter Plus offers multiple reports that provide all the information you need to know about the status and health of your DAGs.
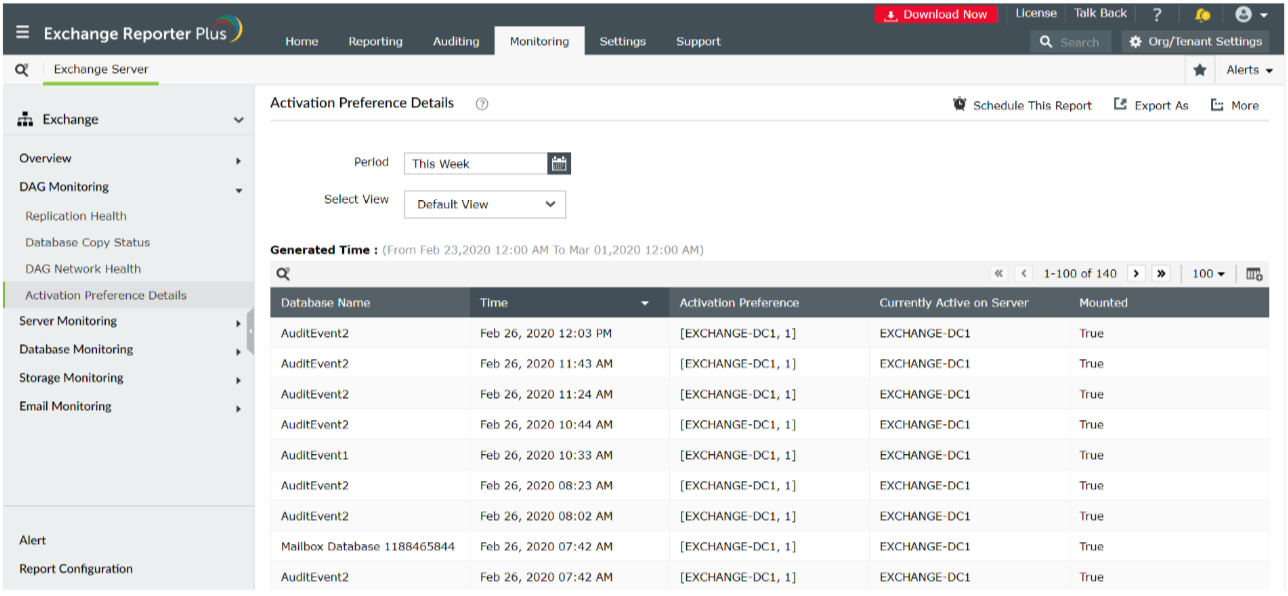
List of DAG monitoring reports available: For Exchange Server:
- Replication Health: Shows the replication status of the DAG.
- Database Copy Status: Displays the status of DB copies being made and stored in the DAG.
- DAG Network health: Generates data about the status and connectivity to network
- Activation Preference Details: Shows the list of the DAGs active and running.
- Database Availability Groups: (under Organization reports): Lists all the database availability groups and their details.
Steps to generate Database Availability Group reports in Exchange Reporter Plus:
- Go to the Monitoring tab on the top pane.
- Expand the DAG Monitoring drop-down.
- Choose a report from the set of reports available.
- Enter a period for report generation.
- Select a view before you generate the report (summary, default or custom view).
Here’s why you must monitor your organization using Exchange Reporter Plus!
- Report Scheduling: Schedule reports to generate them automatically and send them to concerned authorities such as IT admins and managers through email.
- Export options: Export reports to different file formats: such as PDF, HTML, XLS and CSV.
- Filter and alerting options: Add or remove columns from the report generated to view information relevent to your needs. Use advanced filters to customize your search, and configure alerts for auditing and monitoring reports and receive immediate notifications through email or SMS.
- Technician Delegation: Delegate different reports to different technicians. Have control over who gets access to what.
- Easy-to-analyse reports: Generate reports on periodic basis, per domain basis, tenant-wise or get an overall summary as you choose. Get graphical and dashboard representation of complex analytical data.
Click here to learn more about Exchange Reporter Plus and how its reports act as an alternative for complex PowerShell codes.