The Test-MAPIConnectivity cmdlet is used to check the MAPI connectivity of a particular mailbox. This cmdlet does that by trying to ping the specified mailbox server and waiting for the response.
Examples of Test-MAPIConnectivity cmdlet:
Test-MapiConnectivity -Server "ExchSer1"
This cmdlet is used to test the connectivity of ExchSer1 server.
Test-MapiConnectivity -Identity "Marketing/Harry"
This cmdlet is used to test the connectivity of the mailbox of user Harry.
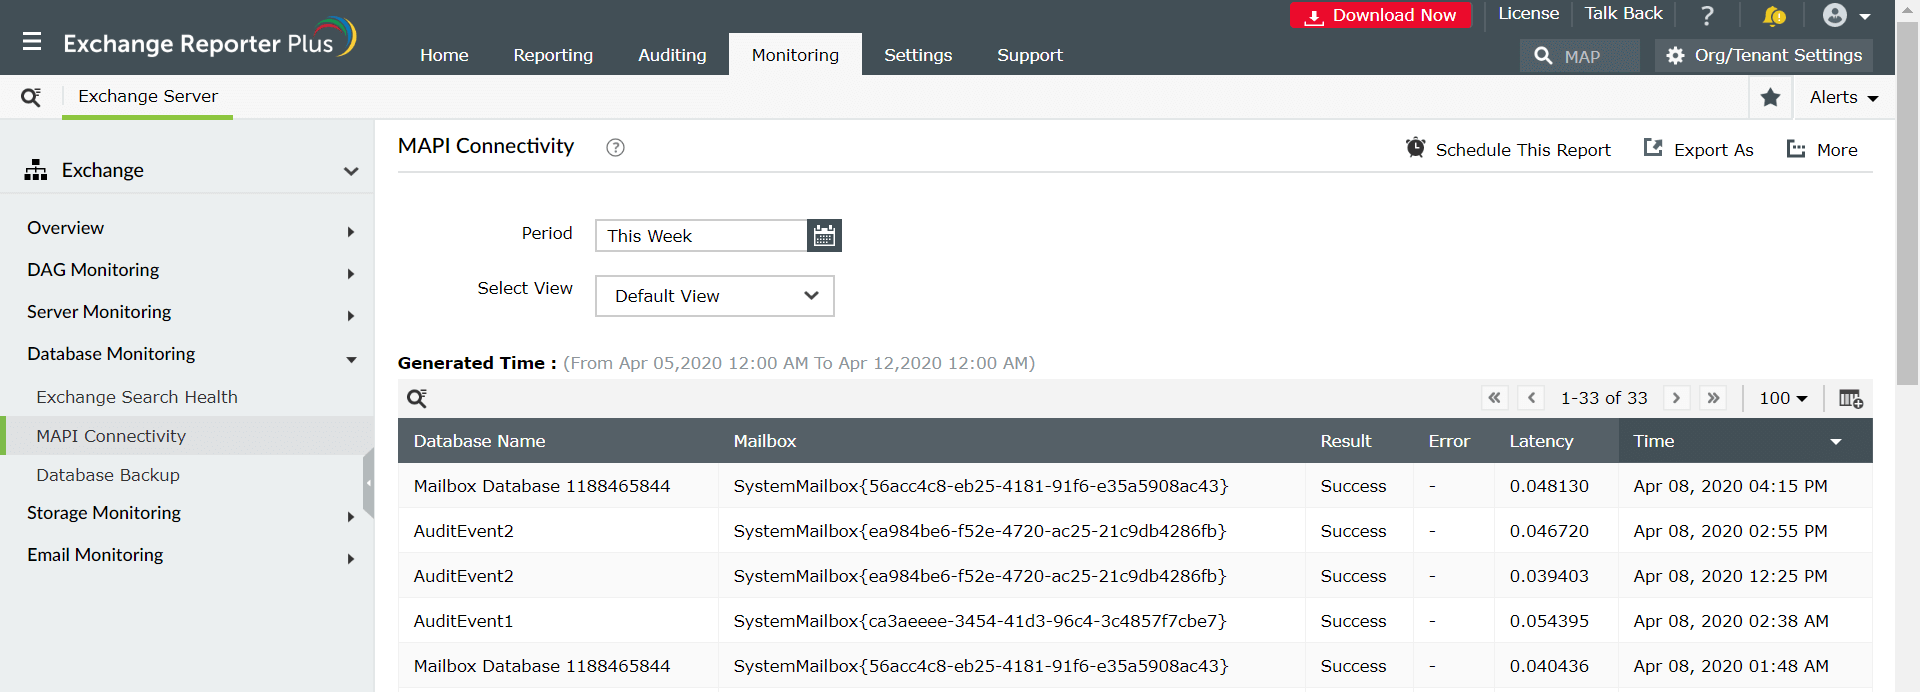
Exchange Reporter Plus, an Exchange reporting, change auditing and monitoring tool does more than just simply testing the connectivity of an Exchange server. This monitoring tool presents to you granular details such as the time when the connection was attempted, errors if any, the latency periods and more.
Steps to generate MAPI connectivity report using Exchange Reporter Plus:
- Go to the Monitoring tab on the top pane.
- Select Database Monitoring on left side.
- From the drop-down choose the MAPI Connectivity report.
- Enter the period for report generation.
- Select the type of view in which you want the report to be presented. (Summary, default or custom view).
Highlights of using Exchange Reporter Plus:
- Report Scheduling: Generate reports automatically at scheduled times, and send them to the concerned personnel such as IT admins and managers through email.
- Quick access and export options: Add reports to your favorites list to access them easily; Also export reports in different file formats such as PDF, HTML, XLS and CSV.
- Filter and alerting options: Add or remove columns from reports to view information relevant to your needs. Use advanced filters options to customize your search and configure real-time alerts for specific actions of interest.
- Technician Delegation: Delegate different reports to different technicians. Have control over who gets access to what. You can also protect your reports with passwords.
- Easy-to-analyse reports: Generate reports on a periodic basis, per domain basis, tenant-wise or get an overall summary as you choose. Get graphical and dashboard representation of complex analytical data.
- Log Forwarding to SIEM solutions: Integrate with other SIEM solutions such as Splunk and forward logs to them for analytical purposes.
Click here to learn more about how Exchange Reporter Plus simplifies complex Exchange and PowerShell tasks.