As a network administrator, a critical and sometimes unplanned task involved in an IT infrastructure upkeep is creating and archiving actionable reports. Usually, such reports are quickly made and brought together when upper management needs help in making important decisions on capacity additions/ device upgrades/ SLA verifications. Your 24/7 network monitoring tool would have a lot of captured data accumulating to gigabytes of disk space, but it is the tool's ability to provide immediate, intelligent reports that make the difference in running a well-planned and optimized IT infrastructure.
ManageEngine OpManager: The extensive network performance reporting solution
OpManager's extensive reporting feature stores all the monitored network and device health information in its in-built PGSQL/MSSQL database for immediate retrieval. The reports section has several flexible options that help to create customized and actionable reports quickly such as:
OpManager provides a simple interface with more than 250 default bundled reporting profiles, all intuitively grouped and classified based on different factors such as health and performance, availability and response, inventory, storage, server, forecast and capacity planning, and much more. You can export these reports in the form of PDF or Excel to understand historical data patterns, analyze growth trends, and forecast future resource usage. This helps you perform effective capacity planning and avert indiscriminate storage purchases.
With OpManager's reporting, you can create filters to create reports based on specific business views or groups. Also, you can copy, print, or email these reports as you require.
Custom reports
Reports in OpManager is an aggregation of the monitored data. While there are more than 250 default reports available on the UI, users can generate custom reports based on their preferences. Sometimes, IT admins may need reports which cover particular data, say a report is needed on the firmware versions used by storage devices that are grouped based on the vendor model. Using advanced reports, you can simply create a new report for the needed information by specifying the criteria.
You can also generate a report for selected devices/interfaces from the inventory page. These reports can be generated in a graphical view or table view based on the selected monitors. OpManager also enables you to create customized reports, particularly for virtual machines/servers. (By default, OpManager holds the monitored data of virtual machines as virtual server reports.)
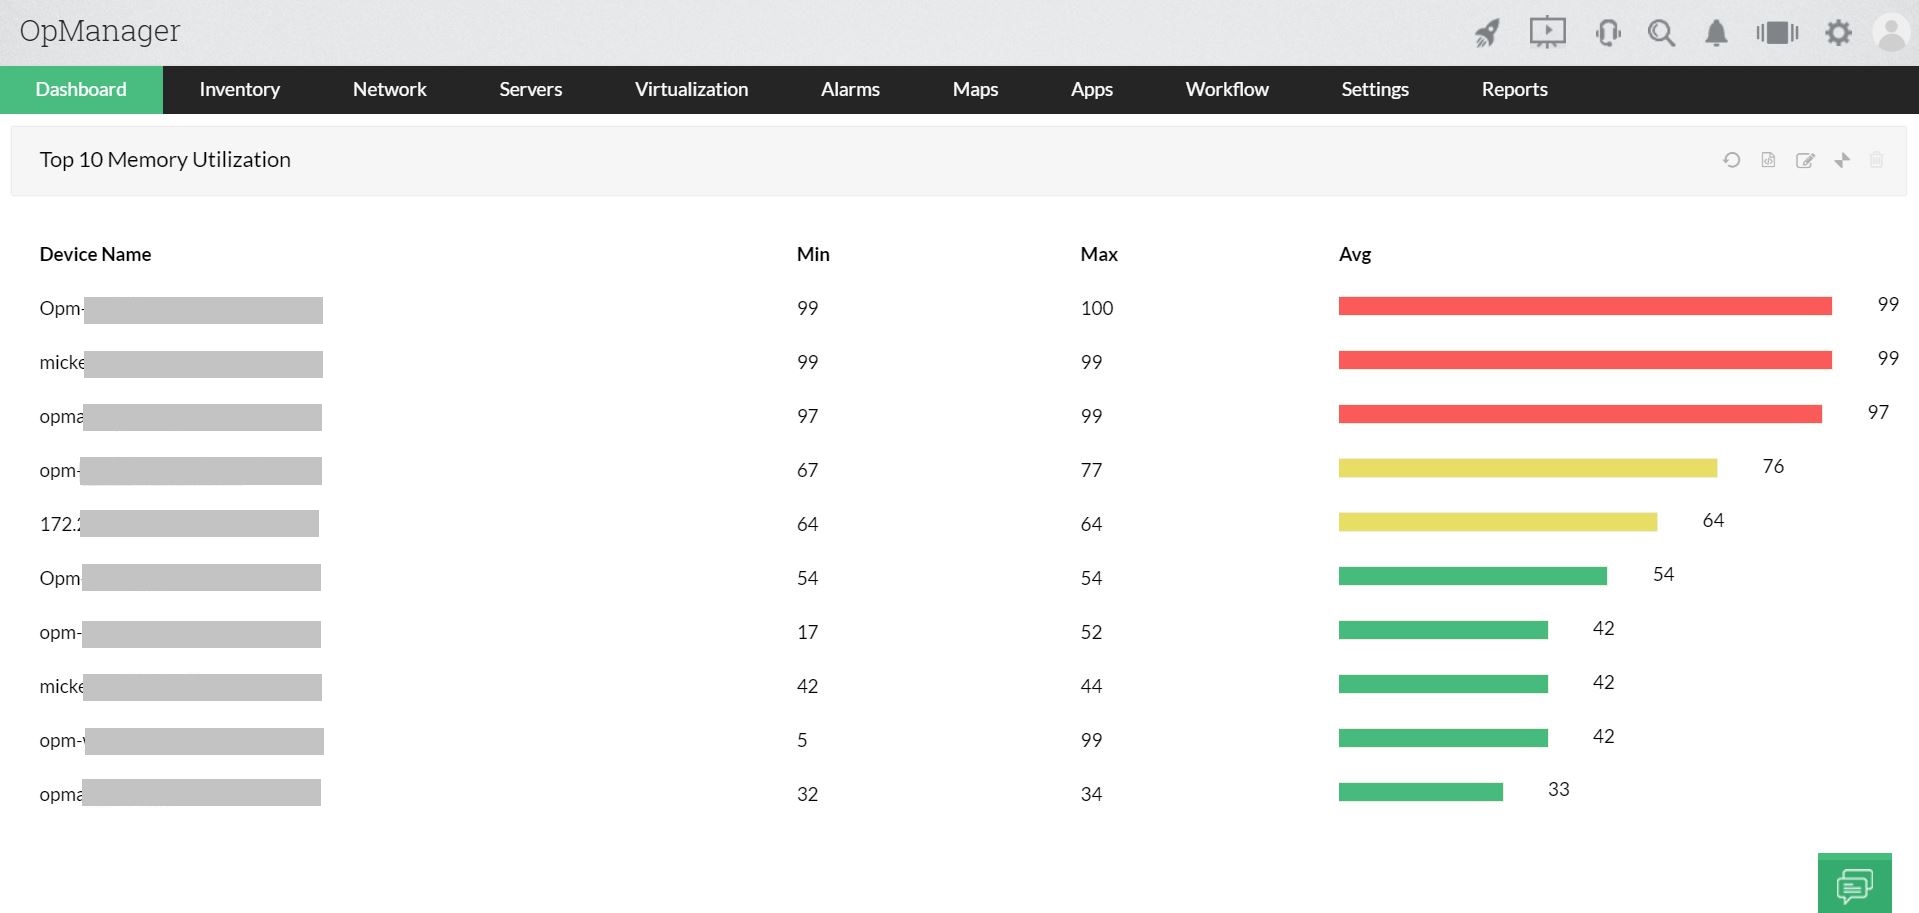
Top N reports: On resource performance or availability
OpManager's in-built reports can be arranged to display interfaces or devices with the highest amounts of CPU utilization, memory utilization, disk utilization, incoming and outgoing traffic, interface errors, response times, etc..This way, you'll gain insights into the devices consuming high resources in a glimpse and take immediate actions as necessary to prevent application crashes or network downtime. Learn more.
Scheduled, automated emailing of periodic reports
With OpManager's report scheduler, you can automate the creation of reports and also configure to schedule these reports to concerned technicians on a periodical basis. You'll also have the option to send the report as PDF or XLS. While scheduling, you can configure to exclude certain days and send data for the rest. For example, you can create and schedule report for weekly performance reports on servers' memory utilization excluding Saturdays.
"I have a long-standing relationship with ManageEngine. OpManager has always missed one or two features that would make it truly the best tool on the market, but over it is the most comprehensive and easy to use the product on the market."
OpManager
Easy Implementation, Excellent Support & Lower Cost Tool
- Team Lead, IT Service Industry
Review Role: Infrastructure and OperationsCompany Size: 500M - 1B USD
"We have been using OpManager since 2011 and our overall experience has been excellent. The tool plays a vital role in providing the value to our organisation and to the customers we are supporting. The support is excellent and staff takes full responsibilities in resolving the issues. Innovation is never stopping and clearly visible with newer versions"
OpManager
Easy Implementation With A Feature Rich Catalogue, Support Has Some Room For Improvement
- NOC Manager in IT Service Industry
Review Role: Program and Portfolio ManagementCompany Size: 500M - 1B USD
"The vendor has been supporting during the implementation & POC phases providing trial licenses. Feature requests and feedback is usually acted upon swiftly. There was sufficient vendor support during the implementation phase. After deployment, the support is more than adequate, where the vendor could make some improvements."
OpManager
Great Monitoring Tool
- CIO in Finance Industry
Review Role: CIOCompany Size: 1B - 3B USD
"Manage Engine provides a suite of tools that have made improvements to the availability of our internal applications. From monitoring, management and alerting, we have been able to peak performance within our data center."
OpManager
Simple Implementation, Easy To Use. Very Intuitive.
Hinduja Global Solutions (HGS) is an Indian business process management (BPM) organization headquartered in Bangalore and part of the Hinduja Group. HGS combines technology-powered automation, analytics, and digital services focusing on back office proces
One of the largest radiology groups in the nation, with a team of more than 200 board-certified radiologists, provides more than 50 hospital and specialty clinic partners with on-site radiology coverage and interpretations.
Vabi is a Netherlands-based company that provides "real estate data in order, for everyone." Since 1972, the company has focused on making software that calculates the performance of buildings. It has since then widened its scope from making calculations