Security Snapshot
"Security snapshot" gives you details of the problems classified under classes for the time period selected by the user. Users can select the time period for which they need to see the security events. Every class has a pie chart and Time distribution graph, making it easier to understand the contribution of each problem in that class. The Time distribution graph shows a line graph with respect to time and number of events. You can click and drag the mouse pointer on the graph to zoom in / select a particular time on the graph to see time-specific reports of the problems.
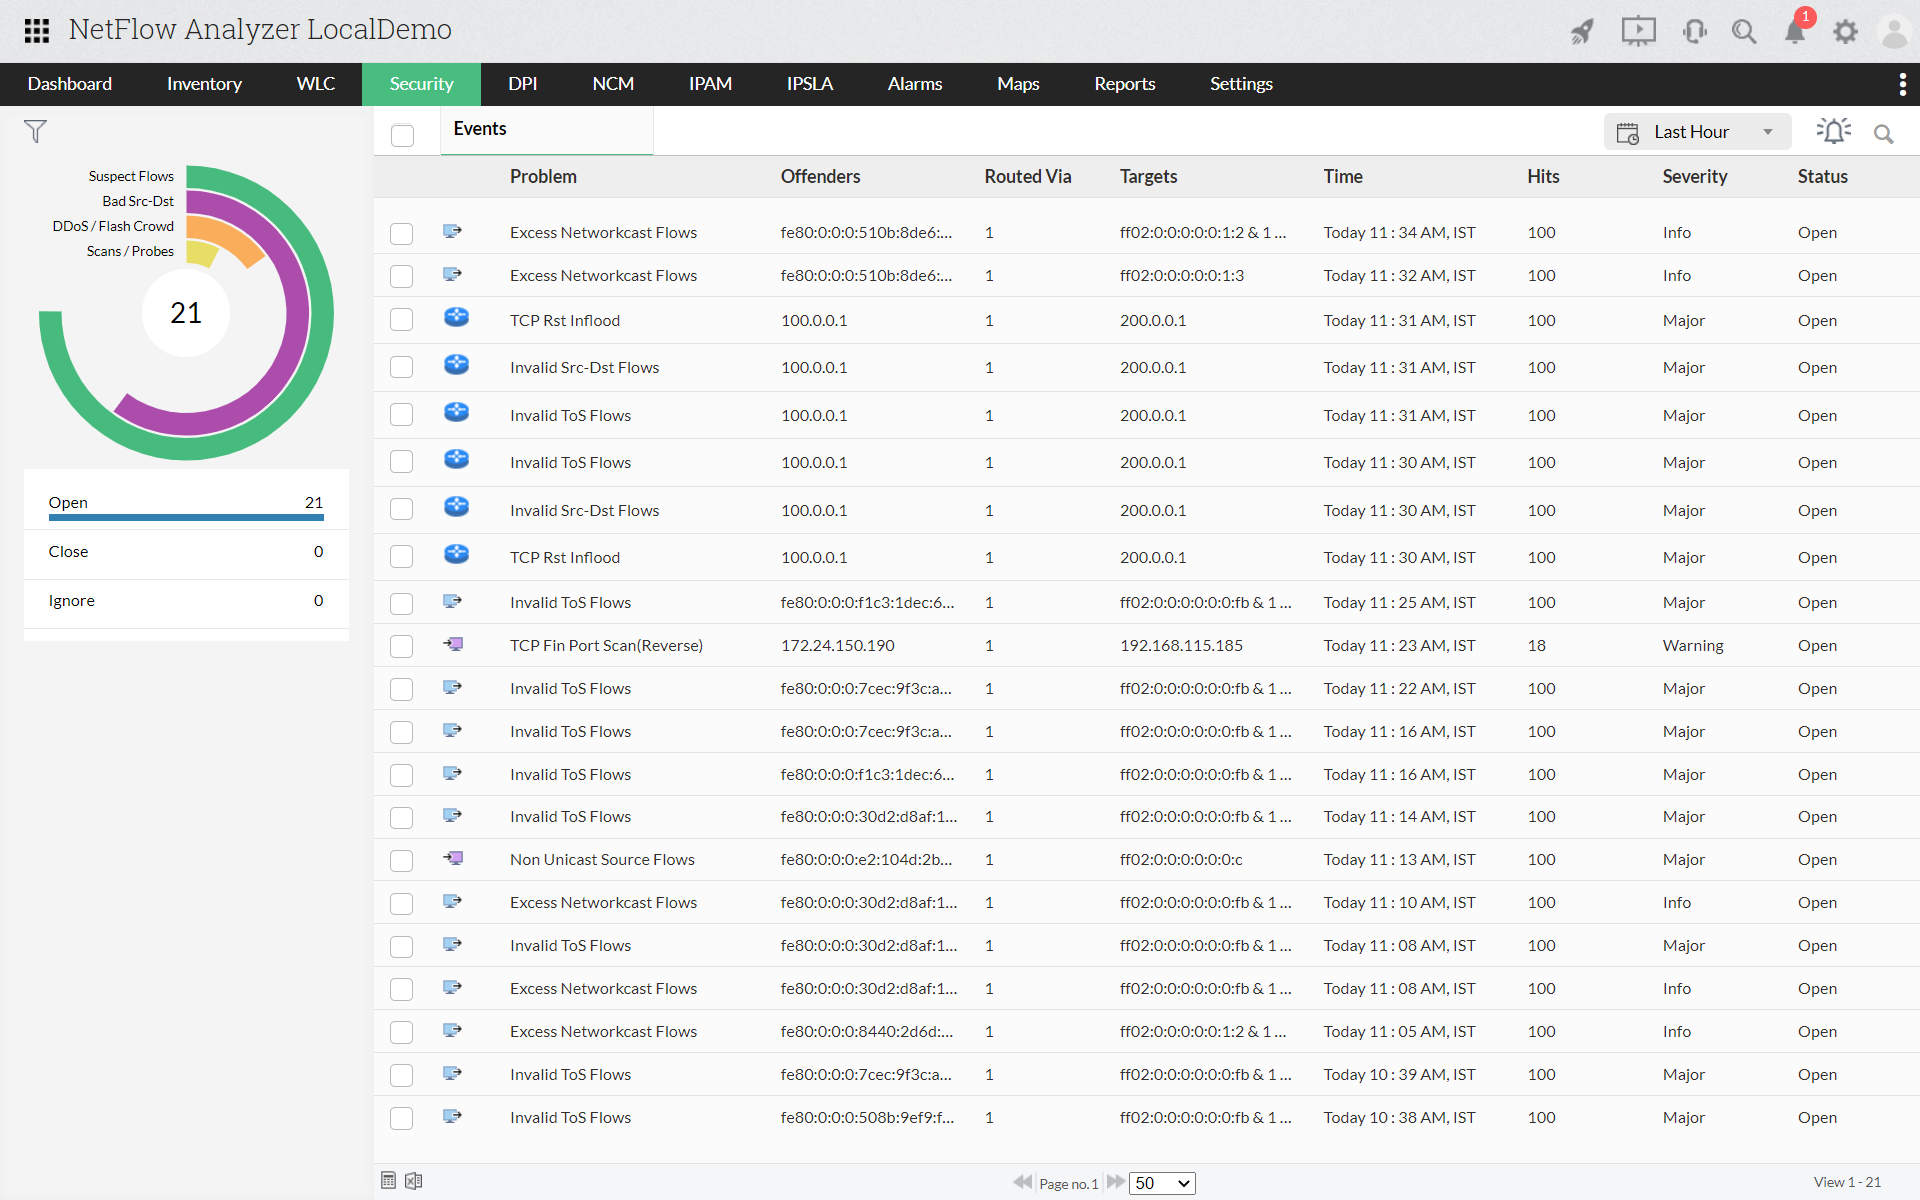
Event List
Event list gives a list of all the events along with details, such as problem name, offenders IP(s), target IP(s), router name, severity, time of the attack. From this view, you can ignore certain events by giving criteria. You can also discard trusted flows to be harmless and that will not be taken into account.
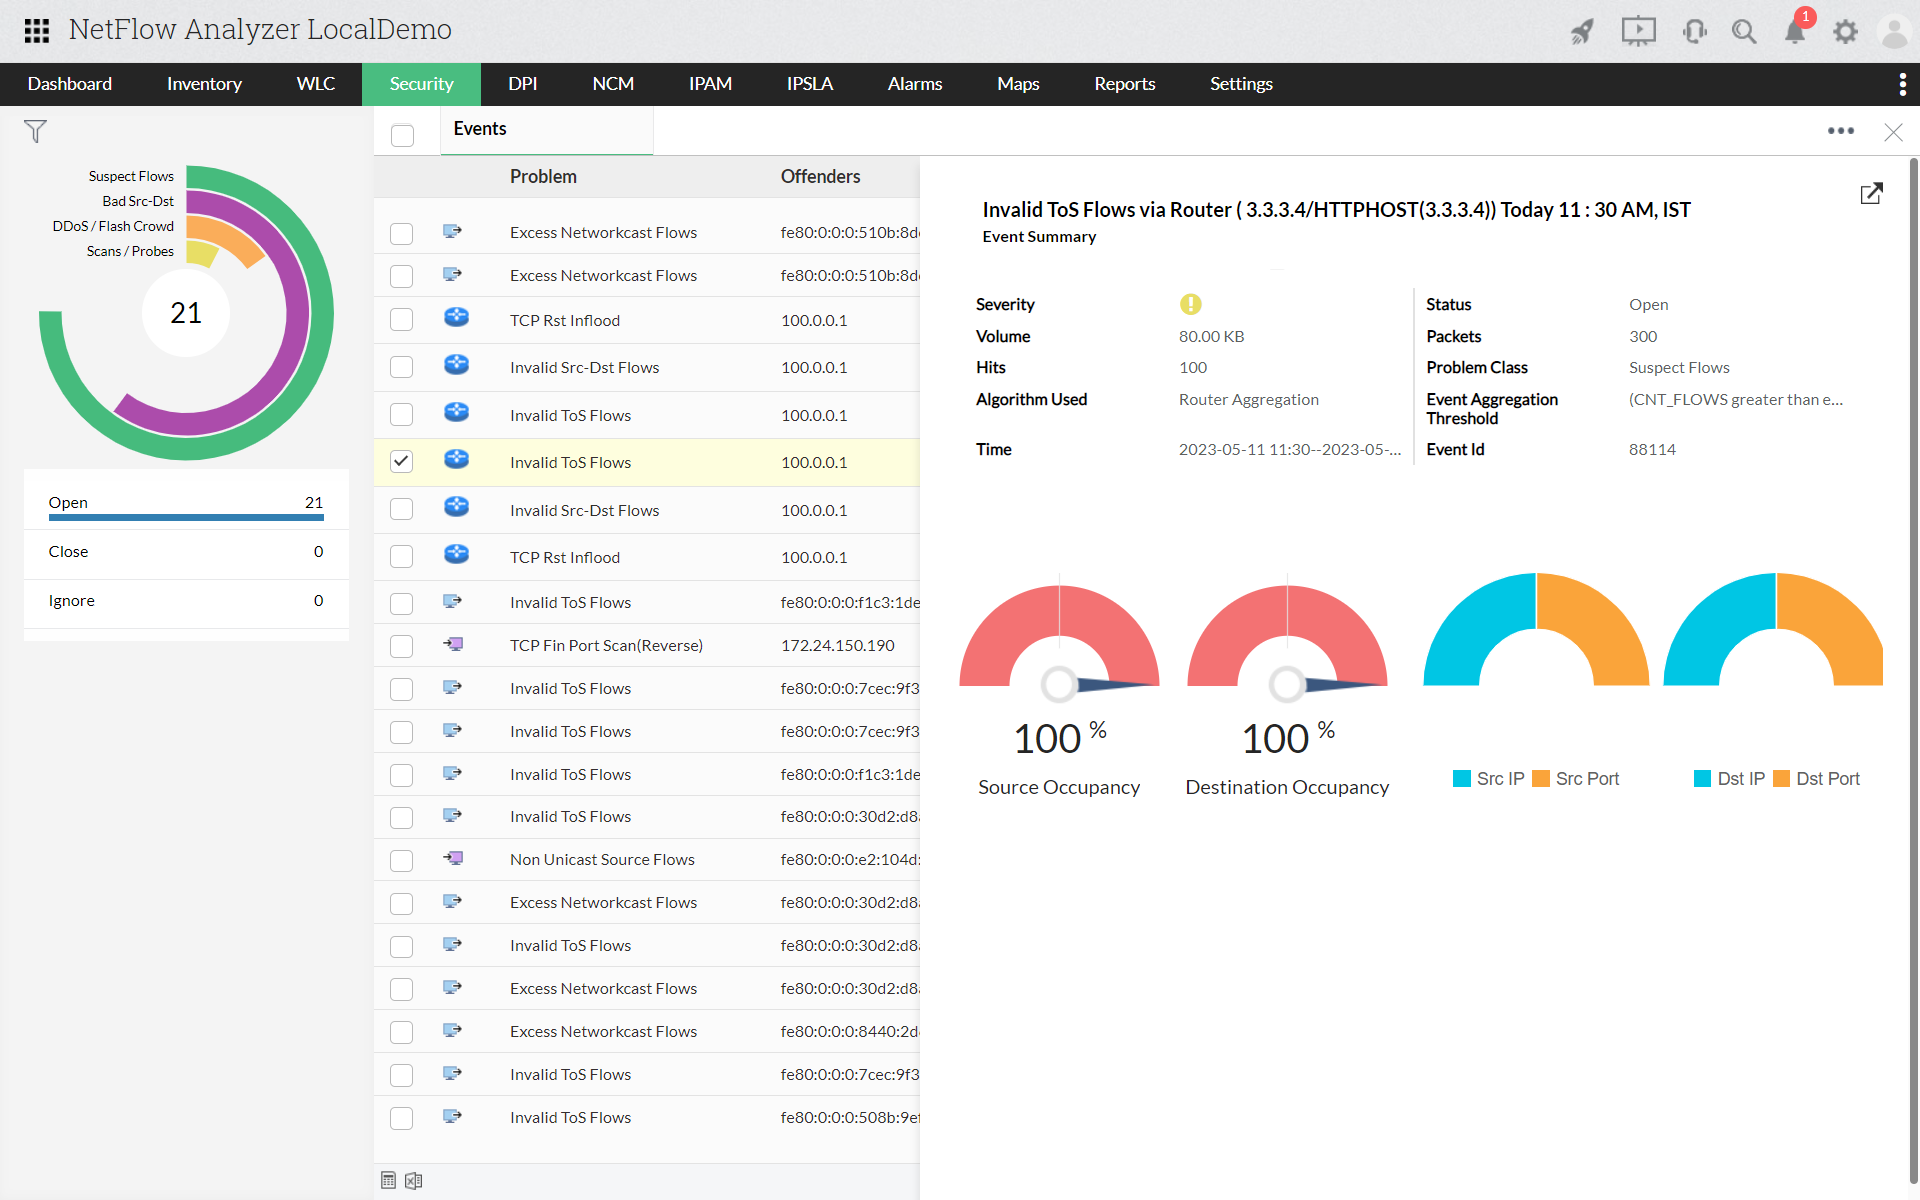
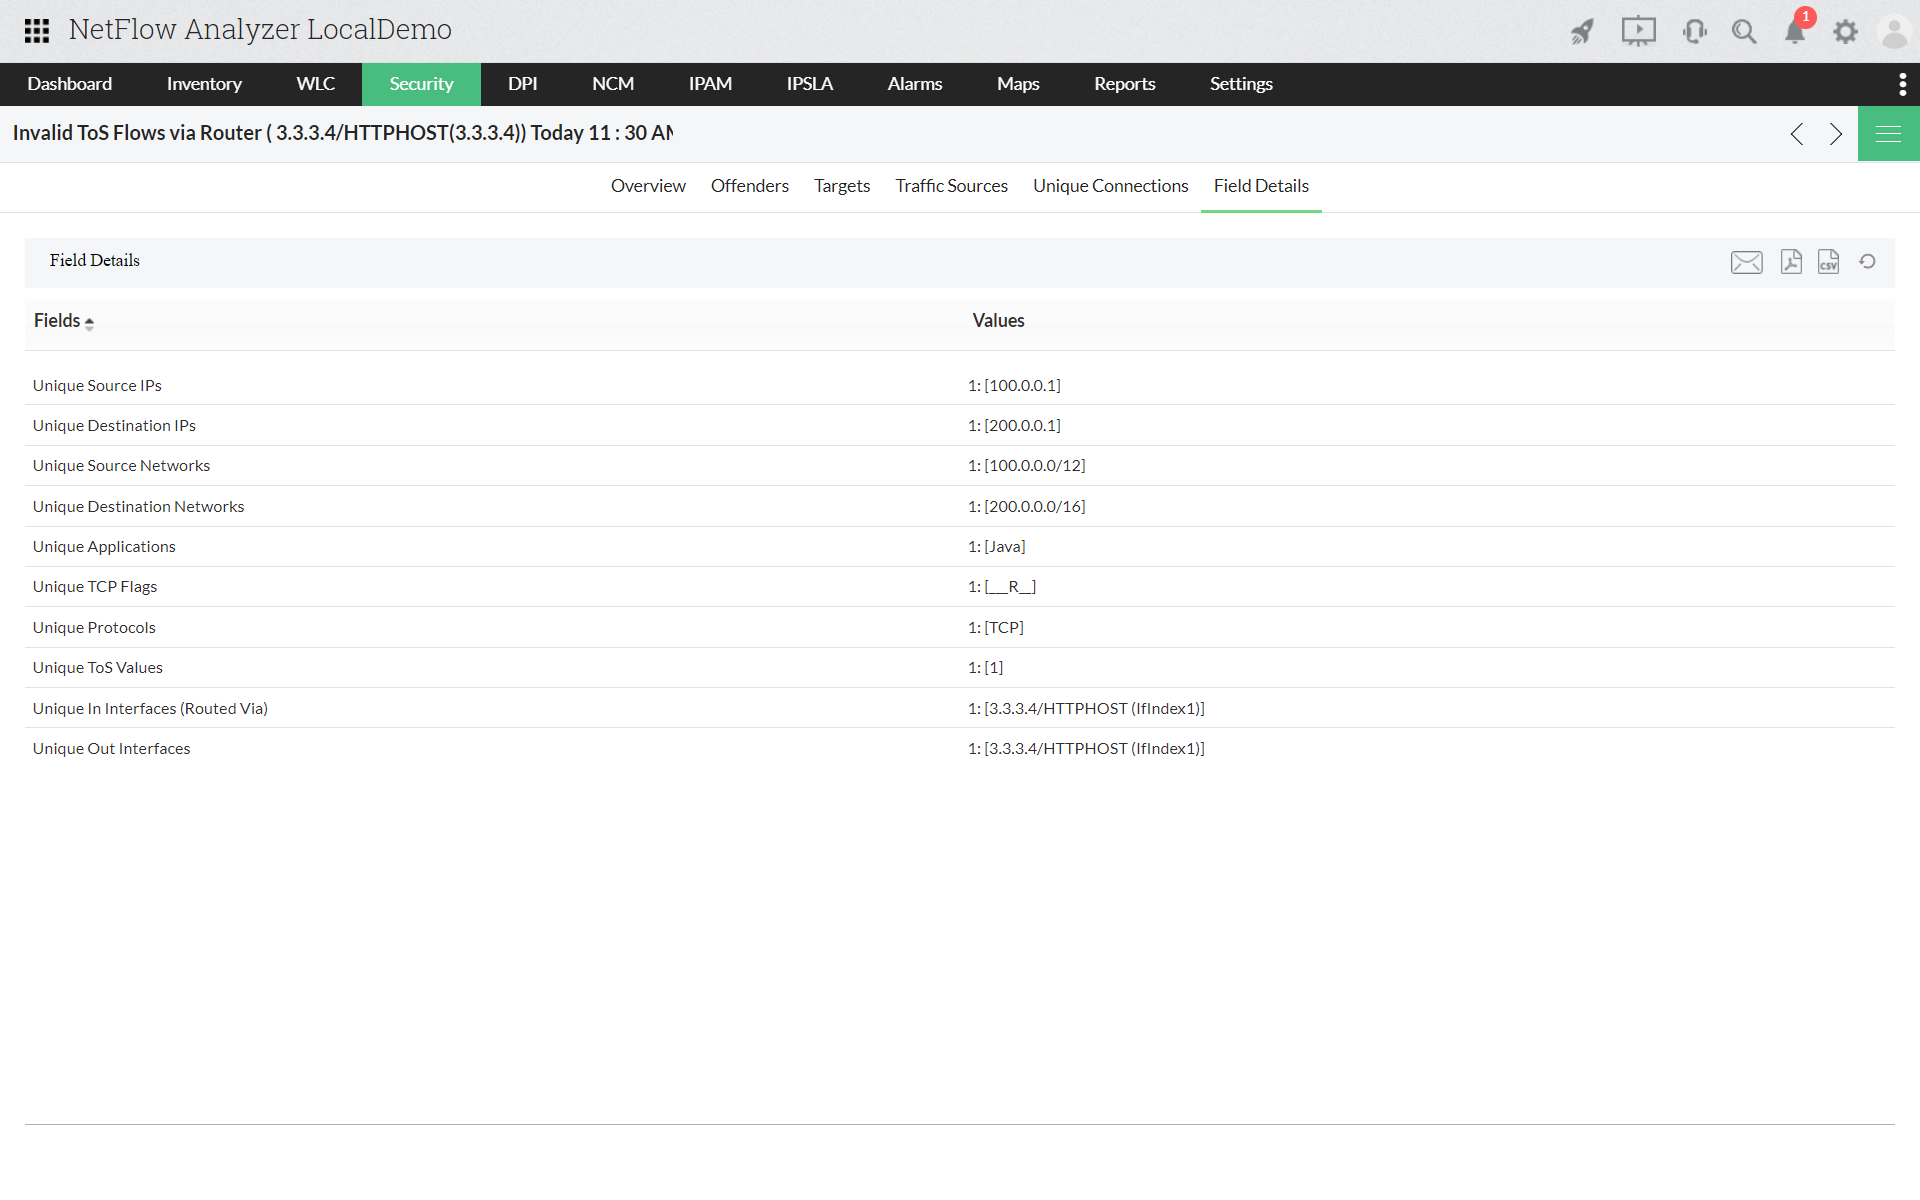
Event Details
Event details gives a thorough detail about the problem. The details include network, port, protocol, TCP flag and much more. Clicking on the router name gives details with mapped destination- source IP and the application, port, protocol etc. used. This report can be exported as a pdf or can be mailed with just a single click.
Problem Taxonomy
Gives you the list of all the classes and the respective problems.

Related Page: Introduction to Advanced security analytics.