General
Where do I find the log files to send to EventLog Analyzer Support?
For Build 8010 onwards
The log files are located in the <EventLogAnalyzer_Home > logs directory. Typically when you run into a problem, you will be asked to send the serverout.txt file from this directory to EventLog Analyzer Support.
For Build 8000 or earlier
The log files are located in the <EventLogAnalyzer_Home > server/default/log directory. Typically when you run into a problem, you will be asked to send the serverout.txt file from this directory to EventLog Analyzer Support.
General
I find that EventLog Analyzer keeps crashing or all of a sudden stops collecting logs. What could be the reason?
The inbuilt PostgreSQL/MySQL database of EventLog Analyzer could get corrupted if other processes are accessing these directories at the same time. So exclude ManageEngine installation folder from
- Anti-virus scans
- Automatic backup softwares
- Snapshots in case of VMware installation
Ensure that no snap shots are taken if the product is running on a VM.
General
How to create SIF (Support Information File) and send it to ManageEngine when you are not able to perform the same from the Web client?
The SIF will help us to analyze the issue you have come across and propose a solution for the same.
If you are unable to create a SIF from the Web client UI,
For Build 8010 onwards
You can zip the files under 'logs' folder, located in C:/ManageEngine/Eventlog/logs (default path) and upload the zip file to the following ftp link: https://bonitas.zohocorp.com/
For Build 8000 or earlier
You can zip the files under 'log' folder, located in C:/ManageEngineEventlog/server/default/log (default path) and upload the zip file to the following ftp link: https://bonitas.zohocorp.com/
General
How to register dll when message files for event sources are unavailable?
To register dll, follow the procedure given in the link below: http://ss64.com/nt/regsvr32.html
General
What should I do if the network driver is missing?
For Windows builds 32bit and 64bit:
- Open the command prompt with the administrative privilege and enter "cd <ELA home>\bin".
- Enter the command (register-driver "<ELA home> \lib\native") to install all the required network drivers in your system.
- Reload the Log Receiver page to fetch logs in real-time.
General
Common issues while upgrading the EventLog Analyzer instance:
Mentioned below are some issues that you might encounter while upgrading your EventLog Analyzer instance, and the steps to resolve them.
Issue 1:
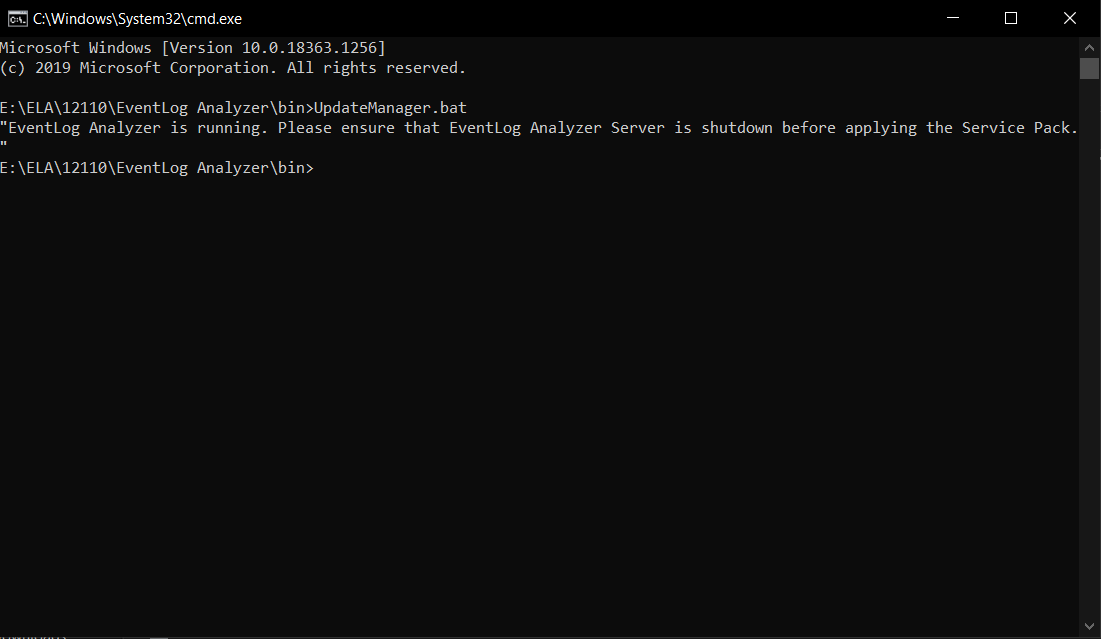
" EventLog Analyzer is running. Please ensure that the EventLog Analyzer Server is shutdown before applying the Service Pack."
EventLog Analyzer needs to be shut down before running the UpdateManager.bat file. Failing this, you'll receive an error message "EventLog Analyzer is running. Please ensure that the EventLog Analyzer Server is shutdown before applying the Service Pack", as shown below. To fix this, ensure that your EventLog Analyzer instance is properly shut down.
 Parsed log
Issue 2:
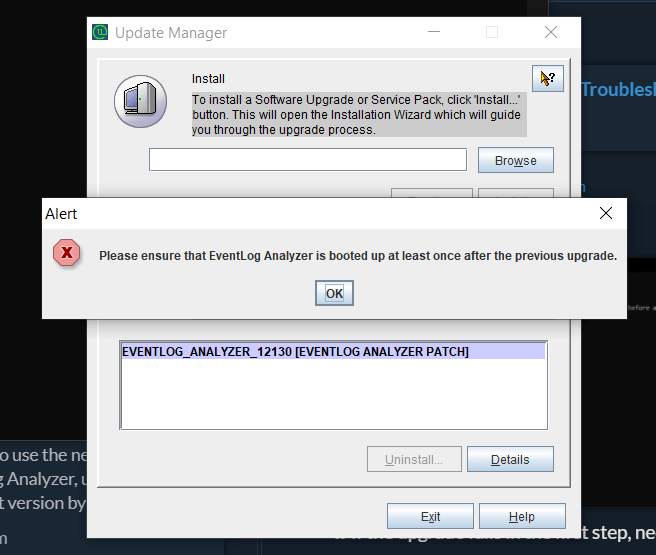
"Please ensure that EventLog Analyzer is booted up at least once after the previous upgrade."
It is necessary to restart the product at least once between two consecutive upgrades. Failing this, the Update Manager will issue an alert to do the same.
 Parsed log
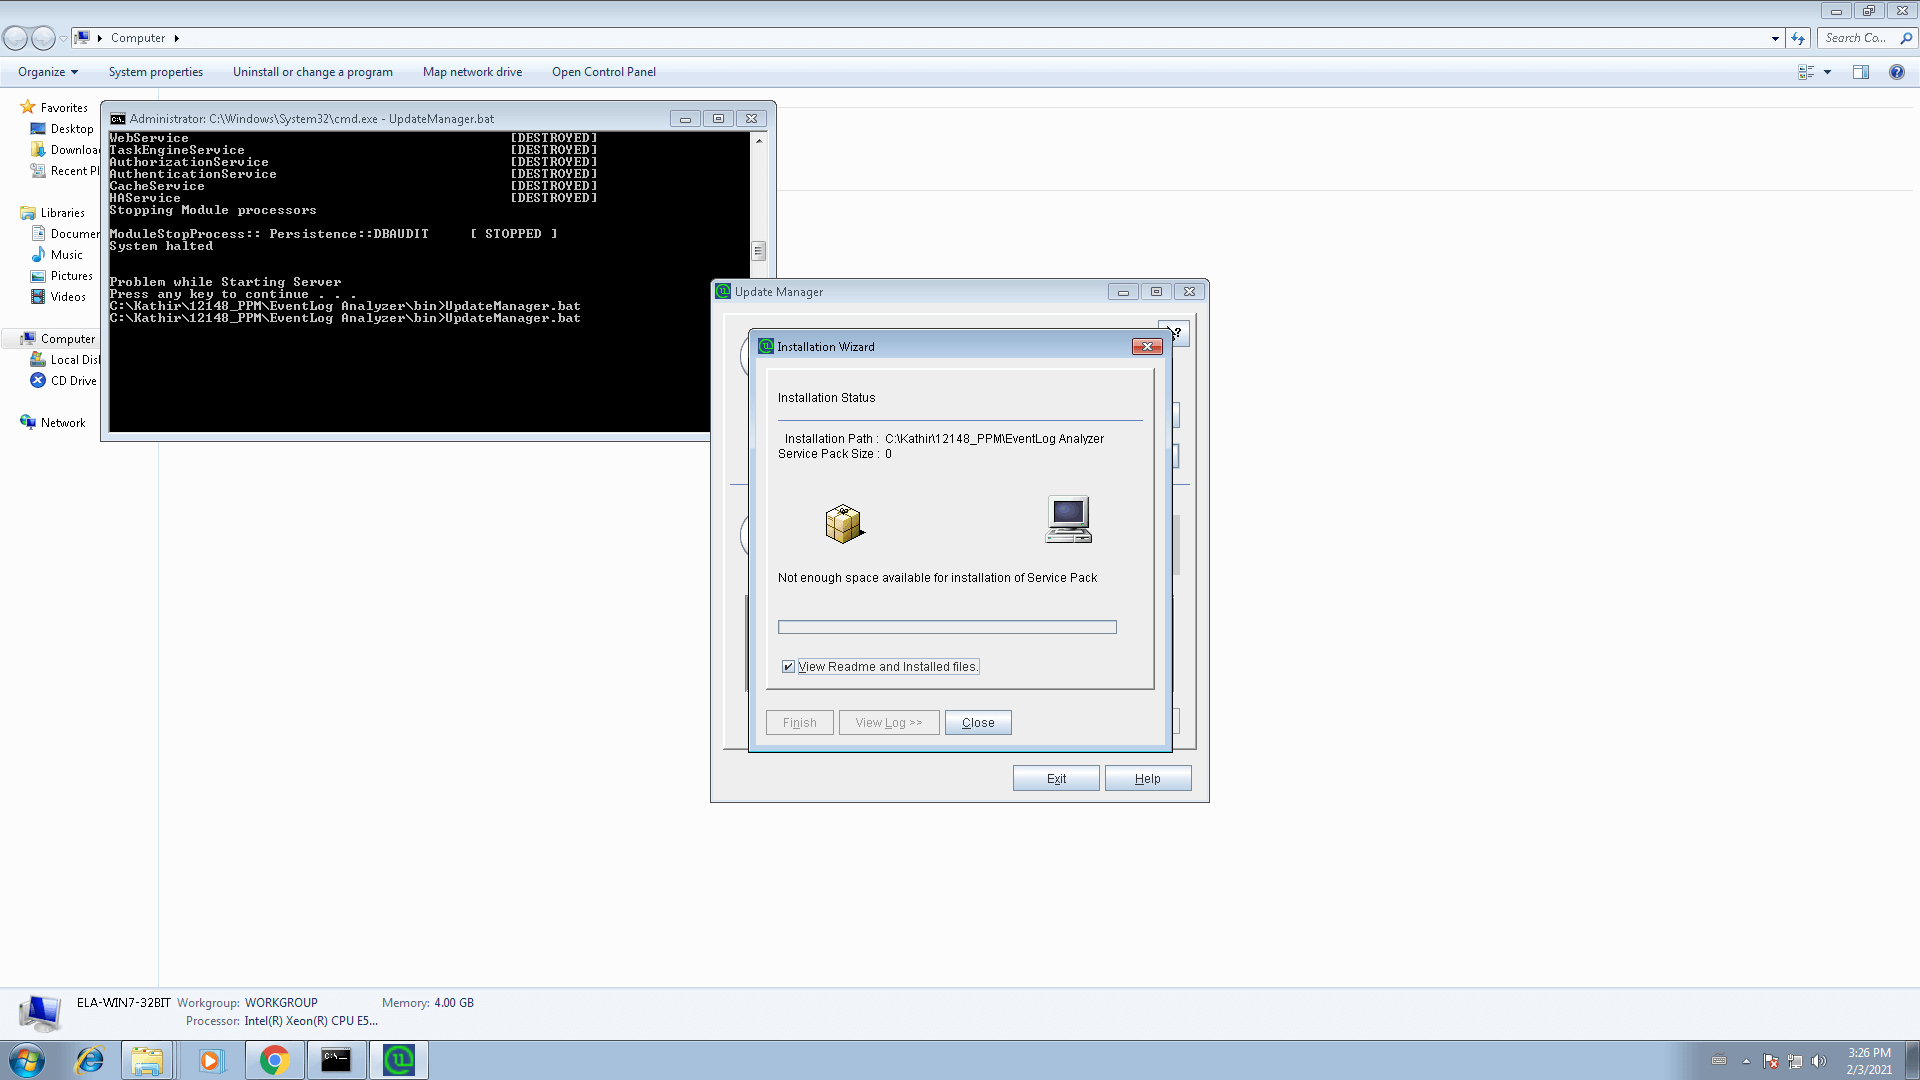
Issue 3: Not enough space available for installation of service pack
If the disk space is insufficient, you'll be notified with ' Not enough space available for installation of service pack' message, as shown in the screenshot. To fix this, please free up sufficient disk space.
 Parsed log
Issue 4: Upgrading managed servers in distributed edition
To upgrade distributed edition of EventLog Analyzer, please upgrade your admin server. This will automatically upgrade all your managed servers.
Issues encountered during taking EventLog Analyzer backup
The procedure to take backup of EventLog Analyzer for different databases is given here. If you encounter any issues while taking a backup of EventLog Analyzer, please ensure that you take a copy of <Eventlog Analyzer Home>/logs folder before contacting support. This makes it easier to troubleshoot the issue.
Learn more about upgrading EventLog Analyzer here. For further assistance, please do not hesitate to contact our support.
Installation
EventLog Analyzer displays "Enter a proper ManageEngine license file" during installation
This can happen under two instances:
Case 1: Your system date is set to a future or past date. In this case, uninstall EventLog Analyzer, reset the system date to the current date and time, and re-install EventLog Analyzer.
Case 2: You may have provided an incorrect or corrupted license file. Verify that you have applied the license file obtained from ZOHO Corp. If neither is the reason, or you are still getting this error, contact licensing@manageengine.com
Installation
Binding EventLog Analyzer server (IP binding) to a specific interface.
For Build 8010 onwards
To bind EventLog Analyzer server to a specific interface, follow the procedure given below:
For Eventlog Analyzer running as application:
- Shutdown EventLog Analyzer
- Open the run.bat file which is under <EventLog Analyzer Home> bin directory and go to "RESTART Command block", uncomment the below RESTART command line and replace <ip-address> with the IP address to which you want to bind the application, comment the existing RESTART command line and save the file.
Note :
rem %JAVA% %JAVA_OPTS% -cp "%CLASS_PATH%" com.adventnet.mfw.Starter %SAFE_START% -c default -b <ip-address>
to
%JAVA% %JAVA_OPTS% -cp "%CLASS_PATH%" com.adventnet.mfw.Starter %SAFE_START% -c default -b <ip-address >
%JAVA% %JAVA_OPTS% -cp "%CLASS_PATH%" com.adventnet.mfw.Starter %SAFE_START%
to
rem %JAVA% %JAVA_OPTS% -cp "%CLASS_PATH%" com.adventnet.mfw.Starter %SAFE_START%
- Open setcommonenv.bat file which is under <EventLog Analyzer Home> bin directory and go to "JAVA_OPTS Setting command Block", uncomment the below JAVA_OPTS setting command line and replace <ip-address> with the IP address to which you want to bind the application and comment the existing JAVA_OPTS setting command.
Note :
rem set JAVA_OPTS=-Djava.library.path=..lib;..libnative -DpdfReport=false -Duser.country=US -Duser.language=en -DminDiskSpace=5 -Xms128m -Xmx512m -Dspecific.bind.address= <ip-address>
to
set JAVA_OPTS=-Djava.library.path=..lib;..libnative -DpdfReport=false -Duser.country=US -Duser.language=en -DminDiskSpace=5 -Xms128m -Xmx512m -Dspecific.bind.address= <ip-address >
set JAVA_OPTS=-Djava.library.path=..lib;..libnative -DpdfReport=false -Duser.country=US -Duser.language=en -DminDiskSpace=5 -Xms256m -Xmx1024m
to
rem set JAVA_OPTS=-Djava.library.path=..lib;..libnative -DpdfReport=false -Duser.country=US -Duser.language=en -DminDiskSpace=5 -Xms256m -Xmx1024m
- Save the file
- Open the database_param.conf file which is under <EventLog Analyzer Home > conf directory and replace localdevice in url tag with the <binding IP address> to which you want to bind the application and save the file.
Note :
url=jdbc:postgresql://localdevice: 33336/eventlog?stringtype=unspecified
to
url=jdbc:postgresql://<binding IP address>:33336/eventlog?stringtype=unspecified
- Open the postgresql.conf file which is under <EventLog Analyzer Home> pgsqldata directory and uncomment the line '#listen_addresses = 'localdevice'' in the CONNECTIONS AND AUTHENTICATION section and replace the 'localdevice'with the '<binding IP address >' to which you want to bind the application and save the file.
#------------------------------------------------------------------------------
# CONNECTIONS AND AUTHENTICATION
#------------------------------------------------------------------------------
# - Connection Settings -
#listen_addresses = 'localdevice' # what IP address(es) to listen on;
# comma-separated list of addresses;
# defaults to 'localdevice'; use '*' for all
# (change requires restart)
to
#------------------------------------------------------------------------------
# CONNECTIONS AND AUTHENTICATION
#------------------------------------------------------------------------------
# - Connection Settings -
listen_addresses = <binding IP address> # what IP address(es) to listen on;
# comma-separated list of addresses;
# defaults to 'localdevice'; use '*' for all
# (change requires restart)
- Open the pg_hba.conf file which is under <EventLog Analyzer Home> pgsqldata directory and add the line
- device all all <binding IP address in IPv4 format> /32 trust
- after the line
- device all all 127.0.0.1/32 trust
- and save the file.
# TYPE DATABASE USER ADDRESS METHOD
# IPv4 local connections:
device all all 127.0.0.1/32 trust
# IPv6 local connections:
device all all ::1/128 trust
to
# TYPE DATABASE USER ADDRESS METHOD
# IPv4 local connections:
device all all 127.0.0.1/32 trust
device all all <binding IP address in IPv4 format> /32 trust
# IPv6 local connections:
device all all ::1/128 trust
- Restart EventLog Analyzer
For Eventlog Analyzer running as service:
Before proceeding further, stop the EventLog Analyzer service and make sure that 'SysEvtCol.exe','Postgres.exe' and 'java.exe' are not running.There are 7 files that must be modified for IP binding.
Note: Before editing the files ensure that you have a backup copy of the files.
Assume xxx.xxx.xxx.xxx is the IP address you wish to bind with EventLog Analyzer.
File:1
<ELA home>\bin\setCommonEnv.bat
- Search for line set JAVA_OPTS=-Djava.library.path=..\lib;..\lib\native -Duser.country=US -Duser.language=en -Xms256m -Xmx1024m
- Append -Dspecific.bind.address= xxx.xxx.xxx.xxx to the line. It will now look as: set JAVA_OPTS=-Djava.library.path=..\lib;..\lib\native -Duser.country=US -Duser.language=en -Xms256m -Xmx1024m -Dspecific.bind.address= xxx.xxx.xxx.xxx
File:2
<ELA home>\bin\runSEC.bat
- Search for line "%SERVER_HOME%\bin\SysEvtCol.exe" -port 513 %syslogPort% -dbhome "%dbhome%" -ELAhome "%serverHome%" -loglevel 2 %RelayIP% %IPadd% %IgnoreHost% %IPadd% %*
- Add -bindip xxx.xxx.xxx.xxx to the line, so that it looks like "%SERVER_HOME%\bin\SysEvtCol.exe" -bindip xxx.xxx.xxx.xxx -port 513 %syslogPort% -dbhome "%dbhome%" -ELAhome "%serverHome%" -loglevel 2 %RelayIP% %IPadd% %IgnoreHost% %IPadd% %*
File:3
<ELA home>\server\conf\wrapper.conf
- Search for line #wrapper.app.parameter.1=com.adventnet.mfw.Starter
- Remove the # from the line, it should now look like wrapper.app.parameter.1=com.adventnet.mfw.Starter
- The next line from current position should be #wrapper.app.parameter.2=-L../lib/AdventNetDeploymentSystem.jar . Add the following two lines after this line, one after the other.
- wrapper.app.parameter.2=-b xxx.xxx.xxx.xxx
- wrapper.app.parameter.3=-Dspecific.bind.address= xxx.xxx.xxx.xxx
- The block should now look like this :-
wrapper.app.parameter.1=com.adventnet.mfw.Starter
#wrapper.app.parameter.2=-L../lib/AdventNetDeploymentSystem.jar
wrapper.app.parameter.2=-b xxx.xxx.xxx.xxx
wrapper.app.parameter.3=-Dspecific.bind.address= xxx.xxx.xxx.xxx
File:4
<ELA home>\conf\server.xml
Search for the following block:
<Connector SSLEnabled="false" URIEncoding="UTF-8" acceptCount="100" address="0.0.0.0" clientAuth="false" compressableMimeType="text/html,text/xml" compression="force" compressionMinSize="1024" connectionTimeout="20000" disableUploadTimeout="true" enableLookups="false" maxSpareThreads="75" maxThreads="150" minSpareThreads="25" name="WebServer" noCompressionUserAgents="gozilla, traviata" port="8400" protocol="HTTP/1.1" scheme="http" secure="false"/>
- Replace address= "0.0.0.0" with address= "xxx.xxx.xxx.xxx"
- It should now look like the following
<Connector SSLEnabled="false" URIEncoding="UTF-8" acceptCount="100" address="xxx.xxx.xxx.xxx" clientAuth="false" compressableMimeType="text/html,text/xml" compression="force" compressionMinSize="1024" connectionTimeout="20000" disableUploadTimeout="true" enableLookups="false" maxSpareThreads="75" maxThreads="150" minSpareThreads="25" name="WebServer" noCompressionUserAgents="gozilla, traviata" port="8400" protocol="HTTP/1.1" scheme="http" secure="false"/>
File:5
<ELA home>\conf\database_params.conf
- Search for the line url=jdbc:postgresql://127.0.0.1:33335/eventlog?stringtype=unspecified
- Replace the 127.0.0.1 with your xxx.xxx.xxx.xxx, the line should now look like url=jdbc:postgresql://xxx.xxx.xxx.xxx:33335/eventlog?stringtype=unspecified
File:6
<ELA home>\pgsql\data\postgresql.conf
- Search for the line #listen_addresses = 'localhost'
- Remove the # from the line.
- Replace the 'localhost' with 'xxx.xxx.xxx.xxx', the line should now look like listen_addresses = 'xxx.xxx.xxx.xxx'
File:7
<ELA home>\pgsql\data\pg_hba.conf
Search for the following block
IPv4 local connections:
host all all 127.0.0.1/32 trust
We need to replicate the host all all 127.0.0.1/32 trust line with the new IP address in place of 127.0.0.1 and add it after that line. For replication, please copy this line itself and paste it in next line and then edit out the IP address.
It should look like this
IPv4 local connections:
host all all 127.0.0.1/32 trust
host all all xxx.xxx.xxx.xxx/32 trust
Start EventLog Analyzer and check <ELA home> \logs\wrapper.log for the current status.
For Build 8000 or earlier
To bind EventLog Analyzer server to a specific interface follow the procedure given below:
For Eventlog Analyzer running as application:
- Open the runSEC.exe/sh file.
- Add the following parameter in the line in any place before %* or $*: binSysEvtCol.exe -loglevel 3 -port 513 514 %* -bindip <IP Address of the interface to which the EventLog Analyzer needs to be bound>
Example entry is as given below:
binSysEvtCol.exe -loglevel 3 - bindip 192.168.111.153 -port 513 514 %*
For Eventlog Analyzer running as service:
- Stop the Eventlog Analyzer service.
- Open the startDB.bat file which is under <Eventlog Analyzer Home> bin directory, add option '--bind-address= <ip-address> ' in the mysqld start command that starts with @start and save the file.
- Open the stopDB.bat file which is under <Eventlog Analyzer Home> bin directory, add '-h <ip-address>' to the command arguments and save the file.
After the change the line should like the one given below:
set commandArgs=-P %PORT% -u %USER_NAME% -h <ip-address>
- Open the wrapper.conf file which is under <Eventlog Analyzer Home>server/default/conf and follow the below steps:
Uncomment the second application parameter ' wrapper.app.parameter.2=-L../lib/AdventNetDeploymentSystem.jar'.
Add the following new application parameters
wrapper.app.parameter.3=-c default
wrapper.app.parameter.4=-b <ip-address>
wrapper.app.parameter.5=-Dspecific.bind.address=<ip-address>
and save the file.
Note: Remove #'symbol for uncommenting in the .conf file.
- Open the mysql-ds.xml file which is under <Eventlog Analyzer Home>server/default/deploy directory, replace 'localdevice' in connection-url tag with the <ip-address> to which you want to bind the application and save the file.
- Start the Eventlog Analyzer service.
- Verify the setting by executing the 'netstat -ano' command in the command prompt.
Startup and Shut Down
MySQL-related errors on Windows machines
-
Probable cause:
An instance of MySQL is already running on this machine.
Solution: Shut down all instances of MySQL and then start the EventLog Analyzer server.
-
Probable cause:
Port 33335 is not free
Solution: Kill the other application running on port 33335. If you cannot free this port, then change the MySQL port used in EventLog Analyzer.
Startup and Shut Down
EventLog Analyzer displays "Port 8400 needed by EventLog Analyzer is being used by another application. Please free the port and restart EventLog Analyzer" when trying to start the server
Probable cause: The default web server port used by EventLog Analyzer is not free.
Solution:
Kill the other application running on port 8400. Carry out the following steps.
- Stop the EventLog Analyzer service
- For Build 8010 onwards, open wrapper.conf which is available under <EventLog Analyzer Home> server/conf folder. For Build 8000 or earlier, open wrapper.conf which is available under <EventLog Analyzer Home> server/default/conf folder.
- Append the below line under # Java Additional Parameters section,
wrapper.java.additional.21=-Djava.net.preferIPv4Stack=true
Before adding:
wrapper.java.additional.20=-Dorg.tanukisoftware.wrapper.WrapperManager.mbean=false
After adding:
wrapper.java.additional.20=-Dorg.tanukisoftware.wrapper.WrapperManager.mbean=false
wrapper.java.additional.21=-Djava.net.preferIPv4Stack=true
- Start EventLog Analyzer service
If you cannot free this port, then change the web server port used in EventLog Analyzer.
Startup and Shut Down
EventLog Analyzer displays "Can't Bind to Port <Port Number>"when logging into the UI.
Probable cause:The syslog listener port of EventLog Analyzer is not free.
Solution:
- Check for the process that is occupying the syslog listener port,using netstat -anp -pudp. And if possible, try to free up this port.
- If you have started the server in UNIX machines, please ensure that you start the server as a root user.
- or, configure EventLog Analyzer to listen to a different syslog listener port and ensure that all your configured devices send their syslog to the newly configured syslog listener port of EventLog Analyzer.
Startup and Shut Down
Start up and shut down batch files not working on Distributed Edition when taking backup.
Probable cause: Path names given incorrectly.
Solution:
- Download the "Automated.zip" and extract the files "startELAservice.bat"and "stopELAservice.bat" to <ELA home> //bin/ folder.
- Create a Windows schedule as per your requirement and ensure that the path should be <ELA Home>//bin folder.
- If you would like to have the files to a different folder, you need to edit the downloaded files and give the absolute path as below: <eg.is the application is installed on e:\ >
- e:\ManageEngine\EventLog\bin\wrapper.exe -p ..\server\conf\wrapper.conf ---> to stop the EventLog Analyzer service.
- e:\ManageEngine\EventLog\bin\wrapper.exe -t ..\server\conf\wrapper.conf ---> to start the EventLog Analyzer service.
- Note: The script will work only if the application is started as a service.
Startup and Shut Down
EventLog Analyzer displays "Couldn't start elasticsearch at port 9300".
Probable cause: requiretty is not disabled
Solution: To disable requiretty, please replace requiretty with !requiretty in the etc/sudoers file.
Note: Elasticsearch uses multiple thread pools for different types of operations. It is important for new threads to be created whenever necessary. Please make sure that the number of threads that an elasticsearch user can create is at least 4096 by setting ulimit -u 4096 as root before starting Elasticsearch or by adding elasticsearch - nproc 4096 in /etc/security/limits.conf.
Startup and Shut Down
Why is EventLog Analyzer's product database (PostgreSQL) not starting?
- EventLog Analyzer doesn't have sufficient permissions on your machine. To rectify this, execute the following files:
For Windows: <EventLog Analyzer Home>\bin\initPgsql.bat
For Linux: <EventLog Analyzer Home>/bin/initPgsql.sh
This will provide required permissions to the <EventLog Analyzer Home>\pgsql folder.
- Insufficient disk space in the drive where EventLog Analyzer application is installed.
- The drive where EventLog Analyzer application is installed might be corrupted. To check , execute the command chkdsk from the <EventLog Analyzer Home> folder.
- The default PostgreSQL database port for EventLog Analyzer 33335, is already being used by some other application.
To check, execute the following commands,
Windows: netstat -ano | findstr 33335
Linux: netstat -tulpn | grep 33335
To stop EventLog Analyzer, execute the following file,
Windows: <EventLog Analyzer Home>\bin\stopDB.bat file.
Linux: <EventLog Analyzer Home>/bin/stopDB.sh file.
- The postgres.exe or postgres process is already running in task manager. If this is the case, execute the following file:
Windows: <EventLog Analyzer Home>\bin\stopDB.bat file.
Linux: <EventLog Analyzer Home>/bin/stopDB.sh file.
- PostgreSQL database was shutdown abruptly.
- Go to <EventLog Analyzer Home>\pgsql\data\pg_log folder.
- Open the latest file for reading and go to the end of the file.
- Check for the following error message:
FATAL: the database system is starting up.
This means that the PostgreSQL database was shutdown abruptly and is under recovery mode. Follow the below steps to restart EventLog Analyzer:
Windows:
- Execute the <EventLog Analyzer Home>\bin\startDB.bat file and wait for 10-20 minutes.
- Execute the <EventLog Analyzer Home>\bin\stopDB.bat file.
- Start the EventLog Analyzer application.
Linux:
- Execute the <EventLog Analyzer Home>/bin/startDB.sh file and wait for 10-20 minutes.
- Execute the <EventLog Analyzer Home>/bin/stopDB.sh file.
- Start the EventLog Analyzer application.
Repeat the steps, if the issue persists.
For further assistance, please contact EventLog Analyzer technical support.
Startup and Shut Down
EventLog Analyzer shuts down abruptly
If the EventLog Analyzer service stops abruptly, it could be due to one of the following reasons:
Probable cause 1: Server is down.
The machine in which EventLog Analyzer is running has stopped or is down.
Probable cause 2: Java Virtual Machine is hung
Java Virtual Machine can hang when it doesn't receive the required amount of CPU time. After Java Virtual Machine hangs, the product will restart on its own. After the product restarts, upload the ELA\logs and ELA\ES\logs for further analysis.
Probable cause 3: OutOfMemory Error
An OutOfMemory error will occur when the memory allocated for EventLog Analyzer is not enough to process the requests. After this error occurs, a built-in script file will run to increase the allocated heap used by EventLog Analyzer and the product will restart on its own. After the product restarts, upload the logs for further analysis.
Configuration
While adding device for monitoring, the 'Verify Login' action throws RPC server unavailable error
The probable reason and the remedial action is:
Probable cause: The device machine RPC (Remote Procedure Call) port is blocked by any other Firewall.
Solution: Unblock the RPC ports in the Firewall.
Configuration
While adding device for monitoring, the 'Verify Login' action throws 'Access Denied' error.
The probable reasons and the remedial actions are:
Probable cause: The device machine is not reachable from EventLog Analyzer machine.
Solution: Check the network connectivity between device machine and EventLog Analyzer machine, by using PING command.
Probable cause: The device machine running a System Firewall and REMOTEADMIN service is disabled.
Solution:Check whether System Firewall is running in the device. If System Firewall is running, execute the following command in the command prompt window of the device machine:
netsh firewall set service type=REMOTEADMIN mode=ENABLE profile=all
Configuration
When WBEM test is carried out. it fails and shows error message with code 80041010 in Windows Server 2003.
The probable reasons and the remedial actions are:
Probable cause: By default, WMI component is not installed in Windows 2003 Server
Solution: Win32_Product class is not installed by default on Windows Server 2003. To add the class, follow the procedure given below:
- In Add or Remove Programs, click Add/Remove Windows Components.
- In the Windows Components Wizard, select Management and Monitoring Tools,then click Details.
- In the Management and Monitoring Tools dialog box, select WMI Windows Installer Provider and then click OK.
- Click Next.
Configuration
How to enable Object Access logging in Linux OS?
The probable reasons and the remedial actions are:
Probable cause:The object access log is not enabled in Linux OS.
Solution:Steps to enable object access in Linux OS, is given below:
- In the file /etc/xinted.d/wu-ftpd, edit the server arguments as mentioned below:
- server_args = -i -o -L
Configuration
What are commands to start and stop Syslog Deamon in Solaris 10?
The probable reasons and the remedial actions are:
Probable cause:Unable to start or stop Syslog Daemon in Solaris 10
Solution:In Solaris 10, the commands to stop and start the syslogd daemon are:
- # svcadm disable svc:/system/system-log:default
- # svcadm enable svc:/system/system-log:default
In Solaris 10, to restart the syslogd daemon and force it to reread /etc/syslog.conf:
- # svcadm refresh svc:/system/system-log:default
or
# svcadm -v restart svc:/system/system-log:default
Configuration
While configuring incident management with ServiceDesk, I am facing SSL Connection error.
This error can occur if the ServiceDesk server's HTTPS certificate is not included in EventLog Analyzer's JRE certificate store. To import the certificate to EventLog Analyzer's JRE certificate store, follow the steps below:
- Place the server's certificate in your browser's certificate store by allowing trust when your browser throws up the error saying that the certificate is not trusted.
- Export the certificate as a binary DER file from your browser.
- For Firefox, you can find this under Preferences > Advanced > Encryption > Servers
- For IE, Internet Options > Content > Certificates > Personal > Export
- For Chrome, Settings > Show Advanced Settings > Manage Certificates
- Use the keytool utility to import the certificate into EventLog Analyzer's JRE certificate store.
keytool -import -alias SDP server -keystore EventLog Analyzer Home /lib/security/cacerts -file path-to-certificate-file Enter the keystore password. Note that the default password is changeit.
Configuration
File Integrity Monitoring (FIM) troubleshooting
Try the following troubleshooting, if username is enabled for a particular folder.
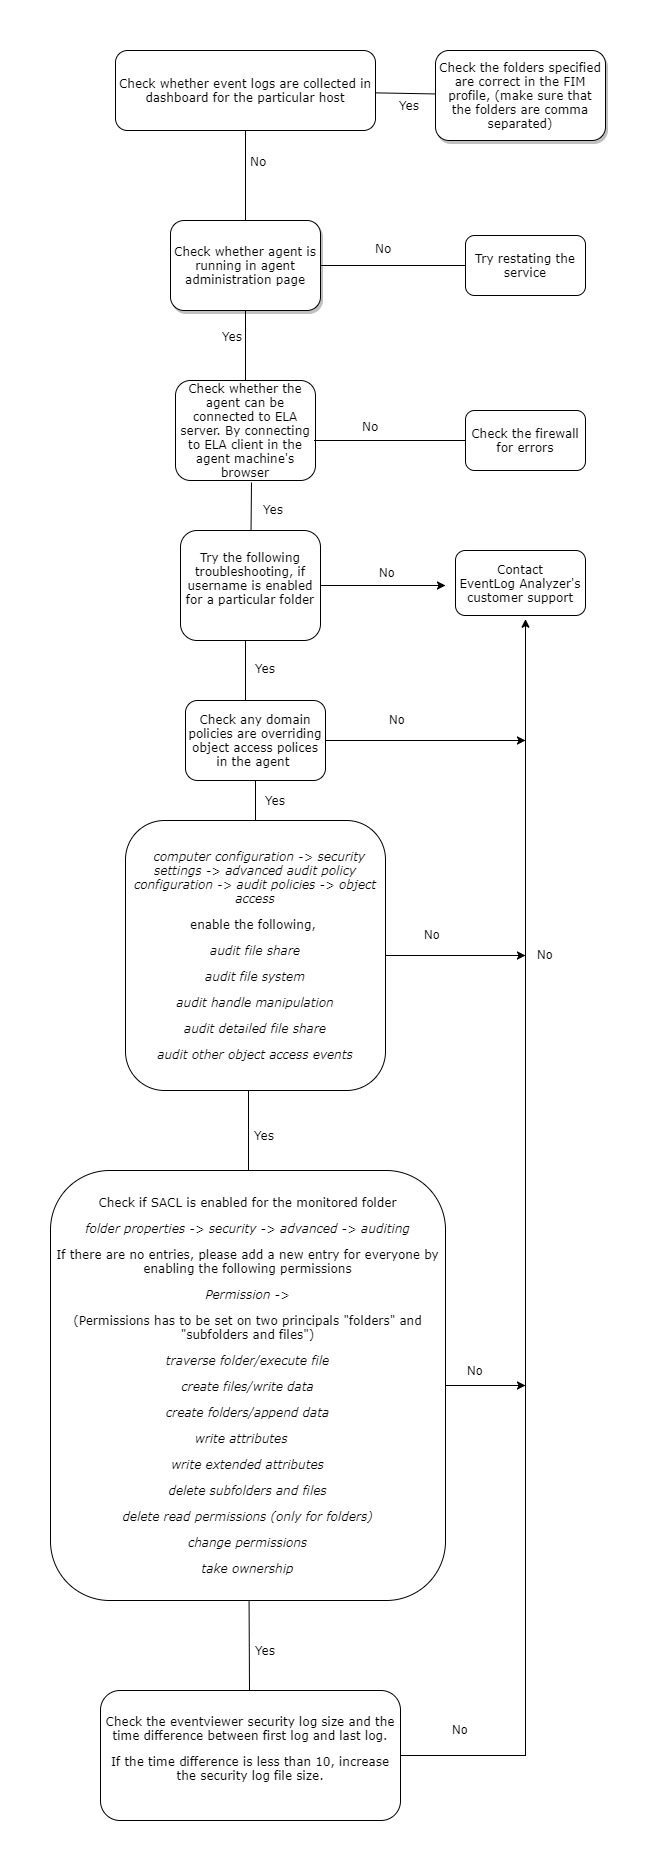
Note: The following GUI is for the SACL entry in folder properties.
Configuration
Error statuses in File Integrity Monitoring (FIM).
1. Permission denied
Causes
- Credentials maybe incorrect.
- Credentials with insufficient privileges.
Solutions
- Credentials can be checked by accessing the SSH terminal.
- Credentials with the privilege to start, stop, and restart the audit daemon, and also transfer files to the Linux device are necessary.
2. Audit service unavailable
Causes
- The audit daemon service is not present in the selected Linux device.
Solutions
- The audit daemon package must be installed along with Audisp.
3. Access restriction from SELinux
Causes
- SELinux hinders the running of the audit process.
Solutions
- SELinux's presence could be checked using getenforce command.
- Configure SELinux in permissive mode. After changing it to the permissive mode, navigate to Manage Agent page and click on Reinstall to reinstall the agent.
4. Agent upgrade failure
Causes
- No connectivity with the agent during product upgrade.
- Incorrect credentials.
Solutions
- Manually install the agent by navigating to the Manage Agent page.
- To install agent:
- Windows device: Run the EventLogAgent.msi.
- Linux device: Execute chmod +x EventLogAgent.bin, then run EventLogAgent.bin.
5. Agent Installation Failed
Causes
- Machine may be in the offline mode.
- Machine may not exist.
- Network path may not be reachable.
Solutions
- To confirm if the device exists, it could be pinged.
- Manually install the agent by navigating to the Manage Agent page.
6. Agent Installation on Incompatible Platform
- The agent is installed on a host which has neither a Linux nor a Windows OS.
Solutions
- Supported Linux distributions are CentOS, Debian, Fedora, openSUSE, Red Hat, and Ubuntu.
- Windows versions greater than 5.2 (Windows Server 2003) are supported.
Configuration
Port management error codes
The following are some of the common errors, its causes and the possible solution to resolve the condition. Feel free to contact our support team for any information.
Configuration
Port already used by some other application
Cause: Cannot use the specified port because it is already used by some other application.
Solution: This can be solved either by changing the port in the specified application or by using a new port.If you use a new port, make sure to change the ports in the forwarding device either manually or using auto log forwarding configuration.
Configuration
TLS not configured
Cause: HTTPS not configured to support TLS encrypted logs.
Solution:Configure the server to use either a self-signed certificate or a valid PFX certificate.
For more details visit Connection settings.
Configuration
PFX not configured
Cause: HTTPS is configured, but the type of certificate is not supported.
Solution 1:If no valid certificate is used, it's recommended to use SelfSignedCertificate.
To find the type of certificate used,
- Open Conf/Server.xml file check for connector tag.
- Check the extention for the attribute keystoreFile.
Solution 2:If valid KeyStore certificate is used, execute the following command in the <EventLog Analyzer home> /jre/bin terminal.
keytool -importkeystore -srckeystore <certificate path> -destkeystore server.pfx -deststoretype PKCS12 -deststorepass <password> -srcalias tomcat -destalias tomcat
For more details visit Connection settings.
Configuration
The event source file(s) configuration throws the "Unable to discover files" error.
- Check the credentials of the machine.
- Check the connectivity of the device.
- Ensure that the remote registry service is not disabled.
- The user should have admin privileges.
- The open keys and keys with sub-keys cannot be deleted.
Configuration
Common File Integrity Monitoring troubleshooting tips/FAQs:
Windows FIM
- What are the audit policy changes needed for Windows FIM?
FIM reports may not be populated when the domain policies override the object access policies in the agent, due to which file activity is not audited. To fix this, you need to enable the listed object access policies for your domain. Proceed as follows:
- Navigate to Computer configuration > Security settings > Advanced audit policy configuration > audit policies > object access
- Enable the following:
- Audit file share
- Audit file system
- Audit handle manipulation
- Audit detailed file share
- Audit other object access events
- What are the specific SACLs set for FIM locations?
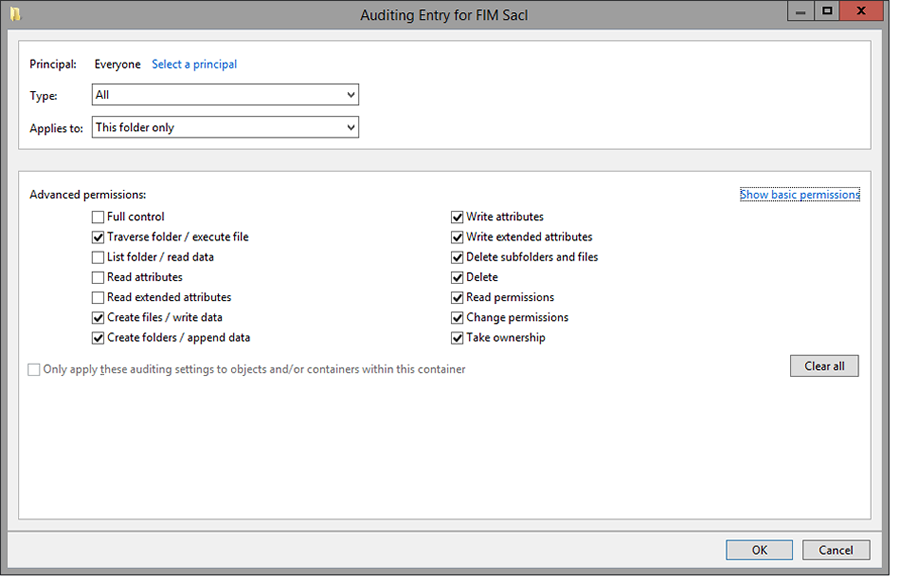
If SACLs are not set for the monitored folders, the agent may fail to collect FIM logs due to insufficient permissions. To fix this, add the required permissions by making SACL entries as below:
- Right-click the monitored folder > Properties > Security > Advanced > Auditing
- Add a new entry giving the following permissions for 'Everyone'.
- Traverse folder/execute files
- Create files/ write data
- Create folders/ append data
- Write attributes
- Write extended attributes
- Delete subfolders and files
- Delete read permissions
- Change permissions
- Take ownership
- Can I get the username details in FIM?
Yes. The column Username can be included in the report by clicking the Manage reports fields and selecting Username.
- Is it possible to alert me if a file is moved?
Yes. You can set FIM alerts. Navigate to Home > Log Sources > File Integrity Monitoring > FIM Alert.
- What are the file operations that can be audited with FIM?
FIM helps you monitor all changes made to files and folders in Windows and Linux systems including:
- Addition
- Deletion
- Modification
- Renaming
- Permission changes
- How do I fetch the FIM Reports from the console?
Navigate to Reports and select the 'Devices' dropdown box on the top-left. Select File monitoring to view FIM reports for Windows and Linux devices.
- Can we use FIM on file clusters?
Yes. You need to define SACLs on the File/Folder cluster.
- Is there any recommendation on what files/folders to audit using FIM?
EventLog Analyzer provides default FIM templates for Windows and Linux devices. These are the recommended drive locations that are to be audited.
- Can we audit copy paste activities of the user using this FIM Feature inside EventLog Analyzer?
EventLog Analyzer can audit paste activities of the user. Windows has no provision to audit çopy in copy-paste.
- Can we audit share drives using FIM?
Yes, share drives can be audited.
- Can we exclude/include the file types to be audited?
Yes, you can use Exclude Filter while configuring a device for FIM to exclude
- Certain file types.
- Certain sub-locations within the main location.
- All sub-locations within the main location.
- Can we edit the default FIM template?
A default FIM template cannot be edited. However, you can create copy the configuration into a new template and edit the same.
- Can we combine the capabilities of FIM with other security measures like user and entity behavior analytics (UEBA)?
This feature is currently unavailable.
- Can we configure FIM for multiple devices at one shot?
Yes, we have "Configure Multiple Devices" option. You can apply FIM templates across multiple devices.
Linux FIM
- Is Disabling SELinux necessary?
SELinux hinders the running of the audit process with an error message that reads 'Access restriction from SELinux'. Configure SELinux in permissive mode. Then reinstall the agent in EventLog Analyzer.
- Do we require a Root password? if yes, why?
No. Root password is not necessary, provided the user account has the required privileges.
- What does the audit do in specific upon installation?
Audit is a default service present in Linux machines. The file path added in EventLog Analyzer server for monitoring is provided to the audit service to enable tracking of changes made to the files. EventLog Analyzer uses this data to generate reports.
Configuration
Agent Configuration and Troubleshooting Issues
- What are the system requirements for Agent installation? Specify the port details.
As an agent is a lightweight process, there are no specific resource requirements. The port requirements for Linux agent and Windows remote agent are the same. 8400 (TCP) is the default web server port used by EventLog Analyzer with SSH (Default port - 22). Please refer to the prerequisites applicable for EventLog Analyzer to know more.
- What are the different ways by which agents can be deployed?
The different methods that can be used to deploy the EventLog Analyzer agent in a device are:
- Can I deploy the EventLog Analyzer agent on AWS platforms? If so, how do I perform the same?
Yes, the EventLog Analyzer agent can be installed on the AWS platform. Please refer to How to monitor logs from an Amazon Web Services (AWS) Windows instance
- Does encryption of logs take place during transit and at rest?
The logs are transmitted as a zip file which is secured with the help of passwords and encryption techniques such as AES algorithm in ECB mode, RSA algorithm and SHA256 integrity checksum.
Refer to the section Secure log collection in A guide to configure agents for log collection in EventLog Analyzer to know more.
- Can agents be deployed in bulk for various devices from the EventLog Analyzer console?
Yes, bulk installation of agents for multiple devices is possible. It can be done by navigating to Settings-> Admin Settings-> Manage Agents in the EventLog Analyzer console. Ensure that the credentials are the same and valid for all the selected devices.
- Can I deploy agents in the DMZ (demilitarized zone)?
From builds 12130, agents can be deployed in the DMZ. It will be upgraded automatically.
- Is it safe to open the port 8400 if agent is connected through the internet?
Yes it is safe. 8400 (TCP) is the default web server port used by EventLog Analyzer. For Linux devices, SSH (Default port - 22).
- Is there any example for the GPO Script parameters?
Example:
MsiExec.exe /i "C:\Users\rebekah-4143\Desktop\EventLogAgent.msi" /qn /norestart /L*v "C:\Users\test\Desktop\Agentlog.txt" SERVERNAME="rebek192" SERVERDBTYPE="mssql" SERVERIPADDRESS="214.1.2.197" SERVERPORT="8400" SERVERPROTOCOL="https" SERVERVERSION="12130" SERVERINSTDIR="D:\ManageEngine\EventLog Analyzer" ENABLESILENT=yes ALLUSERS=1.
For uninstallation,
MsiExec.exe /X{0546C27C-FAAB-457B-82AB-477D03288E94} /passive /norestart
- Can I store any logs in the agent machine? If yes, should I allocate disk space?
No, logs can be stored is in the the EventLog Analyzer server only.
- Will there be any notification when agent communication fails?
User Interface notifications will be sent if the agent goes down.You can also configure email notifications when log collection fails.
- How do I bulk update the credentials for all agents?
If all the agents are in the same Active directory domain, bulk updating the credentials in Settings -> Admin Settings -> Domains and Workgroups will work if the agents were initially added using the domain's credential.
- Is it possible for a user to stop the agent and prevent it from pushing logs from his machine?
Yes, the agent's service has to be stopped. Disabling the device in EventLog Analyzer will do same.
- Can I install Agent on the EventLog Analyzer server?
No, it is not required. There is log collector already present in the EventLog Analyzer server.
- Installing the agent from the console results in "Installation Failed | Network Path Not Found" How can I fix this?
The error "Network path not found" can be confirmed by using the same agent's credential to access the device's network share. If the required privileges are provided for the user to access the share, then this issue can be resolved.
- Recently upgraded my EventLog Analyzer server. However, the agent upgrade failed. What could be the possible reasons?
In recent builds, credentials need not be upgraded for new agents. However, if the agent is of an older version then the reason for upgrade failure may be due to incorrect credentials, or a role that does not have the privilege of agent installation.
- Device status of my windows machine where the agent runs says "Collector Down". What should be the course of action?
The agent's service might be running but the EventLog Analyzer server may not be reachable to the collector. Server details will be present in the agent machine:
- Windows[In registry, Computer\HKEY_LOCAL_MACHINE\SOFTWARE\WOW6432Node\ZOHO Corp\EventLogAnalyzer\ServerInfo ]
- Linux [In file, /opt/ManageEngine/EventLogAnalyzer_Agent/conf/serverDetails]
The server's details, port, and protocol information have to be rechecked here.
- Associated devices results in the error "Collector Down". What should be the course of action?
You need to verify the reachability of EventLog Analyzer server from the agent where the devices are associated.
- Ever since I upgraded EventLog Analyzer, agent communication has been failing. What should be the course of action?
For some versions along with EventLog Analyzer server's upgrade, it is essential for the agent to be upgraded. So you need to check the, Settings > Admin Settings > Manage Agent page to check if the upgrade has failed. The reason for the upgrade failure would be mentioned there. Correcting it and retrying it would fix the issue.
- Reinstalled the agents in one of my machines. The error "service is not running", "service status is unavailable" keeps popping up. What should be the course of action?
If the agent doesn't reach EventLog Analyzer for quite sometime [The time differs upon the sync interval set for agent], then this status is shown. So by ensuring that the EventLog Analyzer server is continuously reachable by the agent, this issue can be fixed.
- Status on the Linux agent console is "Listening for logs". However, no data can be found in the Reports. What should be the course of action?
Linux agent is deployed especially for file monitoring events. So if the agent's FIM logs have not been received, then the file events might not have been permitted by the audit service.
This has to be debugged in the audit service's logs.
- Unable to install the agent. The error "A DLL required for this install to complete. Could not be run" pops up. How can this issue be fixed?
If the agent's installation folder is deleted before it is deleted from the control panel, this error might occur. It can be fixed by copying the file regService.dll into C:\Program Files (x86)\EventLogAnalyzer_Agent
- Unable to start/stop the agent from collecting logs in the console. How can this issue be fixed?
To perform this operation, credentials with the privilege to access remote services are necessary. By providing credentials this issue can be fixed.
- Agent does not upgrade automatically. It can only be installed/uninstalled manually. How can this issue be fixed?
Prior to the EventLog Analyzer's 12120 version, if the credentials are not
updated for the agent then the agents will not get upgraded. They have to be manually managed.
With EventLog Analyzer's 12120 version's onwards, an auto upgrade process has been
installed which makes sure the agent is upgraded automatically when EventLog Analyzer is upgraded.
Configuration
Common issues while configuring and monitoring event logs from Windows devices
Problem #1: Event logs not getting collected.
Reason: Audit policies are not configured.
Solution: For each event to be logged by the Windows machine, audit policies have to be set. You can find the policies required for some of the reports here. [Audit Policy column]
Problem #2: Event log analysis based reports are empty.
Reason: Certain reports require configuring Access Control Lists (ACLs). Ensure that they are configured.
Solution: To do this, right click on the file/folder, registry key and select Properties -> Security -> Advanced -> Auditing, and set Auditing permission for the user.
Problem #3: Event log reports are empty.
Solution: Ensure that corresponding Windows device has been added to EventLog Analyzer for monitoring.
Problem #4: Event logs are missing.
Reason: At times, when the Windows device generates high volume of log data, there's a probability that your previous logs get overridden by the newly generated logs.
Solution: Set the monitoring interval accordingly to avoid overriding of logs.
Problem #5: Remote machine not reachable.
Solution: Test the reason as to why the remote machine isn't reachable using wbemtest. Report the reason to the support team for effective resolution.
Log Collection and Reporting
I've added a device, but EventLog Analyzer is not collecting event logs from it
Probable cause: The device machine is not reachable from the EventLog Analyzer server machine
Solution: Check if the device machine responds to a ping command. If it does not, then the machine is not reachable. The device machine has to be reachable from the EventLog Analyzer server in order to collect event logs.
Probable cause: You do not have administrative rights on the device machine
Solution: Edit the device's details, and enter the Administrator login credentials of the device machine. Click Verify Login to see if the login was successful.
Error Code 0x251C
Probable cause: The device was added when importing application logs associated with it. In this case, only the specified application logs are collected from the device, and the device type is listed as unknown.
Solution:
- Click on the update icon next to the device name.
- Select the appropriate device type.
- Provide any other required information for the selected device type.
- Click on update.
Log Collection and Reporting
I get an Access Denied error for a device when I click on "Verify Login" but I have given the correct login credentials
Probable cause: There may be other reasons for the Access Denied error.
Solution: Refer the Cause and Solution for the Error Code you got during Verify login.
Error Code 00x80070005
Scanning of the Windows workstation failed due to one of the following reasons:
- The login name and password provided for scanning is invalid in the workstation.
Solution: Check if the login name and password are entered correctly.
- Remote DCOM option is disabled in the remote workstation
Solution:
Check if Remote DCOM is enabled in the remote workstation. If not enabled, then enable the same in the following way:
- Select Start > Run.
- Type dcomcnfg in the text box and click OK.
- Select the Default Properties tab.
- Select the Enable Distributed COM in this machine checkbox.
- Click OK.
To enable DCOM on Windows XP devices:
Select Start > Run
- Type dcomcnfg in the text box and click OK
- Click on Component Services > Computers > My Computer
- Right-click and select Properties
- Select the Default Properties tab
- Select the Enable Distributed COM in this machine checkbox
- Click OK
- User account is invalid in the target machine.
Solution: Check if the user account is valid in the target machine by opening a command prompt and executing the following commands:
net use \ <RemoteComputerName> C$ /u: <DomainNameUserName> "<password>"
net use \ <RemoteComputerName> ADMIN$ /u: <DomainNameUserName> "<password>"
If these commands show any errors, the provided user account is not valid on the target machine.
Error Code 0x80041003
The user name provided for scanning does not have sufficient access privileges to perform the scanning operation. This user may not belong to the Administrator group for this device machine.
Solution: Move the user to the Administrator Group of the workstation or scan the machine using an administrator (preferably a Domain Administrator) account.
Error Code 0x800706ba
A firewall is configured on the remote computer. Such exceptions mostly occur in Windows XP (SP 2), when the default Windows firewall is enabled.
Solution:
- Disable the default Firewall in the Windows XP machine:
- Select Start > Run
- Type Firewall.cpl and click OK
- In the General tab, click Off
- Click OK
- If the firewall cannot be disabled, launch Remote Administration for administrators on the remote machine by executing the following command:
netsh firewall set service RemoteAdmin After scanning, you can disable Remote Administration using the following command: netsh firewall set service RemoteAdmin disable
Error Code 0x80040154
- WMI is not available in the remote windows workstation. This happens in Windows NT. Such error codes might also occur in higher versions of Windows if the WMI Components are not registered properly.
Solution: Install WMI core in the remote workstation.
- WMI Components are not registered.
Solution: Register the WMI DLL files by executing the following command in the command prompt:
winmgmt /RegServer
Error Code 0x80080005
There is some internal execution failure in the WMI service (winmgmt.exe) running in the device machine. The last update of the WMI Repository in that workstation could have failed.
Solution:
Restart the WMI Service in the remote workstation:
- Select Start > Run
- Type Services.msc and click OK
- In the Services window that opens, select Windows Management Instrumentation service.
- Right-click and select Restart
For any other error codes, refer the MSDN knowledge base.
Log Collection and Reporting
I have added an Custom alert profile and enabled it. But the alert is not generated in EventLog Analyzer even though the event has occured in the device machine
Probable cause: The alert criteria have not been defined properly
Solution: Please ensure that the required fields in the Add Alert Profile screen have been given properly.Check if the e-mail address provided is correct. Ensure that the Mail server has been configured correctly.
Log Collection and Reporting
When I create a Custom Report, I am not getting the report with the configured message in the Message Filter
Probable cause: The message filters have not been defined properly
Solution: When you are entering the string in the Message Filters for matching with the log message, ensure you copy/enter the exact string as shown in the Windows Event Viewer.
e.g., Logon Name:John
Log Collection and Reporting
MS SQL server for EventLog Analyzer stopped
Probable cause: The transaction logs of MS SQL could be full
Solution: If the EventLog Analyzer MS SQL database transaction logs are full, shrink the same with the procedure given below:
- Stop the Eventlog Analyzer Server/Service (Check the Eventlog Analyzer server machine's Task Manager to ensure that the processes 'SysEvtCol.exe', 'Java.exe' are not running).
- Connect MS SQL client (using Microsoft SQL Server Management Studio) and execute the below query:
sp_dboption 'eventlog', 'trunc. log on chkpt.', 'true'
To execute the query, select and highlight the above command and press F5 key.
- After executing the above command, select and highlight the below command and press F5 key to execute it.
DBCC SHRINKDATABASE (eventlog)
- Note: This process will take some time, based on the EventLog Analyzer database size.
- Start the Eventlog Analyzer.
Log Collection and Reporting
I successfully configured Oracle device(s), still cannot view the data
If Oracle device is Windows, open Event viewer in that machine and check for Oracle source logs under Application type. If Linux, check the appropriate log file to which you are writing Oracle logs. If the Oracle logs are available in the specified file, still EventLog Analyzer is not collecting the logs, contact EventLog Analyzer Support.
The user name provided for scanning does not have sufficient access privileges to perform the scanning operation. Probably, this user does not belong to the Administrator group for this device machine
Log Collection and Reporting
The Syslog host is not added automatically to EventLog Analyzer/the Syslog reception has suddenly stopped
Check EventLog Analyzer's live Syslog Viewer for incoming Syslog packets.
If you are able to view the logs, it means that the packets are reaching the machine, but not to EventLog Analyzer. You need to check your Windows firewall or Linux IP tables.
If you are not able to view the logs in the Syslog viewer, then check if the EventLog Analyzer server is reachable. This can be done in the following ways:
- Ping the server.
- For TCP, you can try the command telnet <ela_server_name> <port_no> where 514 is the default TCP port.
- tcpdump
tcpdump -n dst <ela_server_name> and dst port <port_no>
If reachable, it means there was some issue with the configuration. If not reachable, then you are facing a network issue.
Log Collection and Reporting
Why don't my reports show data?
Sometimes reports in EventLog Analyzer reporting console may not have any data. This could be mostly because the period specified in the calendar column, will not have any data or is incorrectly specified. So before proceeding for the troubleshooting tips, ensure that you'd specified the correct time period and logs are available for that period.
Some of the other common reasons as to why this happens for Windows and syslog devices are listed below..
For Windows devices
- The device does not have the applications related to the report. For example, the reports on Removable disk auditing and Hyper-V VM management are populated only if removable storage devices or virtual machines are in use.
- Audit policies are not set.
- Ensure that the appropriate audit policies for auditing registry changes in your AD environment are configured. (See how).
- System Access Control Lists (SACLs) are not set on file/folder objects.
- Right-click on the file, folder or registry key.
- Select Properties > Security > Advanced > Auditing.
- Set the required permissions.
- The log source is not added for log collection.
- The generated reports are being overwritten by the logs.
- The monitoring interval for EventLog Analyzer is 10 minutes by default. If the volume of incoming logs is high, the time interval needs to be changed.
- Go to eventvwr.msc. Select Windows logs.
- Set the logtype and check the time interval between first and last logs.
- Right-click logtype and change the log size.
For syslog devices
If the reports for syslog devices are not populated with data, please check for the below reasons.
- The event is not triggered.
- Trigger the report event and wait for a few minutes.
- Search for the event in the search tab of EventLog Analyzer.
- Logs are not received by EventLog Analyzer from the device:
- Go to Log receiver.
- Check if the syslog device is sending logs to EventLog Analyzer.
- Logs for the report are not properly parsed.
If the above mentioned reasons are found to be true, please contact EventLog Analyzer technical support for further assistance.
Log Collection and Reporting
Why are certain fields not getting populated in the reports?
In some reports, all fields may not get populated as EventLog Analyzer only parses certain data for improved efficiency. If required, you can extract new fields using the custom log parser, and also create custom reports. Also, some fields may remain blank in the reports if the information is unavailable in the collected log data.
When a Windows machine undergoes an upgrade, the format of the log may have changed. This can also result in missing field information in the reports. If this is the case, please contact EventLog Analyzer customer support.
Log Collection and Reporting
Why am I getting the "Log collection down for syslog devices" notification?
This notification may occur when EventLog Analyzer does not receive logs from the configured devices.
To troubleshoot, go to Log Receiver in the EventLog Analyzer dashboard and verify that your machine is receiving log data from the specific syslog device.
In case no logs are being received from the syslog device, please check for the following issues:
- The device is not configured to send syslogs (see how to configure a device to send syslogs).
- The device is down.
- No logs are being produced from the device.
- Insufficient firewall permissions.
- Network issues.
In case the Log Receiver does receive the logs but the notification "Log collection down for syslog devices," is shown, please contact EventLog Ananlyzer technical support.
EventLog Analyzer agent management
If you have trouble installing the agent using the EventLog Analyzer console, GPOs or software installation tools, you can try to install the agent manually. Here the the steps for manual agent installation.
Error messages while adding STIX/TAXII servers to EventLog Analyzer
This feature has been disabled for Online Demo!
This error message pops up when the feature you tried to use is not available in the online demo version of EventLog Analyzer. To try out that feature, download the free version of EventLog Analyzer.
Error messages while adding STIX/TAXII servers to EventLog Analyzer
Connection failed. Please try configuring proxy server.
This error message can be caused because of different reasons. It might be due to network issues, proxy related issues, bad requests in the network, or if the URL is unable to locate a STIX/TAXII server.
Error messages while adding STIX/TAXII servers to EventLog Analyzer
Failed to connect to the URL.
This error message denotes that the URL entered is malformed.
Error messages while adding STIX/TAXII servers to EventLog Analyzer
Authorization failed.
This error message signifies that the credentials entered are wrong.
SSL Troubleshooting steps
Certificate name mismatch.
Description:
This error occurs when the common name of the SSL Certificate doesn't exactly match the hostname of the server in which the EventLog Analyzer is installed.
Solution:
Please get a new SSL certificate for the current hostname of the server in which EventLog Analyzer is installed.
SSL Troubleshooting steps
Invalid Certificate
Description:
This error occurs when the SSL certificate you have configured with EventLog Analyzer is invalid. A certificate can become invalid if it has expired or other reasons.
Solution:
Please configure EvnetLog analyzer to use a valid SSL certificate.
Threat Intelligence Troubleshooting Tips
IP Geolocation data store corruption
This may happen when the product is shutdowns while the data store is updating and there is no backup available.
Troubleshooting steps:
- This is a rare scenario and it happens only when the product shuts down abruptly during the first ever download of IP geolocation data.
- There is no need for a troubleshoot as EventLog Analyzer will automatically download the data in the next schedule. Please note that the IP geolocation data gets automatically updated daily at 21:00 hours.
Threat Intelligence Troubleshooting Tips
IP Geolocation data update failure
This occurs when there is no internet connection on EventLog Analyzer server or if the server is unreachable.
Troubleshooting steps:
- Make sure you have a working internet connection.
- Whitelist https://creator.zoho.com in your firewall.
Alerts
Why is my alert profile not getting triggered?
Probable cause 1: Alert criteria might not be defined properly.
Solution: If the alert criteria isn't defined properly, then the notification might not be triggered. To cross-check your alert criteria, you can copy the condition and paste it in the Search box and check if you're getting results.
Probable cause 2: Log Files present in <ELA_Home>\data\AlertDump.
Solution: Check if there are any files present in the folder <ELA_Home>\data\AlertDump. These log files are yet to be processed by the alert engine. If there are any files, please wait for it to be cleared. If the files are piling up, kindly contact the support team.
Alerts
Why am I not receiving my alert notifications?
With EventLog Analyzer, you can receive notifications for alerts and correlation over email or SMS. When you don't receive notifications, please check if you configured your mail and SMS server properly. To do this, navigate to the Settings tab > System Settings > Notification Settings.
Check the details you had provided for both Mail and SMS settings. After checking and reconfiguring the servers, check if you are able to receive the Test mail/SMS from the product by providing your email ID/mobile number in the corresponding text fields and clicking Send.
If the provided details in both Mail and SMS Settings pages are correct and if you are still facing issues in receiving notifications, the problem could be with your SMTP server or SMS modem. Please contact your SMTP/SMS service provider to address the issue.
Syslog Troubleshooting Tips
This page describes the common troubleshooting steps to be taken by the user for syslog devices.
Step 1: Check the configuration of the devices
Check if the syslog device is configured correctly. Please refer to Adding Devices to find out how to add Syslog Devices and to configure Syslog on different devices.
Step 2: Check if the logs are displayed in Syslog Viewer and Wireshark
Simulate and forward logs from the device to the EventLog Analyzer server. If the logs are received by EventLog Analyzer, they will be displayed in syslog viewer.
Case 1: Logs are not displayed in syslog viewer:
If you are not able to view the logs in syslog viewer, install Wireshark in your EventLog Analyzer server and check if you can view the forwarded logs in Wireshark.
Case 2: Logs are not displayed in syslog viewer and Wireshark:
If you are not able to view the logs in syslog viewer and Wireshark, there could be a problem with the syslog device configuration. Kindly check if the devices have been configured correctly (check step 1).
Case 3: Logs are displayed in Wireshark but cannot be viewed in syslog viewer:
If you are able to view the logs in Wireshark but you are not able to view them in syslog viewer, kindly contact the EventLog Analyzer support team.
Case 4: Logs are displayed in syslog viewer and Wireshark:
If you are able to view the logs in syslog viewer and Wireshark but the logs aren't displayed in EventLog Analyzer, go to step 3.
Step 3: Check the SysEvtCol listening port and Firewall status
In your windows machine (the one in which EventLog Analyzer has been installed), go to the search bar located in your task bar and type Resource Monitor. Open Resource monitor. Go to Network -> Listening Ports. Check if SysEvtCol.exe is running in the syslog configured port (port number: 513/514).
If SysEvtCol.exe is running, check its firewall status column. If the status is 'Not allowed', firewall rules have to be modified. Open Windows Defender Firewall with Advanced Security in your windows machine and add an inbound rule (port number: 513/514 and protocol: UDP/TCP) to allow the incoming logs. Check the firewall status again.
Note:
- If the firewall rule has been added and the logs are still not coming, disable the firewall and check again. Incorrect configuration could be a problem.
- Ensure that the EventLog Analyzer server and the log source are in the same network and that the forwarded logs could not be blocked by firewall.
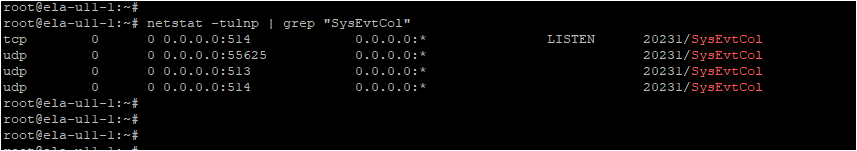
In Linux , use the command netstat -tulnp | grep "SysEvtCol" to check the Listening status.
Step 4: Check the Log Collection Filter
Check if any log collection filter has been enabled in EventLog Analyzer. The required logs might have been filtered by the log collection filter. Modify or disable the log collection filter and try again.

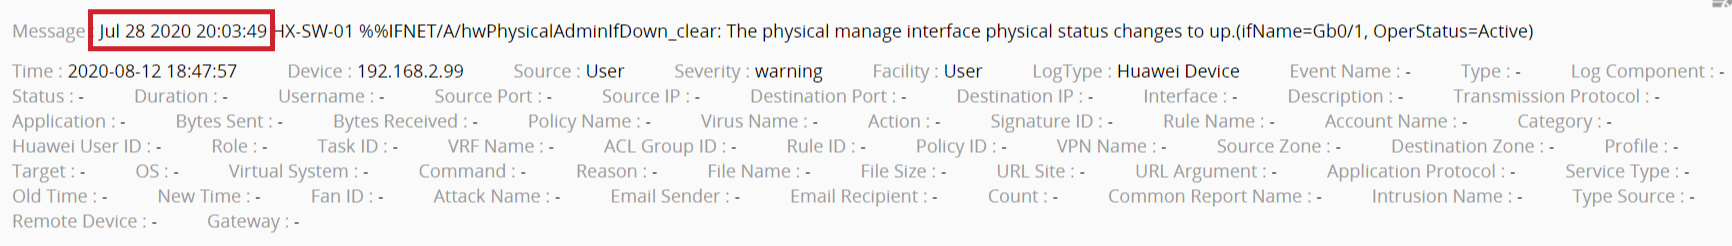 Unparsed log
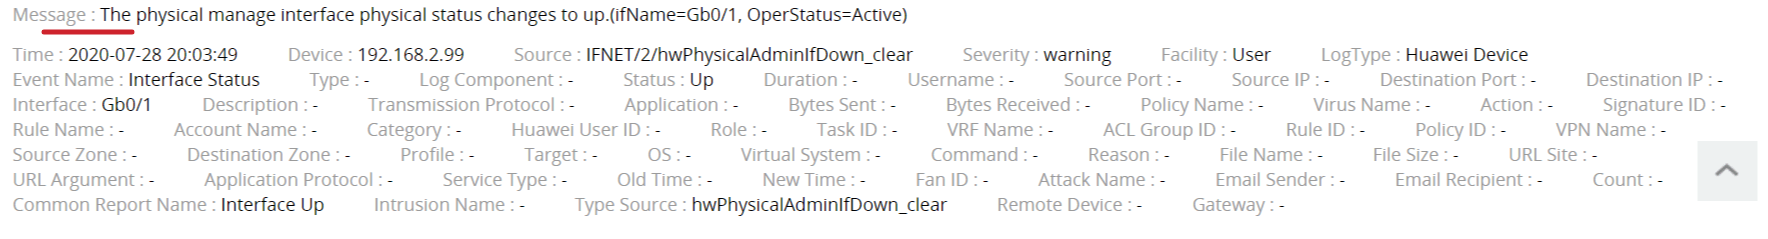 Parsed log