VoIP monitoring with ManageEngine OpManager
- Monitor VoIP packet loss, round-trip time, latency, jitter, and MOS
- Set SLA terms for VoIP call path availability and quality
- Get alerted via email, SMS, chat services, and help desk solutions
VoIP monitoring in OpManager
OpManager is a network monitoring software with powerful VoIP monitoring capabilities. OpManager uses Cisco's IP SLA (IP service level agreement) technology to simulate VoIP calls and monitor metrics like latency, jitter, round-trip time and Mean Opinion Score (MOS). If any deviations are detected, you'll get instant alarms. By monitoring simulated VoIP paths, you can detect call quality issues before it impacts users.
OpManager's WAN management capabilities
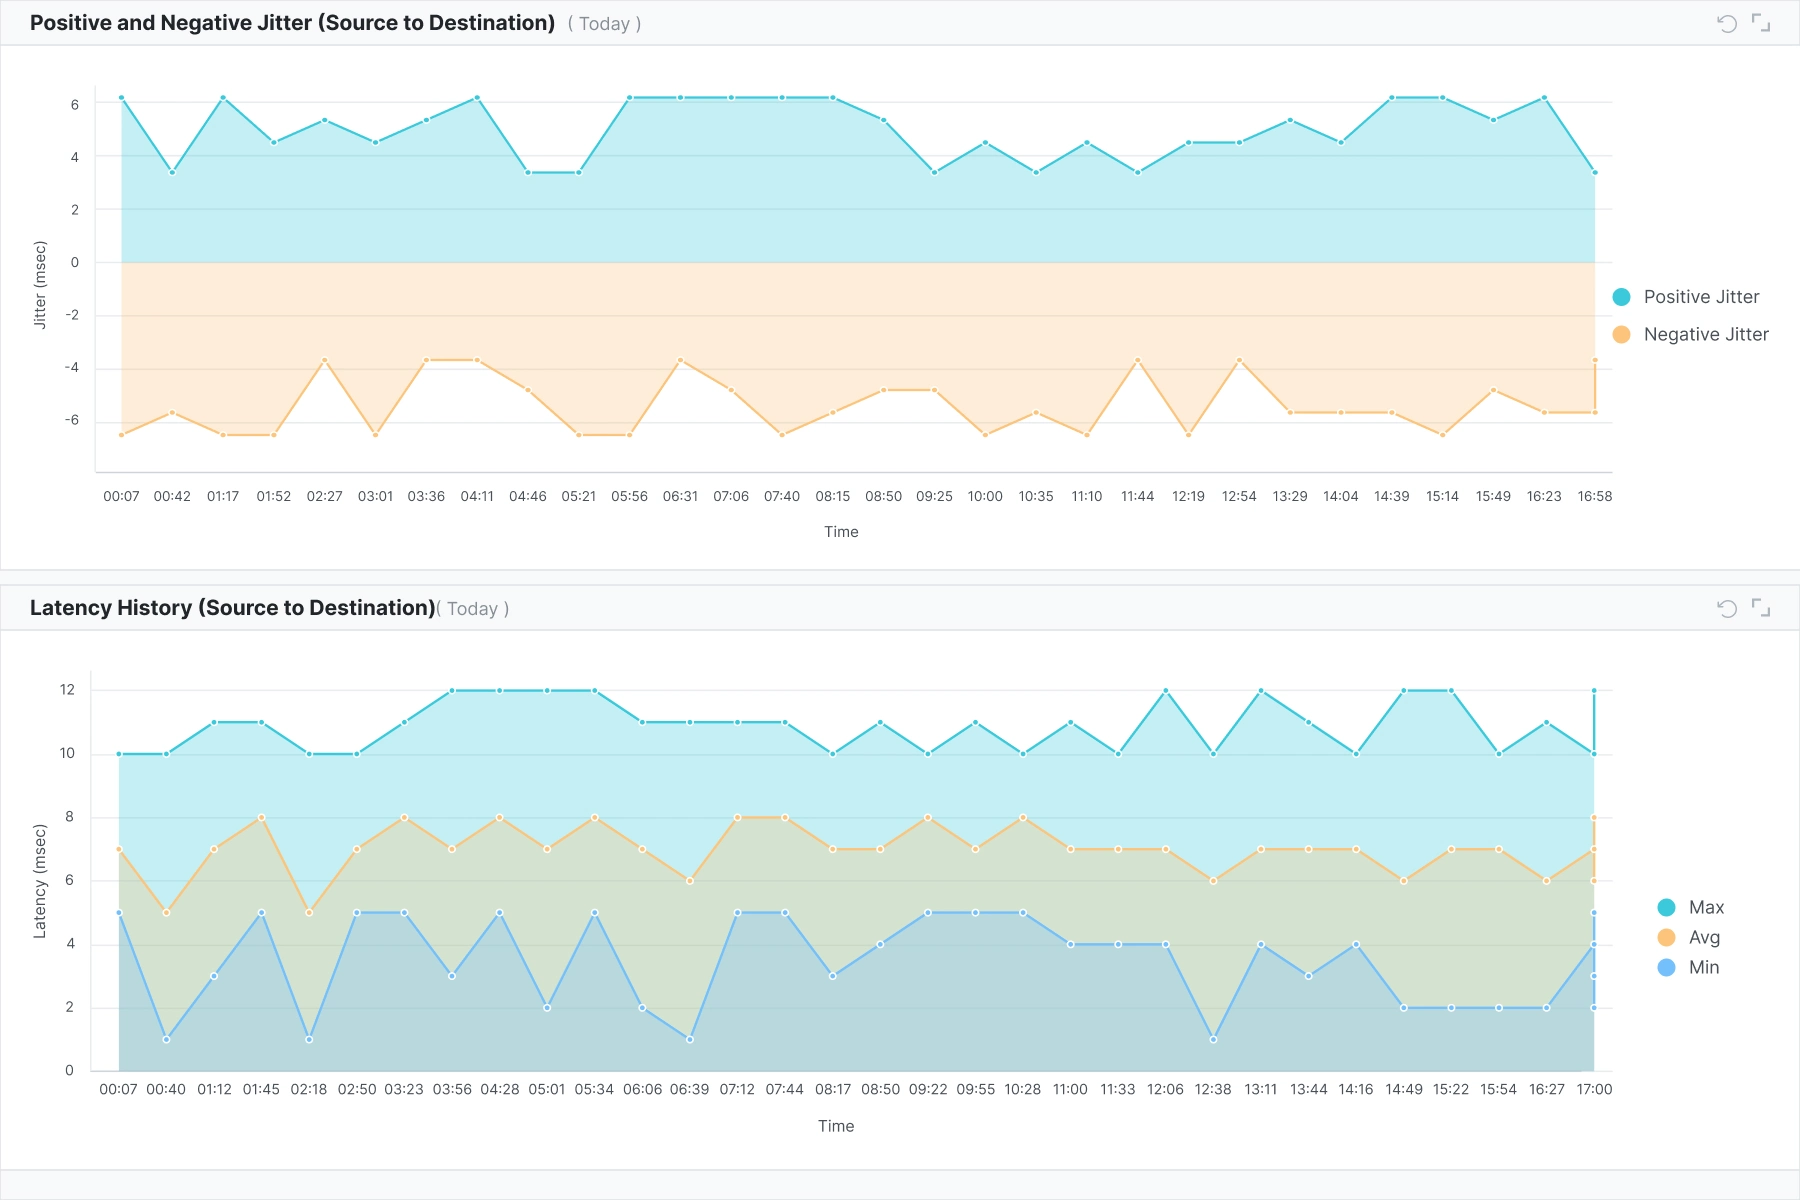
Monitor VoIP uptime, jitter, and latency
- Track VoIP call uptime and performance by tracking jitter, latency, packet loss, and round-trip time.
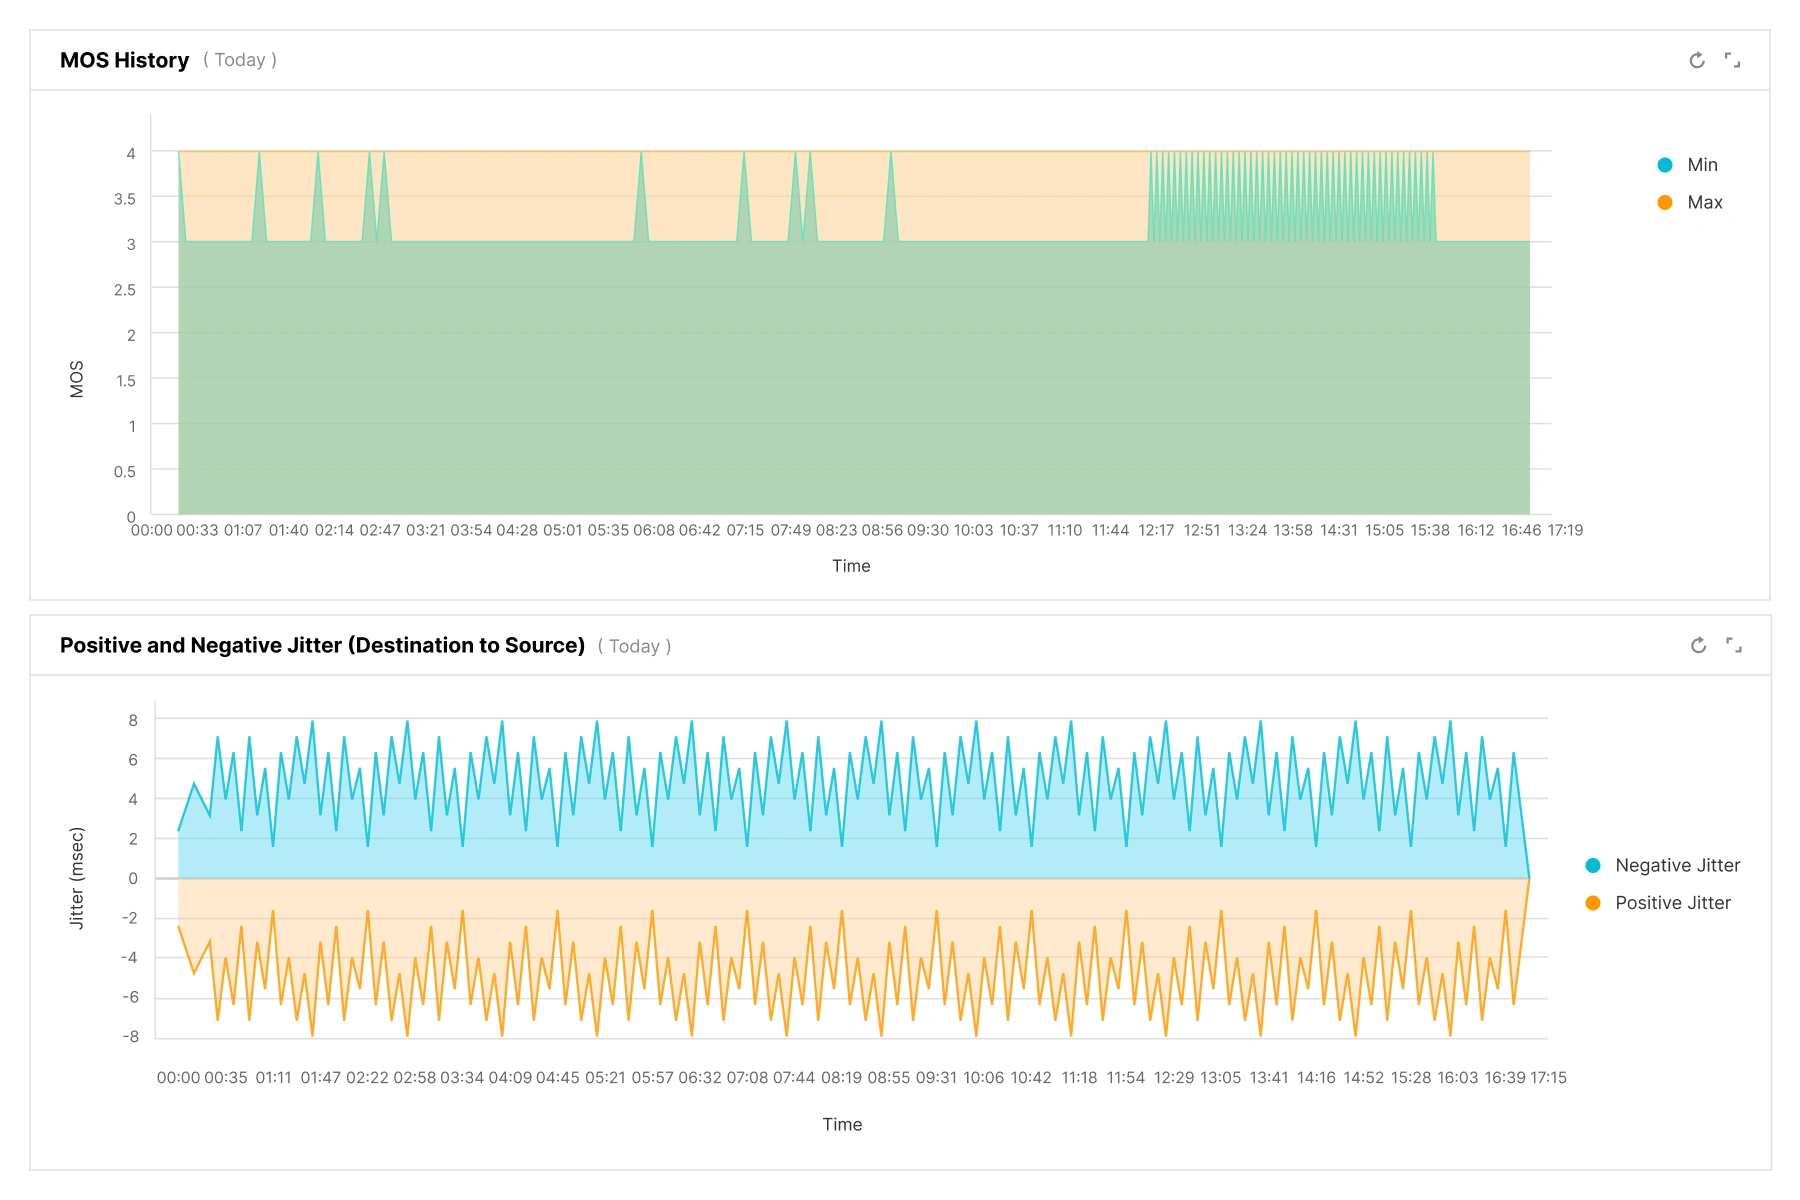
- Measure VoIP performance from the source to destination and from the destination to the source to identify exactly where the issue is.
- Set SLA terms for VoIP call metrics to identify violations instantly.
Monitor MOS (mean opinion scores) to ensure call quality
- OpManager helps maintain a high Mean Opinion Score (MOS), the industry standard for perceived call quality.
- Keep tabs on minimum and maximum MOS scores to identify moments of dipping call quality.
- Configure SLA limits for VoIP call quality metrics to detect VoIP call quality issues proactively.
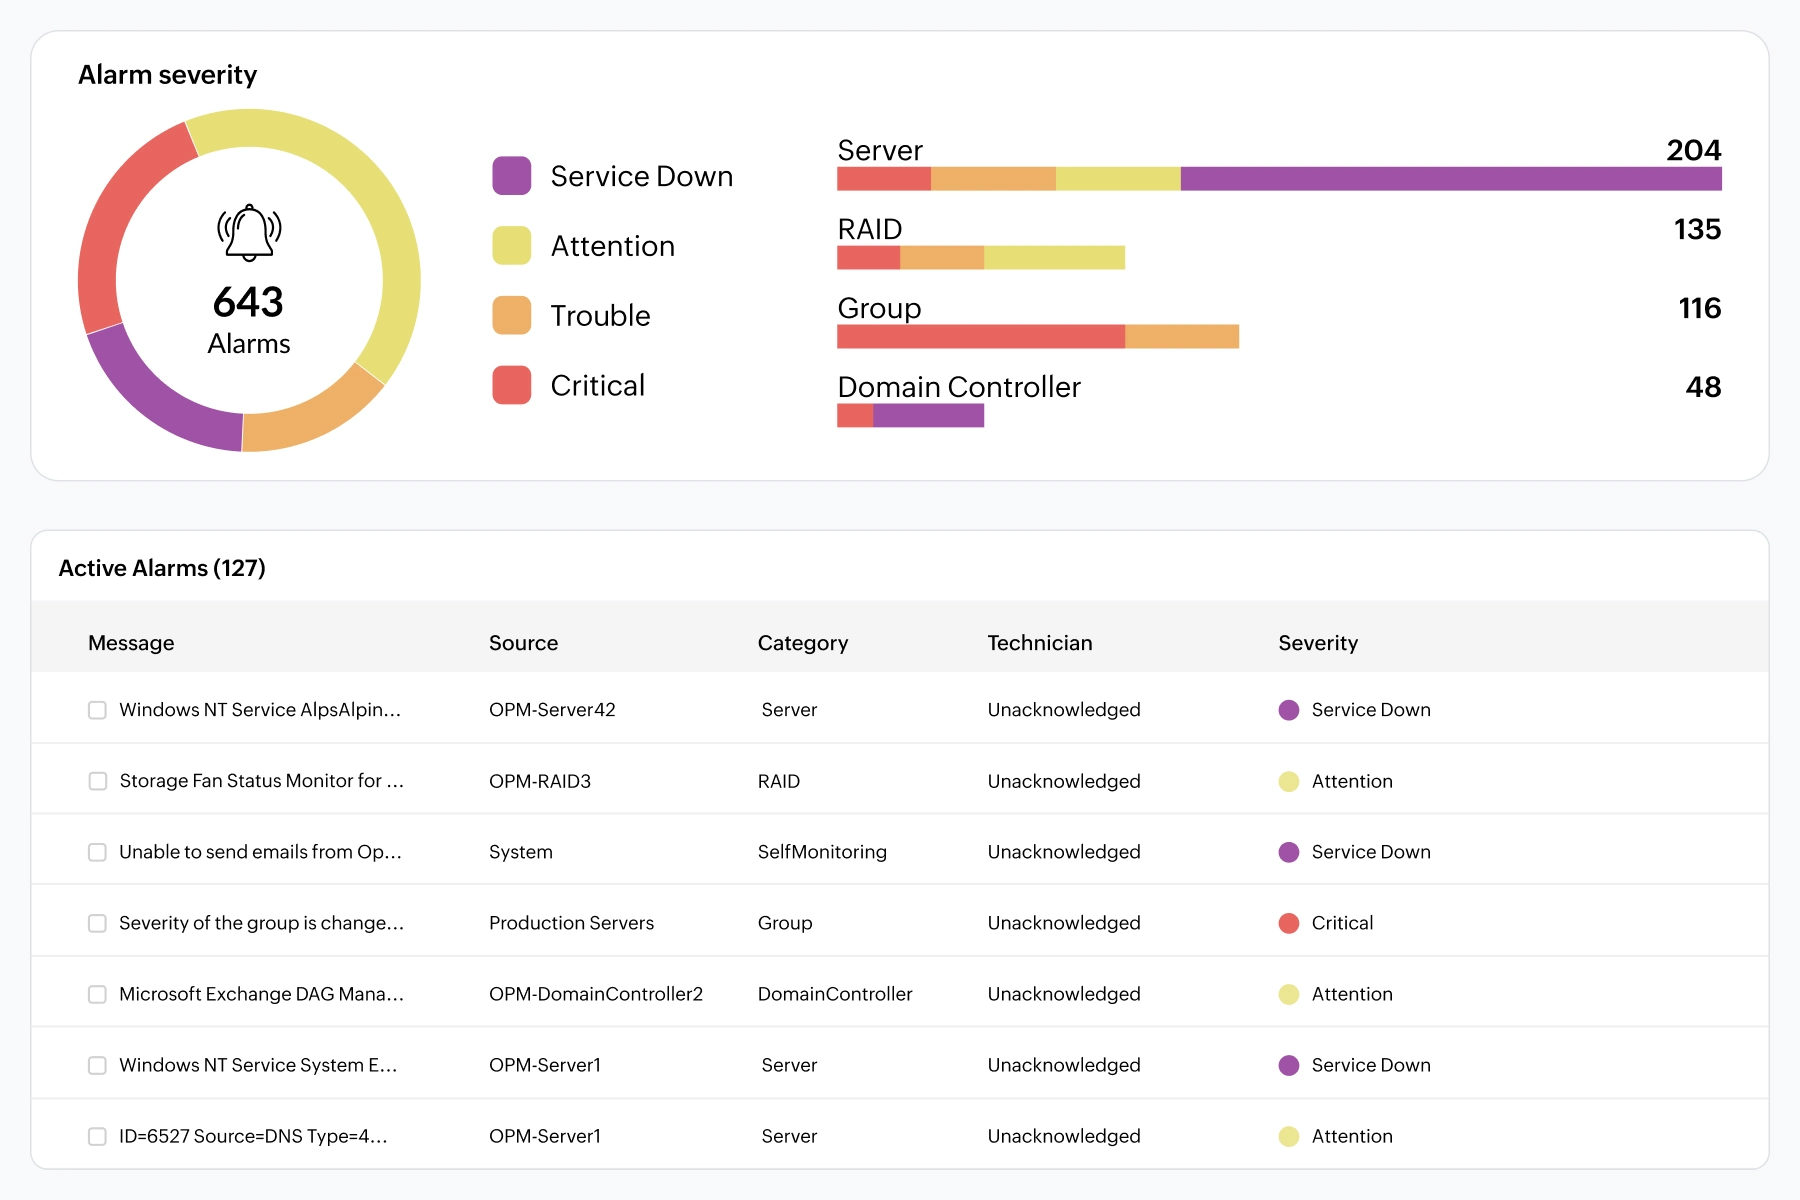
Get alerts for VoIP issues
- OpManager generates context-rich alerts detailing the nature of the VoIP issue and with visual graphs for key VoIP performance metrics.
- You can set up notifications via email, SMS, and webhooks, as well as through chat apps like Slack and Teams.
- You can also auto-generate VoIP issues as tickets in help desk tools like ServiceDesk Plus, ServiceNow, and Jira.
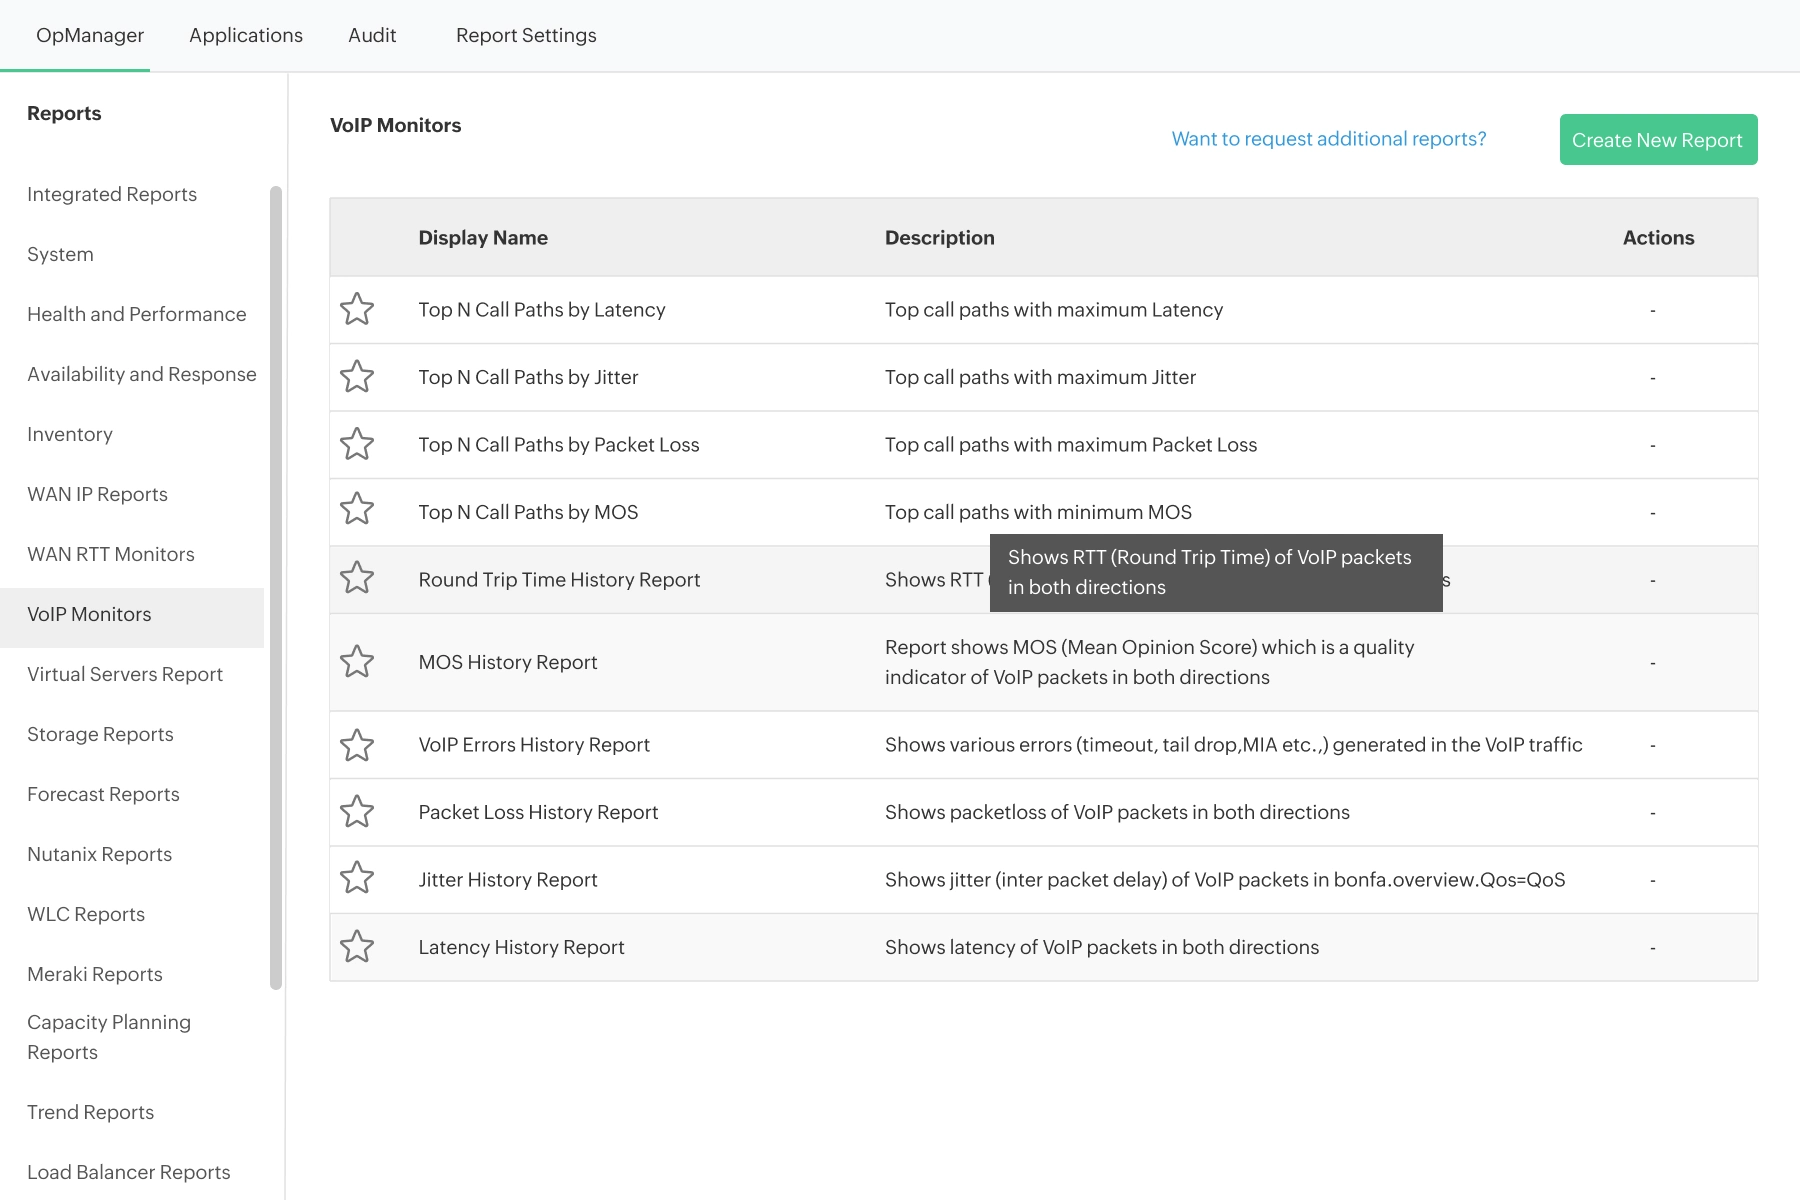
VoIP monitoring dashboards and reports
- OpManager comes with dedicated VoIP monitoring dashboards where you can see critical call paths and their performance.
- You can review 10 dedicated VoIP reports that highlight everything from error trends to historical data such as Jitter History, Latency History, and more.
- You can also create custom dashboards and reports to track VoIP performance.
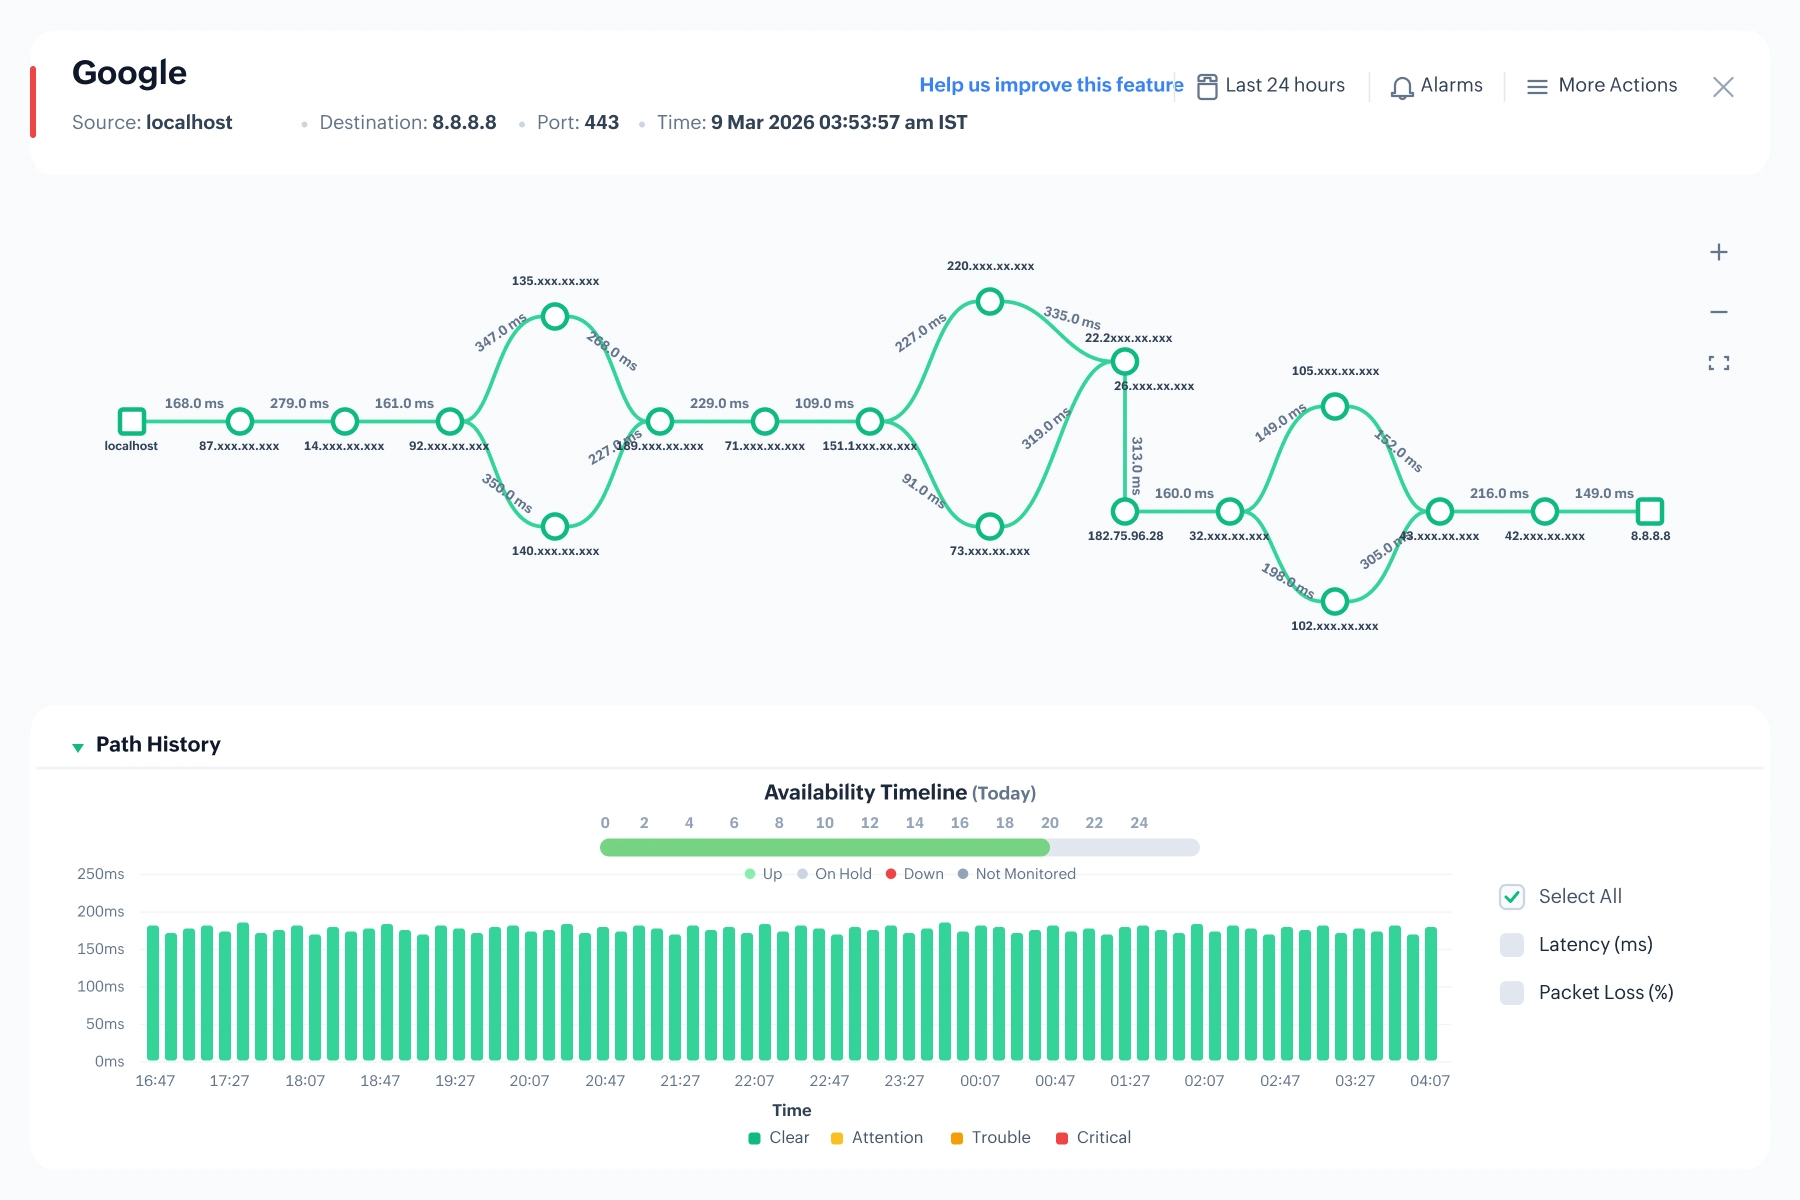
Network path analysis
- When VoIP issues arise, OpManager's network path analysis helps you narrow it down to the exact node in the network path.
- Visualize the route taken by the network packets from the source to the destination and monitor the packet loss and response time for each hop.
- Investigate whether VoIP issues are within your network or in the ISP lines.
Why choose OpManager as your VoIP monitor?
VoIP performance visualization
Get in-depth visibility into VoIP performance with colour-coded graphs. Review call quality issues to identify SLA violations.
Proactive, synthetic monitoring
OpManager helps you Identify potential bottlenecks as and when they arise, not after your users complain
Network path visibility
Set SLA terms for WAN round-trip time (RTT) and visualize hop-by-hop network path performance to bolster VoIP monitoring.
SLA-based monitoring
OpManager's multi-channel notifications ensure that you stay aware of VoIP SLA violations, no matter where you are.
FAQs on VoIP monitoring
Resources to dig deeper
The technical playbook for deploying agentic AI in production ITOps
From alerts to action: How agentic AI will change your ITOps
Download Whitepaper→